Article

An Analysis of Factors Affecting the Severity of Cycling Crashes Using Binary Regression Model

Department of Transportation Engineering and Economics, Faculty of Transportation Engineering and Vehicle, Engineering, Budapest University of Technology and Economics, 1111 Budapest, Hungary
*
Author to whom correspondence should be addressed.
Sustainability 2021, 13(12), 6945; https://doi.org/10.3390/su13126945
Submission received: 10 May 2021 / Revised: 12 June 2021 / Accepted: 17 June 2021 / Published: 21 June 2021
(This article belongs to the Special Issue Energy and Information Management in Sustainable Transportation)

Abstract

:
The increasing use of bicycles rises the interest in investigating the safety aspects of daily commuting. In this investigation, more than 14,000 cyclists’ injuries were analyzed to determine the relationship between severity, road infrastructure characteristics, and surface conditions using binary regression. Minor and major severity categories were distinguished. A binary equation consists of 28 factors is extracted. It has been found that each factor related to roadway characteristics has its negative and positive impacts on cyclist severity such as traffic control, location type, topography, and roadway divisions. Regarding the road surface components, good, paved, and marked roads are associated with a higher probability of major injuries due to the expected greater frequencies of cyclists on roads with good conditions. In conclusion, probabilities of major injuries are higher in urban areas, higher speed limits, signalized intersections, inclined topographies, one-way roads, and during the daytime which require more attention and better considerations.

1. Introduction

Cycling is one of the keys to sustainable mobility because of its benefits such as zero-emission, low land use, and positive effect on overall health. Accordingly, several European governments support cycling through infrastructure development and legislation [1]. Consequently, the volume of cycling traffic is higher than ever in Europe. In Hungary, 70% of commuters use at least bikes once a week and almost one-quarter of them considers the bike as the main daily travel mode [2]. According to the results of a questionnaire that asked people about their choice on typical days, 22% of mobility users prefer bikes over any other mode [3]. The increasing rate of bike use results in safety issues as the number of bicycle deaths increased from 6% to 8% in Europe during the last decade [4].
Specifically, Hungary is among the top three countries with respect to cyclist mortality rates with 8 deaths per million inhabitants [5]. European Road Safety Observatory reported that European cyclist fatalities were 9%, while cyclist fatalities in Hungary reached 13% through all mobility modes [6]. These indicators raise the need for the evaluation of cyclist crashes.
This research focuses on the analysis of more than 14,000 cyclist injuries between 2011 and 2014 in Hungary, as major cycling injuries rates per million with respect to population was significant throughout European countries [7]. The main contribution in the research is to estimate the probability among severity levels of a cyclist injury based on roadway characteristics and road surface conditions using a binary logistic model. Moreover, this study is based on data covering the Hungarian road network which contributes to the literature as one of the largest datasets used in this regard.
The structure of the paper is as follows: After a brief literature review in Section 2, detailed steps of the methodology can be found in Section 3. The description of data attributes is shown in Section 4. Results of the model, factors, and verification are presented in Section 5 as well as explanations and comparisons that were conducted. Finally, conclusions are drawn and future research trends are identified.

2. Literature Review
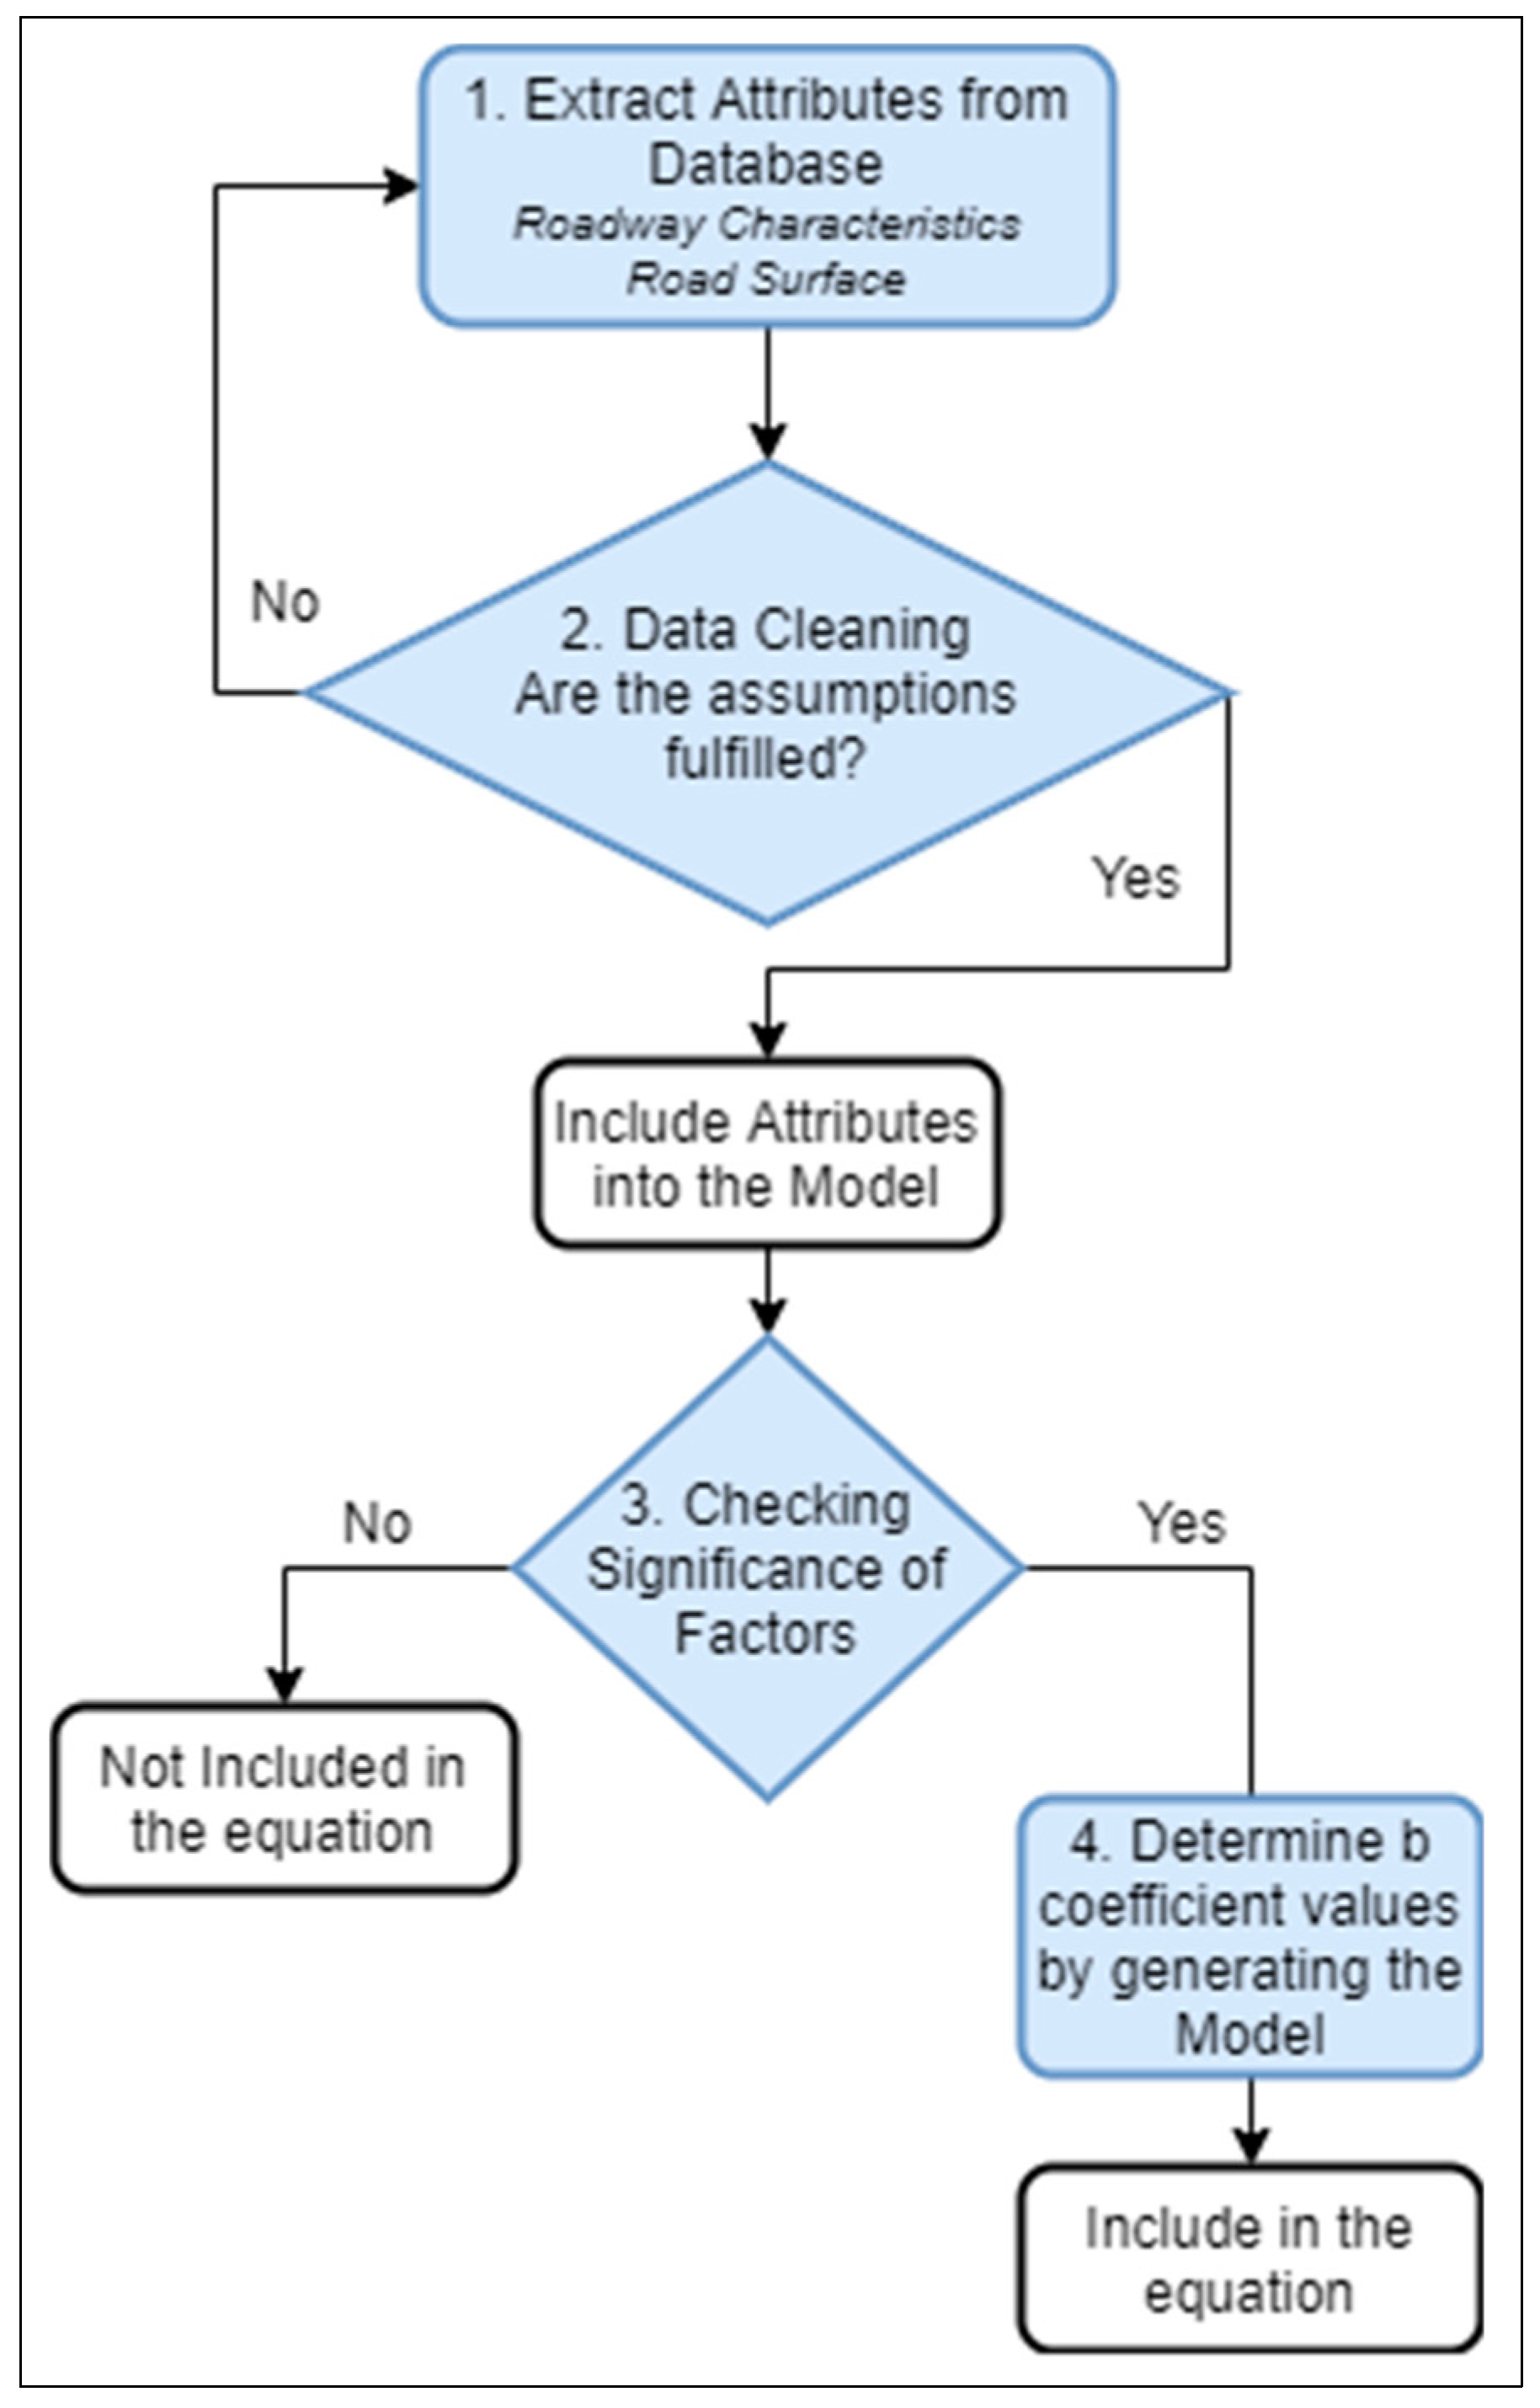
Previous studies investigated the effect of the environment, traveler behavior, geometry, land, and the reaction of cyclists involved in bike crashes. In general, historical data, questionnaires, and surveys were used and experimental tests were conducted. Studies are either limited to a specific location, such as public transportation stops and intersections, socio-demographic attributes, or road characteristics. On the other hand, measurements were investigated to find the safety precautions for using helmets and the precautions related to the speed of bicycles.
In papers that focused on a specific location, comparisons among critical events and normal situations were made. Intersections, road surface, and the existence of pedestrians were found to be the main factors that affect crash severity. Volume and occurrence were studied by using simultaneous Bayesian framework [8] but were limited to signalized intersections. Legged intersections, land use, employment, presence of bus stops, and length of crosswalks were investigated together to estimate the risk. The same approach was studied in Beijing, China. It was found that higher speed and flow possess greater risk [9]. Since statistics are not available continuously, a study in 2008 focused on the perceived risk in explicit circumstances [10]. Limited to roundabouts, the interaction between cyclists and traffic regulations was studied in Denmark. Continuing with surveys and limited to risk at signalized intersections, a recent publication used a binary logistic regression model to identify the relationship between crossing behavior and violations in Nantong, China [11]. Selected variables were examined such as red light running, length of pedestrian crossing, and site type. Limited to bus stops, Xingchen and colleagues found that the control of cyclists’ crossing time should be implemented to improve the level of cycle path safety [12]. With respect to parking considerations, it was found that the number of cyclist open vehicle door crashes was increasing [13] using statistical frequencies.
Several studies investigated the effect of road characteristics on cyclist safety. For instance, a study investigated how cycling safety can benefit from a naturalistic approach based on 16 users to estimate the risk [14]. This was a response to the cycling concerns through a study conducted in Europe [15]. Regression analysis was used to find the positive and negative effects on cyclist activities. Research in Switzerland compared e-bikers and regular users and found no difference in the severity of crashes [16]. Similarly, the severity of cyclist injuries and behavior were considered to test the use of safety equipment, traffic light violation, and roadway characteristics [17]. Multiple regression was applied and independent variables in univariate and multivariate models were analyzed. A multinomial logit model was conducted to explore the features that have an impact on the injury severity of cyclists in [18]. Four outcomes of severity were predicted through the model. Weather, visibility, time, speed, vehicles involving, and age were the inputs. Another research examined the relationships between built environment factors at the traffic analysis zone level using hierarchal Bayesian estimation [19].
Socio-demographic attributes and road designs were linked with cyclists’ crashes [20,21]. Similarly, a study in Australia found that age, gender, socioeconomic status, alcohol percentages, helmet usage, road type, speed limit, infrastructure, and temporal conditions have the highest impact on cyclist injury severity [22]. Findings directed the need for the enforcement of safety precautions equipment, separation of bicycle paths, and better lighting in curved sections. In Spain, one of the largest studies used 13,540 records of injuries [23]. After analysis with quasi-induced exposure approach, results showed that alcohol and drugs results in more risk and collisions between bikes and mopeds and these collisions are more severe compared to bikes with passenger cars. Seven European cities were included in the prospective cohort study [24]. The large variation in injury severity indicated that cyclists’ safety can still be improved. Variables of intoxication, helmet use, infrastructure, and conflicts relating to both bicycles and vehicles movement were studied using the generalized ordered logit model in [25]. Fragility (children under 10 years old and elderly cyclists over 60 years of age), alcohol percentage, car speed above 80 kilometers per hour, and wet road surfaces were the main key factors of cyclist risk. Recently, a generalized event count model was established to estimate the bicycle–vehicle conflict. Cyclists’ perceived risk was assessed by utilizing questionnaire analysis [26]. Results showed that bikers tend to misestimate risk at certain locations, such as at bus stops and subway stations.
In Hungary, frequency analysis was conducted to compare car–pedestrian crashes with car–cyclist ones [27]. The results may be used to improve the software and hardware of the on-board-system of cars. Recently, researchers revealed bikers could use personalized information on safety for better routing [28]. Otherwise, a clear gap in the region is noted for the understanding of cycling and its relevant risk factors. It was noted that studies are based on testing samples and surveys rather than historical data.
The current literature lacks comprehensive investigation of factors affecting cyclist crashes based on a large volume of historical data, which is identified as a research gap. In this research, more than 14,000 injury records are studied to investigate the impact of road characteristics and surface conditions on cyclists’ crashes severity, which is the main novelty.

3. Methodology

A cyclist injury severity model was elaborated by applying a binary regression model. The model supports determining the effect of factors on injury severity.
Two severity categories were distinguished:
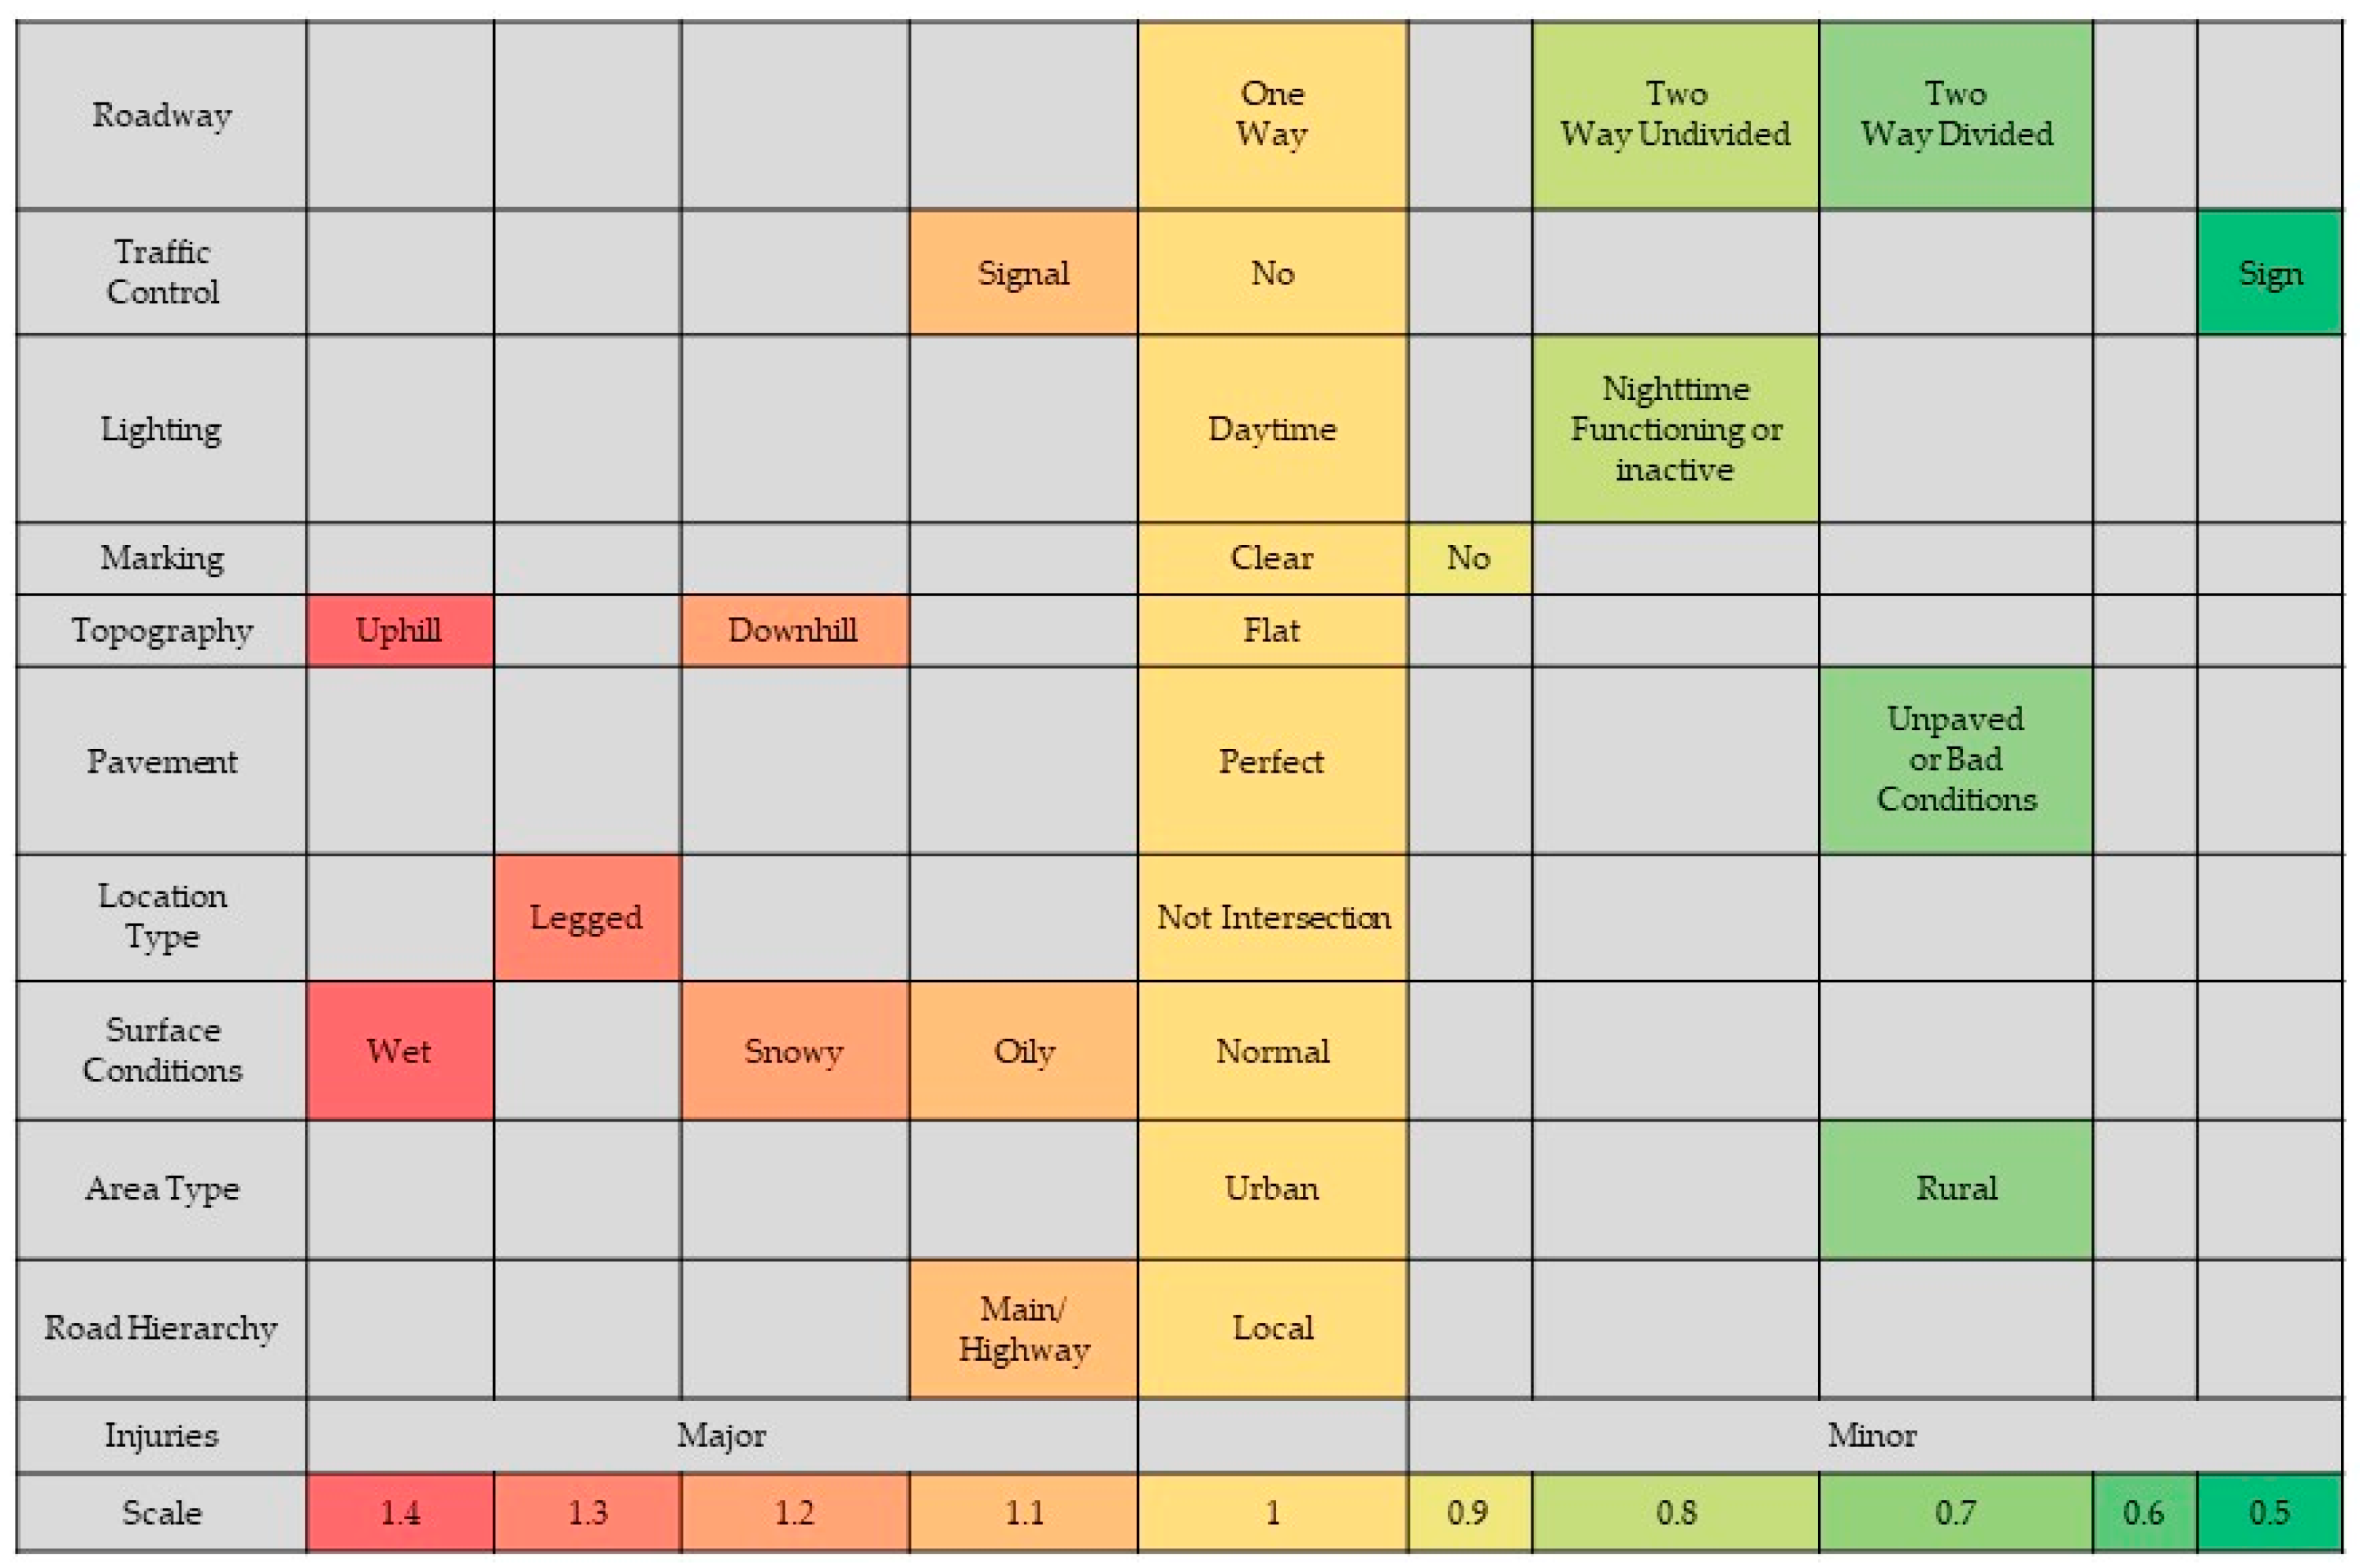
  • Minor: slight injuries; hospitalization is not needed;
  • Major: severe and fatal injuries; hospitalization is needed.
Binary logistic regression model was applied to estimate the risk probability, see Equation (1):
P = exp ( b 0 + i = 1 n b i x i ) 1 + exp ( b 0 + i = 1 n b i x i )
where:
P
probability of a major injury;
i
risk factor;
b 0
constant (intercept of the regression line);
b i
coefficient of risk factor i;
x i
binary variable of risk factor i, x i { 0 , 1 } ;
n
the number of risk factors.
The method is elaborated to determine bi values based on historical data. Thus, each risk factor (i) has a coefficient (bi). If the risk factor exists, its binary representation ( x i ) equals 1. If it is does not exist, its binary representation equals 0. The steps of the model are shown in Figure 1 and are as follows:
Step 1: Cycling crash attributes are extracted from the database. Each attribute has a set of values. The separated values are the risk factors, e.g., road surface condition is an attribute and wet and dry surface are the risk factors.
Step 2: Data cleaning based on requirements to improve the reliability of the model. The requirements are the following:
  • Risk factors are independent and either nominal or continuous;
  • No multi-collinearity;
  • Number of cases per risk factor should be at least 15 as the literature indicates [29];
  • Data are free from outliers to minimize the impact of variance on regression.
Step 3: Significance test of each risk factor for the decision on whether they are included in the equation or not.
Step 4: Determining b coefficients values by generating binary logistic regression model.
This is implemented by using the SPSS model. The coefficients (b) in Table 2 indicate how each factor has an impact on the risk.

4. Data Attributes

As the methodology establishes several steps to be conducted, this section is related to data cleaning and verifying the final attributes and factors that are to be included in the model.

4.1. Data

Data of road traffic accidents between 2011 and 2014 were provided by the Hungarian Central Statistical Office (KSH). During this period, bicycle users were involved in 14,491 injuries with 39.4% classified as major injuries.
Table 1 shows these attributes and risk factors with their frequencies and percentages for both minor and major injuries.

4.2. Checking Requirements

The requirements have been checked in accordance with the following:
  • All factors are nominal and were tested using the Variance Inflation Factor (VIF) test [30] and the correlation matrix. The results indicate medium correlation between surface conditions and weather. Thus, the weather condition is not included in the model.
  • The lowest number of injuries per factor (75, manual control) is greater than 15.
  • Since there are no continuous attributes, the linearity test is not applicable.
  • The study uses a case-wise diagnostics test that highlights cases with standardized residuals greater than ±2.0 standard deviation. All of the cases have standardized residuals less than ±2.0.
As a result, eleven attributes are included in the model, which include location type, roadway characteristics, traffic control, lighting, topography, pavement conditions, marking conditions, area type, road hierarchy, and surface conditions.

5. Results and Discussion

There are two main types of outputs of this model: (a) Determine which of the factors (if any) have a statistically significant effect on the cyclist injury severity and (b) determine how well the binary logistic regression model predicts the cyclists’ injury severity. The results were generated using SPSS.

5.1. Risk Factors

Table 2 shows the coefficients (b) and the statistical significance (p) of risk factors. Positive b indicates higher risk and negative b indicates lower risk compared to the base condition (b = 0). The first line of each attribute is the base risk factor. Exp(b) gives the ratio of odds of a major injury compared to base risk factors. Accordingly, the odds ratio is equal to 1 in the case of the base risk factor.
It was found that most of the factors are significant at a 0.95 confidence level. The b coefficients are used in the equation to predict the probability of a major risk. The odds ratios are shown in Figure 2.
Considering base conditions (one-way, with no traffic control, daytime, with clear marking, perfect pavement, flat sections, no intersection, urban area, local road, and dry surfaces), P is equal to 40.5%. The share of major injuries is 32% in the data set. This is a positive indicator of the reliability of the model. However, the probability of risk reaches 68.8% in extreme conditions (one-way, traffic signal, daytime, uphill, perfect pavement, legged intersection, urban area, highway road, and wet road surface).
Rural areas were found to be nearly 20% safer than urban areas. This is expected due to the higher conflict in the daily mobility between cyclists and vehicles in urban areas. It was also found that local roads are safer than main roads and highways. This indicates that a lower speed limit is safer for cyclists. The results by focusing on road hierarchy and road type are as follows: it was found that the probability of a major injury is approximately 10% higher on main roads and highways than on local urban roads. On the other hand, rural roads are generally 25% to 30% safer than urban roads in terms of major injury probability despite the higher speed limits. The separate bikeways may explain this in rural areas that have been developed through international projects in Hungary [31]. Furthermore, the potential over-speeding is more probable in increasing injury severity in urban areas [32].
Although speed limits are higher in two-way roads, the probability of major injuries is 20–26% lower on two-way roads than one-way roads. The narrow characteristics of one-way roads may explain this phenomenon in Hungary. Namely, there is no run-off area for cyclists in case of a crash. Furthermore, one-way roads with two-way traffic for cyclists were introduced around 2012 in Budapest. The novel road type could also cause an increase in the share of major injuries because car drivers do not expect cyclists from the opposite direction. Accordingly, one-way roads require more investigation in the future. However, the lower speed limit is safer for cyclists because the speed differential between motorized vehicles and cyclists is low; our finding indicates that further measures and policies are necessary to reduce the probability of major injuries. Compared to flat sections, the probability of major injury increases by 15.9% and 42.1% along downhill and uphill sections, respectively. In line with this, a study stated that downhill and uphill topographies increase the risk of more severe injuries; however, the probability was not calculated [33]. It was found that legged intersections are more dangerous by 32.3% than road segments. This outcome is congruent with the results in the literature. However, the difference is significantly greater than in Denmark with 11% [25]. The difference could be due to the variation between the road networks. Conversely, roundabouts have no significant difference over road segments. Similarly, a recent study found that risk factors of cyclists in the roundabouts were not significant [34]. Comparing traffic signal and no traffic control, the probability of a major injury is greater by 6.0% if the traffic is controlled by traffic signals. This may be due to the significantly greater traffic volume at signalized intersections. Traffic signs, such as stop or yield signs, make up approximately half of the probability of a major injury compared to no traffic control. Chen and colleagues emphasized that the probability of minor injuries is lower in signalized intersections than intersections without control [35]. However, the effect of the traffic sign is not aligned with a study conducted in Australia [36], which found that traffic signs have a negative impact as well. On the contrary, this variation is explained by how traffic control is unstable in the relationship with respect to cyclist injury severity [19]. On the other hand, manual traffic control is not significantly different. Night street lighting is unexpectedly safer than daytime. If the night streetlight is functioning or inactive, the injury severity decreases by 21% or 17%, respectively. This is justified as cyclists and other travelers are less careful during the daytime and limited visibility at night is a motivator to drive more cautiously. Front and rear lights and reflective safety vests significantly improve the visibility during night time; therefore, drivers and cyclists are more aware of each others’ presence. Additionally cyclists would rather use bike lanes due to safety concerns, which decreases the probability of a major injury. In the literature, there is a clear debate over this issue; an article stated that darkness increases the probability of fatal injuries compared to daytime or functioning street lighting at night [18]. However, it was indicated lately that daytime does not change risk odds ratios since street lighting and bicycle lights take care of visibility issues [14]. Additionally, [25] found that darkness is associated with a lower probability of severe and fatal cyclist injuries by 10% to 13%, which is more similar to this investigation.
Regarding road surface conditions, there is no significant difference between abraded marking and clear making. The probability of a major injury is lower by 14.6% along not-marked roads. This finding is alike to what is found in [37], which reported that on the condition of higher traffic volumes and undivided multilane roads, cyclist crashes are higher in frequency for marked sections. Furthermore, bikers pay extra attention along non-marked roads. As per pavement conditions, the risk is lower by approximately 26% if the road is in bad condition or unpaved. It may be because the traveling speed is lower along these road types. Finally, non-dry surfaces increase the probability of major injuries by a range from 10.5% to 46.0% for oily, wet, and/or snowy surfaces. The results are in compliance with [14,25], which indicated a probability of 23% increased risk on a slippery surface.
Accordingly, some measures and policies could be implemented to reduce major injuries. For instance, road safety measures should focus on one-way roads and intersections. It is also necessary to apply safety measures at signalized intersections and optimize traffic light control. Additionally, applying safety measures at downhill and uphill roads and reducing speed of cyclists through tactile road markings are recommended actions. Finally, informing cyclists about surface conditions using smart phone applications and on-site variable sign messages to alert cyclists is recommended.

5.2. Verification

Omnibus tests of Model Coefficients and the Homer–Lemeshow Test were used to assess the adequacy of the model (Table 3). It is found that the model is statistically significant (p < 0.005 and p > 0.005, respectively). Both are based on the chi-square test to check whether categorical variables are statistically associated.
Nagelkerke R-Square was used to calculate variation. This value is sometimes referred to as pseudo R2 value. In the model, the variation of the risk probability is 10.0%. Comparing to the wider literature that utilized pseudo R2, the research model has an accepted value. For example, models were explained with a range from 7.3% to 21% in a relevant study [38], while another described the variation with less than 3% [39] and traffic accident research estimated the model of bikes’ severity with a range between 2% and 9% [40].
The number of correct predictions was calculated (Table 4). The optimal cut value was 0.39. Namely, the injury was predicted to be major if p is greater than 0.39. The rates of correct predictions were 70.5% and 40.2% of minor and major injuries, respectively. The overall correctness was 59.0%. The shares of minor and major injuries were 60.6% and 39.4%, respectively, according to the raw data. Thus, the model predicts each group with acceptable percentages. Although the total prediction percentage is not that high, most of the variables are significant. The significance of variables does not guarantee higher predictions [41], especially with large data sets used in this study.

6. Conclusions

The factors affecting the severity of cyclist crashes were analyzed based on historical data. Probabilities of major injuries are higher in signalized intersections, inclined topographies, one-way roads, urban areas, higher speed limits, and during the daytime, which require more attention and better considerations. Regarding the road surface components themselves, it is found that good conditions are not perfect for the cyclists’ safety. This is because good conditions may be more attractive for less experienced bikers, support higher travel speed, and bikers must pay attention to more components of the traffic along busy sections. Accordingly, bad road conditions and difficulties in visibility may decrease the severity of injuries because they are less attractive for inexperienced bikers and travelers pay extra attention in these situations. In general, the results are in line with those found in the literature; however, the extent of the effect of several factors’ was not measured previously, which is the main novelty of this research. Furthermore, significant differences were found in the extent of effect compared to previous studies with respect to economic and demographic aspects. These differences require further research and support decision makers to identify the best practices and policies.
However, some limitations should be noted because of the lack of data about speed limits and bicycle lanes. For future research, we aim to increase the model predictions by studying the effect of other attributes, specifically continuous variables such as vehicle speed. One of the most important points is also to study the impact of lighting and visibility on cyclists’ behavior and risk. Moreover, future investigations could target the study of the relationship between speed limit, area type, the presence of bicycle lanes, and injury severity through road hierarchy classification. This research is an initiating point to find the safety aspects related to behavior and attitude of passengers in their decisions of using private cars, public transportation, and soft mobility modes, such as cycling.

Author Contributions

Conceptualization, A.J. and J.J.; methodology, A.J.; formal analysis, A.J.; investigation, A.J. and J.J.; resources, A.J. and J.J.; writing—review and editing, A.J., J.J., and B.C.; visualization, A.J.; supervision, J.J. and B.C. All authors have read and agreed to the published version of the manuscript.

Funding

This research received no external funding.

Data Availability Statement

The data presented in this study are available upon request from the corresponding author. The data are not publicly available due to conditional request from the source.

Acknowledgments

The authors gratefully acknowledge the support provided by the Budapest University of Technology and Economics (BME) and the Faculty of Transportation Engineering and Vehicle Engineering through Scholarship awarded to the first author.

Conflicts of Interest

The authors declare no conflict of interest.

References

  1. European Cyclists’ Federation. Annual Report; European Commission: Brussels, Belgium, 2018. [Google Scholar]
  2. Fraboni, F.; Prati, G.; Casu, G.; De Angelis, M.; Pietrantoni, L. A cluster analysis of cyclists in Europe: Common patterns, behaviours, and attitudes. Transportation 2021, 1–30. [Google Scholar] [CrossRef]
  3. Plasencia-Lozano, P. Evaluation of a New Urban Cycling Infrastructure in Caceres (Spain). Sustainability 2021, 13, 1910. [Google Scholar] [CrossRef]
  4. Nikolaou, P.; Folla, K.; Dimitriou, L.; Yannis, G. European Countries’ Road Safety Evaluation by Τaking Ιnto Account Multiple Classes of Fatalities. In Proceedings of the 23rd EURO Working Group on Transportation Meeting, EWGT 2020, Paphos, Cyprus, 16–18 September 2020. [Google Scholar]
  5. Adminaité-Fodor, D.; Jost, G. How Safe Is Walking and Cycling in Europe? European Transport Safety Council ETSC: Brussels, Belguim, 2020.
  6. ERSO. Road Safety Country Overview—Hungary; European Commission: Luxembourg, 2017. [Google Scholar]
  7. Ágoston, G.; Madleňák, R. Road Safety Macro Assessment Model: Case Study for Hungary. Period. Polytech. Transp. Eng. 2021, 49, 89–92. [Google Scholar] [CrossRef] [Green Version]
  8. Strauss, J.; Miranda-Moreno, L.F.; Morency, P. Cyclist activity and injury risk analysis at signalized intersections: A Bayesian modelling approach. Accid. Anal. Prev. 2013, 59, 9–17. [Google Scholar] [CrossRef] [PubMed]
  9. Ma, M.; Yan, X.; Abdel-Aty, M.; Huang, H.; Wang, X. Safety Analysis of Urban Arterials under Mixed-Traffic Patterns in Beijing. Transp. Res. Rec. J. Transp. Res. Board 2010, 2193, 105–115. [Google Scholar] [CrossRef]
  10. Møller, M.; Hels, T. Cyclists’ perception of risk in roundabouts. Accid. Anal. Prev. 2008, 40, 1055–1062. [Google Scholar] [CrossRef]
  11. Tang, T.; Wang, H.; Ma, J.; Zhou, X. Analysis of Crossing Behavior and Violations of Electric Bikers at Signalized Intersections. J. Adv. Transp. 2020, 2020, 3594963. [Google Scholar] [CrossRef] [Green Version]
  12. Yan, X.; Wang, T.; Chen, J.; Ye, X.; Yang, Z.; Bai, H. Analysis of the Characteristics and Number of Bicycle–Passenger Conflicts at Bus Stops for Improving Safety. Sustainability 2019, 11, 5263. [Google Scholar] [CrossRef] [Green Version]
  13. Johnson, M.; Newstead, S.; Oxley, J.; Charlton, J. Cyclists and open vehicle doors: Crash characteristics and risk factors. Saf. Sci. 2013, 59, 135–140. [Google Scholar] [CrossRef]
  14. Dozza, M.; Werneke, J. Introducing naturalistic cycling data: What factors influence bicyclists’ safety in the real world? Transp. Res. Part. F Traffic Psychol. Behav. 2014, 24, 83–91. [Google Scholar] [CrossRef]
  15. Elvik, R. The non-linearity of risk and the promotion of environmentally sustainable transport. Accid. Anal. Prev. 2009, 41, 849–855. [Google Scholar] [CrossRef]
  16. Weber, T.; Scaramuzza, G.; Schmitt, K.-U. Evaluation of e-bike accidents in Switzerland. Accid. Anal. Prev. 2014, 73, 47–52. [Google Scholar] [CrossRef]
  17. Hollingworth, M.A.; Harper, A.J.; Hamer, M. Risk factors for cycling accident related injury: The UK Cycling for Health Survey. J. Transp. Health 2015, 2, 189–194. [Google Scholar] [CrossRef]
  18. Kim, J.-K.; Kim, S.; Ulfarsson, G.F.; Porrello, L.A. Bicyclist injury severities in bicycle–motor vehicle accidents. Accid. Anal. Prev. 2007, 39, 238–251. [Google Scholar] [CrossRef]
  19. Chen, P. Built environment factors in explaining the automobile-involved bicycle crash frequencies: A spatial statistic approach. Saf. Sci. 2015, 79, 336–343. [Google Scholar] [CrossRef]
  20. Miranda-Moreno, L.F.; Strauss, J.; Morency, P.; Information, R. Disaggregate Exposure Measures and Injury Frequency Models of Cyclist Safety at Signalized Intersections. Transp. Res. Rec. J. Transp. Res. Board 2011, 2236, 74–82. [Google Scholar] [CrossRef]
  21. Griswold, J.; Medury, A.; Schneider, R.J. Pilot Models for Estimating Bicycle Intersection Volumes. Transp. Res. Rec. J. Transp. Res. Board 2011, 2247, 1–7. [Google Scholar] [CrossRef] [Green Version]
  22. Boufous, S.; de Rome, L.; Senserrick, T.; Ivers, R. Risk factors for severe injury in cyclists involved in traffic crashes in Victoria, Australia. Accid. Anal. Prev. 2012, 49, 404–409. [Google Scholar] [CrossRef]
  23. Martínez-Ruiz, V.; Lardelli-Claret, P.; Jiménez-Mejías, E.; Amezcua-Prieto, C.; Jiménez-Moleón, J.J.; del Castillo, J.D.D.L. Risk factors for causing road crashes involving cyclists: An application of a quasi-induced exposure method. Accid. Anal. Prev. 2013, 51, 228–237. [Google Scholar] [CrossRef]
  24. Branion-Calles, M.; Götschi, T.; Nelson, T.; Boig, E.A.; Avila-Palencia, I.; Castro, A.; Cole-Hunter, T.; De Nazelle, A.; Dons, E.; Gaupp-Berghausen, M.; et al. Cyclist crash rates and risk factors in a prospective cohort in seven European cities. Accid. Anal. Prev. 2020, 141, 105540. [Google Scholar] [CrossRef]
  25. Kaplan, S.; Vavatsoulas, K.; Prato, C.G. Aggravating and mitigating factors associated with cyclist injury severity in Denmark. J. Saf. Res. 2014, 50, 75–82. [Google Scholar] [CrossRef] [PubMed]
  26. Wu, C.; Chen, D.; Chen, Y. Bicycle-Vehicle Conflict Risk Based on Cyclist Perceptions: Misestimations of Various Risk Factors. Sustainability 2020, 12, 9867. [Google Scholar] [CrossRef]
  27. Glász, A.; Juhász, J. Car-pedestrian and car-cyclist accidents in Hungary. In Transportation Research Procedia; Elsevier: Volos, Greece, 2017. [Google Scholar]
  28. Földes, D.; Csiszár, C. Personalised information services for bikers. Int. J. Appl. Manag. Sci. 2018, 10, 3–25. [Google Scholar] [CrossRef]
  29. Statistics, L. Binomial Logistic Regression; Lund Research Ltd.: Long Eaton, UK, 2013; Available online: https://statistics.laerd.com/ (accessed on 6 May 2021).
  30. Singh, S.G.; Kumar, S.V. Dealing with Multicollinearity Problem in Analysis of Side Friction Characteristics Under Urban Heterogeneous Traffic Conditions. Arab. J. Sci. Eng. 2021, 1–17. [Google Scholar] [CrossRef]
  31. Formadi, K.; Mayer, P.; Pénzes, E. Geography of Tourism in Hungary. In The Geography of Tourism of Central and Eastern European Countries; Springer: Cham, Germany, 2017; pp. 189–232. [Google Scholar]
  32. Prati, G.; Pietrantoni, L.; Fraboni, F. Using data mining techniques to predict the severity of bicycle crashes. Accid. Anal. Prev. 2017, 101, 44–54. [Google Scholar] [CrossRef] [PubMed]
  33. Strauss, J.; Zangenehpour, S.; Miranda-Moreno, L.F.; Saunier, N. Cyclist deceleration rate as surrogate safety measure in Montreal using smartphone GPS data. Accid. Anal. Prev. 2017, 99, 287–296. [Google Scholar] [CrossRef]
  34. Akgün, N.; Daniels, S.; Bell, M.C.; Nuyttens, N.; Thorpe, N.; Dissanayake, D. Exploring regional differences in cyclist safety at roundabouts: A comparative study between the UK (based on Northumbria data) and Belgium. Accid. Anal. Prev. 2021, 150, 105902. [Google Scholar] [CrossRef] [PubMed]
  35. Chen, C.; Anderson, J.; Wang, H.; Wang, Y.; Vogt, R.; Hernandez, S. How bicycle level of traffic stress correlate with reported cyclist accidents injury severities: A geospatial and mixed logit analysis. Accid. Anal. Prev. 2017, 108, 234–244. [Google Scholar] [CrossRef] [PubMed]
  36. Wahi, R.R.-H.; Haworth, N.; Debnath, A.K.; King, M. Influence of Type of Traffic Control on Injury Severity in Bicycle–Motor Vehicle Crashes at Intersections. Transp. Res. Rec. J. Transp. Res. Board 2018, 2672, 199–209. [Google Scholar] [CrossRef] [Green Version]
  37. Zegeer, C.V.; Stewart, J.R.; Huang, H.; Lagerwey, P. Safety Effects of Marked Versus Unmarked Crosswalks at Uncontrolled Locations; The Federal Highway Administration FHWA: Northern Virginia, VA, USA, 2005.
  38. Böcker, L.; Van Amen, P.; Helbich, M. Elderly travel frequencies and transport mode choices in Greater Rotterdam, The Netherlands. Transportation 2017, 44, 831–852. [Google Scholar] [CrossRef] [Green Version]
  39. International Multiple Sclerosis Genetics Consortium. Evidence for Polygenic Susceptibility to Multiple Sclerosis—The Shape of Things to Come. Am. J. Hum. Genet. (AJHG) 2010, 86, 621–625. [Google Scholar] [CrossRef] [PubMed] [Green Version]
  40. Green, C.P.; Heywood, J.S.; Navarro, M. Traffic accidents and the London congestion charge. J. Public Econ. 2016, 133, 11–22. [Google Scholar] [CrossRef] [Green Version]
  41. Lo, A.; Chernoff, H.; Zheng, T.; Lo, S.-H. Why significant variables aren’t automatically good predictors. Proc. Natl. Acad. Sci. USA 2015, 112, 13892–13897. [Google Scholar] [CrossRef] [PubMed] [Green Version]
Figure 1. Steps of the Method.
Sustainability 13 06945 g001
Figure 2. Odd ratios of risk factors.
Sustainability 13 06945 g002
Table 1. Risk factors and the number of cases per severity category.
AttributesRisk Factor (i)MinorMajor
Count%Count%
RoadwayOne-way111067%55433%
Divided Two-Way53468%24932%
Undivided Two-Way713759%490741%
Traffic ControlNo Traffic Control651659%448941%
Traffic Sign (Stop/ Yield)181465%99135%
Traffic Signal40165%21535%
Manual (Police man)5077%1523%
Surface ConditionDry654960%435940%
Wet152864%84636%
Oily (Slippery)57358%41142%
Snowy13158%9442%
LightingDay Time663661%424139%
Functioning Streetlight146463%87537%
Inactive Streetlight68153%59447%
MarkingClear473961%308239%
Abraded102764%58736%
No Marking301560%204140%
TopographyFlat772761%494539%
Downhill74356%59144%
Uphill31164%17436%
PavementPerfect575661%365939%
Bad Conditions283460%188240%
Unpaved19153%16947%
Location TypeNot Intersection508758%362242%
Legged Intersection (T, Y, 4 or more legs)347463%199937%
Roundabout22071%8929%
WeatherClear803660%529340%
Rainy and Snowy63466%32634%
Windy1545%1855%
Foggy9657%7343%
AreaUrban798764%452436%
Rural101951%96149%
Roads HierarchyLocal434461%274039%
Main242861%153639%
Highway223765%120653%
Table 2. Statistical significance and coefficients of risk factors.
AttributeRisk Factor (i)bS.E. 1Wald 2df 3pSig *Exp(b)
RoadwayOne-way0 31.71720.00095%1
Divided Two-Way−0.3100.06026.24810.00095%0.734
Undivided Two-Way−0.2210.0827.15310.00795%0.802
Traffic ControlNo Traffic Control0 6.08830.00795%1
Traffic Sign (Stop/ Yield)−0.5970.2984.0211.04595%0.550
Traffic Signal0.0580.0521.22610.06890%1.060
Manual (Police man)0.0730.0960.60410.437Not1.076
Surface ConditionDry0 8.69430.03495%1
Wet0.3780.1694.97510.02695%1.460
Oily (Slippery)0.1000.0612.69010.09190%1.105
Snowy0.2120.0955.00910.02595%1.236
LightingDay Time0 9.17920.01095%1
Functioning Streetlight−0.2340.0818.34710.00495%0.792
Inactive Streetlight−0.1840.0884.34510.03795%0.832
MarkingClear0 8.42220.01595%1
Abraded0.0020.0400.00310.959Not1.002
No Marking−0.1580.0597.08110.00895%0.854
TopographyFlat0 15.49420.00095%1
Downhill0.1480.0952.45010.09890%1.159
Uphill0.3510.10810.63110.00195%1.421
PavementPerfect0 7.08520.02995%1
Bad Conditions−0.3020.1147.07810.00895%0.739
Unpaved−0.2950.1166.53510.01195%0.745
Location TypeNot an Intersection0 9.48820.00995%1
Legged Intersection (T, Y, 4 or more legs)0.2800.1274.82110.02895%1.323
Roundabout0.1660.1261.74610.186Not1.181
Area TypeUrban0 20.00095%1
Rural−0.3740.05156.36720.00095%0.689
Roads HierarchyLocal0 5.79220.05590%1
Main0.0920.0513.20610.07390%1.096
Highway0.1090.0455.73010.01795%1.115
Constant−0.3830.4930.60210.03890%0.682
* Sig: Statistically significant at 90%, 95% Confidence Level, or Not Significant. 1 Standard error around the coefficient for the constant. 2 Wald chi-squared test that tests the null hypothesis of the constant equals 0. 3 Degrees of freedom for the Wald chi-squared test.
Table 3. Significance of Model.
p
Omnibus Tests of Model Coefficients0.000
Hosmer and Lemeshow Test0.261
Table 4. Effectiveness of category prediction.
Correct Prediction
Minor Injuries70.5%
Major Injuries40.2%
Overall59.0%
Publisher’s Note: MDPI stays neutral with regard to jurisdictional claims in published maps and institutional affiliations.

