1. Introduction
Academic studies have approached the area of defence expenditure in order to analyse it within the context of sustainable development, by consulting various perspectives, such as military spending and economic growth [
1,
2,
3,
4,
5], defence and inequality [
6,
7,
8,
9,
10,
11], military and social welfare [
12], and military and unemployment [
13,
14], as well as military and energy consumption [
15]. The extensive literature yields conflicting results. Sustainable development is the kind of development which meets the needs of current generations and does not harm the chances of future generations to meet their own needs. By being enabled through the modern conditions which revolve around globalisation, the development of European integration determines the transformations that are required to take place within European society by developing sustainable economic, social, cultural, technological, and environmental processes, as well as by ensuring safe and free living conditions. The EU and NATO address mutual security questions and, in turn, serve mutual defence interests. With regard to the majority of EU member states, it should be noted that defence in Europe fundamentally exists on two substantial levels: emerging from the capabilities of the member state itself and the collective defence requirements which are warranted by NATO. In 2014, the NATO summit reached an agreement which would see the members of the world’s largest defence alliance being able to military burden-sharing. This agreement stipulated that the NATO member states commit to fully allocating two percent of their country’s gross domestic product (GDP) to national defence and to preparing their national defence plans by 2024. However, not all member states are observing this agreement. Even the largest member states with the strongest economies are spending less than 1.5 percent of their GDP on defence so that they can instead prioritise other sectors of the economy. Information published in 2020 demonstrates that only the following nine European countries reached the two percent defence funding target: Greece (2.58%), the United Kingdom (2.43%), Romania (2.38%), Estonia (2.38%), Latvia (2.32%), Poland (2.3%), Lithuania (2.28%), France (2.11%), and Norway (2.03%). Allocations for defence spending increased over the entire period by more than one and a half times in Lithuania and Latvia, and by more than a third in Estonia. The accession of the Baltic States to NATO in 2004 and the commitment to achieve 2% of GDP for defence as well as threats in neighbouring countries (annexation of Crimea by the Russian Federation in 2014) have had an impact on increasing defence spending over the period analysed.
Problem statement: the aim of being able to achieve the goal of sustainable development and to maintain NATO commitments raises the question of how defence and sustainable development spending can be balanced. In answering this question, it is important to know the potential impact on defence spending that may be generated by sustainable development indicators. The question of whether sustainable development indicators can affect defence spending is currently considered to be controversial. In this research, the authors attempt to assess the relationship between defence and sustainable development by examining the situation in the Baltic countries and highlighting the main differences between those countries. It should be noted that the smaller countries, such as Lithuania, Latvia, and Estonia, have been overlooked in terms of research into the relationship between spending on defence and sustainable development. As a result, this study extends the scope of scientific research and may serve to create a space for other researchers in which to conduct similar research.
The object of the research: the relationship between defence spending and sustainable development in Lithuania, Latvia, and Estonia.
The aim of the research: this research aims to provide a more reliable assessment of the relationship between defence and sustainable development indicators.
Limitations of the research: this study was based on figures from defence expenditure and sustainable development indicators as found in various areas. Sustainable development indicators have been selected by considering their key areas, including economic, social, and environmental aspects. It was not possible to include all of the available indicators within the scope of this study. However, the unexamined factors could be analysed in the future. Moreover, according to Hartley [
16], defence spending depends on political, strategic, and economic factors. Accordingly, this reveals another limitation of the study. The authors of this article focussed on economic factors alone, and left other determinants, such as political and strategic aspects, for future study. Moreover, in this investigation, the authors analysed the period from 2000 to 2018 without breaking it down into shorter periods. Given the fact that the Baltic states became members of NATO in 2004, it may be useful in future studies to assess the situations separately: before joining NATO and after becoming a member of NATO.
The article consists of the following: introduction, literature review, methodological approach, research results, discussion, and conclusions.
2. Literature Review
Conceptual approaches to sustainable development. Sustainable development refers to the global and sustained development of a society in which the present needs of humanity are met through the sustainable use of natural resources in order to preserve the planet for future generations. The Rio de Janeiro Earth Summit of 1992 validated sustainable development as a sustained ideology, one which is key to the development of a global society. It also passed a declaration which set out the basic principles of sustainable development. In 2015, a total of 193 UN countries signed the ‘2030 Agenda for Sustainable Development’. Each participating country decided on which ‘Sustainable Development Goals’ (SDGs) it intends to prioritise with respect to the agenda [
17]. Priority is usually determined by the specific internal challenges being faced within the country in question, and by the objective to meet the requirements of international organisations [
18]. The most pressing problems in developing countries include particularly rapid population growth, poverty, and gender inequality, as well as defective educational and medical systems. Developed countries mainly face issues regarding the overuse of natural resources and pollution [
19]. However, both developed and developing countries (except for those which have been devastated by war or natural disasters) tend to develop naturally, in which case their economies and the welfare of their populations tend to grow, albeit at very different rates [
20]. Česonis [
21] distinguishes three levels of sustainable development dimensions. First is two-dimensional sustainability. In the beginning, the concept of sustainable development emphasised the sustainability of business and the natural environment, proposing that the economy and the environment must not limit one another but must instead provide mutual support in terms of establishing further opportunities. Second is three-dimensional sustainability. The dimensions given above for the economy and environment are supplemented with the social dimension, which for some time has ensured sustainable relationships between economic growth, environmental stability, and social growth. Thirdly, there is four-dimensional sustainability. This includes the political dimension, which points towards the initiation of legislation, as well as the development and implementation of preventive environmental measures. In addition to these three frequently discussed developmental components, academic literature also features studies which include a fourth component: the institutional component [
22], or a component covering a larger scope which includes technical, legal, and political aspects [
23,
24,
25]. Recently, the scholarly community has been in agreement with regard to sustainable development being a complex task, one with multiple goals which involves closely connected fields and criteria. However, both the scientific literature and official documents usually address the three components of sustainable development, i.e., the economic, social, and environmental aspects [
20,
26]. Societal change has the greatest impact on the development of a sustainable economy, with the result that it must be prioritised. Human activities push the ecological, social, and economic systems far beyond any sustainable levels. Many authors discuss the importance of monitoring and controlling human activities in terms of sustainable development, but little is said about shaping an integrated, systemic approach to decision-making [
27]. Sustainable economic development demands a systemic approach which begins with an analysis of societal needs and changes [
28]. The ‘Sustainable Development Goals’ which were set out in the UN’s 2030 agenda have established an unprecedented global compass which has become a guide to solving the challenges and issues being faced in terms of sustainable development [
29]. It should be noted that the evolution of sustainable development concepts demands transformation in the approach to the systemic and integral perspective, which would in turn facilitate a comprehensive understanding and resolving of these problems [
27,
28,
30]. All of the sustainable development goals are closely interconnected; hence, their implementation depends on finding solutions across sectors [
31]. The objectives of countries must be based on reliable and effective indicators, as well as on systems that involve appropriate controls and management [
27,
32].
Security within the context of sustainability. The objectives of public security and defence, as well as their implementation, are exceptionally important and significant within the context of the implementation of sustainable development goals. The former are characterised both by the diversity of the issues under consideration and the different approaches to resolving these issues [
33]. Defence is a special area, one which provides the basis of the national sovereignty of the member states [
34]. In order to prevent the possibility of asymmetric threats arising, while also making effective use of national defence capabilities and to ensure peace and stability around the world, it is important to focus more strongly on the continuous transformation and modernisation of the defence sector [
35]. Defence undoubtedly has strong economic and industrial dimensions. The country’s allocations into the defence sector directly depend on the economic, social, and technological welfare of its population and the environment. On the other hand, the sustainable development of all these aspects serves to secure the country’s opportunities on the international and domestic planes. Global defence expenditure increased by 4% in 2019, which was the largest increase in the last decade. This was conditioned by the increase in US and Chinese military spending [
36]. According to the International Institute for Strategic Studies (IISS), the growing competition between these powerful states, new forms of military technology, and global conflicts stretching from Ukraine to Libya all stimulated the increase in such spending. Military funding in Europe increased faster than in any other region [
37]. The commission’s proposal for 2021–2027 reflects its ambition that defence should play a more significant role in the future. It is clear that EU countries will be given additional obligations to increase defence expenditure.
Academic publications feature a good many studies on defence expenditure, which various authors have examined from different perspectives [
33,
38,
39,
40,
41,
42,
43,
44,
45,
46,
47,
48,
49,
50,
51,
52,
53]. In order to justify the continuous increase of state investments into the defence sector, extensive research into the potential impact of defence expenditure on the economy is being conducted in the United States and Europe. However, this area of research is rare and has different purposes in the bloc of developing nations [
54]. The academic literature usually analyses the relationship between defence expenditure and economic growth [
39,
40,
55]. Scholars emphasise the fact that the effects of military spending on the development of economies vary according to the country in question [
54,
56,
57].
One of the first studies to examine the relationship between defence expenditure and economic development was conducted by Benoit [
52,
53]. In her study, the author examined the relationship between the economic performance of forty-four developing countries and their military spending. She provided a revealing insight into the nature of the economic development of these countries and its relationship to defence expenditure. Various models and methods have since been used to investigate these relationships. However, a unanimously accepted theory on defence spending has not been yet established, i.e., on the relationship between economic growth and a unified agreement on the economic impact on defence expenditure [
48]. The five groups of theoretical models of defence and economic development which are present in academic literature are as follows: supply models (the Feder type); demand models; supply and demand models; Barro models; and Solow models. Demand models are criticised for underestimating the supply aspects and can be linked to negative effects on economic development [
55]. Dunne et al. [
50] and Dunne and Tian [
47,
58] suggest that there are substantial theoretical and econometric reasons for not using the supply model. Supply-demand models are criticised for their ad hoc theoretical assumptions [
38]. Barro growth models are too complicated for application and the theory is applied mainly in the selection of variables alone [
50]. There is a diversity of approaches used in scientific literature in regard to the relationship between defence expenditure and economic development [
47]. Firstly, there is a one-way causal link between defence and economic growth. This points to the fact that any increase in defence expenditure stimulates economic growth or that economic development influences decisions that pertain to defence. Secondly, there is a two-way causal link between defence and economic growth. This means that the same factors that drive economic growth also affect the development of the defence sector. Thirdly, there is no causal link between defence and economic growth [
40]. The above causal links have been analysed extensively, both in studies on the economic growth of individual countries and in comparing countries from different perspectives [
47]. In addition, Dunne and Uye [
59] found that almost 39% of cross-country studies and 35% of country-specific studies confirmed the negative impact of defence expenditure on economic growth. Approximately 20% of both forms of study revealed positive results. Supply models demonstrate that defence expenditure has neither a significant impact on economic growth nor a relatively small positive impact [
48], whereas studies which have been conducted by other researchers indicate that the Feder (supply) models have a clear positive effect on growth rates in all countries which were studied [
54]. In the opposition direction, demand models are associated with negative effects on economic growth. In the majority of studies, supply and demand models [
60,
61] generally demonstrated an exclusively negative impact by defence expenditure on economic growth. Some studies [
7,
8,
9,
10,
11,
12,
13,
14,
15] analysed the links between defence and other sustainable development indicators, such as social and environmental indicators. Wolde-Rufael [
7] investigated long-term and causal relationships between military spending and income distribution in South Korea for the period between 1965 and 2011. The findings demonstrated that a 1% increase in military spending also increased the Gini coefficient by 0.38%. Moreover, a causality test accordingly revealed a unidirectional causal relationship between military spending and income inequality. Tuner [
13] studied how industry employees in the UK depend upon defence expenditure and defence exports. Sharif and Afshan [
8] assessed the relationship between defence spending and income inequality in Pakistan and India in the period between 1980 and 2014. The findings revealed a long-term relationship in both countries between defence expenditure and income inequality. Tesearch by Zhang [
12] analysed the impact of defence expenditure on income inequality in China during the period between 1997 and 2012. The results demonstrated that defence expenditure affects income inequality, and the impact varies across different regions in China. In his study, Becker [
15] revealed that the US armed forces were changing their policy to become greener. The US Department of Defense decided to obtain a quarter of its energy from renewable resources. This decision created significant environmental benefits. According to Samaras et al. [
62], economic, environmental, and security factors have highlighted the role of energy as a system-wide strategic lever in defence, which will have positive effects upon a state’s ability to act militarily and on the civilian energy sector.
In summary, the results from empirical research into defence expenditure within the context of sustainable development are diverse and, in many cases, depend not only on factors such as the period being studied, and the sample of countries and their socio-economic characteristics, but also on the research models and methods being applied in the research [
40]. The diversity of the world’s economies also contributes to modern security challenges. A number of security issues stem precisely from the fact that there is an excessive variety of forms of socio-economic exclusion and differentiation, manifestations of competition and competitiveness, and an abundance of different cultures and manners of thought, as well as an abundance of living systems [
33]. The development of world economies under contemporary complicated conditions varies vastly. Excellent results in the development of economic and technological innovation are accompanied by deteriorating environmental processes, declining social phenomena, and complex intercultural challenges, not to mention geopolitical tensions, military interventions, and complex political decisions.
3. Research Questions and Methodology
The representative secondary data for the period between 2000 and 2018 were selected in order to fully examine the relationships between defence expenditure and sustainable development indicators in the three Baltic countries—Lithuania, Latvia, and Estonia. The empirical study was carried out based on available data and after preliminary descriptive statistics, linear regression models were created. This study was directly linked to both the search for answers and the collection of unique and useful information, which can help to identify, compare, and reveal relevant details in connection with the topic on the defence expenditure. The main focus of this study was to answer these questions:
Which indicators of sustainable development affect defence expenditure in Lithuania?
Which indicators of sustainable development affect defence expenditure in Latvia?
Which indicators of sustainable development affect defence expenditure in Estonia?
What are the differences among the Baltic countries within the context of defence expenditure–sustainable development relations?
To answer these questions, a statistical analysis using IBM SPSS 27v software was conducted. Moreover, the chosen Automatic Linear Modelling technique was valuable in identifying main components that cause the majority of the defence expenditure amount in the three Baltic countries. The collected dataset characteristics are presented in
Section 3.2 and the Automatic Linear Modelling approach in
Section 3.3.
3.1. Data Source
The study employed representative secondary data for the period between 2000 and 2018. The values for all variables were taken from the database of the EU Statistical Office (hereinafter referred to as ‘Eurostat’). This allowed for a comparative analysis between the countries being studied, standardisation, and acceptability. Our investigation demonstrated that the sustainable development indicators which were provided by Eurostat were not detailed enough; that the data are dominated by the period between 2000 and 2018; and that some indicators are only included every two years.
Three Baltic countries—Lithuania, Latvia, and Estonia—were selected for the empirical study of the relationship between defence expenditure and sustainable development indicators. These countries share similar economic, social, ecological, cultural, and political conditions. Therefore, they are interesting in terms of examining the mutual relationships and trends between defence and sustainable development (hereinafter referred to as ‘SD’).
3.2. Data Sample Description
The variables that were chosen for this study and that are presented in the following text were based on Eurostat [
63] information.
The UN Report states seventeen goals and 169 indicators. Based on the critical analysis of the scientific literature and findings from previous research, in order to ensure the quality of the investigation, the indicators that were required for the research were selected by considering the areas of sustainable development, i.e., the economic, social, and environmental dimensions and mutual cooperation, as well as the time period for the indicators that were published by Eurostat. In the selection of sustainable development indicators, it was important that the links between them and defence expenditure were logically justified at the theoretical level. Taking all of these facts into account, sixteen out of all of the available indicators in the EUROSTAT database were selected to obtain the econometric model (
Table 1). In the investigation, these selected indicators are independent variables.
Defence expenditure (COFOG 99) [gov_10a_exp] includes the following: military defence; civil defence; foreign military aid, research and development (hereinafter referred to as ‘R&D’) related to defence; and other defence spending. In the research, this indicator is a dependent variable.
Y—(defence expenditure (COFOG 99) [gov_10a_exp] includes the following: military defence; civil defence; foreign military aid; R&D related to defence; and defence n.e.c.
X1—real gross domestic product (GDP) per capita [SDG_08_10]. This indicator is calculated as the ratio of real GDP to the average population in a specific year. GDP measures the value of the total final output of goods and services which are produced by an economy within a certain period of time.
X2—investment share of GDP by institutional sectors [SDG_08_11]. This indicator shows the amount being invested into the total economy, government, business, and household sectors. The indicator provides the share of GDP that is used for gross investment.
X3—employment rate [SDG_08_30]. This indicator measures the share of the population which is aged between 20–64 and which is employed. Employed persons are defined as all persons who, during a reference week, worked at least one hour for pay or profit, or were temporarily absent from such work.
X4—resource productivity and domestic material consumption (DMC) [SDG_12_20]. Resource productivity is acquired by dividing GDP by DMC. DMC measures the total amount of materials directly being used by an economy.
X5—gender employment gap [SDG_05_30]. This indicator measures the difference between the employment rates for men and women aged between 20–64. The employment rate is calculated by dividing the number of persons who are aged between 20–64 and who are in employment by the total population in the same age group.
X6—final energy consumption [SDG_07_11]. This indicator measures the energy end use in a country, excluding all non-energy use by energy carriers (e.g., natural gas used not for combustion but to produce chemicals). Final energy consumption only covers the energy being consumed by end users, such as industry, transport, households, services, and agriculture.
X7—energy productivity [SDG_07_30]. This indicator measures the volume of economic output that is produced per unit of gross available energy. The gross available energy represents the quantity of energy products that are necessary in order to satisfy all demands by entities within the geographical area that is under consideration.
X8—energy import dependency [SDG_07_50]. This indicator shows the share of total energy needs for a country which are being met by imports from other countries.
X9–gross domestic expenditure on R&D [SDG_09_10]. This indicator measures gross domestic expenditure on R&D as a percentage of the gross domestic product (GDP).
X10—human resources in science and technology [SDG_09_21]. This indicator measures human resources in science and technology (HRST) as a share of the active population within the age group of 25–64 years.
X11—R&D personnel [SDG_09_30]. This indicator measures the share of R&D personnel by all sectors as a percentage by active population.
X12—purchasing-power-adjusted GDP per capita [SDG_10_10]. Gross domestic product (GDP) is a measure of economic activity. It refers to the value of the total output of goods and services being produced by an economy, minus any intermediate consumption, plus net taxes on products and imports. GDP per capita is calculated as the ratio of GDP to the average population in a specific year. Basic figures are expressed in purchasing power standards (PPS), which represent a common currency that eliminates the differences in price levels between countries to allow meaningful volume comparisons of GDP.
X13—adjusted gross disposable income of households per capita [SDG_10_20]. This indicator reflects the purchasing power of households and their ability to invest in goods and services or to save for the future by accounting for taxes and social contributions, and for monetary in-kind social benefits. It is calculated as the adjusted gross disposable income of households and ‘non-profit institutions serving households’, divided by the purchasing power parities (PPP) of the actual individual consumption of households and by the total resident population.
X14—EU imports from developing countries [SDG_17_30]. This indicator is defined as the value of EU imports from developing countries. In this context, developing countries are defined as countries on the OECD Development Assistance Committee list of official development assistance beneficiaries.
X15—general government gross debt [SDG_17_40]. This indicator is defined as the ratio of government debt which is outstanding at the end of the year against gross domestic product at current market prices. For this calculation, government debt is defined as the total consolidated gross debt at nominal value.
X16—share of environmental taxes in total tax revenues [SDG_17_50]. This indicator measures the share of environmental taxes out of total revenues from taxes and social contributions. Environmental taxes are defined as taxes whose tax base is a physical unit of something that has a proven, specific negative impact on the environment [
63].
3.3. Data Modelling Approach by Automatic Linear Modelling
The regression analysis is widely used as a powerful statistical method that allows to study the relationship between two or more variables under consideration. Moreover, the regression analysis is a reliable statistical method of recognising which independent variables have impact on a dependent variable [
64]. The process of carrying out a regression makes it possible to confidently point out which regressors matter most, which regressors can be excluded, and how these regressors affect each other.
Traditionally, before any linear modelling is conducted, the data should be cleaned and made ready for use. Usually, linear regression modelling can be conducted by a statistical package which is capable of fitting linear models and computing a variety of model fit statistics [
65,
66]. Nevertheless, typical linear modelling analysis has some limitations, such as the following: it is powerless to automatically identify and handle outlying cases, the stepwise method has no ability to conduct all-possible-subsets regression; and existing criteria are in the form of significance assessments prone to Type I/II errors.
Given the limitations of the traditional regression procedure, a decision was made to use the Automatic Linear Modelling procedure, which is included in the IBM SPSS 27v package for linear modelling and accelerates the data analysis process through several automatic mechanisms.
The statistical analysis conducted by automatic linear model building was determined by using the defence expenditure as a target variable and sustainable development indicators which showed the statistically significant relationships with the target. The standard auto data preparation and 0.95 confidence level were used. Subsequently, the forward stepwise procedure for model selection technique [
67] and Akaike’s Information Criterion Corrected (AICC) for entry or removal regressors were chosen [
68]. Moreover, the random seed = 54,752,075 was set in case of replicating the conducted analyses. The basic information created by the Automatic Linear Modelling procedure models’ configurations are summarized below in
Section 4.
4. Research Results and Discussion
As has been mention above, this study focussed on the relationship between defence expenditure and sustainable development indicators. The investigations were performed by the IBM SPSS 27v software and research results focus on the variability of defence expenditure in the 2000–2018 period in three Baltic states as follows: Lithuania, Latvia, and Estonia, with those results presented below in
Section 4.1,
Section 4.2, and
Section 4.3, respectively.
4.1. The Relationship between Defence and Sustainable Development: The Lithuanian Case
The investigation started with the preliminary calculations. The conducted descriptive statistics helped to clarify defence expenditure tendencies in Lithuania in 2000–2018 (dependent variable, Y, [gov_10a_exp]). Additionally, sixteen variables of sustainability were identified, which were included in this study as the independent variables.
The preliminary analysis showed that defence expenditure (variable Y) varied from 159.1 to 782.8 million euros, and the average for that period reached 378.85 million euros.
Table 1 shows the descriptive statistical analysis results for the dependent variable (Y, [gov_10a_exp]), along with sixteen independent variables (
Table 2).
Taking into consideration the fact that this study focussed on the relationship between defence expenditure (Y = [gov_10a_exp]) and sixteen indicators of sustainability, it is important to discuss and compare spending on defence and other selected indicators.
Table 1 reveals that proof is available to show that the average spending figure for defence by the Lithuanian government reached 378.85 million euros, which accounts for 2.5 percent of purchasing-power-adjusted GDP per capita (X12 = [SDG_10_10], mean = 15.442 euros), which varied between 7.000 and 24.400 euros. Moreover, the other two economic factors that might influence defence expenditure are adjusted gross disposable income for households per capita (X13 = [SDG_10_20], mean = 12.399 euros), which varied between 6.278 and 18.478 euros, and real gross domestic product per capita (X1 = [SDG_08_10]), which varied between 5.230 and 13.390 million euros with an average of 9.333 million euros in the 2000–2018 period. Furthermore, EU imports from developing countries (X14 = [SDG_17_30]) expanded the increase from 304 million euros to 3.381 million euros, (mean = 1.643 million euros), and also had an impact in the 2000–2018 period.
The average of employment rate (X3 = [SDG_08_30]) gradually increased, reaching 70.13%. Unexpectedly high growth was detected for the gender employment gap (X5 = [SDG_05_30]), from a negative figure of −1.5% to a positive one of 8.40%, and with an average of 3.75%. Consequently, all of the indicators examined expanded the change, growing in the 2000–2018 period: final energy consumption (X6 = [SDG_07_11]) varied from 3.80 to 5.60 million TOE; energy productivity (X7 = [SDG_07_30]) from 2.29 to 4.67 KGOE; energy import dependency (X8 = [SDG_07_50]) varied from 40.61% to 79.05%; gross domestic expenditure on R&D (X9 = [SDG_09_10]) varied from 0.59% to 1.04%; human resources in science and technology (X10 = [SDG_09_21]) varied from 32.3% to 50.5%; R&D personnel by sector (X11 = [SDG_09_30]) varied from 0.59% to 0.85%; general government gross debt (X15 = [SDG_17_40]) varied from 14.60% to 42.50%; the share of environmental taxes in total tax revenues (X16 = [SDG_17_50]) varied from 5.34% to 9.68%; the investment share of GDP by institutional sectors (X2 = [SDG_08_11]) varied from 16.86% to 28.61%; and resource productivity and domestic material consumption (X4 = [SDG_12_20]) varied from 0.62 to 0.8 euros/kg.
Additionally, relationships were estimated between defence expenditure (Y = [gov_10a_exp]) and sixteen sustainable development indicators. The descriptive analysis showed that a few of the study variables were not normally distributed (see
Table 1). As a result, statistical rules were followed so that Spearman’s rho correlation coefficients could be calculated between variables that represent the Lithuanian case. The correlation analysis results are shown in
Table 3.
A high significant positive correlation was identified between defence expenditure and the following indicators: gross domestic product (GDP) per capita (Y and X1, r = 0.86, p < 0.01); employment rate (Y and X3, r = 0.85, p < 0.01); final energy consumption (Y and X6, r = 0.94, p < 0.01); energy productivity (Y and X7, r = 0.76, p < 0.01); purchasing-power-adjusted GDP per capita (Y and X12, r = 0.84, p < 0.01); adjusted gross disposable income of households per capita (Y and X13, r = 0.83, p < 0.01); and EU imports from developing countries (Y and X14, r = 0.83, p < 0.01).
Additionally, a significant negative correlation was identified between defence expenditure and the share of environmental taxes out of total tax revenues (Y and X16, r = −0.56, p < 0.05). Moreover, no statistically significant relationships were identified between defence expenditure and other indicators, as follows: investment share of GDP by institutional sectors (X2, p > 0.05); resource productivity and domestic material consumption (X4, p > 0.05); gender employment gap (X5, p > 0.05); energy import dependency (X8, p > 0.05); gross domestic expenditure on R&D (X9, p > 0.05); and general government gross debt (X15, p > 0.05). These six indicators of sustainability were eliminated from further Lithuanian casework investigations. For the purposes of the calculations for Automatic Linear Modelling (ALM), ten indicators were included that proved the statistically significant relationships with defence expenditure.
Automatic Linear Modelling Results: The Lithuanian Case
In order to be able to identify the relationship, defence expenditure as a dependent variable (Target = Y) and ten of the sixteen statistically significant indicators of sustainability, which represented the independent variables, were chosen. Consequently, the SPSS 27v software was used and the Automatic Linear Modelling (ALM) analysis was conducted. According to the ALM procedure, this study used automatic data preparation which made it possible to avoid shortcomings in the collected dataset and permitted the internal procedure to be carried out in terms of the transformation of the target and predictors in order to maximise the predictive power of the designed model.
ALM and forward stepwise regression (FSR) were employed to create a conceptual model by reasoning to explain defence expenditure for Lithuania within the 2000–2018 period. Automatic modelling from sixteen possible indicators included ten variables: X1, X3, X6, X7, X10, X11, X12, X13, X14, and X16. Subsequently, a model was designed according to the Best Subsets Selection (BSS) rule, with these being assessed and validated by the Akaike’s Information Criterion Corrected (AICC) rate. The variables that were not significant were omitted. The FSR final model indicated the higher accuracy (AICC = 159.521) result, which means that these can be used to predict defence expenditure (Target = Y) in the case of Lithuania by means of two sustainable indicators (X3 and X11). Additionally, ALM was used to calculate the coefficient of determination at 0.876, and this proved that these two variables account for 87.6% (R2*100 = 87.6%) of changes in the target variable, and the rest—a total of 12.4%—are caused by other variables.
Moreover, ALM presents the effects of two indicators (X3 and X11) in a chart, which helps to visualise the predictor’s importance according to the arrangement of model variables which are listed from top to bottom by effect decrease, and with the greater line corresponding to the more significant effects (smaller
p-value). Correspondingly, the ALM presents variables that are included in the model importance rating, which was evaluated through ANOVA analysis. The effect for the X3 variable which represents the employment rate [SDG_08_30] was very high according to the F-test (FX3 importance = 0.839,
p < 0.00), while for the X11 variable—which represents R&D personnel [SDG_09_30]–the F-test identified a low effect, but one which was still statistically important (F
X11 importance = 0.161,
p < 0.002). The visualisation of how sustainable development indicators (X3 and X11) affect Target = Y is presented in
Figure 1a.
Additionally, ALM analysis presents the coefficient estimation results in chart form and in table form. The graphically presented results display the intercept first, and then sort the model’s variables by effect from top to bottom by decreasing predictor importance levels. Moreover, connecting lines in the diagram are coloured by using as a basis the sign of the coefficient and being weighted based on coefficient significance. Following the compilation of this information, it can be seen that the intercept has a negative sign and the two indicators of sustainability (X3 and X11) are positive (see
Figure 1b). The detailed information for the constructed FSR model is presented in
Table 4.
The regression model as constructed can be expressed by the following equation:
where Y—defence expenditure [gov_10a_exp] intercept is a constant in the model, X3—employment rate [SDG_08_30], and X11—R&D personnel [SDG_09_30].
The designed FSR model which is presented in Equation (1) was validated. It showed a level of statistical significance. The model’s accuracy is presented in graph format (see
Figure 2) for the defence expenditure prediction by two economic indicators in Lithuania in the 2000–2018 period.
4.2. The Relationship between Defence and Sustainable Development: The Latvian Case
The dataset analysis for the Latvian case began with the preliminary investigations. The descriptive statistics which were collected helped to clarify trends regarding defence expenditure in Latvia in the 2000–2018 period (dependent variable, Y, [gov_10a_exp]). Additionally, sixteen variables of sustainability were identified, which were included in this study as independent variables.
The preliminary analysis showed that defence expenditure (variable Y) in Latvia varied from 72.6 to 616.3 million euros, and the average for the period between 2000 and 2018 reached an amount of 240.22 million euros. These descriptive statistical analysis results for the dependent variable (Y = [gov_10a_exp]) and sixteen independent variables are presented in
Table 5.
This study focuses on the relationship between defence expenditure (Y = [gov_10a_exp]) and sustainable development indicators. Firstly, it is important to discuss and compare spending on defence and other areas.
Table 4. shows that proof exists that the average amount which was directed towards defence expenditure by the Latvian government amounted to 240.22 million euros, which accounts for 1.8% of purchasing-power-adjusted GDP per capita (X12 = [SDG_10_10], mean = 13.747.37 euros), which varied from 6.700 to 20.900 euro. Moreover, the other two economic factors which might influence defence expenditure are the adjusted gross disposable income of households per capita (X13 = [SDG_10_20], mean = 10.247.63 euros), which varied from 5.239 to 15.189 euros, and real gross domestic product per capita (X1 = [SDG_08_10]), which varied from 5.210 to 12.180 million euros with an average figure of 8.994.74 million euros in 2000–2018. Furthermore, EU imports from developing countries (X14 = [SDG_17_30]) were expected to increase from 79 million euros to 1.468 million euros, (mean = 789.05 million euros), and this also had an impact on the 2000–2018 period.
The average figure for the employment rate (X3 = [SDG_08_30]) gradually increased, reaching 69.8%. Unexpectedly high growth was detected for the gender employment gap (X5 = [SDG_05_30]), from a negative figure of −0.5% to a positive one of 10.2%, with an average of 5.94%. Consequently, all of the expected economic indicators which were examined for growth in the 2000–2018 period were as follows: final energy consumption (X6 = [SDG_07_11]), which varied from 3.30 to 4.40 million TOE; energy productivity (X7 = [SDG_07_30]), which ranged from 3.02 to 4.04 KGOE; energy import dependency (X8 = [SDG_07_50]), which varied from 40.59% to 69.42%; gross domestic expenditure on R&D (X9 = [SDG_09_10]), which varied from 0.36% to 0.69%; human resources in science and technology (X10 = [SDG_09_21]), which varied from 30.70% to 44.40%; R&D personnel (X11 = [SDG_09_30]), which varied from 0.46% to 0.61%; general government gross debt (X15 = [SDG_17_40]), which varied from 8.50% to 47.90%; share of environmental taxes in total tax revenues (X16 = [SDG_17_50]), which varied from 7.16% to 11.75%; investment share of GDP by institutional sectors (X2 = [SDG_08_11]), which varied from 19.12% to 36.25%; and resource productivity and domestic material consumption (X4 = [SDG_12_20]), which varied from 0.68 to 1.07 euros/kg.
Additionally, the relationship was estimated between defence expenditure (Y = [gov_10a_exp]) and sixteen sustainable economic indicators. The descriptive analysis showed that a few of the study variables were not normally distributed (see
Table 4). Subsequently, by following the statistical rules, Spearman’s rho correlation coefficients were calculated between the variables that represented the Latvian case. The correlation analysis results are available in
Table 6.
A high significant positive correlation was identified between defence expenditure and the following indicators: gross domestic product (GDP) per capita (Y and X1, r = 0.93, p < 0.01); employment rate (Y and X3, r = 0.87, p < 0.01); energy productivity (Y and X7, r = 0.95, p < 0.01); human resources in science and technology (Y and X10, r = 0.83, p < 0.01); R&D personnel (Y and X11, r = 0.76, p < 0.01); purchasing-power-adjusted GDP per capita (Y and X12, r = 0.86, p < 0.01); and adjusted gross disposable income of households per capita (Y and X13, r = 0.89, p < 0.01).
Moreover, no statistically significant relationships could be identified between defence expenditure and other variables, such as the investment share of GDP by institutional sectors (X2, p > 0.05), resource productivity and domestic material consumption (X4, p > 0.05), gender employment gap (X5, p > 0.05), energy import dependency (X8, p > 0.05), gross domestic expenditure on R&D (X9, p > 0.05), and general government gross debt (X15, p > 0.05). These six economic indicators were eliminated from further investigation in terms of the Latvian case. For the purposes of Automatic Linear Modelling (ALM), ten indicators of sustainability were included which proved the statistically significant relationships with defence expenditure.
Automatic Linear Modelling Results: The Latvian Case
ALM and forward stepwise regression (FSR) were employed to create a conceptual model and to explain defence expenditure for the Latvian case in 2000–2018. Automatic modelling included ten variables as follows: X1, X3, X6, X7, X10, X11, X12, X13, X14, and X16. Subsequently, a model was designed according to the Best Subsets Selection (BSS) rule, and these were assessed and validated by the Akaike’s Information Criterion Corrected (AICC) rate. The variables were omitted as they were not significant for this model. The FSR final model indicated the higher accuracy result (AICC = 159.271) and can be used to predict Latvia’s defence expenditure (Target = Y) by means of two sustainable development indicators (X13 and X16). Additionally, ALM calculated the coefficient of determination as being 0.817, which proved that these two variables served to account for 81.7 percent (R2*100 = 81.7%) of changes in the target variable, while the rest—a total of 18.3%—were caused by other effects.
Moreover, ALM presented the effects of two sustainable development indicators (X13 and X16) in chart form, in which the greater line corresponds to the more significant effect of the X13 variable. In turn, the importance of those variables which have been included in the model was evaluated by means of an ANOVA analysis, which proved the high-level effect according to the F-test (F
X13 importance = 0.874,
p < 0.00) for the X13 variable, which represents the adjusted gross disposable income of households per capita [SDG_10_20], and for the X16 variable, which represents the share of environmental taxes in total tax revenues [SDG_17_50]. The F-test categorises a low but still statistically important effect (F
X16 importance = 0.126,
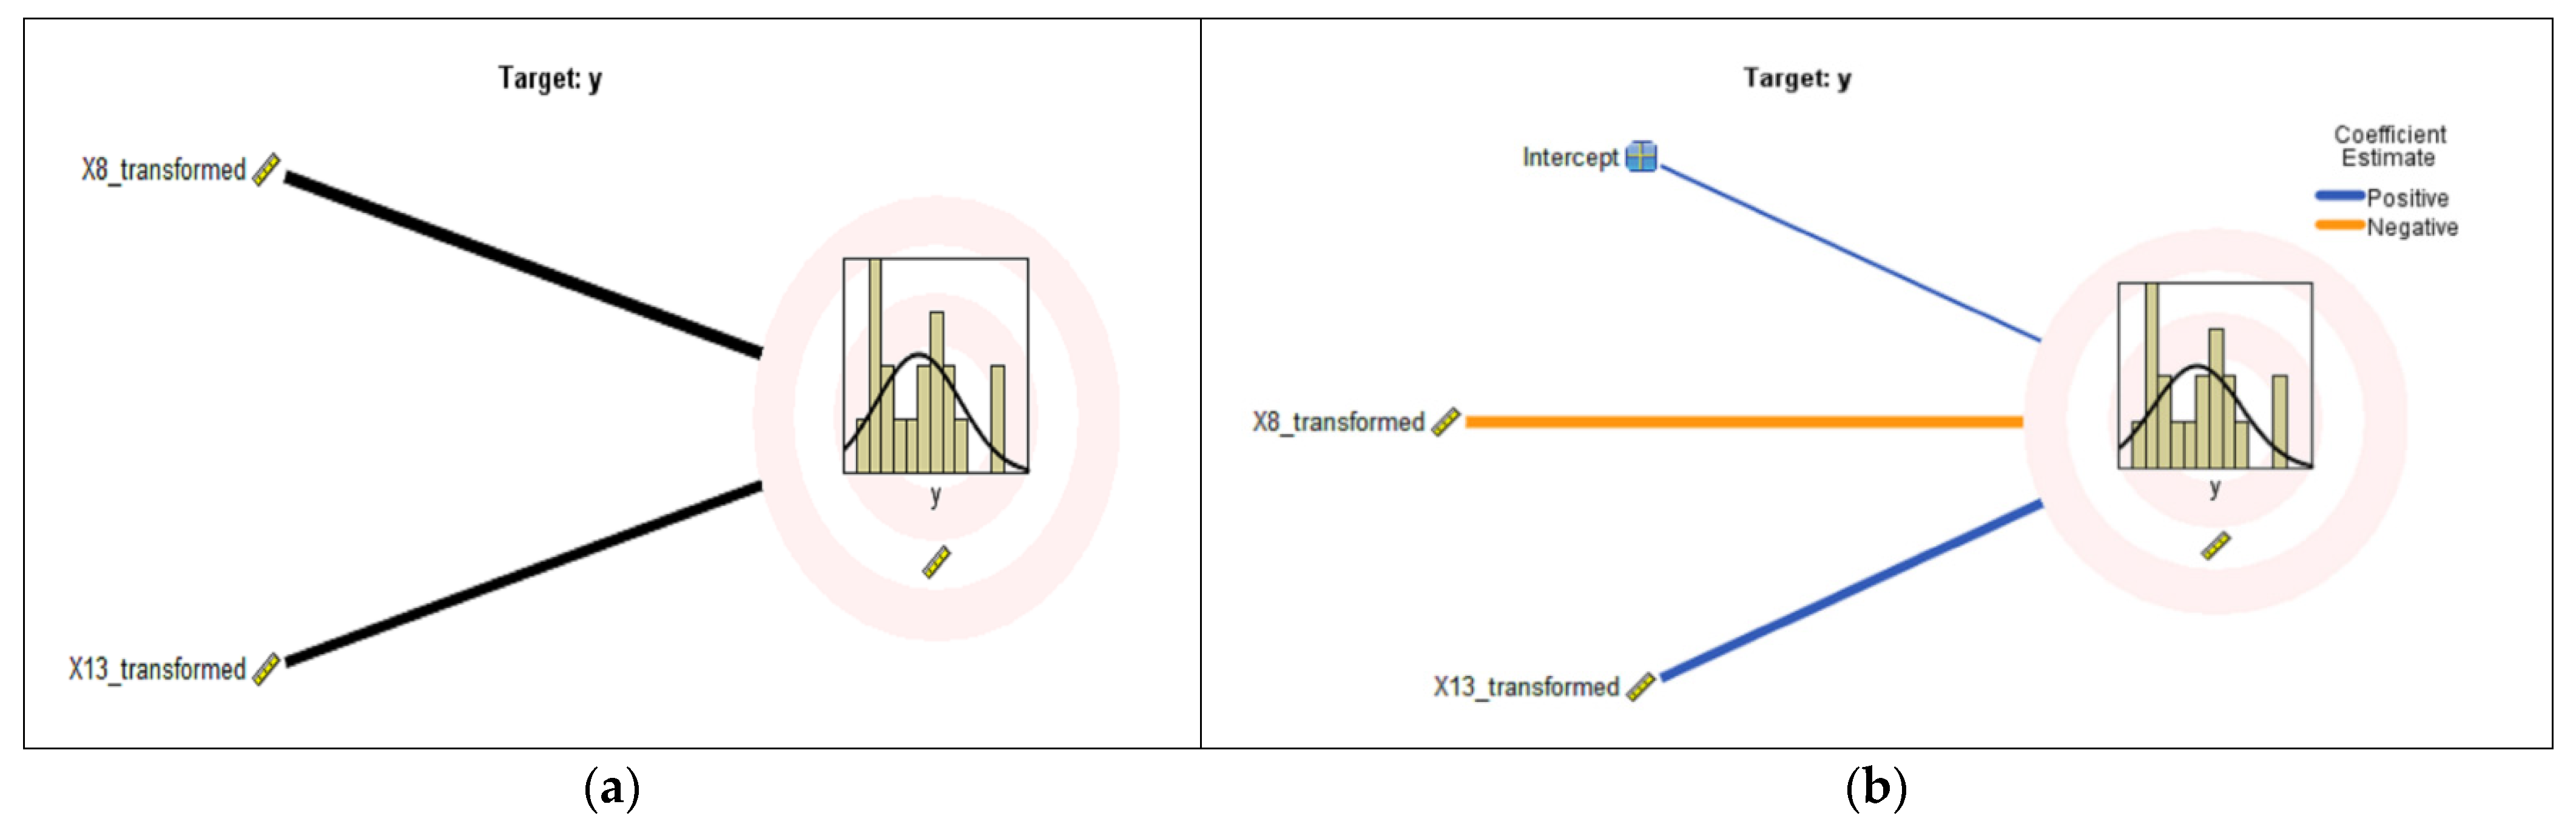
p < 0.008). The visualisation of how indicators of sustainability (X13 and X16) affect Target = Y is presented in
Figure 3a.
Additionally, ALM analysis presented the coefficient estimation results in the form of a chart (see
Figure 3b) and as a table (see
Table 7).
In terms of a graphical display, the analysis results presented the intercept first, and then sorted by effect variables that were included in the designed model (see
Figure 3b). In addition, connecting lines in the diagram are coloured by using as a basis the sign of the coefficient and are weighted depending upon coefficient significance. Therefore, it can be seen that the intercept had a positive significance as one of two X13 sustainable development indicators, while the X16 variable had a negative significance (see
Figure 3b). The detailed information in terms of the constructed FSR model for the Latvian case is presented in
Table 7. In addition, the regression model as constructed is expressed by the following equation:
where Y is defence expenditure [gov_10a_exp], with the intercept a constant in the model (value = 26.222), X13 is the adjusted gross disposable income of households per capita [SDG_10_20], and X16 is the share of environmental taxes in total tax revenues [SDG_17_50].
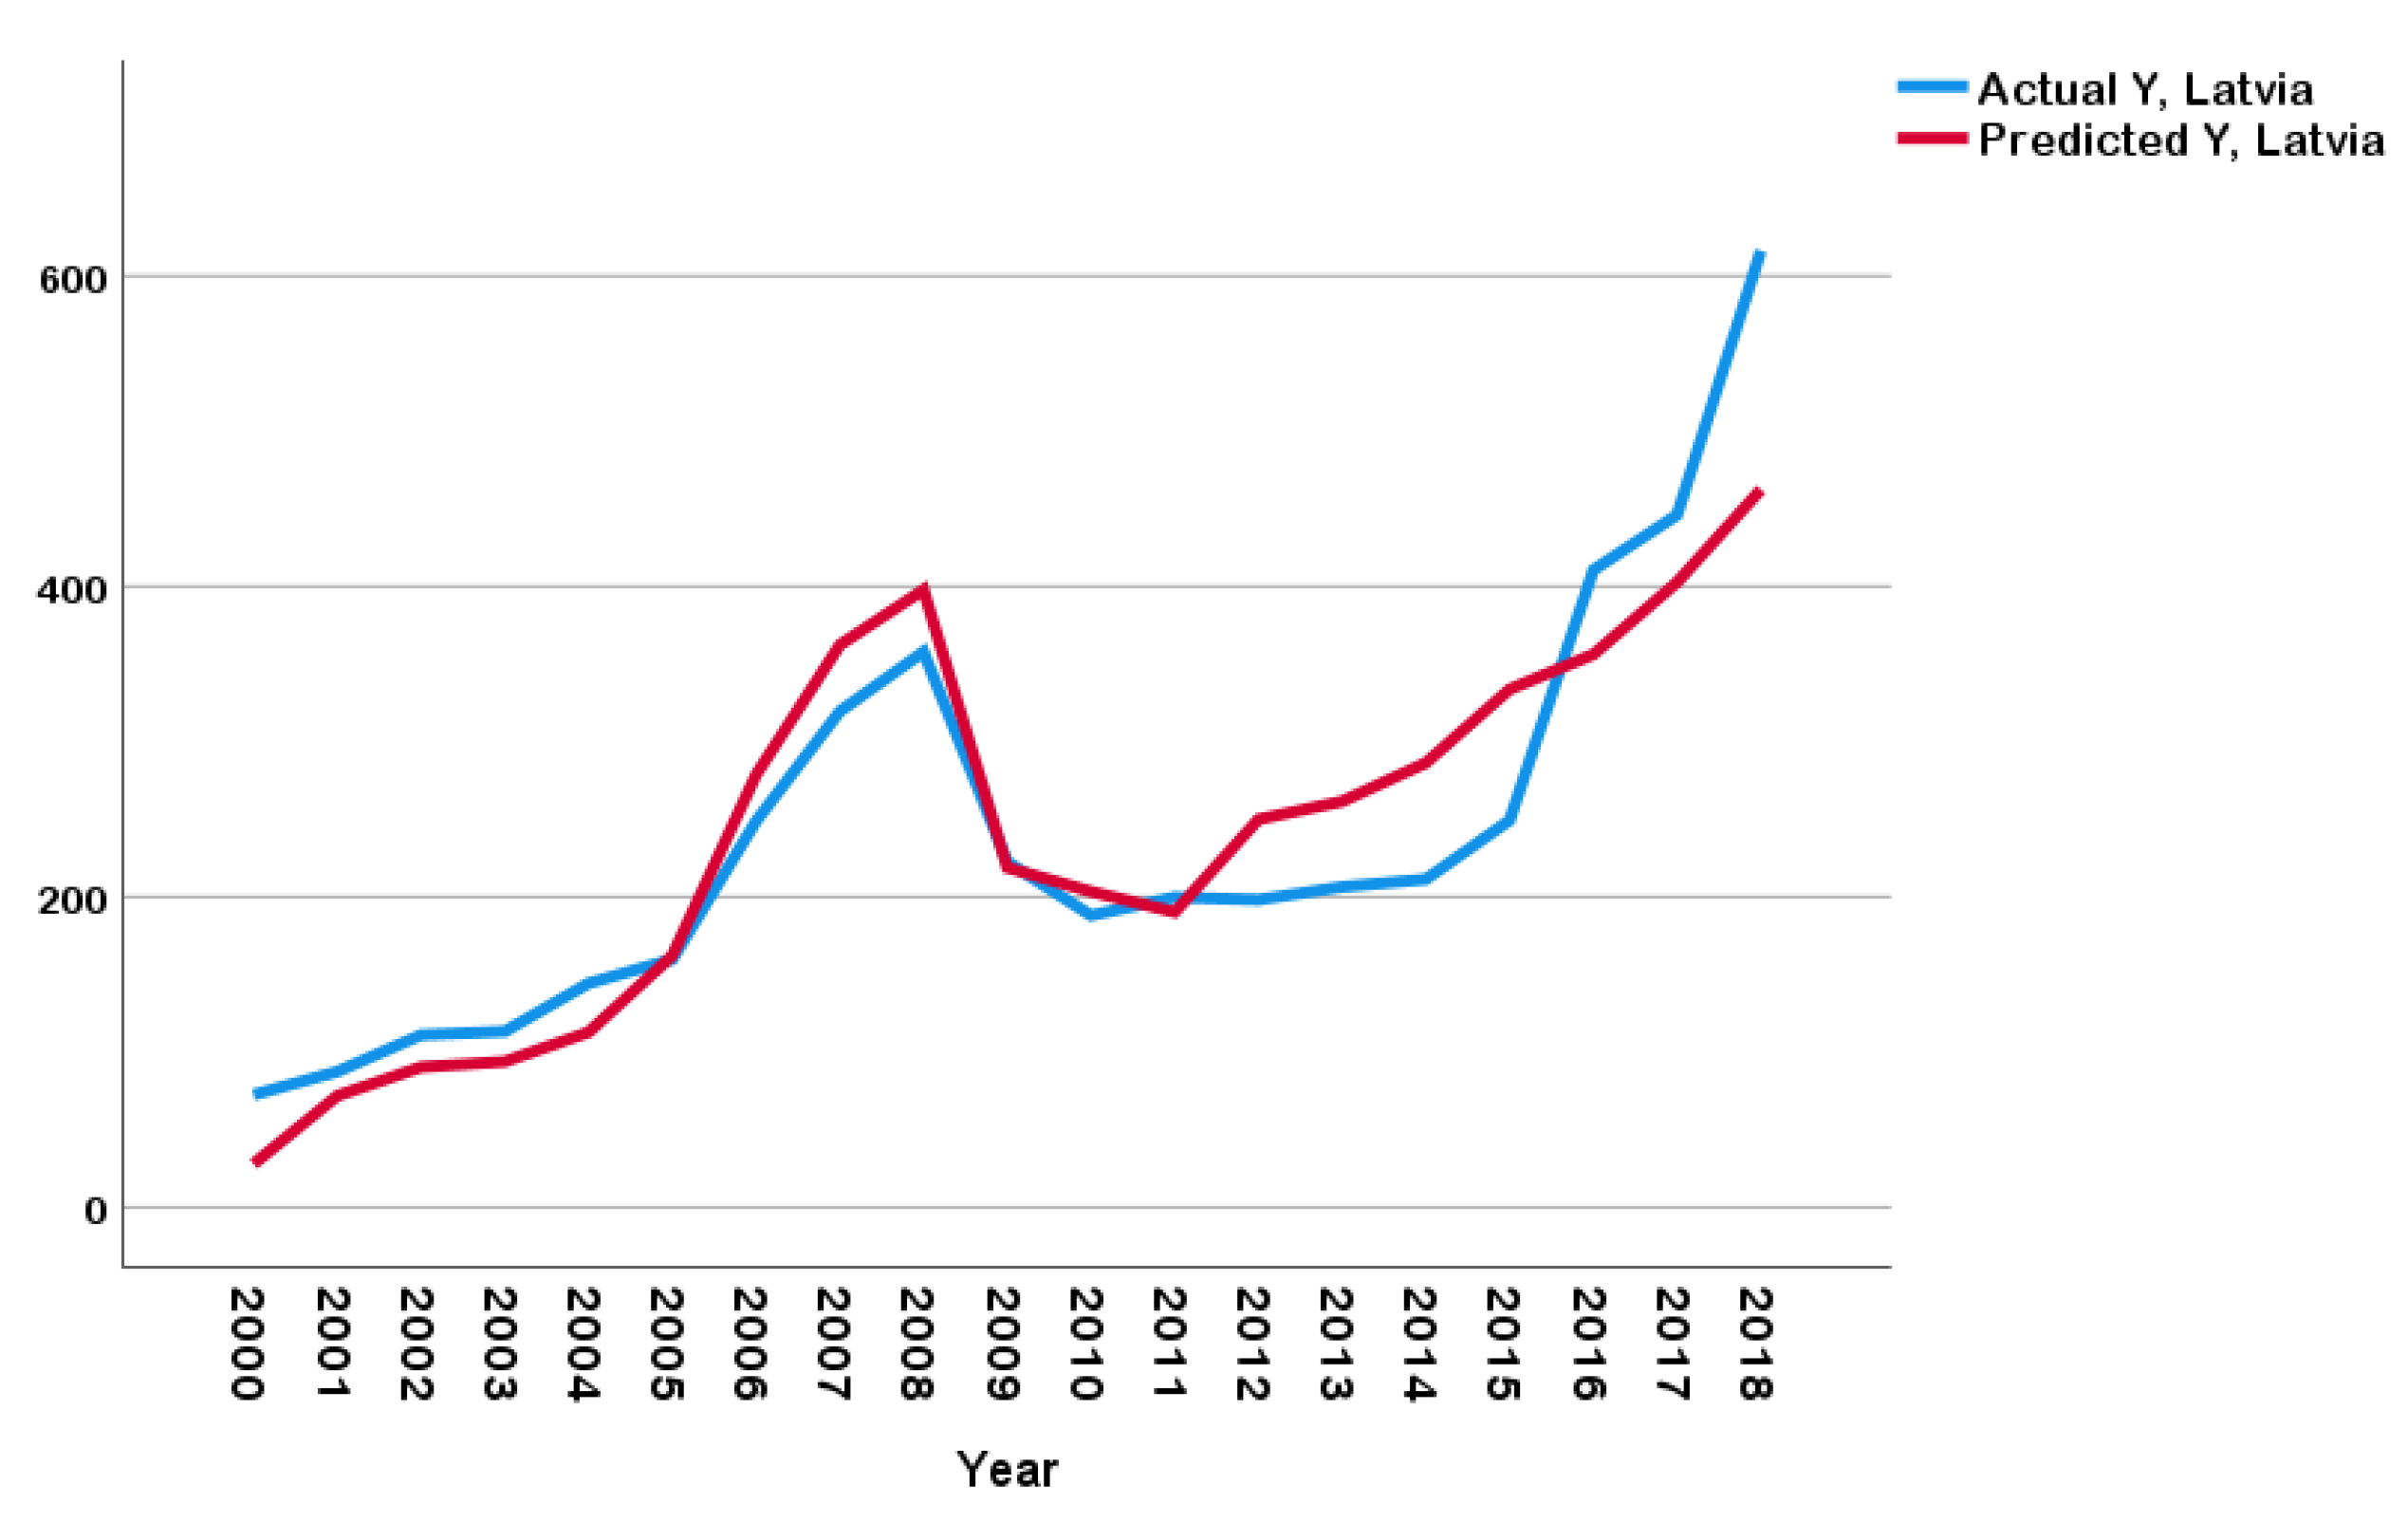
The designed FSR model presented in Equation (2) was validated and showed a statistical significance. Model accuracy for the defence expenditure prediction in Latvia by two economic indicators is presented in
Figure 4.
4.3. The Relationship between Defence and Sustainable Development: The Estonian Case
The dataset analysis in the Estonian case began with preliminary investigations. The descriptive statistics that were conducted helped to clarify trends regarding defence expenditure (dependent variable, Y, [gov_10a_exp]) in Estonia in the period between 2000–2018. Additionally, sixteen variables of sustainability were identified, which were included in this study as the independent variables.
The preliminary analysis showed that defence expenditure (variable Y) in Estonia varied from 50.6 to 510.4 million euros in 2000–2018, and that the average for that period reached 242.19 million euros. These descriptive statistical analysis results for the dependent variable (Y, [gov_10a_exp]) and the sixteen independent variables are presented in
Table 8.
In case this study focussed too closely on the relationship between defence expenditure (Y= [gov_10a_exp]) and the sixteen sustainable development indicators, first of all it is important to discuss and compare spending on defence and other areas. Table 4.13 shows that that the average spend for defence by the Estonian government amounted to 242.19 million euros, which accounts for 1.5% of purchasing-power-adjusted GDP per capita (X12 = [SDG_10_10], mean = 16.515.79 euros), which varied between 7.800 and 24,800 euros. Moreover, the other two economic factors that might be able to influence defence expenditure are real gross domestic product per capita (X1 = [SDG_08_10]), which varied from 7.570 to 15.070 million euros, with an average figure of 11.674.21 million euros, and the adjusted gross disposable income of households per capita (X13 = [SDG_10_20], mean = 11.317.05 euros), which varied from 6.123 to 16.674 euros. Furthermore, EU imports from developing countries (X14 = [SDG_17_30]) extended the increase from 308 million euros to 1.578 million euros, (mean = 829.11 million euros), and had an impact within the 2000–2018 period.
The average figure for the employment rate (X3 = [SDG_08_30]) gradually increased until it reached 72.75%. The investment share of GDP by institutional sectors (X2 = [SDG_08_11]) varied from 21.06% to 36.82% (with an average at 28.21%). Unexpectedly high growth was detected for energy import dependency (X8 = [SDG_07_50]), which varied from 0.74% to 33.99%, with an average figure of 20.76%.
Consequently, all of the indicators that were examined predicted change and growth as follows: resource productivity and domestic material consumption (X4 = [SDG_12_20]) varied from 0.62 to 0.8 euros/kg; the gender employment gap (X5 = [SDG_05_30]) varied from 1.90% to 8.80%, with an average of 6.71%; final energy consumption (X6 = [SDG_07_11]) varied from 2.40 to 3.10 million TOE; energy productivity (X7 = [SDG_07_30]) varied from 2.19 to 3.13 kg KGOE; gross domestic expenditure on R&D (X9 = [SDG_09_10]) varied from 0.60% to 2.28%; human resources in science and technology (X10 = [SDG_09_21]) varied from 38.10% to 52.00%; R&D personnel (X11 = [SDG_09_30]) varied from 0.56% to 0.93%; general government gross debt (X15 = [SDG_17_40]) varied from 3.80% to 10.60%; and the share of environmental taxes in total tax revenues (X16 = [SDG_17_50]) varied from 5.44% to 8.85%.
Additionally, relationships were estimated between defence expenditure (Y = [gov_10a_exp]) and sixteen sustainable development indicators. The descriptive analysis showed that a few of the study variables were not normally distributed (see
Table 7). Accordingly, following the established statistical rules, Spearman’s rho correlation coefficients were calculated between the variables that represented the Estonian case. The correlation analysis results are shown in
Table 9.
A high significant positive correlation was identified between defence expenditure and other indicators, such as gross domestic product (GDP) per capita (Y and X1, r = 0.88, p < 0.01); human resources in science and technology (Y and X10, r = 0.94, p < 0.01); R&D personnel (Y and X11, r = 0.94, p < 0.01); purchasing-power-adjusted GDP per capita (Y and X12, r = 0.95, p < 0.01); adjusted gross disposable income of households per capita (Y and X13, r = 0.97, p < 0.01); EU imports from developing countries (Y and X14, r = 0.77, p < 0.01); and the share of environmental taxes in total tax revenues (Y and X16, r = 0.83, p < 0.01).
Additionally, a significant negative correlation was identified between defence expenditure and the investment share of GDP by institutional sectors (Y and X2, r = −0.64, p < 0.01) and energy import dependency (Y&X8, r = −0.96, p < 0.01). Moreover, no statistically significant relationships could be identified between defence expenditure and the following variables: resource productivity and domestic material consumption (X4, p > 0.05), gender employment gap (X5, p > 0.05), and final energy consumption (X6, p > 0.05).
These three economic indicators were eliminated from further investigations. For the purposes of Automatic Linear Modelling (ALM), thirteen indicators were included which proved the statistically significant relationships with defence expenditure.
Automatic Linear Modelling Results: The Estonian Case
The ALM and forward stepwise regression (FSR) were employed to create a conceptual model and to explain defence expenditure for Estonia in 2000–2018. Automatic modelling included thirteen variables: X1, X2, X3, X7, X8, X9, X10, X11, X12, X13, X14, X15, and X16. Subsequently, a model was designed according to the Best Subsets Selection (BSS) rule, with these being assessed and validated by Akaike’s Information Criterion Corrected (AICC) rate. The variables were omitted as they were not significant to the model. The FSR final model indicated a result that was of higher accuracy (AICC = 135.912), and it is this that can be used for predicting defence expenditure (Target = Y) in the Estonia by two economic indicators (X8 and X13). Moreover, ALM calculated the coefficient of determination as being 0.945, and this proved that these two variables accounted for 94.5 percent (R2*100 = 94.5%) of changes in the target variable, while the rest—at 5.5%—were are caused by other effects.
Additionally, the ALM presented the effects of two indicators of sustainability (X8 and X13) in chart form, with the greater line corresponding to the more significant effect of the X13 variable. In turn, the importance of those variables that were included in the model was evaluated by means of an ANOVA analysis, which proved the high-level effect according to the F-test (F
X8 importance = 0.574,
p < 0.002) for the X8 variable, which represents energy import dependency [SDG_07_50], and for the X13 variable, which represents the adjusted gross disposable income of households per capita [SDG_10_20], while the F-test labels provided a slightly lower statistically important effect (F
X13 importance = 0.426,
p < 0.006). The visualisation of how sustainable development indicators (X8 and X13) affect Target = Y is presented in
Figure 5a.
Additionally, ALM analysis presented the coefficient estimation results in the form of a chart (see
Figure 5b) and as a table (see
Table 10).
In graphical terms, the analysis results presented the intercept first and then sorted by effect the variables that were included in the designed model (see
Figure 5b). In addition, connecting lines in the diagram are coloured by using as a basis the sign of the coefficient, and are weighted based on coefficient significance. With the aforementioned information in mind, it can be seen that the intercept had a positive sign as one of two economic indicators X13; however, the variable X8 had a negative sign (see
Figure 5b). The detailed information for the constructed FSR model in the Estonian case is presented in
Table 10. In addition, the regression model which was constructed is expressed by the following equation:
where Y is defence expenditure [gov_10a_exp], the intercept is a constant in the model (value = 169.971), X8 is energy import dependency [SDG_07_50], and X13 is the adjusted gross disposable income of households per capita [SDG_10_20].
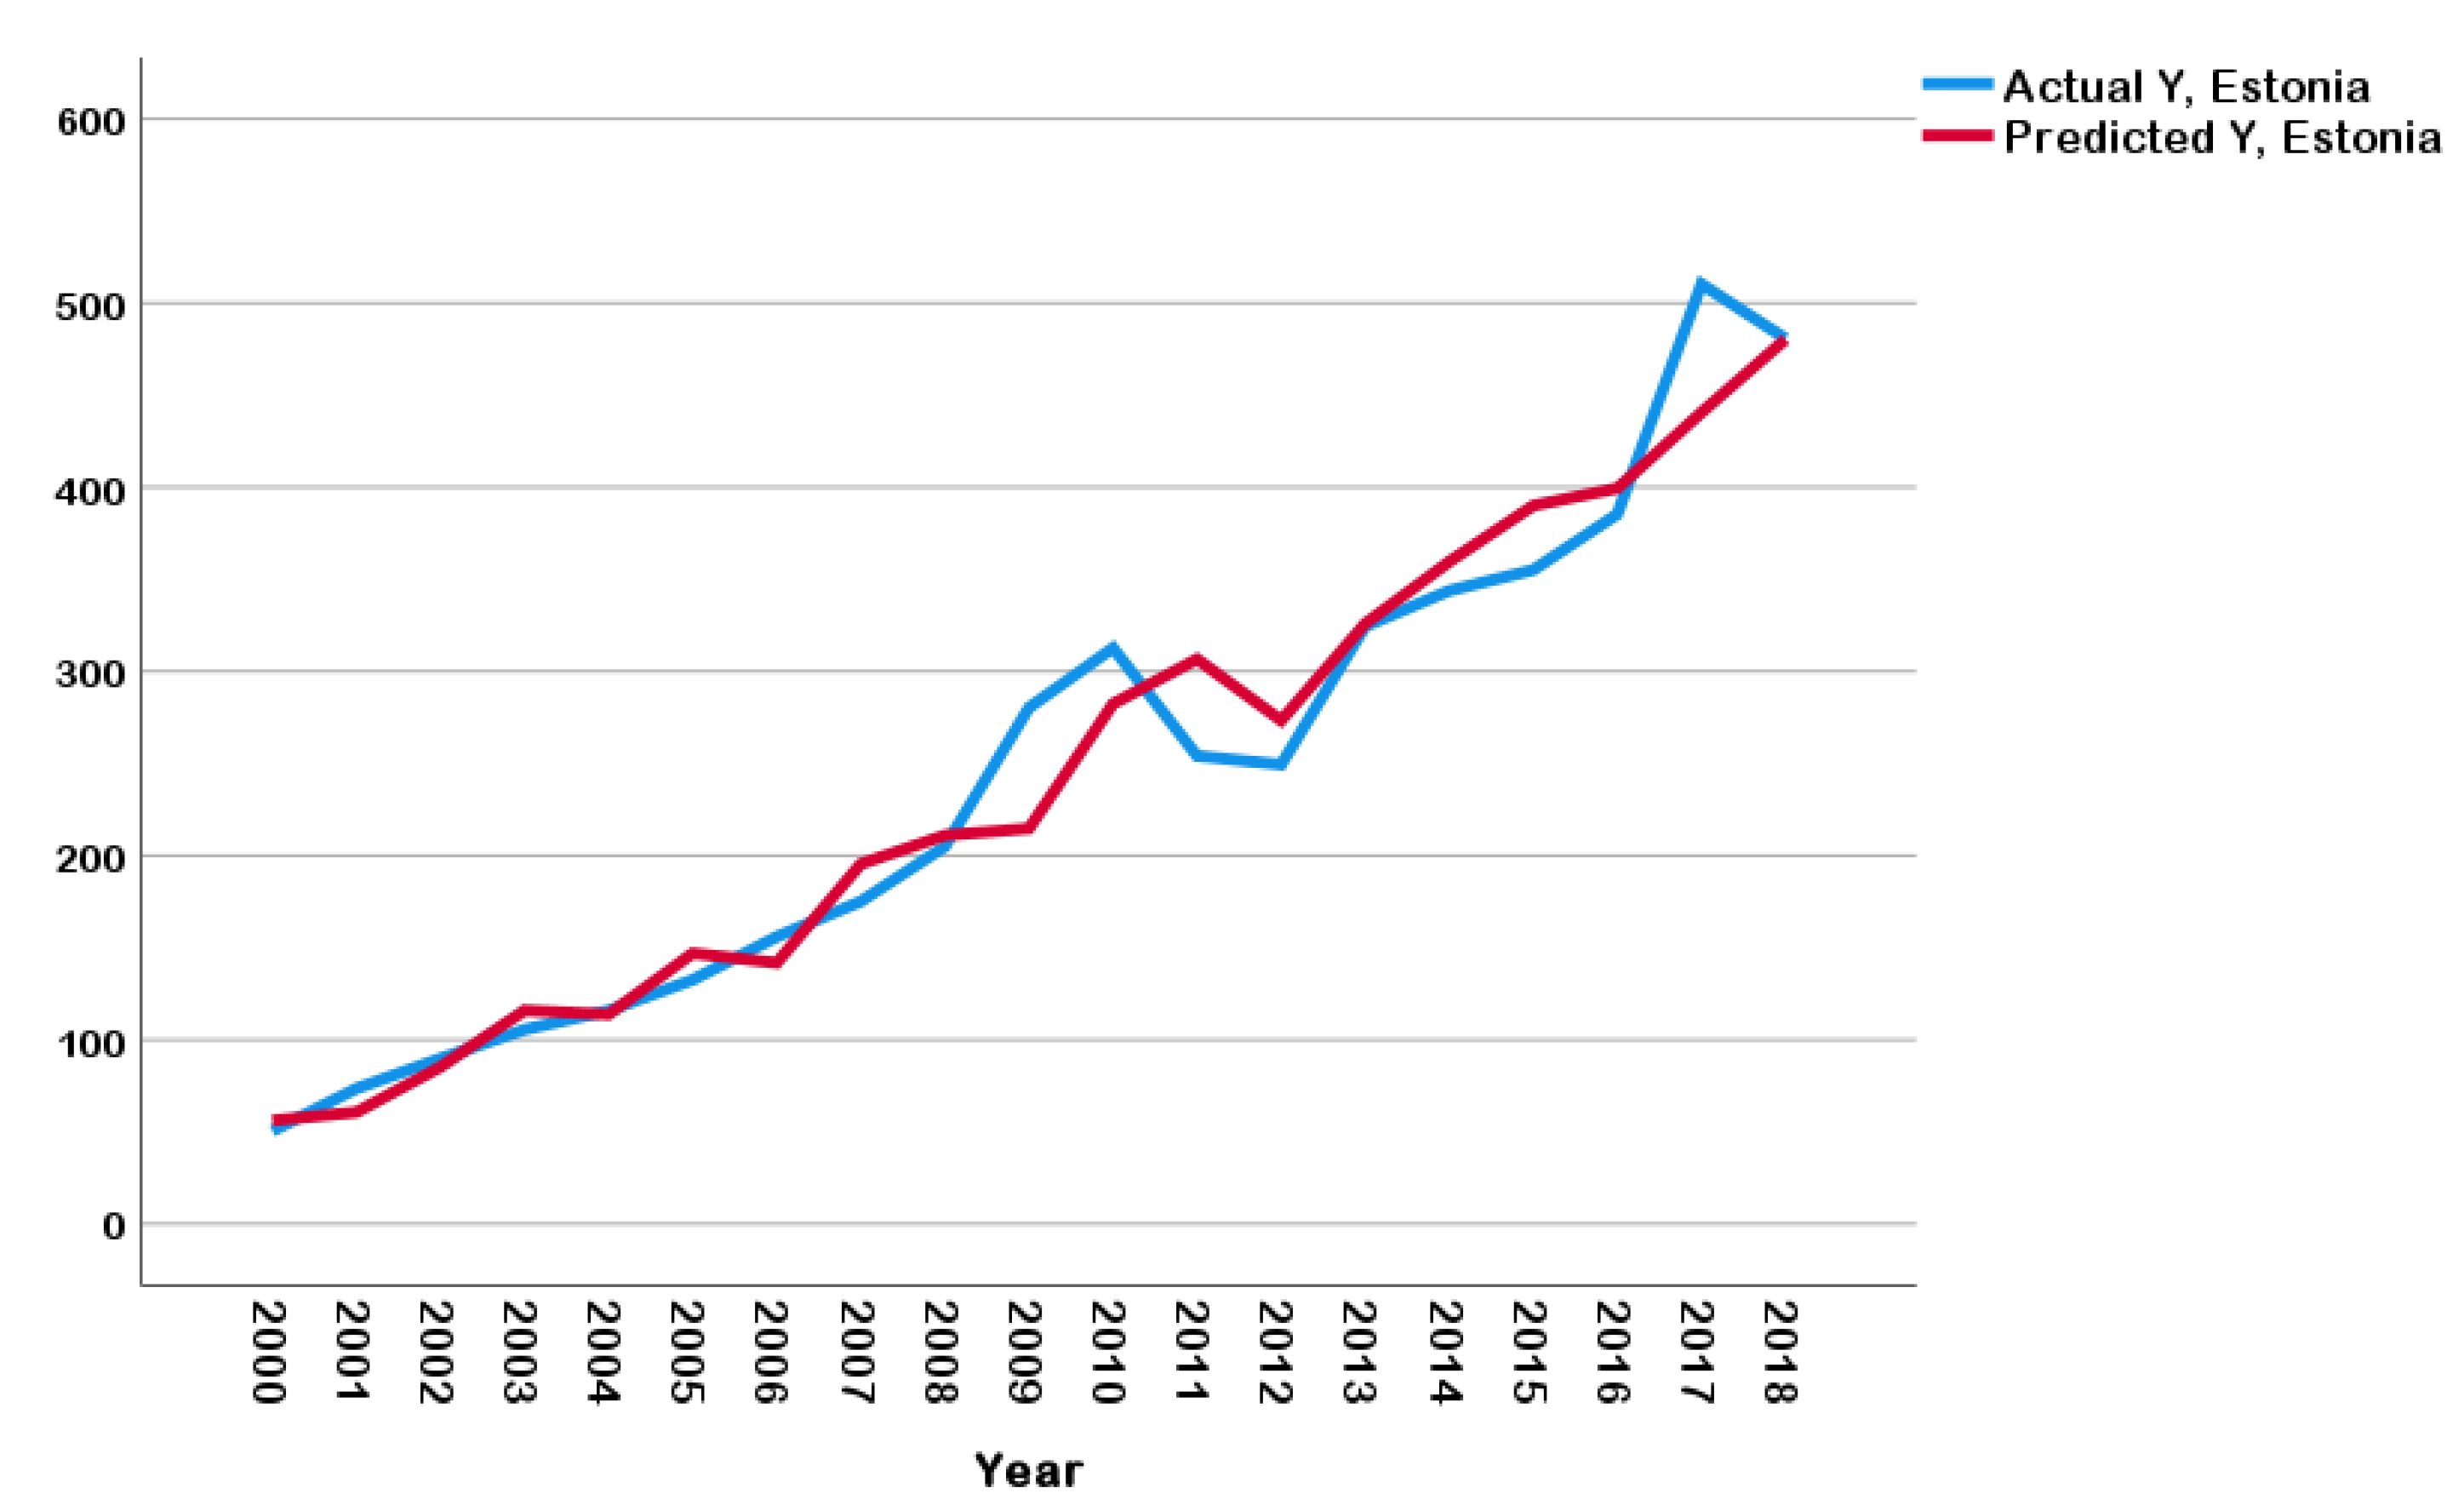
The designed FSR model which is presented in Equation (3) was validated and showed a statistical significance. Model accuracy for the defence expenditure prediction in Estonia by two indicators of sustainability is presented in
Figure 6.
5. Discussion
Defence expenditure is one of the most important elements of the public finances and national welfare of any state. The importance of the defence and security sector, as well as its mission, both of which relate directly to its capabilities, are financed by the state from the collective budget. In the majority of cases, strategic defence governance, which is enacted through sustained defence planning, NATO membership, and other multi-annual programmes, depends on a country’s financial stability. The latter, in turn, pertains to and influences other state areas, such as social, economic, cultural, environmental, etc. Therefore, defence funding is also influenced by other factors, including economic, social, environmental, and geopolitical factors, as well as cooperation, etc. The task of assessing the impact of these factors in terms of defence funding is an ambitious one which requires a broad scope of indicators, a sufficient statistics sample, and appropriate assessment methods. It is our position that this is a very broad and relevant issue which requires a good deal more comprehensive research. The most frequently studied relationships in academic literature are between defence and economic growth [
2,
3,
4,
5] and defence and social indicators [
7,
8,
9,
10,
11,
12,
14], as well as between defence and energy consumption [
15,
62]. Scientific research in various countries often produces conflicting results. It is possible to make an assumption with regard to many factors serving to indirectly affect the field being studied, often by affecting several areas, and these effects are not necessarily unidirectional. Our study demonstrated that the sustainable development indicators that were provided by Eurostat are not detailed enough, that the data are dominated by the period between 2000 and 2018, and that some indicators are only included every two years. As a result, we had an issue with regard to the selection of indicators. In the end, we selected sixteen indicators that had been recorded since 2000 and that reflected the economic, social, environmental, and mutual cooperation aspects of sustainable development. Defence expenditure depends upon political, strategic, and economic factors [
16]. The authors of this article focussed on economic factors alone and left out other determinants, such as political and strategic aspects, for future study. This is the main limitation of the research. However, it is our position that the findings may be used to ensure both the security of the country and the implementation of the Sustainable Development Goals.
The study is original due to a lack of research which properly assesses the impact of sustainable development indicators of defence. Moreover, this study extends the scope of scientific research and may serve to create a space for other researchers when it comes to conducting similar investigations. The results of the research revealed differences among the Baltic countries within the context of the relationship between defence and sustainable development. In Lithuania, the employment rate and R&D personnel as a share of the active population were found to be major factors in defence funding, explaining approximately 88% of the variation in defence expenditure. In Latvia, it was the gross disposable income of households per capita and the share of environmental taxes in total tax revenue which impacted defence spending and explained approximately 82% of the changes in the target variable, this being defence expenditure. The results from Estonia demonstrated that energy import dependency and the gross disposable income of households per capita both served to affect defence spending. This combination of factors explained approximately 95% of the dynamics in terms of defence expenditure in this country.
Previous investigations have shown that some researchers examine the links between defence spending and individual areas of sustainable development, such as economic, social, and environmental. The authors have not found similar studies that involve defence expenditure and all areas of sustainable development in the same research. Moreover, the investigations apply different methods, which poses a problem of comparability of results. Nevertheless, the authors provide some comparative insights below.
This study is in line with the research by Smaliukienė [
69], where she integrates the three fields of sustainability, i.e., economic, social, and environmental. The investigation partially supports previous studies by Pradhan [
70] and Kollias and Paleologou [
71], where unidirectional causality was found, running from economic growth to defence expenditure. Moreover, the authors agree with the insights of Mosher et al. [
72], Becker [
15], and Samaras et al. [
62], when they present a convergence of military and environmental decision-making. Few previous studies have been devoted to investigating the relationship between defence expenditure and employment issues [
73,
74]. The findings of Yildirim and Sezgin [
73] revealed that military expenditure affects employment, while our research showed the opposite situation, that employment rate impacts defence expenditure in the Lithuanian case. The authors noticed that in the scientific literature, there is no agreement concerning this issue. The case of Lithuania revealed a statistically significant impact of R&D personnel on defence expenditure. The persons contributing to R&D include highly trained scientists and researchers, technicians with high levels of technical experience and training, and supporting staff who contribute to carrying out R&D projects and activities [
75]. The defence sector requires innovation and new technologies to meet new threats. According to Hartley [
16], the defence budget buys personnel and other supporting inputs to provide defence output in the form of peace, protection, and security. The authors also assessed the impact of energy import dependency on the defence sector in Lithuania, Latvia, and Estonia. Correlation analysis showed that there is a relationship between defence spending and energy imports in all three Baltic countries, but a statistically significant relationship was found only in Estonia. We can make a general assumption that the Estonian defence sector is more sensitive to fluctuations in energy imports than in Lithuania and Latvia. In order to identify the reasons for the differences in the results obtained, further research is needed in the future. According to Becker [
15], the achievement of energy efficiency in the defence sector will give significant environmental benefits. The authors suggest that the main directions for the implementation of the findings are as follows: (1) to incorporate the findings into the policies of Baltic countries as they relate to sustainable development; (2) to implement the results in the planning processes for defence expenditure; (3) to use the findings to expand the scope of research in other countries; and (4) to apply the findings in university studies by teaching subjects that are related to defence economics, public security, etc. The authors acknowledge that the main aim of this research may be incomplete and disputable. In the future, supplementary investigations involving other indicators of sustainable development as well as factors which could include political and strategic elements should also be included in order to present the full picture of those factors which serve to influence defence expenditure and their impact as described in quantitative terms.


 ,
, 


