1. Introduction
The main aim of this paper is to reveal the available capacity of water transport in the Danube Region and to propose how it could be possible to use this available capacity related to changes of transport flows from road transport to more environmentally friendly means of transport. There are two partial aims. One is to use regression analysis to reveal the potential of the Danube as an alternative way of transport with sufficient capacity for the transportation of different types of cargo. The second partial aim is to show how the use of this waterway and its capacity could help to reduce the overall amount of CO
2 emissions in Europe [
1]. According to this fact, the importance of this paper is to highlight the possibilities of the available capacity and to promote the use of this capacity for sustainable transport. The case study also proves that the available capacity could significantly reduce overall emissions produced by road and railway transport.
Cargo transport is mainly provided by road and railway transport. Air transport is not suitable for many types of goods. On the other hand, inland water transport provides many possibilities. It is suitable for the transport of bulk, general, and liquid cargo for longer distances. The Danube, which flows through Central and Eastern Europe, creates many possibilities for sustainable and environmentally friendly transport. It is the part of the waterway Rhine–Main–Danube that links the North and Black Seas and fifteen European countries.
1.1. Road Transport in Europe
The total length of the road network in Europe is more than 71,423 km. The density of the road network depends on different factors, such as the density of the population, morphology of the country, density of the road network and motorways in industrial and port areas [
1,
2].
The largest density of regional motorways in Europe is around the port of Bremerhaven in Germany (205 km/1000 km2). Other high levels of density of road transport are observed in the Netherlands in the port of Rotterdam and Utrecht (125 km/1000 km2).
The states in the Danube region also belong to the countries with the densest motorway networks in the capital regions [
2], especially Germany, Hungary, Austria and Slovakia (50 km/1000 km
2). For example, the density in Budapest (120 km/1000 km
2) is 2.4 times higher than that in Ile de France. However, the length of the road network in the city centre in Budapest is only 61 km long and the length of network in the city centre in Ile de France is 613 km long. These aspects support the effort of the European Union to transfer a significant part of the traffic performance from road transport to other means of transport (railway transport and inland water transport). From this point of view, the Danube offers ideal opportunity for transport systems in the regions in Central and Eastern Europe.
European roads belong to the safest roads in the world. The average number of road accidents in Europe is around 23,000 per year and the average number of injuries is 1.2 million per year. Nowadays, the European Union has presented new “Vision Zero”. The main idea of this programme is to decrease the number of deaths on European roads to almost zero by 2050. This concept is focused on key safety indicators, such as vehicle safety, seat belts, post-crash care and so on [
3].
The most dangerous region of the European Union, regarding the accident rate, is Notio Aigaio in Greece with 161 road fatalities per million inhabitants. On the other hand, the safest region from this point of view is a Finnish autonomous archipelago of Åland with zero fatalities.
Looking at the Danube region, the highest rate of accidents is observed in Bulgaria and Romania. The overall number of road fatalities in these countries is at least 100 deaths per 1 million inhabitants [
3]. On the other hand, the average number of fatalities in Germany and Austria is from 10 to 14 deaths per million inhabitants.
1.2. Rail Transport in Europe
The density of railway infrastructures in Europe is affected by historical development. It is possible to observe regional differences across the European Union. The rail infrastructure is in many eastern countries of the European Union denser than in western regions, thanks to the reliance of former communist countries on railway transport [
4].
Nowadays, the density of the railway infrastructure rises mainly in northern France, Germany and in Benelux, thanks to a favourable connection to the railway system with eastern European countries. These regions are characterised by high-density populations. This fact also contributes to investments, which are mainly oriented into the high-speed rail network [
4].
On the other hand, the lowest density of the rail network is situated in peripheral regions of Greece, Spain, France, Cyprus, Portugal, Malta and Finland [
4]. For example, the density of the rail network in the Dytiki Makedonia region in Greece is only about 9 km/1000 km
2.
Looking at states around the river Danube, it is clear that the highest density rail infrastructures are in the capital cities and their surroundings, for example, around Berlin (736 km/1000 km
2), Budapest (379 km/1000 km
2) or Bucuresti-Ilfoy (159 km/1000 km
2) [
4].
1.3. Transportation on the River Danube
The river Danube originates as the confluence of two mountain rivers, Breg and Brigach, in Schwarz Wald. The overall length of the Danube from the confluence of Breg and Brigach to the estuary into the Black Sea is 2858 km [
5]. The Danube River Basin is more than 801,463 square kilometres. The Danube also creates a vast delta before entering into the Black Sea.
The Danube waterway crosses the territory of ten European countries. The commercial navigation starts in a German town of Kelheim and afterwards, it crosses the territory of Austria, Slovakia, and Hungary. Subsequently, it crosses the territory of Southeast Europe. The last part of the flow crosses through the territory of Moldova and the Ukraine. Based on this information, it is possible to say that the Danube waterway could be considered the only waterway in the world that crosses through the territory of ten countries. Inland river boats and pushed convoys also cross through four capital cities: Vienna, Bratislava, Budapest, and Belgrade [
5].
The Danube as an individual flow is characterised by different characteristics in individual sections. Based on the natural character of the river, it is possible to distinguish three parts: the Upper Danube, the Middle (Central) Danube and the Lower Danube.
The section of the Upper Danube is more than 624 km long. This section is characterised as a mountain river with an inclination of 37 centimetres per kilometre. The Upper Danube crosses the territory of Germany, Austria and Slovakia and ends as a natural border between Slovakia and Hungary, near the town of Gonyu (rkm. 1791, 33). From this point of view, it is important to say that the connection of waterways of Central and Eastern Europe with the Western European waterway network is by the Main–Danube Canal. It is located at the beginning of this section near the German town of Kelheim (rkm. 2414). To secure favourable conditions for inland navigation, electricity production and flood protection 16 dams with locks were constructed on the Upper Danube. Most of them are in the territory of Austria. One of these constructions is situated in Slovakia, too [
6]. The average speed of vessels, according to the direction of inland navigation and type of vessel, is 16–18 km per hour (downstream) and 9–13 km per hour (upstream).
The Middle Danube is characterised as a lowland river. This section between Gonyu and Drobeta Turnu Severin is 860 km long. This section crosses the territory of five countries: Slovakia, Hungary, Croatia, Serbia and Romania. There is also one of the most important dams on the Danube: Iron Gate I. The average speed of vessels in this section is 18–20 km per hour (downstream) and 9–13 km per hour (upstream).
Afterwards, the Lower Danube creates the final section of the Danube. This section is bound by Drobeta Turnu Severin and the estuary of the Danube (rkm 0.0). There is a significant dam: Iron Gate II. The nature character of this section is characterised as a lowland river with an inclination of 4 centimetres per kilometres. The average downstream speed of vessels and pushed convoys in this section is 11–15 km per hour [
6].
Inland waterways are divided into individual classes, according to AGN (European agreement on main inland waterways of international importance). The aim of this classification is to secure the fluency and safety of inland navigation. Each class defines the dimensions and arrangement of inland river vessels and pushed convoys for which the waterway is intended.
The section (est. 69 km long) between Straubing and Vilshofen belongs to the class VIa. On the other hand, the section between Regensburg and Budapest is classified as class VIb. This class determines that this section is suitable for pushed convoys, consisting of an inland river tug and four inland river barges, DE IIb. The classification of the next section between Budapest and Belgrade allows the inland navigation of a tug and six inland river barges, DE IIb (class VIc) [
7]. The largest convoys on the Danube are operated on the lower section between Belgrade and the estuary of the Danube (classified as class VII). These convoys consist of inland tugs and nine inland river barges, DE IIb.
Information about the length of different sections and cargo handling create an important part of the presented model. Firstly, it is necessary to summarise this basic information, the length of section (km) and the development of cargo handling in ports, within this section. Next, it is necessary to express the future development, according to the basic least squares method. Afterwards, the presented model compares this estimated future development with the real state as expressed in official statistics. Thanks to this comparison, this model expresses the level of available capacity in individual sections and the overall level of the available transport capacity on the Danube. Then, the case study presents the amount of emissions produced by inland water transport in a particular route. The main contribution is to connect these topics together. The conclusion of this study is to express the overall emissions produced by road transport to transport the amount of volume of cargo corresponding to the available capacity on the Danube. At the end, this amount is compared by the overall emissions produced by vessels to transport the same amount of cargo corresponding to the available capacity on the Danube. Thanks to this comparison, it is possible to express a reduction in CO
2 emissions, thanks to the transition from road transport to inland river transport [
7].
Finally, the main aim of the paper is to propose available capacity on the Danube for an environmentally friendly way of transport. This aim connects the potential of this waterway and sustainable (low emission) transport in Central and Eastern Europe. This aim could help to accelerate the transition process from road transport to more environmentally friendly means of transport, such as rail transport or inland river transport. According to the conclusions of this paper, the use of available capacity in this process could reduce the amount of emissions of CO
2 produced by individual means of transport per one tonne and kilometre [
8].
2. Literature Review
In general, most of the presented studies and scientific papers deal with topics describing the impact of inland water transport on the environment. In general, most of the presented studies and papers deal with the impact of inland river transport on the environment, separately.
Huang et al. described this impact based on the operation of the ferry line on the river Yangtze. This paper also points out that inland navigation is affected by different factors, such as the direction of navigation (navigation upstream or downstream) and seasonal fluctuations of water levels. These factors have a significant effect on consumption and the production of emissions. To compare the sustainability of individual means of transport, it is necessary to know basic information about the impact of the operation of different means of transport on the environment [
9].
Skrúcaný et al. compared emissions related with consumption. Their study offers a comparison of different modes of transport in this way. The conclusion of this study is that it is important to choose the right model to assess the level of sustainable operation [
1]. In addition, Ro S. et al., stated that emissions produced by cargo road transport in the same emission class could be deferred, according to conditions of operation and methodology of measurement. This hypothesis is proved in this paper. The authors proved that the overall emissions in class EURO 6 are 4.4–14.6 times higher, using the LDDT method than in case of using the NEDC method [
10].
Inkinen T. and Hämäläinen E. assessed this hypothesis in a broad context. These authors emphasised that the issue connected with the sustainability of cargo transport could be interpreted comprehensively by imposing measures and standards in all countries. This paper also introduces three main areas of innovation: fuels and engine innovations, other innovations and methods to lower emissions, and infrastructure (route, spatial planning, and controls). Generally, it is possible to transfer a significant part of the traffic performance from road transport to other means of transport, such as rail transport or inland water transport [
11].
Possibilities of this transition to reduce emissions were assessed by Huang D., et al. In this paper, the authors suggest a useful mode based on the active stimulation of the repartitioning of traffic performance between the means of road transport and rail transport based on cargo levy rates [
12].
Different approaches for the calculation of emissions were promoted by Klein et al. (2019) [
13]. In this study, different methods are described based on conditions of operation of different modes of transport. For example, in the Netherlands, there are specific emissions models that are suitable for road transport, rail transport and inland water transport. The emissions of road transport are calculated, according to the area of the territory and the amount of fuel that is sent or used. Other factors have to be taken account for inland water transport. These factors are focused on the type of inland waterway and its parameters and consumption of energy. These factors are expressed in the final calculation of emissions as variable parameters connected with speed and stream velocity. According to this contribution, the type of traction and energy consumption affect the amount of emissions in rail transport, too. This assessment is based on Tier 2 methodology. In this method, the overall amount of emissions is based on the fuel consumption. This methodology is suitable mainly for diesel locomotives [
13].
The current situation on the Danube related to the amount of cargo transported by inland water transport describes the Danube Commission. Materials of the Danube Commission claim that there are differences in the amount of cargo transported by inland water transport. Most of the cargo is transported in Romania. The transport situation in this country is quite stable based on the development of transport activity during different years. Overall, it is possible to say that the amount of cargo transported on the Danube waterway has risen throughout the years. Local decreases in inland water transport has been observed in countries that, in general, do not use water transport, due to different causes, such as the economic situation or the insufficient length of individual sections. Many countries in the Danube region have passed through an economic transformation that has affected the transport system. The economic growth of these countries is related to logistics operations that have relied on road transport. Now, many of these countries have realised that the neglect of the development of water transport is a mistake from different points of view—economic and environmental. On the other hand, there are also other institutions, such as the Central Danube Commission, that describe the current conditions on the waterways in western Europe. This Commission states that the amount of cargo transported on the Rhine has decreased. Other statistics data are based on official documents that are provided by local authorities, such as the ministries of transport or port authorities that provide statistics about the activity in individual inland river ports along the inland waterway.
The creation of model that expresses the available capacity requires a large range of values based on statistics. On the other hand, statistic data are not always the same. Different countries create statistics in individual ways. Available statistic data strongly contribute to the final method, which is used for the calculation of the available capacity. According to a study conducted by Mason and Perreault (1991), the number of observations can be classified only for a number greater than 300. The sample is considered moderate for a number of observations around 150, and a sample size of 30 or less is considered small. On the contrary, Jenkins and Quintana-Ascencio (2020) claimed that regression analysis can be used, even for samples with a minimum of eight observations in the case of little variance, and for samples of more than 25 observations in the case of high variance, provided that the samples are not clustered at one end of a data cloud and regression assumptions are met. Gavilanes and Michael (2019) studied alternative options of parameter estimation with Jackknife, Bootstrap, Lasso and Robust Regression in order to establish the better approach in terms of lower bias and statistical significance. However, compared to the ordinary least squares method, Gavilanes and Michael concluded that these alternative methods cannot be used for micronumerosity phenomena (fewer than 10 observations) [
14,
15,
16].
Thus, the authors of this paper focused on the linking between available capacity and sustainable transport on the Danube. Generally, this linking is not described in many scientific papers and studies, even though this topic could be a critical topic for sustainable transport in the future not only in Europe, but worldwide.
3. Materials and Methods
3.1. Germany
The overall length of the Danube in Germany is 203 km (
Table 1). Thanks to the Main-Danube Canal, the section of the Danube in Germany creates a connection between the inland water transport system in Western Europe and the Danube inland water transport system in Central and Eastern Europe. The main inland river ports in the German section of the Danube are Kelheim, Regensburg, Straubing, Deggendorf and Passau (overall 5 ports). According to the Danube Commission, the overall flow of cargo through these ports reached values between 4 M tons in 2014 and 2.3 M tons in 2018 (
Table 2) [
17,
18,
19,
20].
The available statistics also state that there was a drop in cargo transportation through these ports between 2016 and 2018. Recent statistics for the period of years 2019 and 2020 are not mentioned, but it is expected that the decline in cargo handling in these continued and continue, due to the economic and health crisis.
3.2. Austria
The overall length of the Danube in Austria is 351 km (
Table 1). The main inland river ports in the Austrian section of the Danube are Linz, Enns, Ybbs, Krems, Korneuburg and Vienna (overall 6 ports). According to the Danube Commission, the overall flow of cargo through these ports reached values between 8.6 M tons in 2014 and 5.6 M tons in 2018 (
Table 2) [
17,
18,
19,
20].
3.3. Slovakia
The overall length of the Danube in Slovakia is 169 km (
Table 1). The main inland river ports in the Slovak section of the Danube are Bratislava, Komárno and Štúrovo (overall 3 ports). According to the Danube Commission, the overall flow of cargo through these ports reached values between 2 M tons in 2015 and 1.5 M tons in 2018 (
Table 2) [
17,
18,
19,
20].
3.4. Hungary
The overall length of the Danube in Hungary is 419 km (
Table 1). The main inland river ports in the Hungarian section of the Danube are Györ-Gönyü, Budapest, Dunajvaros, Dunavecse, Paks, Bogylszlo, Baja and Mohacs (overall 8 ports). According to the Danube Commission, the overall flow of cargo through these ports reached values between 5.79 M tons in 2017 and 5.2 M tons in 2018 (
Table 2) [
17,
18,
19,
20].
3.5. Croatia
The overall length of the Danube in Croatia is 138 km (
Table 1). The main inland river port in the Croatian section of the Danube is Vukovar (overall 1 port). According to the Danube Commission, the overall flow of cargo through inland ports in Croatia reached values between 0.632 M tons in 2017 and 0.491 M tons in 2014 (
Table 2) [
17,
18,
19,
20].
3.6. Serbia
The overall length of the Danube in Serbia is 587 km (
Table 1). The main inland river ports in the Serbian section of the Danube are Apatin, Bogojevo, Backa Palanka, Novi Sad, Beocin, Belgrade, Pancevo, Smederevo, Prahovo (overall 9 ports). According to the Danube Commission, the overall flow of cargo through inland ports in Serbia reached values between 8.412 M tons in 2016 and 6.390 M tons in 2017 (
Table 2) [
17,
18,
19,
20].
3.7. Romania
The overall length of the Danube in Romania is 1075 km (
Table 1). The main inland river ports in the Romanian section of the Danube are Moldova Vecha, Oresova, Drobeta Turnu Severin, Giurgiu, Cernavoda, Braila, Galati and Tulcea (overall 8 ports). According to the Danube Commission, the overall flow of cargo through all Danube river ports reached values between 23.78 M tons in 2017 and 25.09 M tons in 2016 (
Table 2) [
17,
18,
19,
20].
3.8. Bulgaria
The overall length of the Danube in Bulgaria is 471 km (
Table 1). The main inland river ports in the Bulgarian section of the Danube are Vidin, Lom, Somovit, Belene, Svishtov, Ruse, Tutrakan and Silistra (overall 8 ports). According to the Danube Commission, the overall flow of cargo through these Danube river ports reached values between 4.51 M tons in 2014 and 5.57 M tons in 2017 (
Table 2) [
17,
18,
19,
20].
3.9. Ukraine
The overall length of the Danube in the Ukraine is 170 km (
Table 1). The main inland river ports in the Ukrainian section of the Danube are Reni, Izmail, Kilia and Ust-Dunaysk (overall 4 ports). According to the Danube Commission, the overall amount of cargo loaded and unloaded in inland river ports in Ukraine reached values between 4619 M tons in 2014 and 6680 M tons in 2016 (
Table 2) [
17,
18,
19,
20].
3.10. Summary of Data
The regression analysis method was used to assess the level of transport capacity in individual states. Overall, nine states were included in this analysis. These states participate in inland river transport on the Danube. On the other hand, the length of the Moldova section is only 0.55 km long. Due to this short length and minimal share in inland river transport, the Moldova section was discarded.
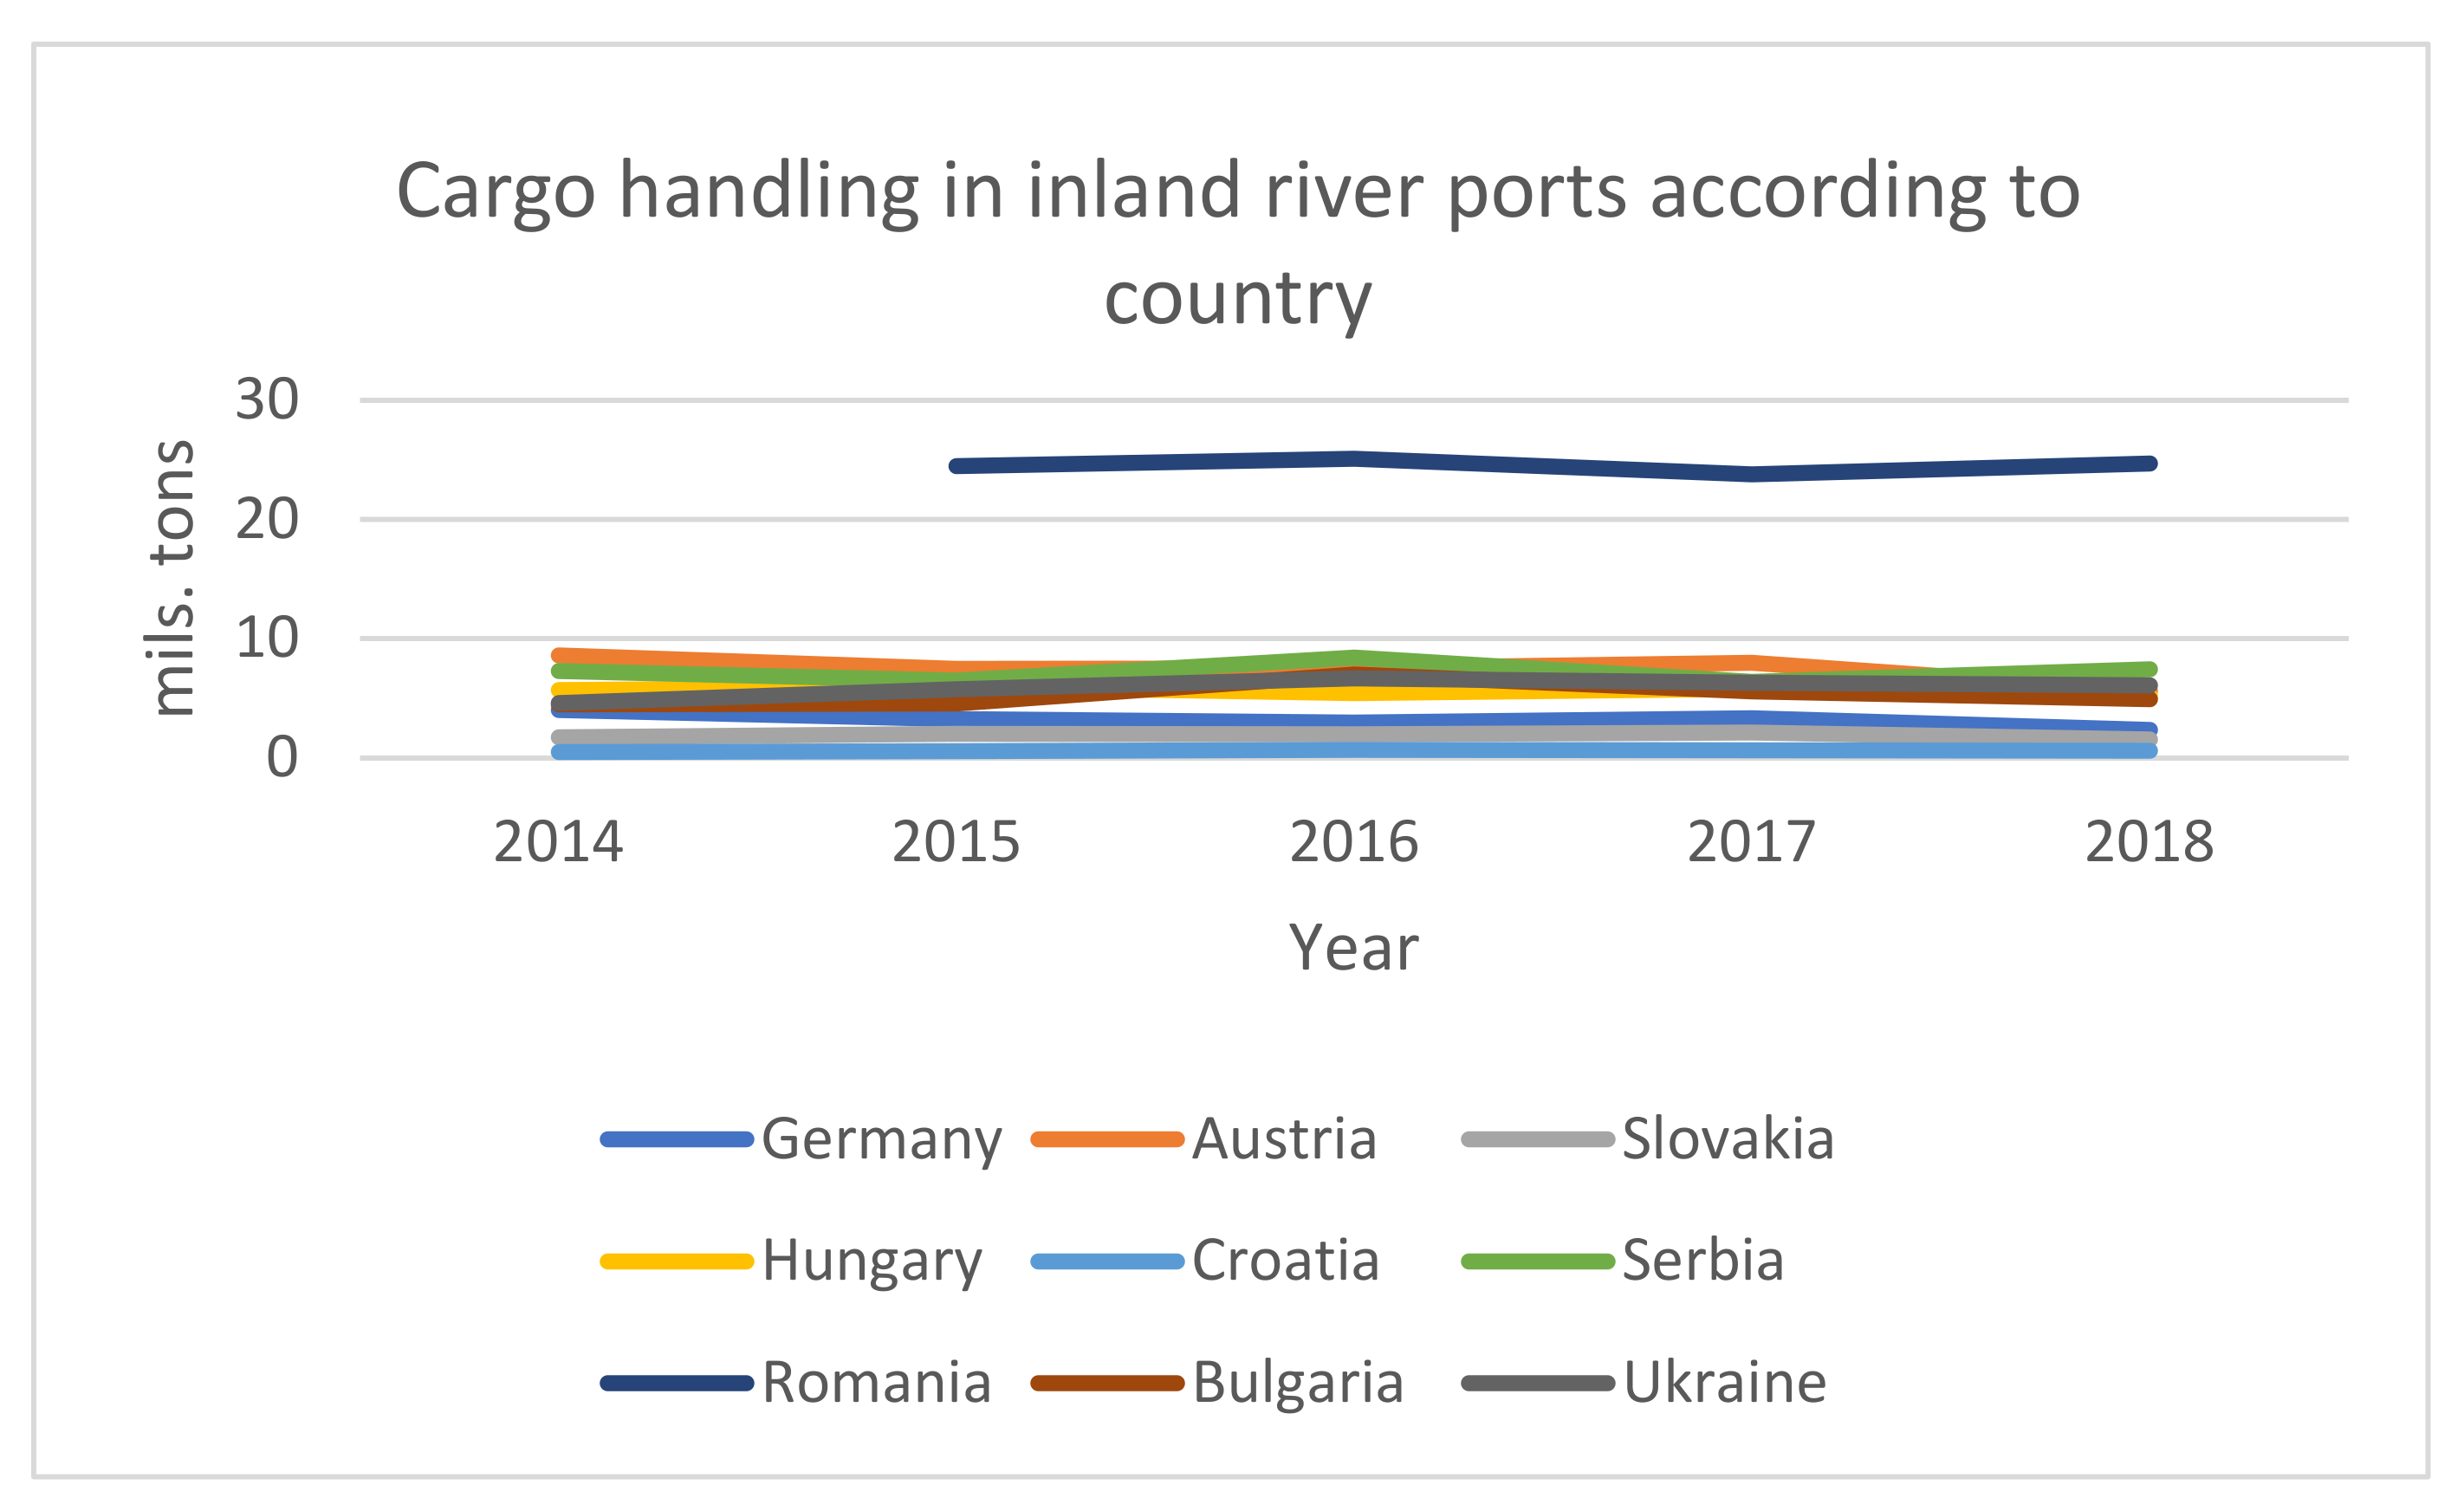
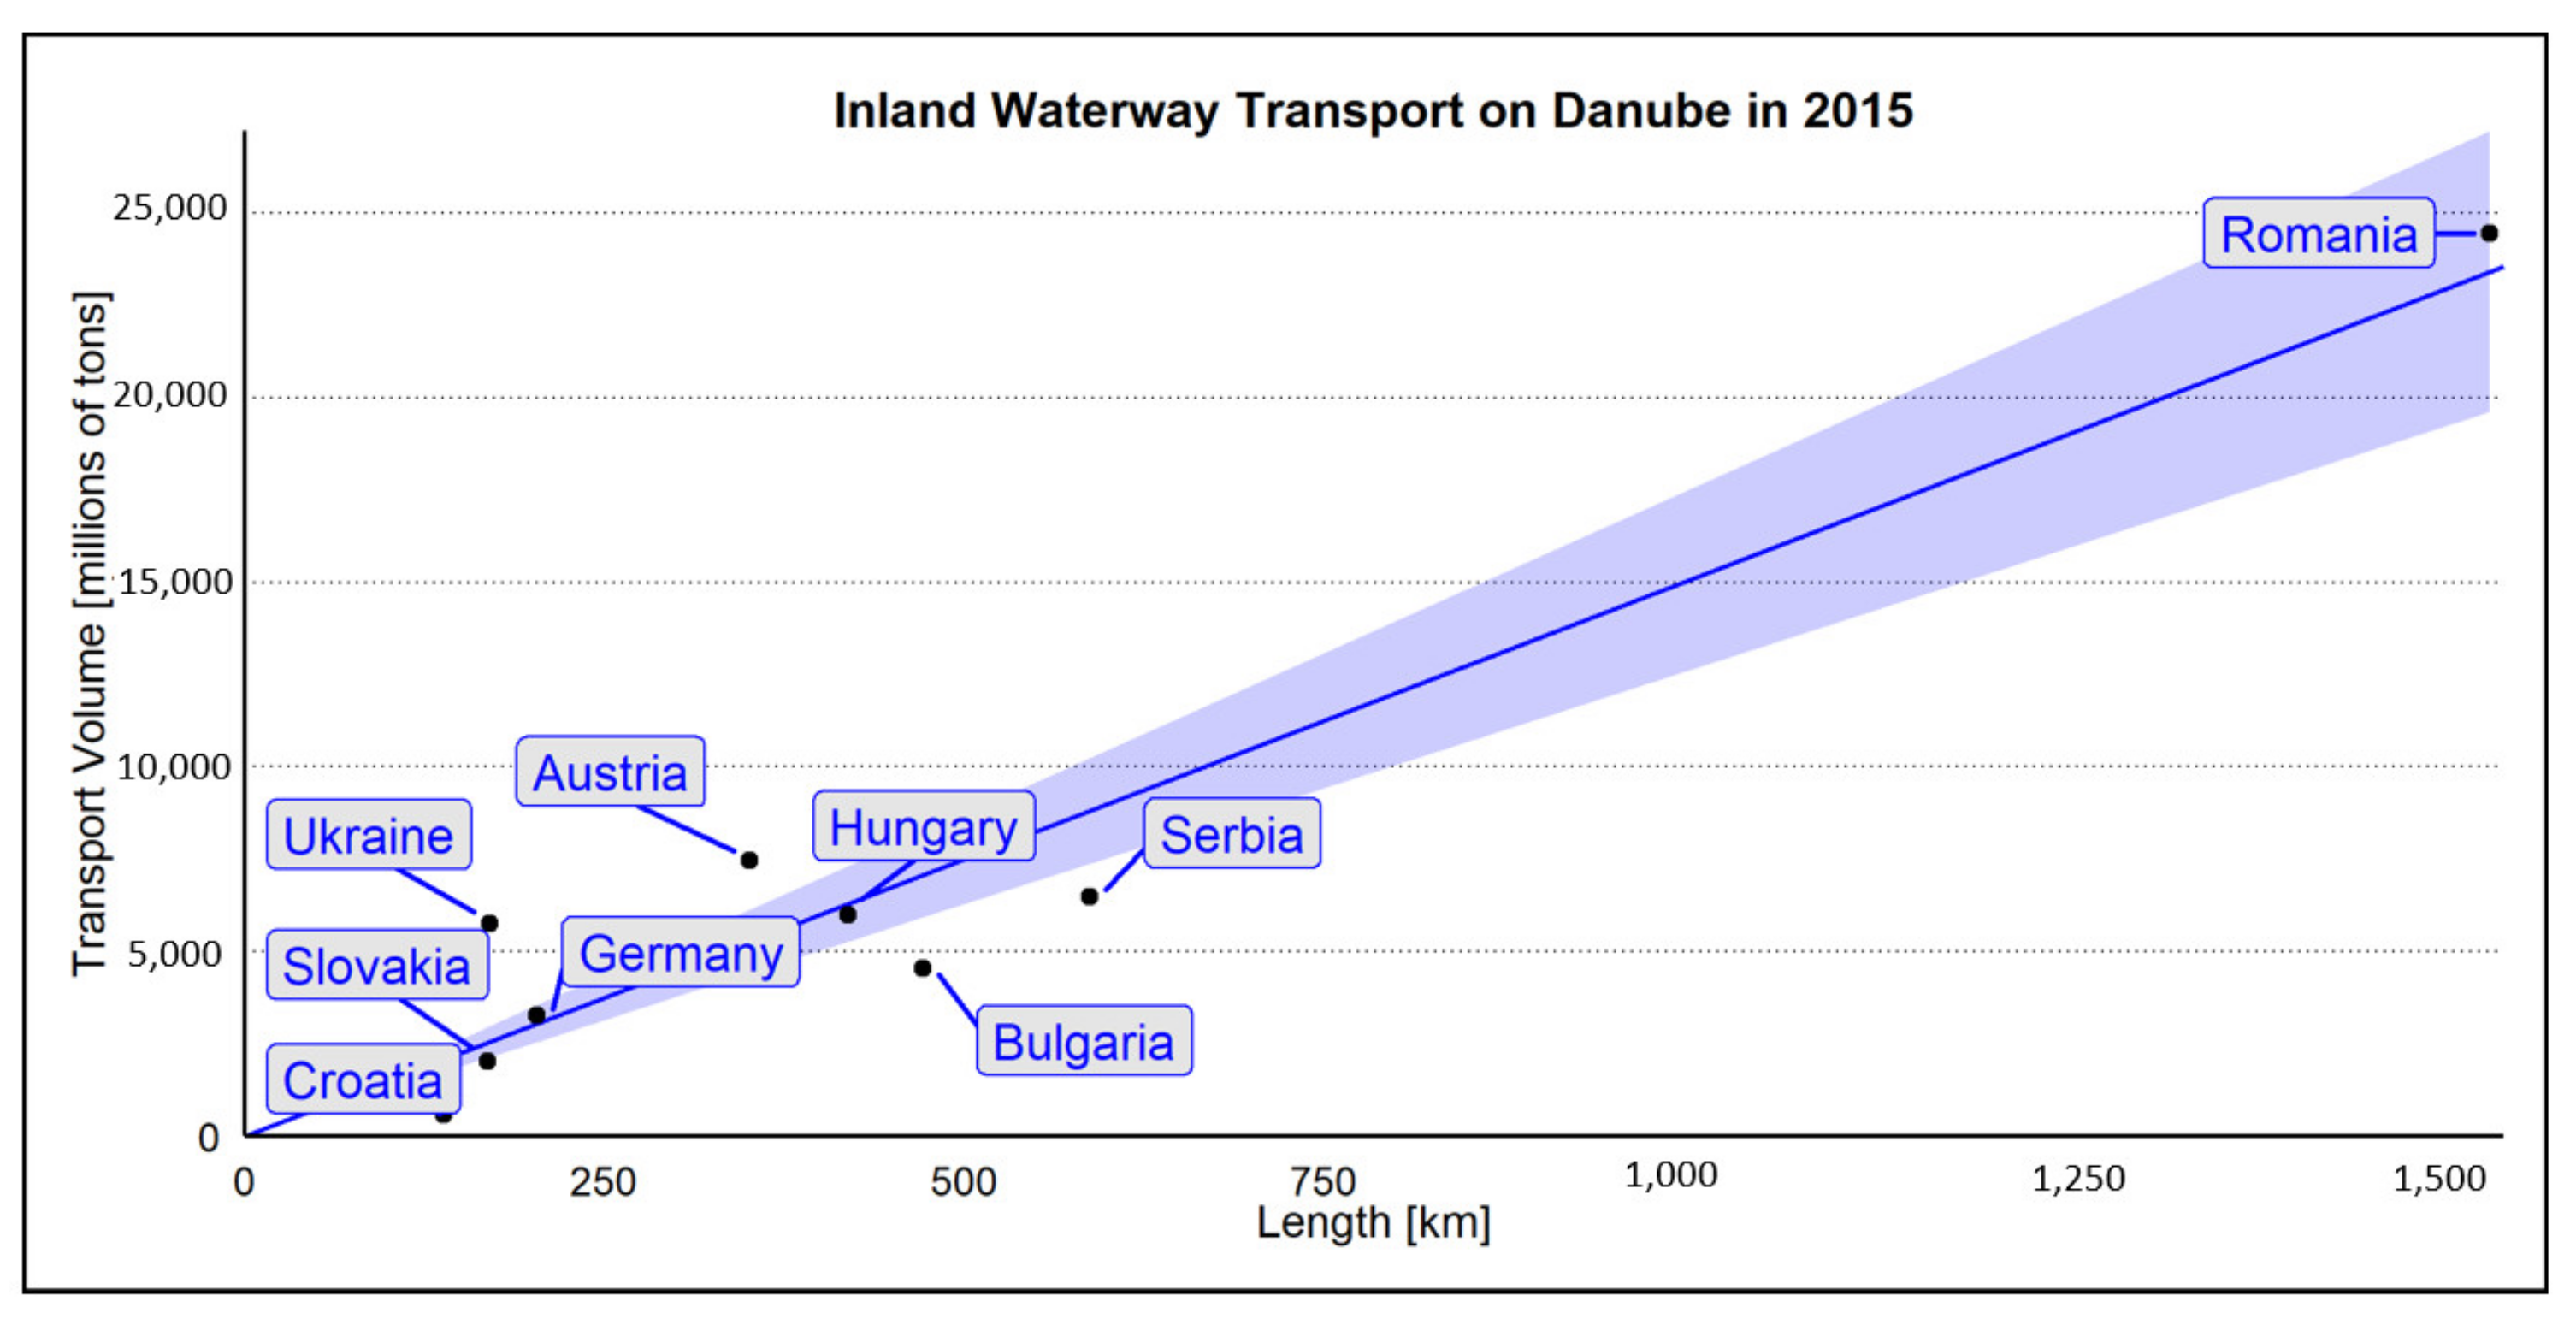
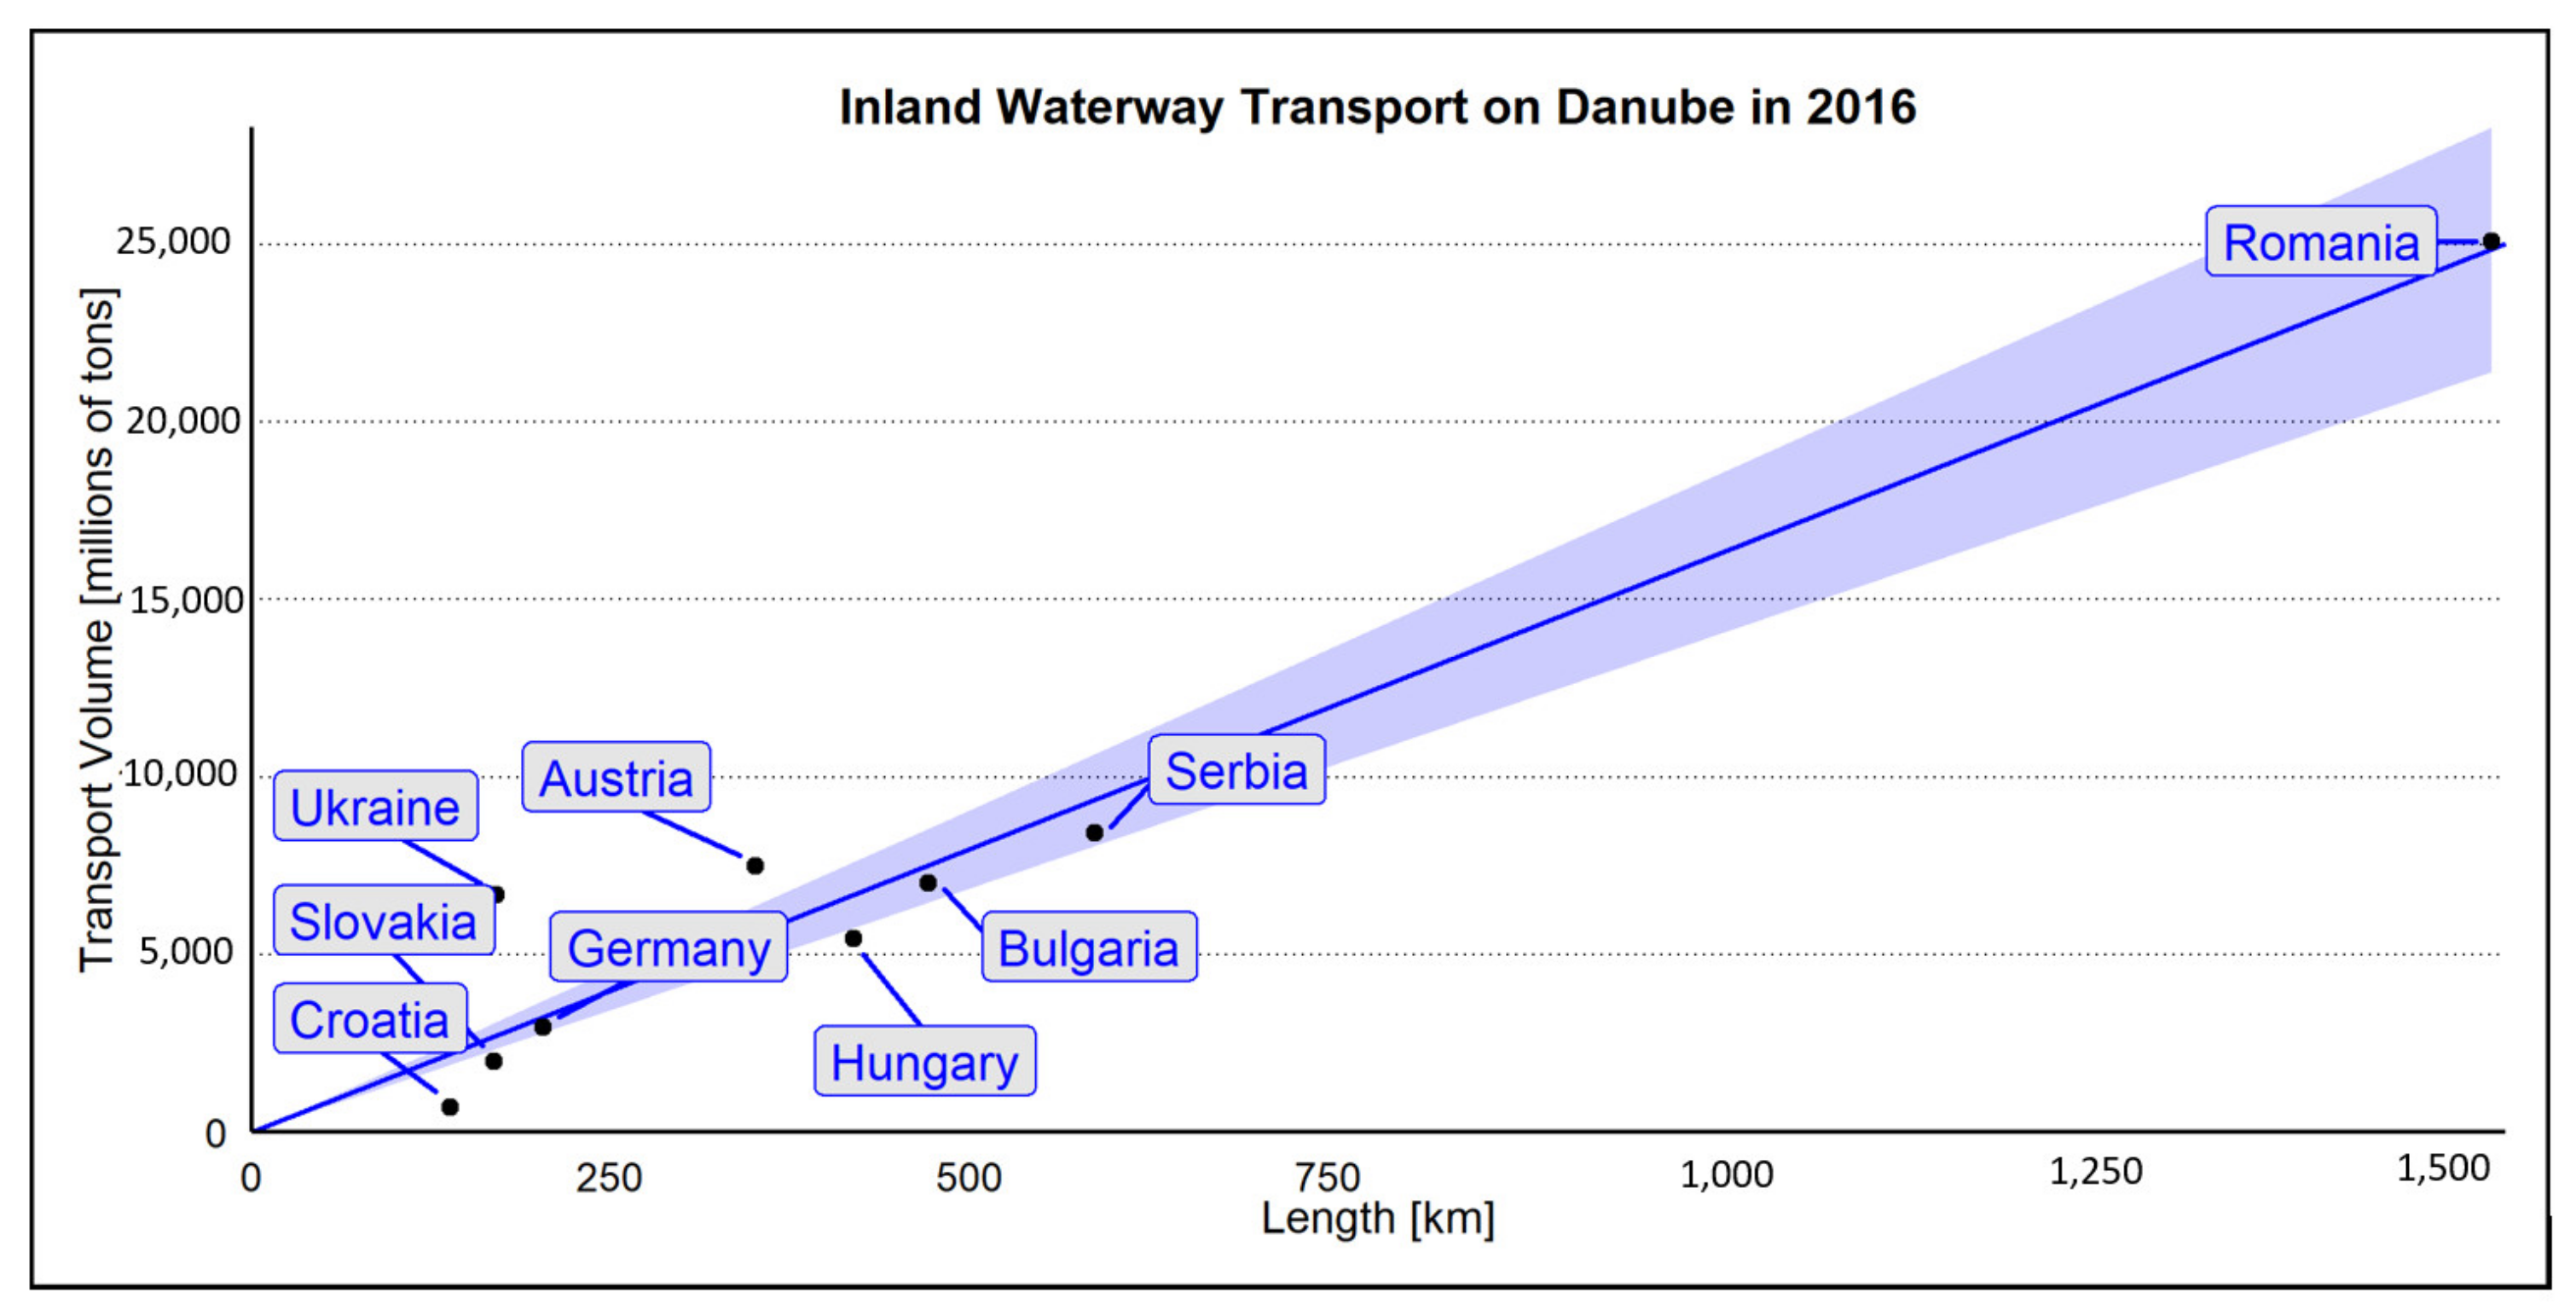
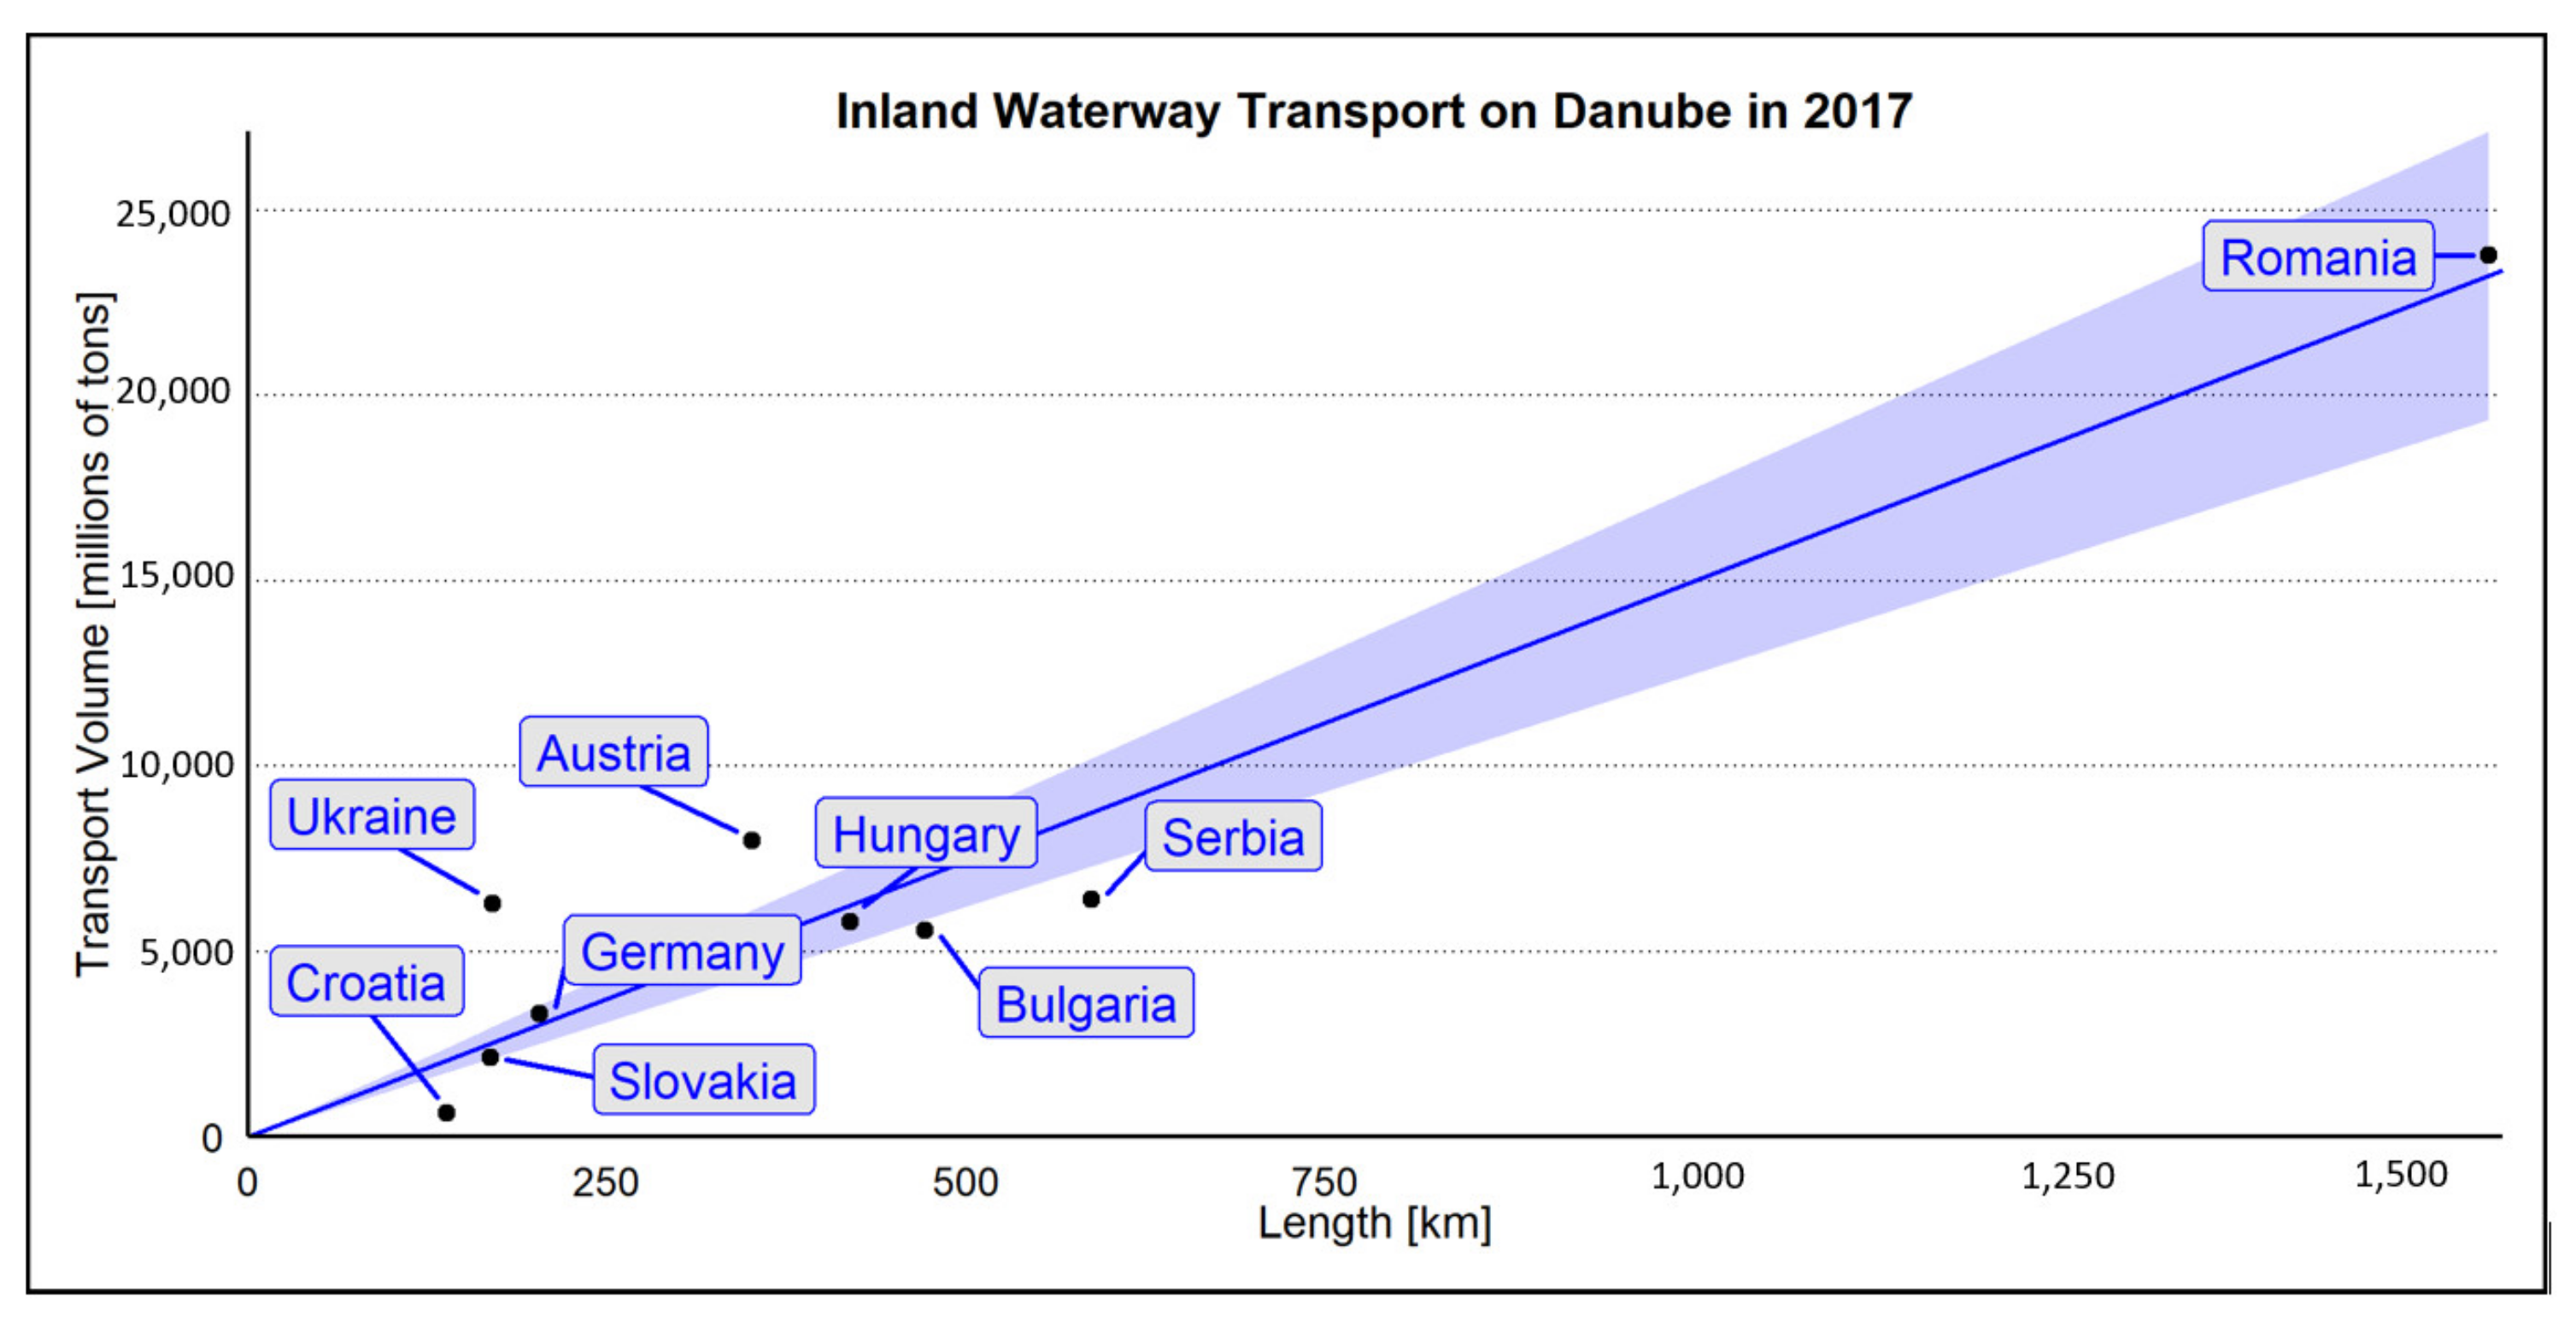
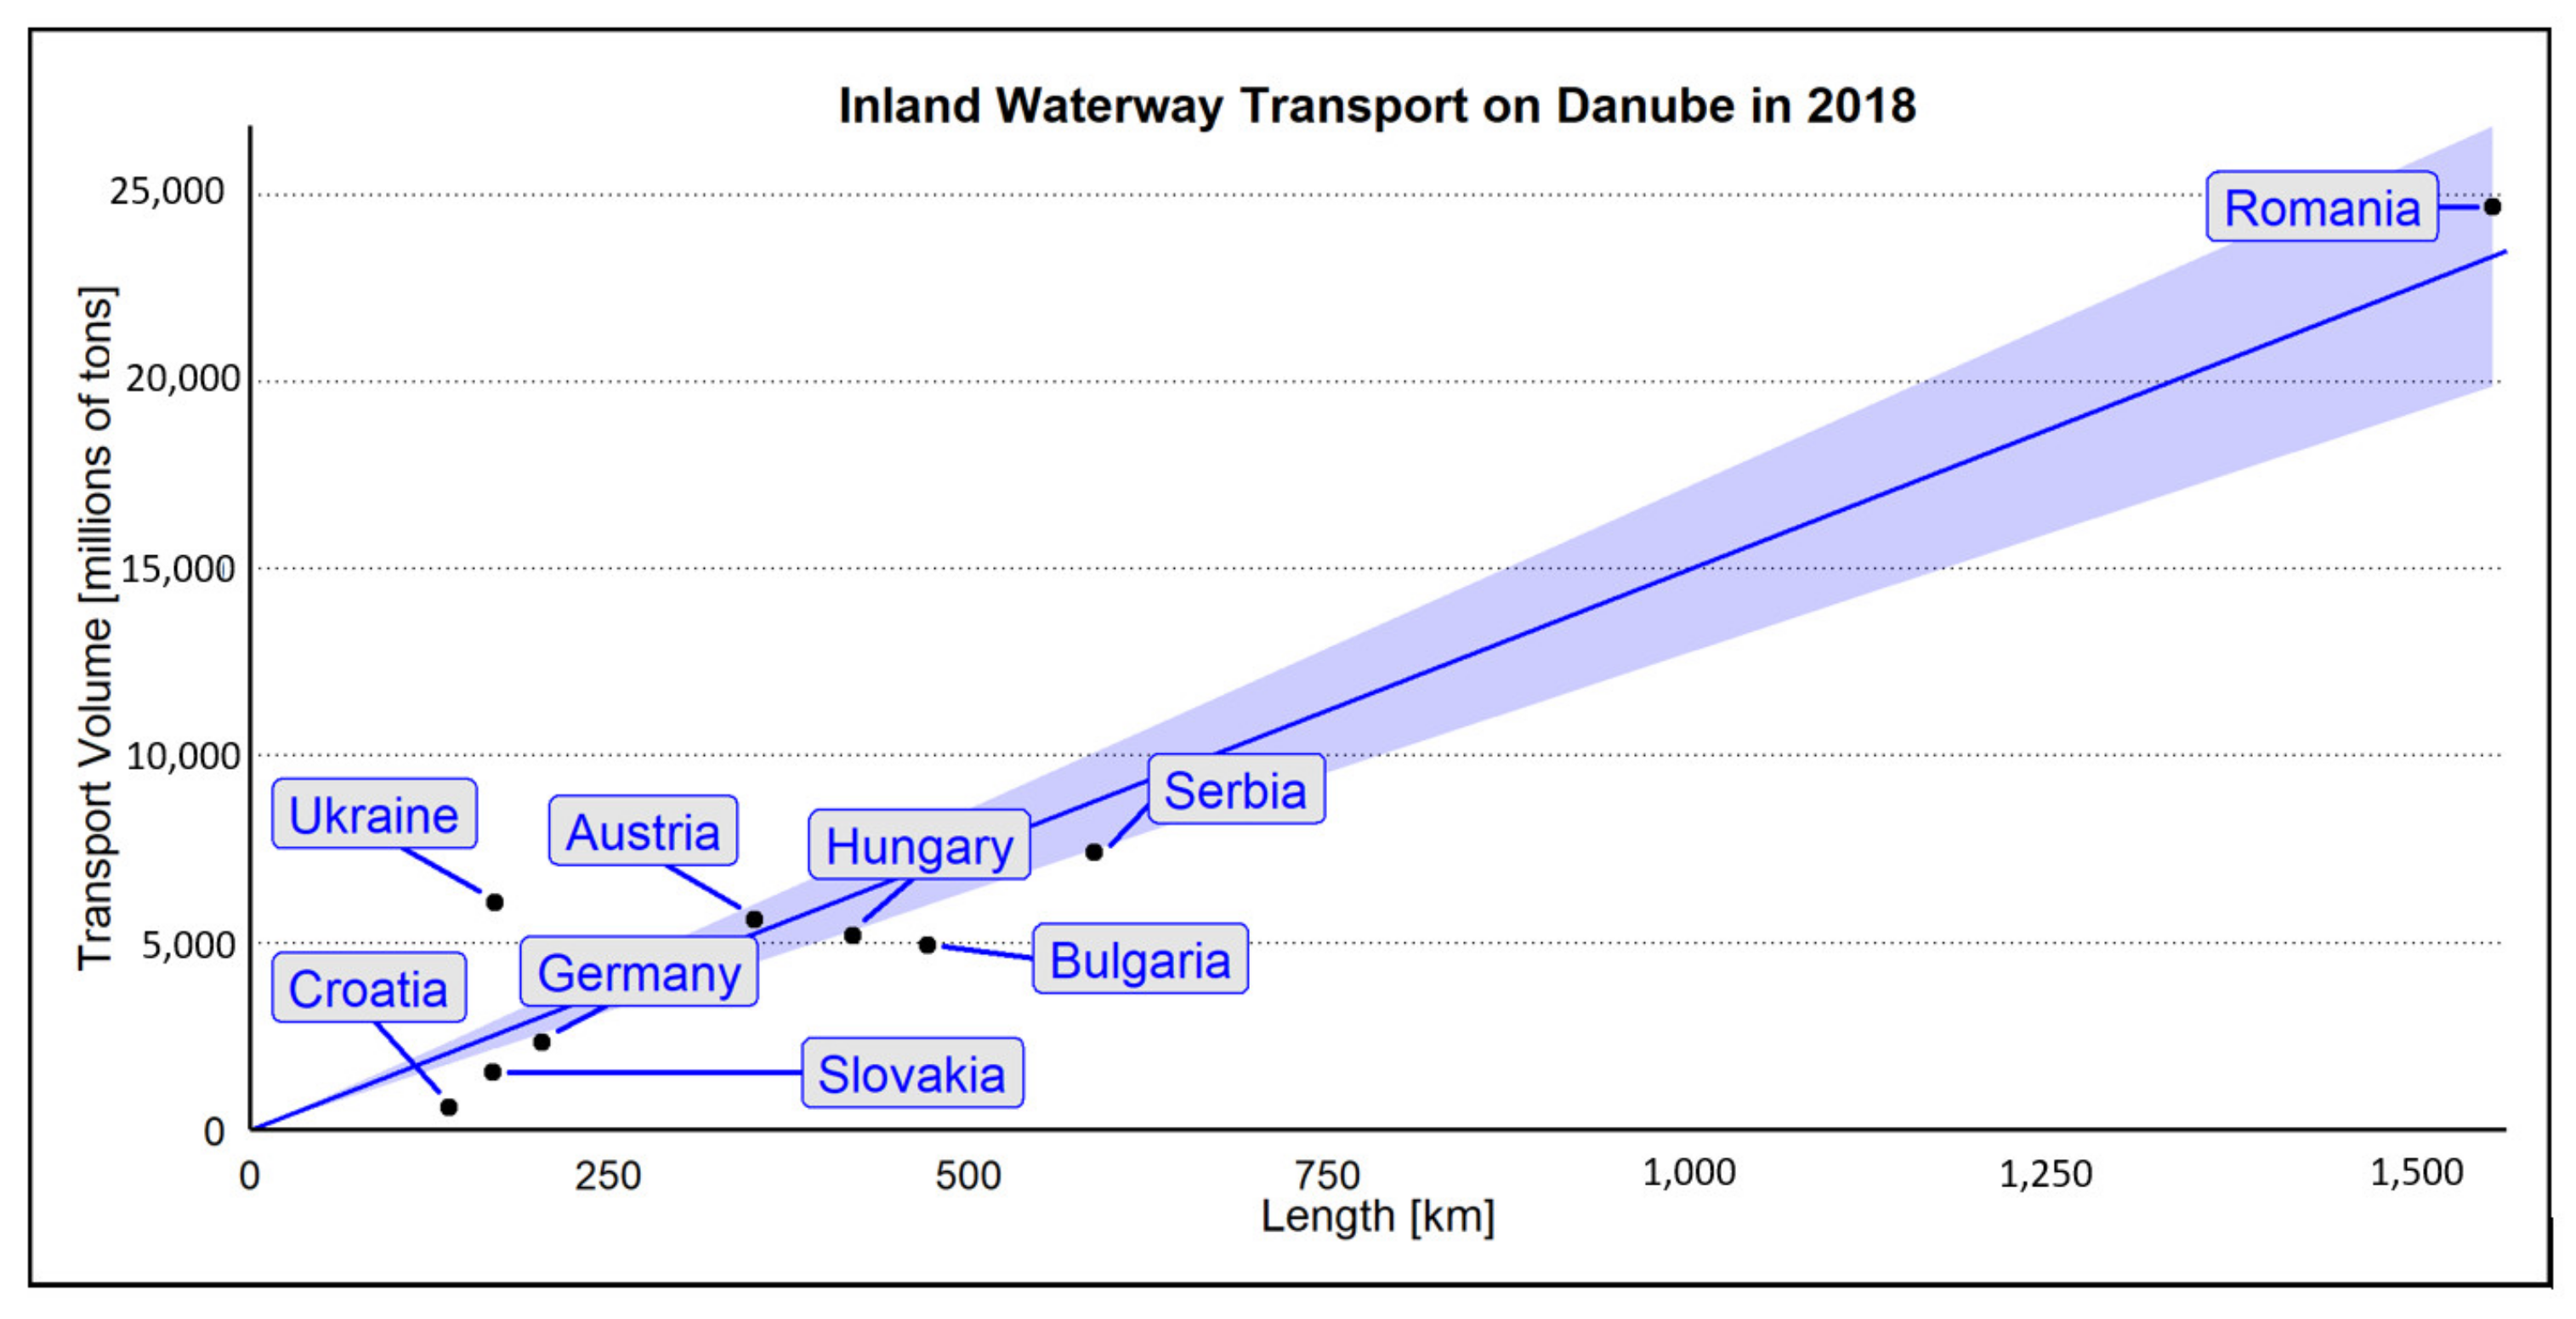
Firstly, the analysis compares the development of transport capacities in individual states during the period between years 2014 and 2018 (
Figure 1). Romania was not included into this comparison in 2014 because the statistics data were not available. This paper compares the overall amount of cargo handling in ports and the amount of cargo handling per section length.
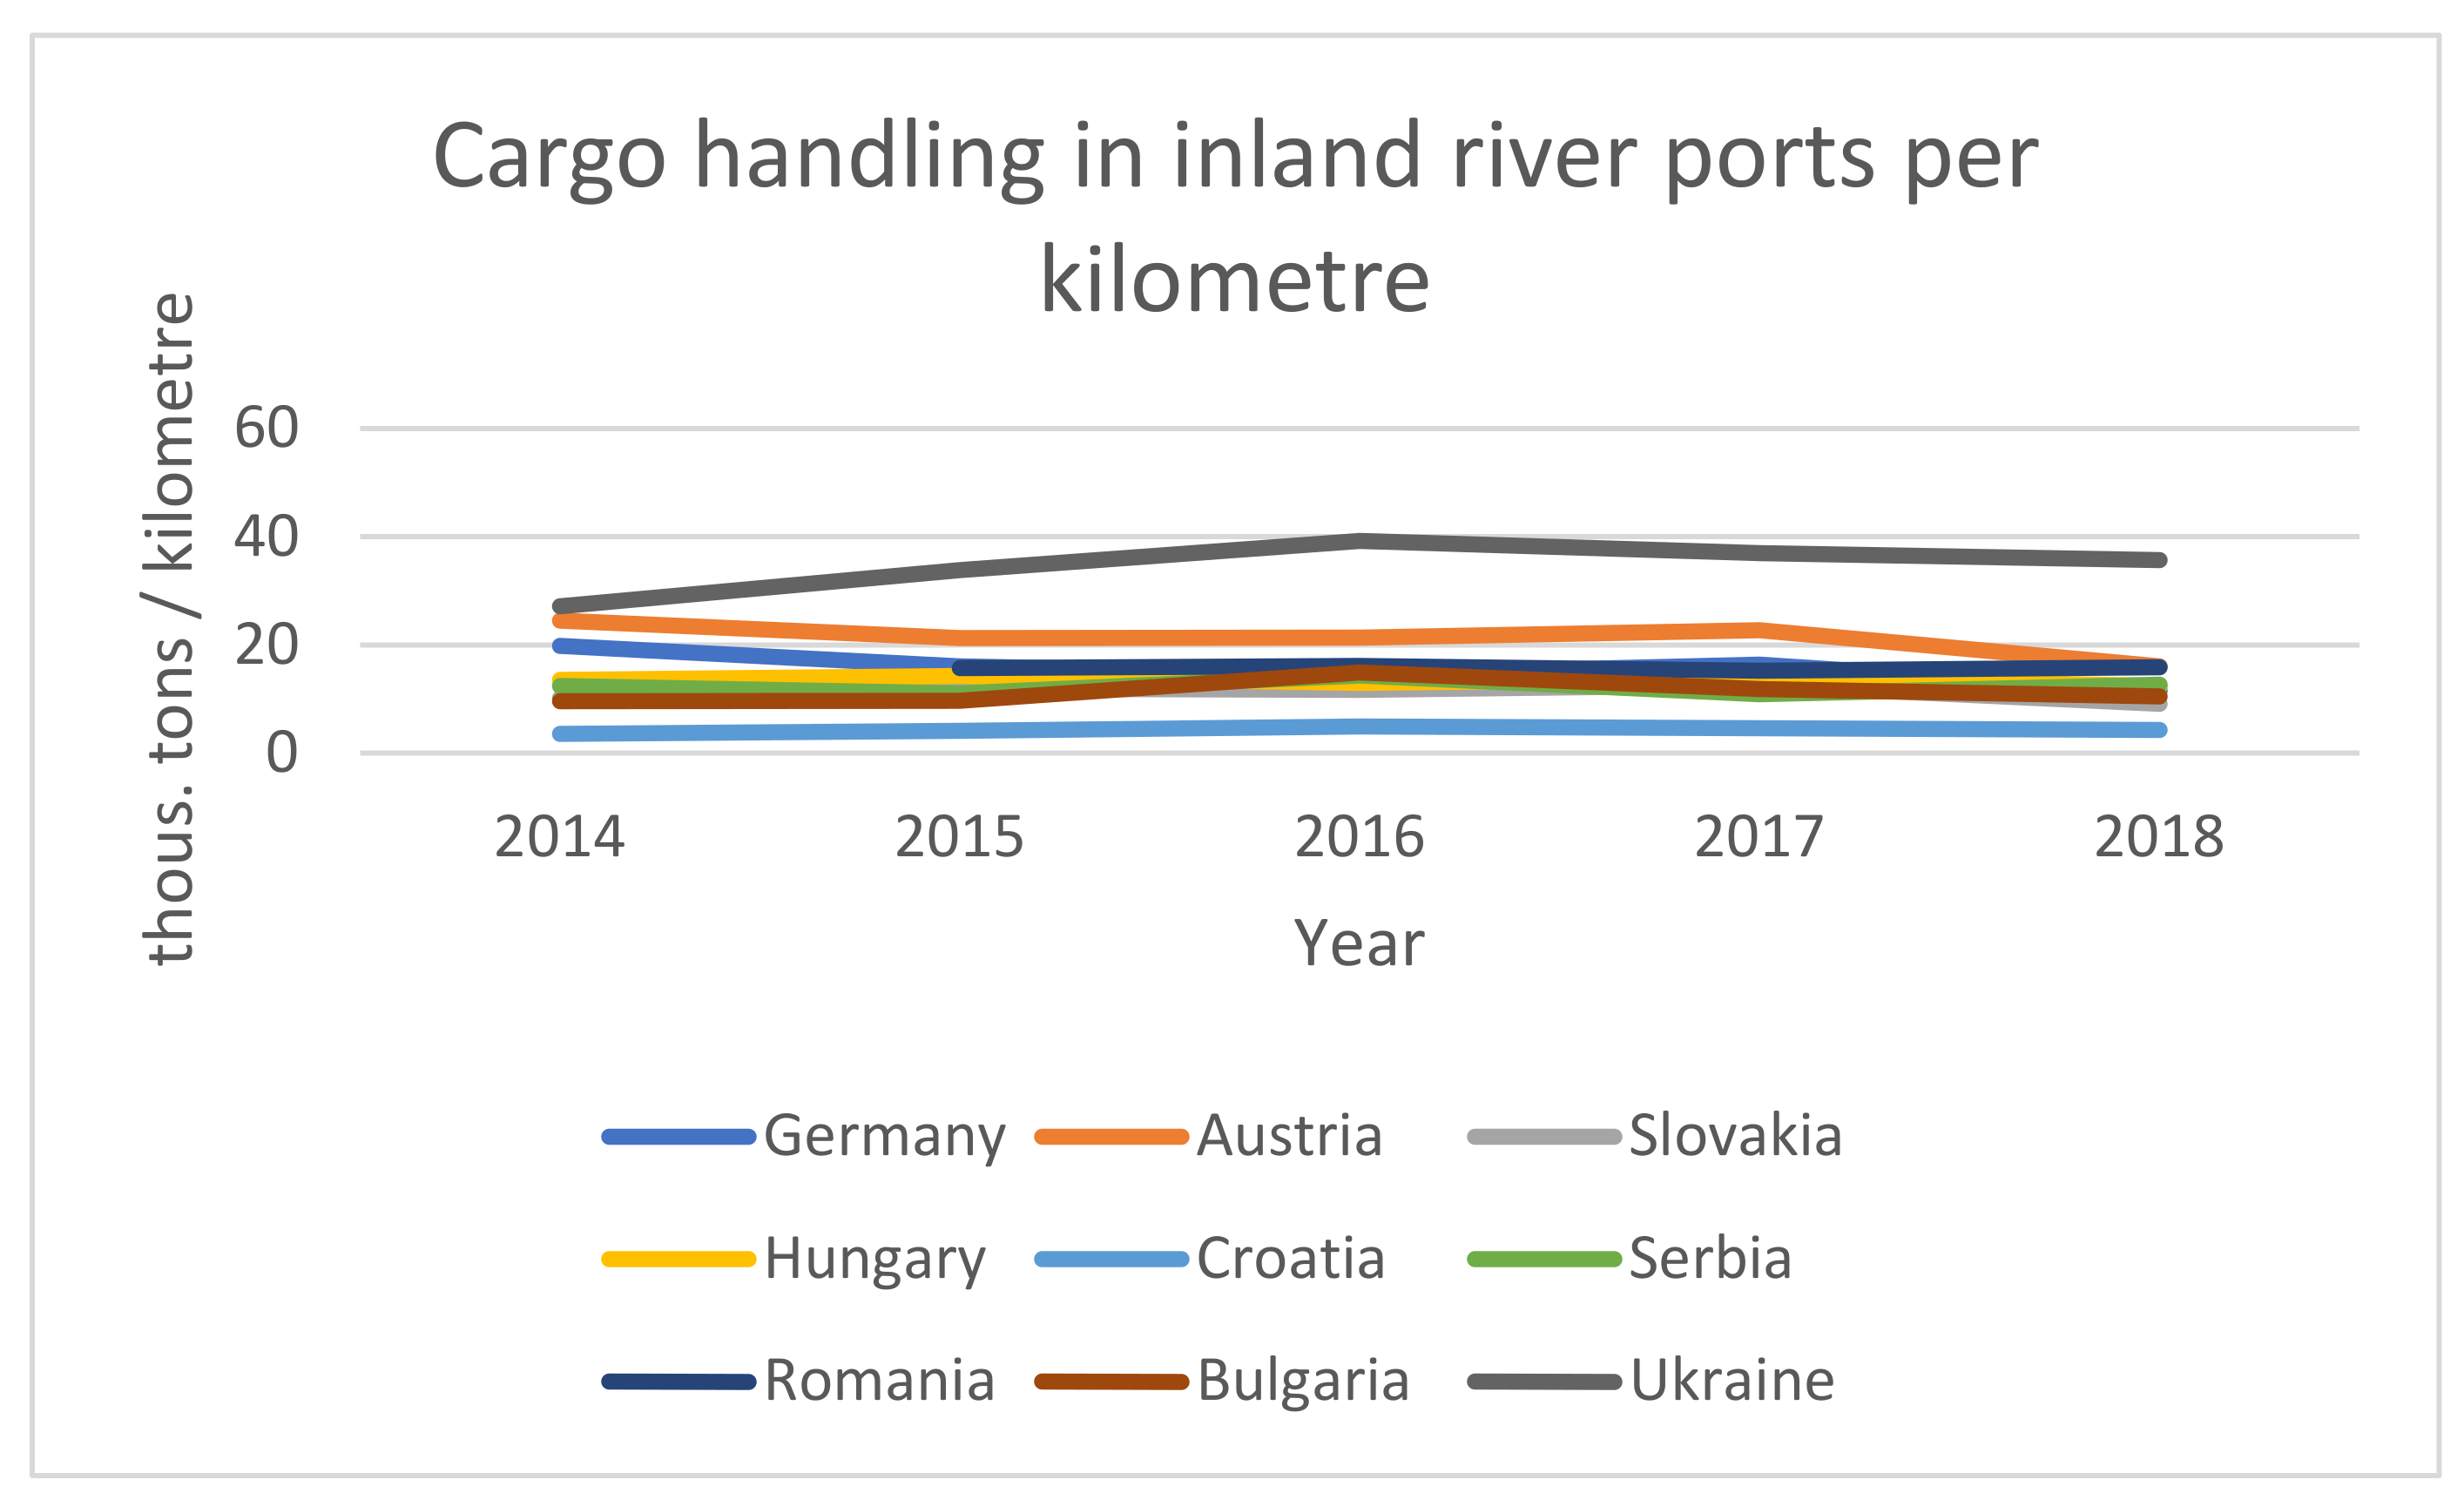
The biggest amount of cargo was transported through inland ports in Romania. This is caused by the overall length of the section. This amount is more than 3 times bigger than other ports. For this reason, it is suitable to compare the amount of cargo according to the length of the section (
Figure 2). According to this comparison, the Ukraine reached the highest level. On the other hand, Croatia reached the lowest level.
The majority of cargo handled in inland river ports on the Danube was dry bulk cargo (especially iron ore, fertilizers, sand and agribulk) and liquid cargo (chemicals). Ro-Ro cargo and heavy or oversized cargo were also transported but in smaller quantities. General cargo transportation and container transportation on the Danube are quite rare.
3.11. Methods for Estimating CO2 Emissions in Transport
Different methods are presented based on the mean of transport. These methods and models attempt to calculate different emissions that contribute to climate change. The results of the calculations of emissions in different models defer from initial conditions such as type of engine or traction, means of transport or overall power of the engine. The conditions of operation of individual means of transport also significantly contribute to differences between the results of individual models. Emissions in road transport could be calculated based on the number of vehicles of individual types. These emissions, called fuel used emissions, are calculated per the area of the territory. The next possibility is based on the fuel sold emissions which is also based on statistics of the number of vehicles and overall amount of fuel that has been sold with connection to the emissions measured in the specific area [
13].
The next type of measuring of the amount of emission is based on direct measures, using a probe in the exhaust pipe of a car. The composition of exhaust gases is expressed by a computer spectrometer that determines the amount of individual greenhouse gases within the amount of exhaust gas. These measures can be calculated under different conditions.
Emissions measuring methods in rail transport are based on Tier 2 methodology. In this method, the overall amount of emissions is based on fuel consumption. This methodology is suitable mainly for diesel locomotives. There are also basic requirements for fuel consumption and greenhouse gas emissions produced by diesel locomotives in many countries across the European union. Other methods are focused on electric locomotives, using the assessment of electric consumption, overall power of engine and the effects of different sources of energy [
13].
The method for estimating the emissions of greenhouse gasses is based on EMS (emission monitoring system). The calculation of the overall amount of CO
2 emission is based on the consumption of energy, type of vessel and the number of kilometres traveled by the vessel. Other factors, such as the type of waterway, are also taken into account. There are different types of inland waterways—natural waterways without regulation, natural waterways with additional regulations (canalized rivers) and artificial waterways (canals, water bridges, etc.). These factors are expressed in the final calculation of emissions as variable parameters connected with speed and stream velocity [
13].
3.12. Emissions in Transport
The overall emissions of CO
2 produced by individual means of transport depends on many factors, such as the type of emission class (road transport), type of traction (rail transport) or the direction of navigation (inland river transport). The common indicator could be also the fuel [
21].
In general, it can be observed that rail transport is the most environmentally friendly means of transport. On the other hand, it depends on electric traction, which generally produces less CO
2 emissions than diesel traction. However, electric traction is not a so-called zero-emission means of traction. Electric traction produces greenhouse gases during its production (est. 25.3 g of CO
2 /tkm) [
1,
22].
On the other hand, inland river vessels can transport large quantities for long distances. This is the reason why inland water transport is the most efficient means of transport. Its overall emissions of CO
2 per one tonne and kilometre is higher than for rail transport, but the amount of cargo carried by the vessel is bigger than in rail transport [
1,
22]. For example, on the Lower Danube, it is possible to transport cargo in nine inland river barges, DE IIb, that represent more than approximately 15,300 tons of cargo.
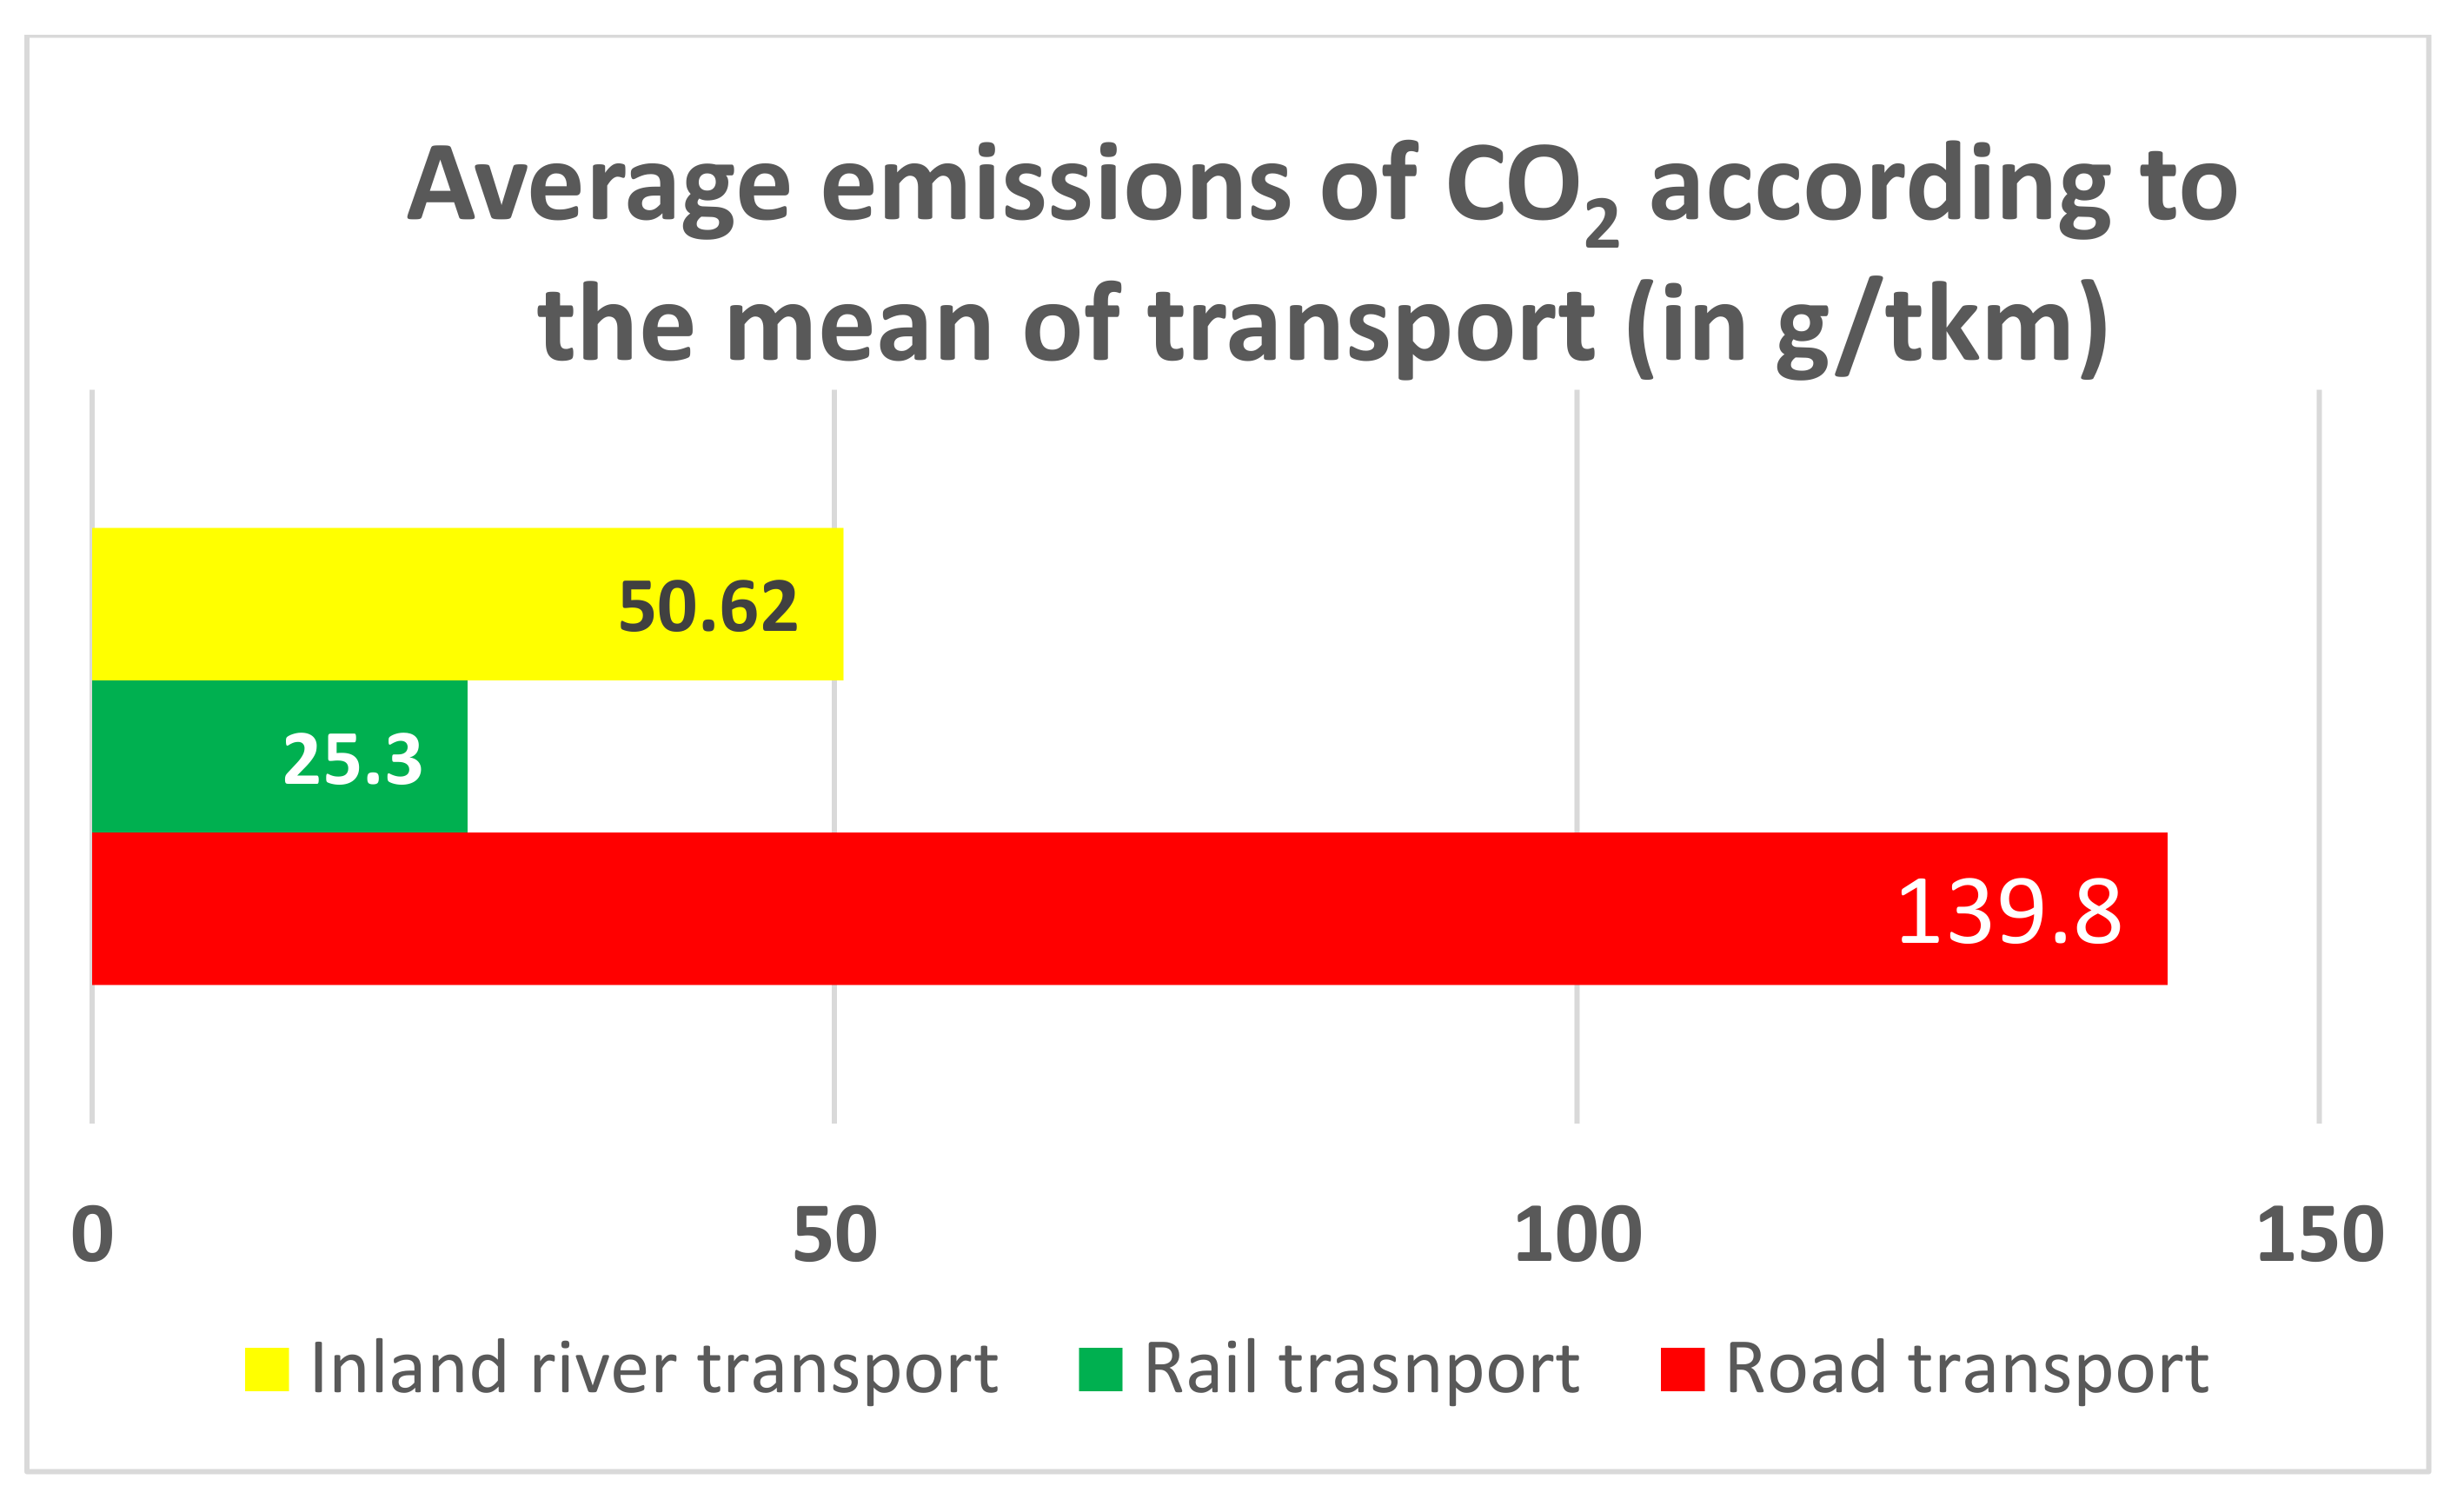
Looking at the
Figure 3, it is possible to say that means of road transport produce more than double the emissions of CO
2 (139.8 g/tkm using engines in emission class EURO 6b) than means of water transport (50.62 g/tkm) and more than 5 times more emissions of CO
2 per one tonne and kilometre than means of rail transport (25.3 g/tkm). This fact supports the idea to use inland river transport and rail transport for long distances instead of road transport [
1,
22,
23].
3.13. Mathematical Model
Empirical conclusions obtained from the data analyses use other types of analyses that are quite complicated in this case. Different countries provide different samples of statistic data. Some of these data concern more parameters than others. This is the reason why it is important to use analyses that can cope with data variables. In fact, we have a reduced number of observations—only 9. A low number of observations is usually associated with a lack of confidence in the estimates. The sample is considered moderate for a number of observations around 150, and a sample size of 30 or less is considered small. This regression analysis can be used even for samples with a minimum of 8 observations in the case of little variance, and for samples of more than 25 observations in the case of high variance, provided that the samples are not clustered at one end of a data cloud and the regression assumptions are met. The calculation of values with the use of the regression analysis can be facilitated by different tools. An example of these tools is function LINEST.
Thanks to this tool, it is possible to calculate regression lines based on the least squares method. This process calculates the slope of the line that fits the best data. Afterwards, this function expresses the data that describe this line.
This function can be combined with other functions to achieve statistics for other models connected with linear unknown values, including polynomic, logarithmic, exponential and power series [
24].
The creation of the model that expresses real transport capacity is based on information about cargo handling and the length of the section.
For this reason, it is necessary to summarize basic data about overall cargo handling in port loading, unloading and storage. Afterwards, it is suitable to add the length of the section of the Danube in individual countries. By applying these data, it is possible to express the prognosis of the optimal development of cargo handling in individual countries around the river Danube. The comparison of these optimal values with real values in specific year shows the available capacity of the section [
25].
The indicator of the available capacity signifies that the use of the capacity does not reach optimal values in many countries. This fact expresses that the throughput of sections is not used to a sufficient extent. As it was mentioned, according to this model, there is available capacity. This available capacity signifies the potential of the Danube for the transition of the performance from road transport to sustainable and environmentally friendly means of transport [
26,
27].
To assess the dependence of the amount of cargo handling on the length of the Danube, a linear regression was used based on the calculation using the ordinary least squares method. Due to the nature of this dependence, linear regression without the intercept term was used, which corresponds to the zero level of the cargo handling at zero length of the section. The general form of regression dependence was expressed in a specific form, where the
intercept
:
where the following is true:
- -
is the scalar response, and in this case, is the transport volume in million tons.
- -
is the slope of the regression line.
- -
is the explanatory variable, and in this case, is the length of Danube (in kilometres).
- -
is the error term [
27,
28].
4. Results
The results of the linear regression for individual years are mentioned in the next table (
Table 3).
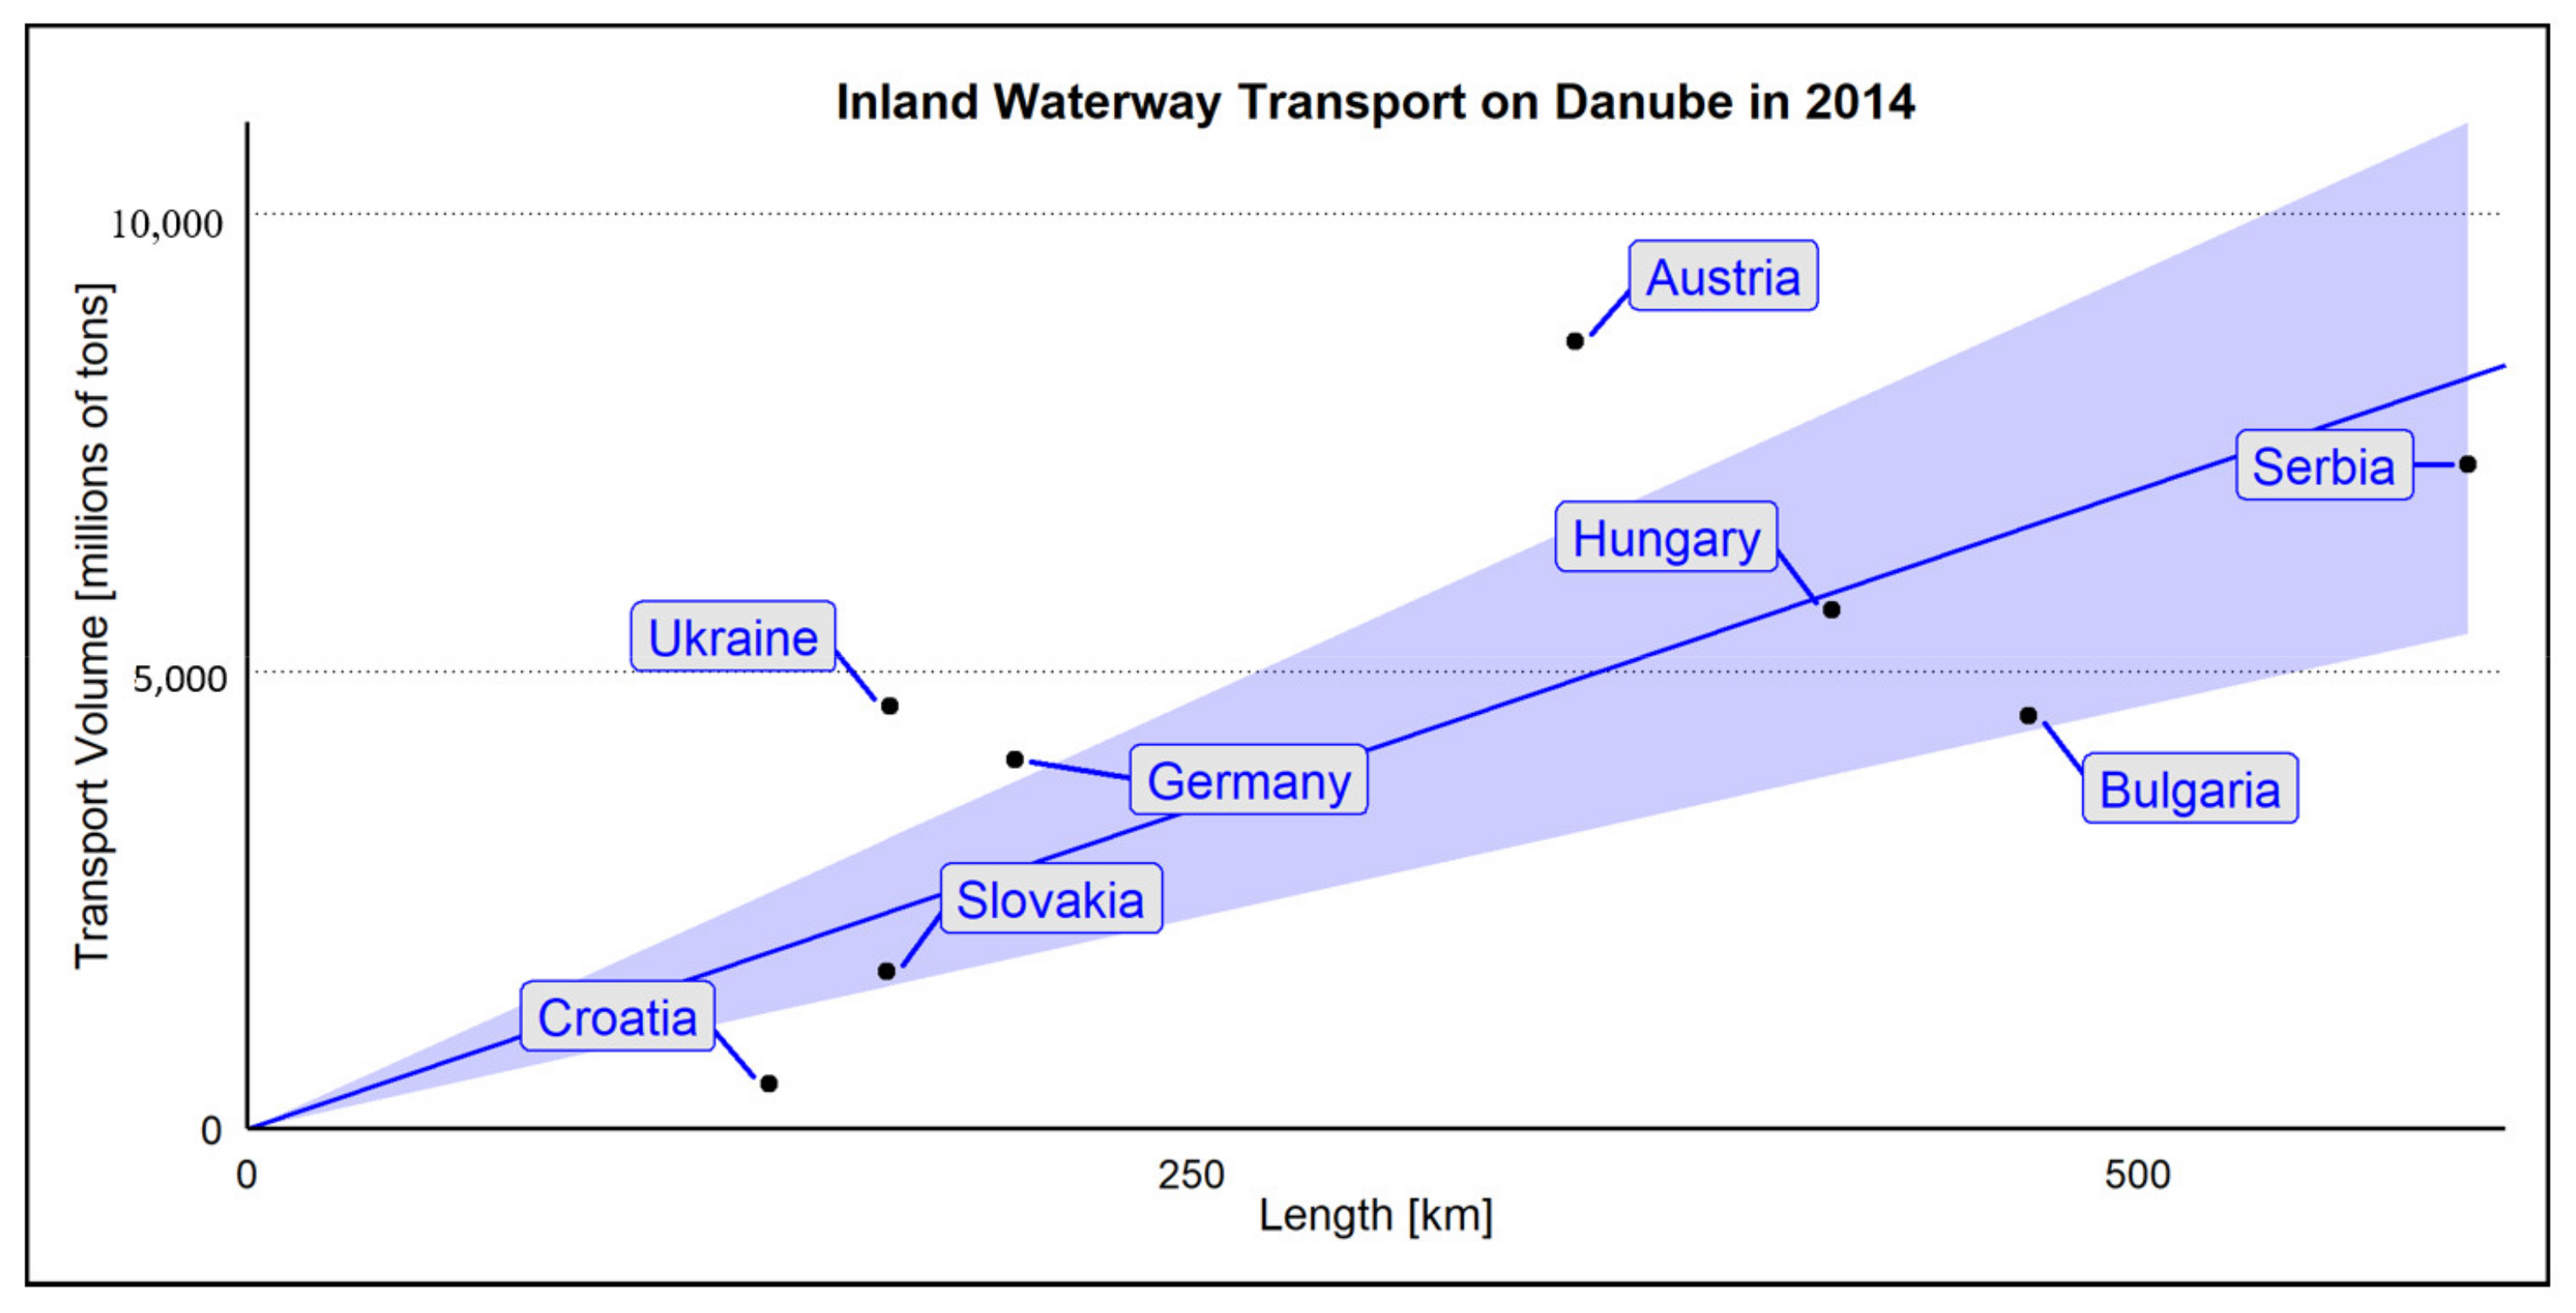
Values of the amount of cargo handling based on the length of the section of the Danube in a specific year with regression line and 95% confidence interval are displayed in next figures (
Figure 4,
Figure 5,
Figure 6,
Figure 7 and
Figure 8):
The results of the regression analysis show that there was no change in the character of monitored dependence during the period between 2014 and 2018. Except in 2014, when it was not possible to obtain data from Romania, which were not available, the estimated value of parameter reached values in the interval . For example, in 2014, this fact means that every kilometre of the Danube noted the rise of cargo handling in an average value of 13.988 million tons.
4.1. Calculation of Values Using Linear Regression
To express an exact value, it is necessary to know two main variables: the length of the section (
Table 1) and the overall cargo handling in inland river ports (
Table 2). According to this methodology, it is possible to express the model volume (
Table 4).
Values of residues (
Table 5,
Table 6 and
Table 7) show how the real values of cargo handling defer from the expected values of cargo handling based on the regression model presented in this article. The biggest values of residues were observed in the Ukraine and Austria. In this case, the positive values in all observed years were achieved by Romania, too. It means that the volume of cargo handling in the Ukraine, Austria and Romania is higher than the calculated amount based on regression model. On the other side, Hungary, Slovakia, Croatia, Serbia and Bulgaria achieved negative values of residues in all observed years. This means that the amount of cargo handling was smaller than the expected values based on the regression model presented in this paper. These results show big stability of the overall amount of cargo in individual states with a high potential for the transition of the transport performances from road transport to the sustainable and environmentally friendly water transport on the Danube. There was only one state that achieved positive and negative values: Germany. It means that these values are also connected with the economic situation and decisions of authorities in individual states.
Negative value of residues (
Table 5) can be understood in the way that in every state, the number of cargo handling is lower than the theoretically achieved volume based on the regression model. For example, Slovakia achieved the amount of cargo handling of 2.009 M tons in 2015. On the other hand, the estimated value based on the regression model, taking into account the length of the section, was calculated on 2.538 M tons. The difference of 0.529 M tons could be understood as a potential of the Slovak section, which is not used.
The comparison of real and optimal values of cargo handling in Hungary, Croatia, Slovakia, Serbia and Bulgaria is mentioned in
Table 8 and
Table 9. The percentage difference of 38% for Slovakia in 2014 means that, the overall amount of cargo handling rose by 38%, from 1.715 M tons to 2.364 M tons. Based on the calculated values, it can be observed that the cargo handling in the Croatian section of the Danube is considerably undersized. The overall amount of cargo handling on the Croatian section of the Danube can rise by more than three times to adequately reach the value calculated based on the regression model presented in this paper and the length of the section of 138 km.
4.2. Case Study
The use of available capacity on the Danube is interesting from the view of sustainability and environmental protection. Overall emissions per 1 ton and kilometre produced by inland river vessels could be compared with emissions produced by rail and road transport.
For the purpose of comparison, the model transport relation was determined. The initial point was located in the port of Passau and the final destination was located in the port of Constanta. These two ports are not a part of airports, so this proposal does not consider the use of air transport, because the main idea of this case study is to point to possibilities of specific means of transport. For this reason, it is suitable that the transport is done by only one means of transport, without the use of combined transport.
This case study compares the amount of emissions per unit of transport performance (tonne–kilometre). This contribution is mainly focused on the emissions of CO2, which is the main cause of climate changes.
The biggest difference between transport by individual means of transport could be observed in the distance. The infrastructure of rail, road and inland waterway transport does not run on the same route due to nature and economy conditions. This fact causes the distance between the port of Passau and the port of Constanta to be the same for all means of transport. The shortest distance between these two ports can be observed in the case of rail transport at 1261 km. On the other hand, the longest distance that must be overcome by means of inland water transport is 2224.5 km [
29].
Emissions produced by rail transport depend on the type of traction, maximum power of electric engine and the type of source of electric energy (nuclear, coal, etc.). The average power consumption of electric trains based on the Tier 2 model is 0.03 kWh per ton–kilometre. Therefore, the overall consumption of electric trains using electric engines with a total power of 4480 kW (locomotive type Škoda 131/ E 479.1), transporting the equivalent of one tonne between Kelheim and Constanta, is 37.83 kWh. The production of electricity in Central and Eastern Europe is based on coal and nuclear sources. The combination of these sources means the production of 843.33 g of CO2 emissions per kWh. The distance between Kelheim and Constanta by using rail transport is 1261 km. The amount of CO2 emissions produced by means of rail transport (electric locomotive) during transportation of one tonne is 25.3 g per 1 km. It means that transportation of one tonne for the distance of 1261 km by rail transport produces 31,903.3 g of CO2 emissions (1261 km × 25.3 g of CO2 per kilometre = 31,903.3 g of CO2).
The distance between Kelheim and Constanta by using inland water transport is 2224.5 km. The amount of CO2 emissions produced by means of inland water transport (inland river vessel) during transportation of one tonne based on the EMS presented in the Netherlands is 50.62 g per 1 km. The fuel of the vessel is diesel oil. It means that transportation of one tonne for the distance of 2224.5 km by inland water transport produces 112,604.19 g of CO2 emissions (2224.5 km × 50.62 g of CO2 per kilometre = 112,604.19 g of CO2). Nowadays, new types of fuels have appeared. The highest potential is observed in the case of hydrogen. This type of fuel can reduce the amount of CO2 emissions.
The distance between Kelheim and Constanta by using road transport is 1584 km. The amount of CO2 emissions produced by means of road transport (truck using engine with the emission class EURO 6b) during transportation of one tonne is 139.8 g per 1 km. This amount is based on different studies, such as fuel sold/fuel used emissions or direct measurements emissions. These studies calculated the amount of emissions based on methods using direct measures of the content of greenhouse gasses in exhaust gases of vehicles. Different studies and models used this type of measurement, expressing the overall amount of CO2 produced during transportation of one tonne of cargo by a truck, using a diesel engine with emission class EURO 6 for 139.8 g per 1 km. This value is also affected by the power of the diesel engine. It means that transportation of one tonne for the distance of 1584 km by road transport produces 221,443.2 g of CO2 emissions (1584 km × 139.8 g of CO2 per kilometre = 221,443.2 g of CO2).
On the other hand, it is necessary to admit that using new types of fuels in road transport should significantly reduce this amount. On the other hand, this possibility is based on favourable infrastructures and an available system of hydrogen stations and charging places for trucks. These facilities are quite rare in the Central and Eastern Europe. [
30]. Based on these data, it is possible to observe that the biggest amount of emissions of CO
2 are caused by means of road transport. Inland water transport is in second place and rail transport is third place.
Road cargo transport causes the largest amount of emissions for its distance. The transport of one tonne of cargo for the distance of 1584 km by means of road transport with emission class EURO 6 produces, overall, 211,443 g of CO
2 emissions. Road transport is correctly referred to as the biggest polluter of the air and the cause of climate changes. This fact confirms the effort of international institutions to move many traffic performances to the more environmentally friendly means of transport (rail transport and inland river transport). This case study also confirms that the overall emissions produced by inland water transport is at half the level in comparison with road transport and rail transport, achieving the smallest volume of emissions [
31]. It is also necessary to say that means of inland water transport overcome the longest distance. That confirms the general underestimated fact that inland water transport is one of the most environmentally friendly means of transport for long distances (
Table 10). In addition, these emissions of inland water transport are combined (upstream and downstream emissions). The route between the port of Passau and the port of Constanta leads downstream, so in this way, it is possible to achieve smaller emissions of CO
2 than we expected.
4.3. Application of the Case Study on Available Capacity on the Danube Waterway
These factors support the idea to use the available capacity on the Danube in individual countries calculated based on the presented model. Based on the data, the overall average available capacity of the Danube waterway between Germany and Ukraine is 30.11%. In 2018, the overall cargo handling on the Danube achieved the volume of 60.419 M tons. A total of 30.11% of this volume is 18.19 M tons. In addition, transportation of this additional amount of cargo by means of road transport can produce 2542.962 tons of CO2 emissions per kilometre. On the other hand, transportation of this additional volume of cargo by means of inland water transport, using the available capacity, could produce 920.777 tons of CO2 emissions per kilometre. In comparison with road transport, using the available capacity on the Danube waterway could reduce the amount of CO2 emissions for more than 1622.185 tons. This is strong evidence for why it is necessary to know the possibilities of more environmental means of transport and to move the largest amount of traffic performances to these means of transport as soon as possible to reduce climate changes not only in Europe, but worldwide as well.
5. Discussion
The main aim of this paper is to reveal the available capacity of water transport in the Danube Region and to propose how it could be possible to use this available capacity related to changes in transport flows from road transport to more environmentally friendly means of transport. There are two partial aims: to use regression analysis to reveal the potential of the Danube as an alternative way of transport with sufficient capacity for the transportation of different types of cargo; and the second partial aim is to show how the use of this waterway and its capacity could help to reduce the overall amount of CO2 emissions in Europe. This paper suggests using the available capacity for moving more than 18 M tons of cargo to means of inland water transport. This transition of transport performance related to the available capacity on the Danube could reduce the overall amount of CO2 produced in transport by more than 1622 tons.
The idea to move a significant part of the traffic performance to sustainable and environmentally friendly means of transport is quite popular. On the other hand, this process reveals new challenges connected with the lack of models and studies that really reveal possibilities of sustainable means of transport. In addition, inland water transport is generally underestimated in many regions, which is closely connected with higher additional cost for the construction and maintenance of waterways. This fact often discourages many countries in Central and Eastern Europe to use the potential of the Danube and other waterways. The results of the presented model highlight that the largest available capacity is in the countries (for example Slovakia) that do not invest significantly in water transport due to lack of own finances. Efficient models that reveal the possibilities and available capacity without additional investments could contribute to better understanding of the potential of inland water transport on the Danube.
Firstly, it is necessary to summarise this basic information the length of section (km) and the development of cargo handling in ports within this section. Next, it is necessary to express the future development, according to the basic least squares method. Afterwards, the presented model compares this estimated future development with the real state, expressed by official statistics. Thanks to this comparison, this model expresses the level of available capacity in individual sections and the overall level of available transport capacity on the Danube. Then, the case study presents the amount of emissions produced by inland water transport in a particular route. The main contribution is to connect these topics together. The conclusion of this study expresses the overall emissions produced by road transport to transport the volume of cargo corresponding the available capacity on the Danube. At the end, this amount is compared by the overall emissions produced by vessels to transport the same amount of cargo corresponding to the available capacity on the Danube.
The presented model is based on current possibilities and reflects the real available capacity with the current equipment and current system of loading and unloading. The promotion of available capacity of the Danube without additional investments could be the first step in the process of transition of the traffic performance from road transport to inland water transport in Central and Eastern Europe. However, this transition could also contribute to transport systems in these countries and provide additional finances from Euro funds to revive the well-developed port network in this region. The transition of the traffic performance from road transport to inland river transport could contribute to decline in traffic congestion and traffic jams in the capital cities of Bratislava, Budapest, Vienna and Belgrade. This could also reduce the accident rate and the number of fatalities caused by road accidents. Road cargo transport also significantly contributes to the production of greenhouse gasses [
32,
33,
34]. New emissions classes are presented, but the overall emissions produced by road transport are still high, especially for the transport of heavy cargo over long distances. This is the reason why the European Union is making an effort to move a significant part of the traffic performance to more sustainable means of transport. According to the results of the case study in this paper, rail transport and inland water transport could be a suitable alternative. The amount of CO
2 emissions per 1 tonne and kilometre is less than half in the case of inland water transport and significantly lower in the case of rail transport. New emission classes could contribute to the effort to decrease this significant difference. On the other hand, this case study also revealed the fact that distances between industry centres are not same. They are different, according to the local conditions and mean of transport. The connection of the presented model with comparison of emissions produced by means of transport on the specific transport route promotes the evidence for the transition from road transport to more environmentally friendly inland river transport. However, the overall emissions produced by inland water transport are affected by the direction of inland navigation [
35,
36]. The presented amount of emissions for inland river transport per tonne and kilometre represents the average emissions per navigation upstream and downstream. In addition, the overall amount of emissions could be much lower than the presented amount in this case because the navigation from Passau to Constanta leads downstream. At the end, there is a large available capacity on the Danube. The main aim of this paper is to present how this available capacity could contribute to sustainable transport on the Danube. The evidence for the decline in CO
2 emissions is unquestionable. The transportation of the amount of cargo expressed in the presented model by inland water transport could cause significant reductions in CO
2 emissions by more than 920 tons of CO
2 per kilometre (in comparison with road transport). This is the main reason why it is favourable to use the available capacity on the Danube.
This available capacity could be used to transport dry bulk cargo, liquid cargo or Ro-Ro cargo. There is also a high potential to use the Danube waterway for intermodal transport. Heavy goods and oversized cargo are also suitable for inland river transport. These types of goods could flow in large scale from the inland of Central and Eastern Europe to the seaports on the coast of the Black Sea, thanks to the Main–Donau Canal to the ports of the North Sea. Thanks to these favourable conditions and available capacities, the future development of inland river ports could be oriented into dry bulk cargo handling, Ro-Ro, container and liquid cargo handling. On the other hand, general cargo and reefer cargo are not suitable for inland river transport. General cargo is often oriented into the time of delivery. Reefer cargo requires appropriate conditions connected with cooling aggregates. Most inland river vessels are not adjusted for the transportation of reefer cargo, and pushed convoys require additional improvements.
New technologies, such as electric power in road transport and water transport, have appeared. On one hand, the efficient operation of road and water cargo transport using hydrogen or electricity needs a favourable infrastructure with a sufficient number of fuel stations and charging stations. In Central and the Eastern Europe, the conditions for the operation of these alternative sources are not favourable, due to the economic situation and transformation changes. This is the reason why new fuel technologies for water and road cargo transport have not been considered. This paper is trying to show that there is a sufficient potential for the reduction in greenhouse gasses without additional investments, using the current possibilities. This is the main innovative point—using the current capacity and current possibilities, we can decrease the amount of CO2 now. Compared with other studies, this paper proposes current possibilities that are favourable for all countries without differences in GDP. Other studies and conventional methods have proposed new technologies that could be implemented into practice in the next 5 or 10 years due to the needs of additional investment projects. The authors believe that the overall time of the reduction of CO2 emissions, problems connected with insufficient financial sources and the time of implementation of new projects aimed at sustainable transport systems can be resolved by the conclusions of this paper. The implementation of new technologies is useful but it takes a long time, so first we should be focused on possibilities that are available immediately. Then, it is necessary to say that the possibilities of using the current means of transport presented in this paper are the basis of the development of gradual changes in transport related to new types of energy in transport. The conclusions of this paper represent the exact materials for future research aimed at fields of using new energy systems in transport.
The generality of this paper and the research framework provide a method that could be implemented immediately in all countries not only in Europe, but all around the world because it proposes a cheap and efficient way for CO2 reduction that is applicable in poor and rich countries and during financial crises, too. The impact of this paper for policy implications could be oriented toward the positive discrimination of water and rail transport connected with lower taxes and European funds and into transport planning connected with the interconnection of different regions of the European Union oriented into the trans-European transport network.
The next studies could be oriented into the comparison of rail and road transport. Based on the presented model, it could be possible to compare rail transport and road transport or inland river transport with rail transport. Studies that define which types of cargo are suitable for use in this available capacity, based on practical knowledge and requirements, and which types of cargo are more suitable for rail transport and road transport will be significant for the development of transport on the Danube, too. These studies could contribute to the better relocation of the transport performance between road, rail and inland river transport.
The authors strongly believe that this study will contribute to further research oriented toward sustainable transport systems and the relocation of transport performances in Europe. This effort could create an environmentally friendly and sustainable transport system and could contribute to future investments and development in Central and Eastern Europe.
6. Conclusions
The main idea of this paper was to express the available capacity on the Danube, according to the model, to promote inland water transport as a sustainable and environmentally friendly means of transport. Generally, inland water transport plays a significant role in transporting bulk, general, and liquid cargo, including intermodal transport units, such as containers or vehicles. The model presented in this article revealed an average of 30% available transport capacity on the Danube, which represents more than 18 M tons. The transition of traffic performance from road transport to inland water transport to transport more than 18 M tons could reduce the production of CO2 emissions by more than 1622 tons per one kilometre. This is the main contribution of this paper.
Based on the summary of information about the length of the section (km) and the development of cargo handling in ports within the individual section, it was possible to express the future development according to the basic least squares method. Afterwards, the presented model compared this estimated future development with the real state, expressed by official statistics. Thanks to this comparison, this model expressed the level of available capacity in individual sections and the overall level of available transport capacity on the Danube. Then, the case study presented the number of emissions produced by inland water transport in a particular route [
36]. The main contribution is to connect these topics together. The conclusion of this study expresses the overall emissions produced by road transport to transport the volume of cargo corresponding to the available capacity on the Danube. At the end, this amount is compared with the overall emissions produced by vessels to transport the same amount of cargo corresponding to the available capacity on the Danube.
The emissions presented in this paper are average emissions of CO2 (g/tkm). However, as it was mentioned, in this case, it is necessary to distinguish between individual conditions. These conditions could cause the level of emissions to be higher or lower than it was presented in this paper. The most significant conditions in this point of view are the downstream or upstream navigation in inland water transport, emission class in road transport and the type of traction in railway transport.
The available capacity on the Danube waterway could rise or fall, according to the level of investments or plan of developments. According to the data and presented model, there is a large potential in many countries around the Danube. The favourable politics aimed at water inland water transport will contribute to the economic development of these countries.
In addition, this development will protect the future generations against higher levels of climate changes. The reduction in CO2 emissions will help countries to reach climate neutrality, which is also the aim of the European Union.


