Article

When Bad Becomes Worse: Unethical Corporate Behavior May Hamper Consumer Acceptance of Cultured Meat

Department of Psychological and Behavioural Science, London School of Economics and Political Science, Houghton Street, London WC2A 2AE, UK
*
Author to whom correspondence should be addressed.
Sustainability 2021, 13(12), 6770; https://doi.org/10.3390/su13126770
Submission received: 28 April 2021 / Revised: 4 June 2021 / Accepted: 7 June 2021 / Published: 15 June 2021

Abstract

:
Cultured meat is an emerging food innovation that promises to be a more sustainable alternative to conventional meat. However, despite its potential health, environmental and animal welfare benefits, research suggests that consumer acceptance of cultured meat is not assured. Across two pre-registered experimental studies (N = 456), this article investigates the extent to which two different credence characteristics, namely corporate social responsibility (Study 1) and food safety (Study 2), lead to halo-based inferences that may affect the consumer acceptance of cultured meat. Results indicate that, whereas the halo effect of positive corporate behavior is negligible, negative corporate behavior yields a substantial negative halo effect on consumers’ attitudes towards cultured meat, which in turn decreases acceptance of cultured meat. Findings also reveal that these negative halo-based inferences are heightened among consumers who value highly corporate social responsibility (Study 1) and food safety (Study 2). Overall, this article reveals an asymmetric halo effect by showing that people tend to react strongly to negative, but not to positive, information about a cultured meat company. The implications of the present research are discussed in the conclusion.

1. Introduction

Cultured meat (CM) is an emerging food innovation that promises to be an alternative to conventional meat [1,2,3]. CM is produced by placing animal stem cells in an appropriate medium and growing them directly, structured by scaffolds, into desired forms [4,5,6]. Consuming CM instead of conventional meat may lead to societal benefits, such as improved animal welfare and human health as well as a reduced environmental impact [5,7,8], especially lower greenhouse gas emissions [9,10,11]. If materialized, these benefits may constitute CM as a “sustainable innovation” [12], which like plant-based meat, processed insects and algae [13,14], can accelerate the transition towards a sustainable food system [15] by enabling supply-side substitution of adverse consumption patterns [16,17].
Despite these promises, CM is still facing several challenges before a market introduction can be expected [15,18], and its acceptance by consumers remains uncertain [3,19,20,21,22]. Moreover, some of those who are involved in the CM industry are afraid that the unethical behaviour of a CM company—a black sheep—could “stigmatize” CM products [23], similar to what happened to genetically-modified foods in Europe [24]. In this perspective, the present research investigates how a CM company exhibiting positive or negative behavior in terms of social responsibility or food safety dimensions may influence the perception and acceptance of its CM products.

1.1. Theoretical Background

Understanding the factors that influence the willingness to try CM will be determinant to the success of this sustainable food innovation. Prior research has identified various dimensions. For instance, as expected from positive predictors for adopting innovations in general [25], it has been found that cross-culturally, lower age, higher education, left-leaning political affiliation, living in a city and higher income are positive predictors of willingness to try CM [19,20,26,27,28,29,30]. Additionally, people who approve of other novel food technologies, such as genetically-modified organisms, or who hold attitudes that are consistent with CM’s prospective benefits, such as strong environmentalist beliefs, have a higher willingness to try CM [27]. To the contrary, those with higher food neophobia (i.e., who have a fear of or aversion to new foods) are less willing to try CM [26,29,31,32].
When examining more specifically why people are not more willing to purchase CM compared to other meat alternatives, studies find that CM is perceived to be less natural and to pose a higher risk than conventional meat [33,34]. However, prior research demonstrates that acceptance of CM can be influenced by the information provided with CM products. Consumer acceptance may increase when positive information on CM is provided [28,35,36] or when it is described in a non-technical way (e.g., not using the word biotechnology; [34], experiment 2; see also [37]); but may also differ by how it is named [38,39,40,41,42]. Other studies showed that acknowledging that CM is unnatural, when compared to emphasizing that naturalness is unimportant [43] or anchoring it on “unnatural but safe” products like selectively bred vegetables [44], may increase its acceptance by consumers.
The latter results illustrate the importance of “credence characteristics” in relation to CM. Credence characteristics are one type of product characteristics known to play an important role in consumer behavior toward food products [45,46]. Whereas a product’s “experience characteristics”, such as taste and texture, can be directly evaluated by the consumer during consumption, credence characteristics, such as corporate social responsibility (CSR), product safety or quality claims (e.g., organic, fair-trade), cannot be evaluated directly by consumers. Instead, consumers need to rely on a third party to evaluate such characteristics. Thus, credence characteristics are dependent on the “credibility of the seller in relation to the buyer” [47].
Interestingly, credence characteristics can in turn influence experience characteristics through the halo effect [48,49]. The halo effect was first observed in the early 20th century [50] and was formally analyzed in the context of performance ratings [51]. This effect describes the tendency in the formation of impressions of people or things to align evaluations on unrelated dimensions with an initial impression [52,53]. One classic example of the halo effect is that physically attractive people are typically rated, on average, to be more intelligent [54]. In other words, the initial impression (e.g., physical appearance) casts a halo over other specific and unrelated impressions (e.g., intelligence).
The halo effect is a well-documented psychological mechanism [55] and is widely researched in relation to sustainability (e.g., [56]) and consumer behavior of food (e.g., [57,58,59]). CSR and product safety or quality claims, particularly organic or fair-trade labels, are typical primes employed in the literature on halos in food consumption [45,46]. For instance, prior studies showed that consumers judged chocolate as having fewer calories when described as fair-trade [59] and wine as tasting better when produced by a company engaged in socially responsible behavior [60]. Research also described the influence of halo effects on meat perception, indicating that both a positive and negative halo yielded a change in consumers’ perception of a meat product. For instance, organic meat received higher perceived taste ratings and consumers had a higher willingness to pay for it compared to conventional (non-organic) meat [49,61,62,63], illustrating a positive halo effect. Conversely, factory farmed meat received lower taste ratings [64], illustrating a negative halo effect.
To our knowledge, the influence of halo effects has never been tested in the context of CM, and the present research seeks to close this research gap. In doing so, this research contributes to research on halo effects in food consumption (e.g., [45]), and the consumer acceptance on CM [19,20].

1.2. Hypotheses and Theoretical Framework

This article investigates how a halo created by the positive or negative (socially responsible or irresponsible; safe or unsafe) behavior of a CM company may influence the evaluation of its product on unrelated dimensions (e.g., nutritiousness, healthiness) and consumer acceptance (e.g., willingness to try). For instance, the studies in this paper test whether the socially irresponsible behavior of a CM company leads consumers to infer that its CM product (e.g., a burger) is less healthy and whether this decreases their willingness to try the product. We selected CSR and food safety as credence characteristics because alternative primes, such as organic and fair-trade attributes, did not appear to be particularly relevant to CM. CSR broadly refers to “context-specific organizational actions and policies that take into account stakeholders’ expectations and the triple bottom line of economic, social and environmental performance” [65]. In consumer research, a CSR prime may be more narrowly understood as the description of a firm exhibiting societally benevolent behavior [59,60]. Food safety is typically defined as “the inverse of food risk —the probability of not suffering some hazard from consuming a specific food” [66]. How food safety is evaluated depends on the specific context and food type [67,68,69]. A food safety prime is thus any prime that influences consumers’ expectations of (not) suffering a hazard from consuming the specific food under question.
Interestingly, consumer research on novel technologies, such as the technology acceptance model [70] and their application to food products [71], suggest that attitudes toward new food products influence their consumer acceptance. Following this logic, this research also investigated whether the hypothesized halo effect on consumer acceptance of CM would be mediated by attitudes towards CM. In this perspective, the present research suggests that a positive (negative) CSR or food safety priming would create a positive (negative) halo and thereby positively (negatively) influence consumer acceptance of CM.
Several studies also found that the effect of a halo prime can be moderated when consumers have congruent values towards what the respective halo stands for. For instance, studies found that organic, fair-trade or eco-friendly products were rated more positively when participants exhibited value congruency [46,48,59,72,73], such as pro-organic attitudes. Along this line of argument, it is expected that the effect of the CSR or food safety primes on consumer acceptance will be moderated by consumers’ values about CSR or food safety. More specifically, it is expected that when consumers hold congruent values about CSR or food safety, the halo prime will lead to a more positive evaluation in the positive halo condition (assimilation effect) and, conversely, when consumers hold non-congruent values, the halo prime will lead to a more negative evaluation in the negative halo condition (contrast effect).
Put formally, we hypothesized that:
Hypothesis 1 (H1).
A positive (negative) priming will increase (decrease) attitudes towards cultured meat and consumer acceptance of cultured meat, when compared to control condition.
Hypothesis 2 (H2).
The effect of priming on consumer acceptance of cultured meat will be mediated by attitudes towards cultured meat.
Hypothesis 3 (H3).
The effects of priming on consumer acceptance of cultured meat and their mediated paths over attitudes towards cultured meat will be moderated by the consumer’s value congruency with the prime.
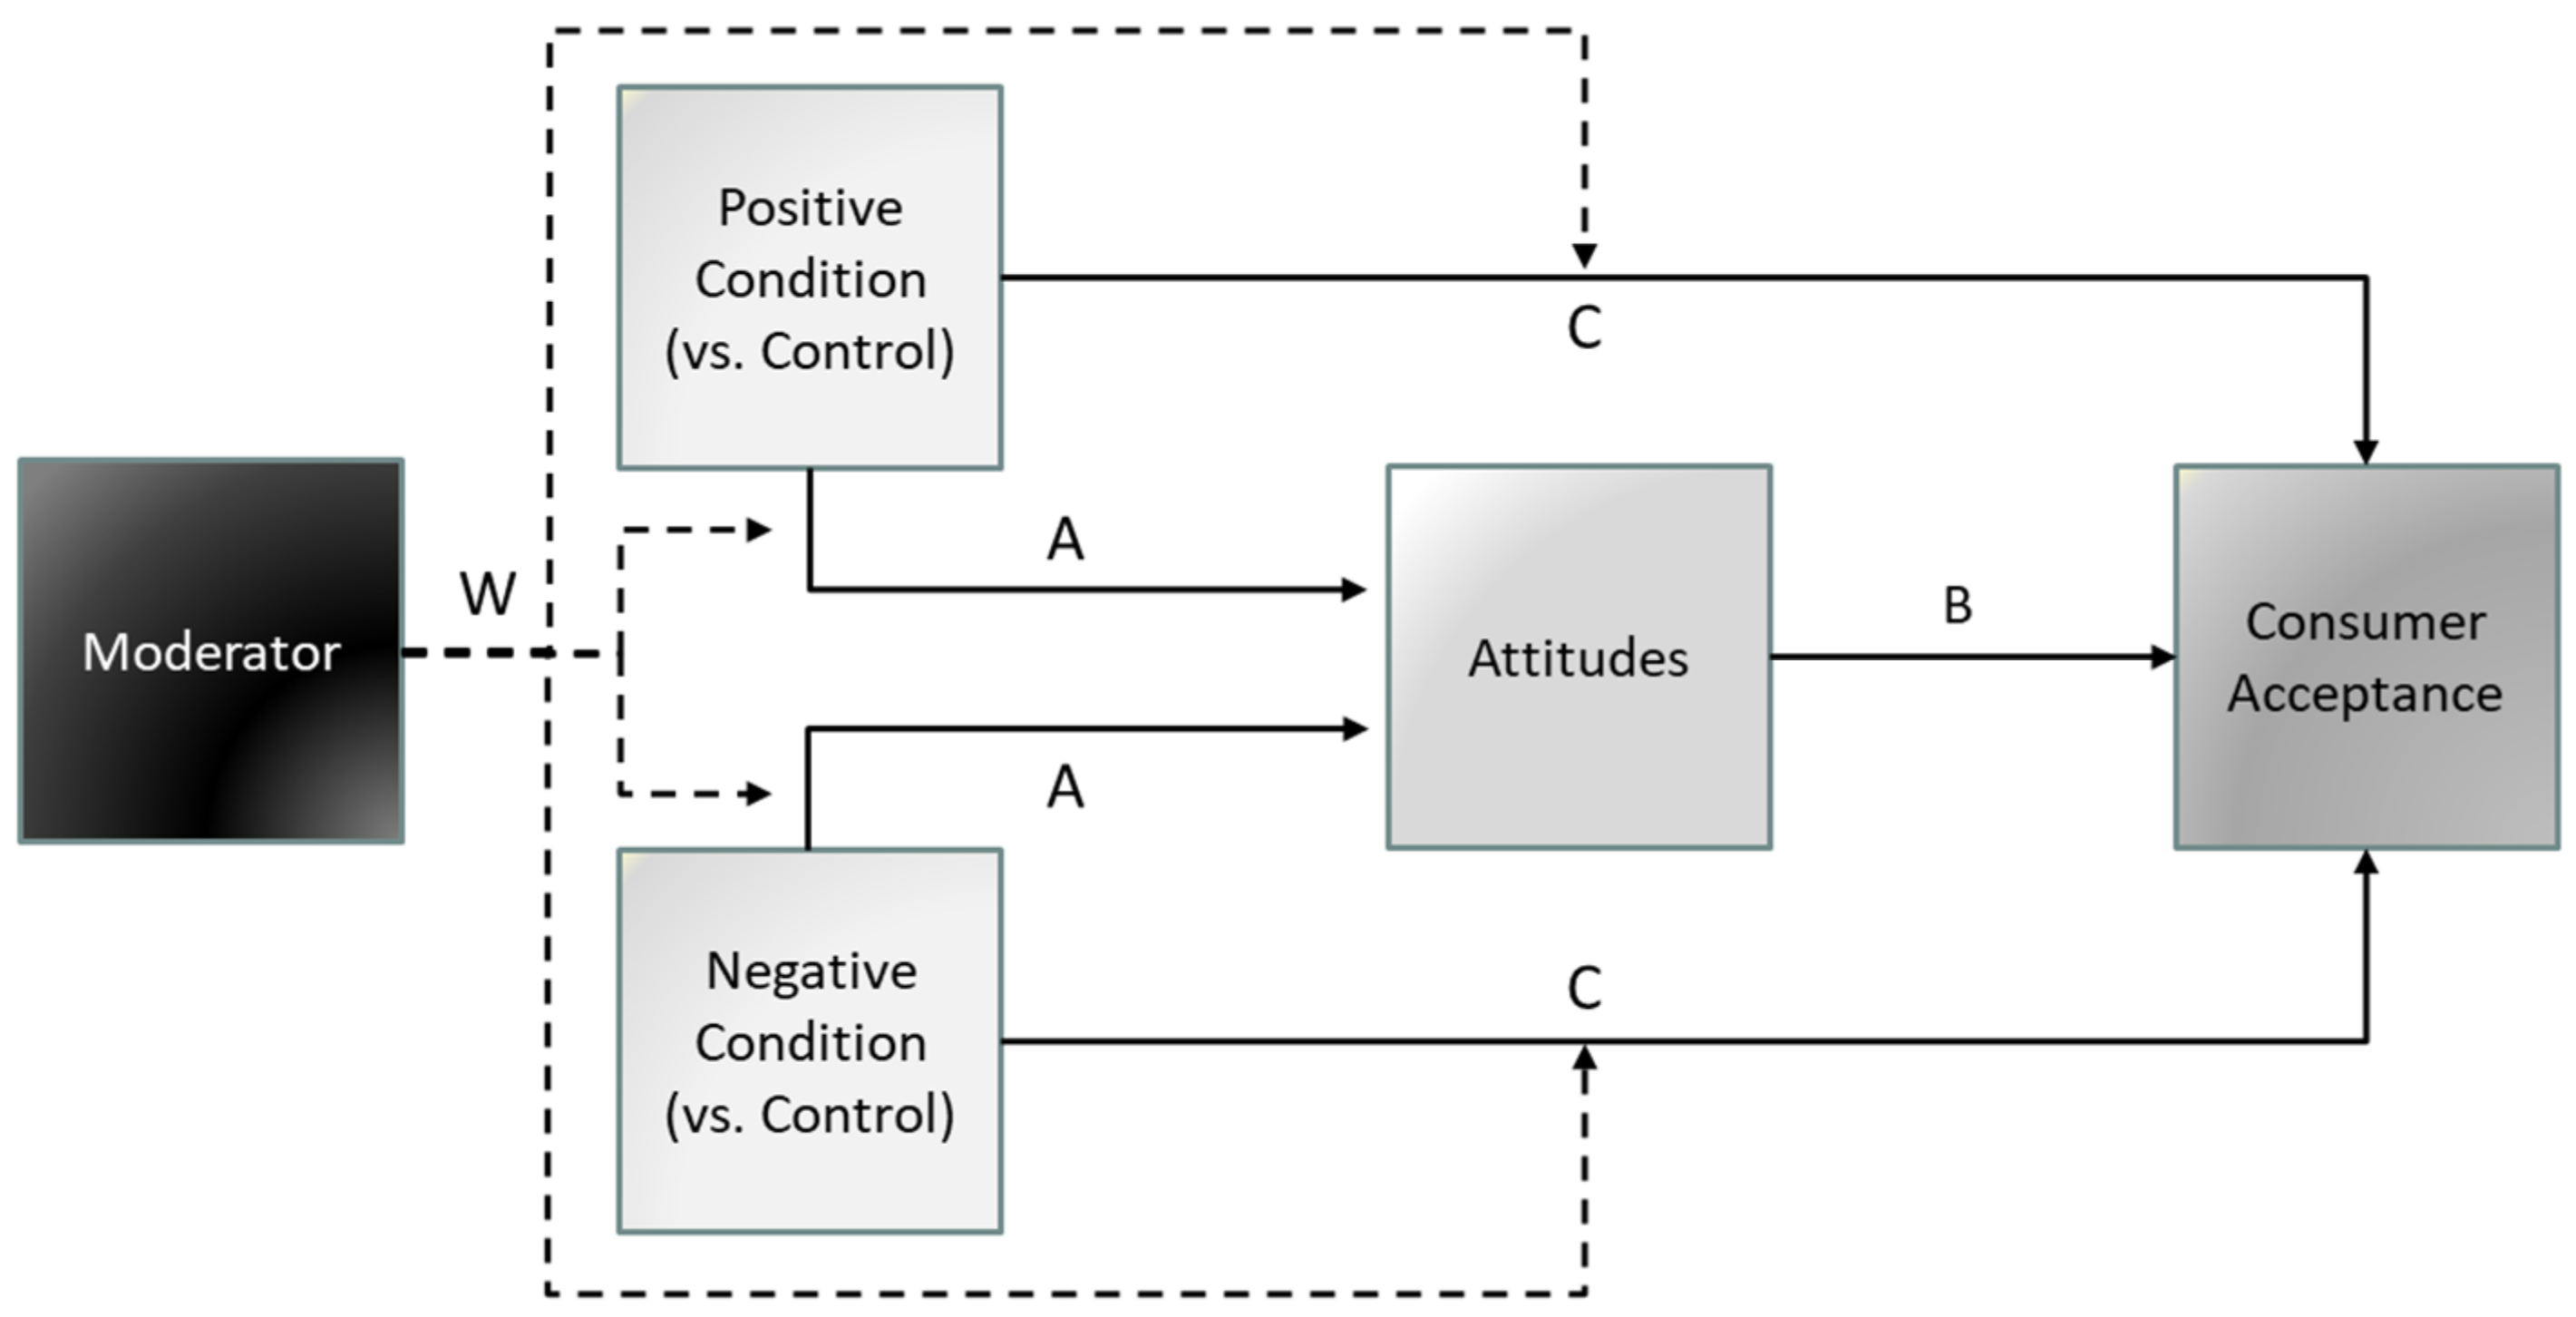
Figure 1 below schematically depicts the mediation model used in both studies to test H2.
Figure 2 below schematically depicts the moderated mediation model used to test H3.
In addition to the three main hypotheses, which are common to the two studies, we also pre-registered and tested a possible moderation by CM expertise (Study 1) and food neophobia (Study 2). These analyses are reported in Supplementary Materials S4 to keep the article within reasonable length.

1.3. Research Overview

In summary, this research investigates the extent to which inferences drawn from a CM company’s behavior (in terms of CSR or food safety) impact product perceptions on unrelated dimensions (halo-based inferences) and, in turn, influence consumer acceptance. Additionally, this research tests whether these effects are moderated by consumers’ values (about CSR or food safety). We tested our three hypotheses in two studies, first with a CSR prime in Study 1, and then with a food safety prime in Study 2. Beyond testing the effect of food safety on the consumer acceptance of CM, the purpose of Study 2 is also to provide a conceptual replication of Study 1, and show that the halo-based inferences observed in the context of this research are not contingent upon aspects of the stimuli used in the first study [74]. Both studies were pre-registered on AsPredicted (www.aspredicted.org, accessed on 28 May 2019; see Supplementary Materials S7 for full pre-registrations), and data was collected online using Qualtrics. Sample size was determined before any data analysis, and demographics, all manipulations and measures are detailed in Supplementary Materials. Data analysis was conducted with SPSS 24, and we used the addon PROCESS V3.3 [75] for mediation and moderated mediation analyses as recommended in the literature in consumer psychology [76]. These studies received approval by the local Ethics Committee. All participants gave informed consent before taking part in a study. Next, we describe the materials, methods and results of experimental studies (Section 2 and Section 3) before discussing their findings (Section 4) and concluding (Section 5).

2. Study 1

2.1. Materials and Methods

2.1.1. Participants

Study 1 was a three-group between-subjects design (positive CSR priming, negative CSR priming and control) that tested whether, when compared with a neutral description (control), a CM company’s positive or negative CSR behavior leads to higher or lower product evaluations on unrelated dimensions (e.g., healthiness) supporting the presence of halo-based inferences which in turn influence consumer acceptance of CM.
The number of participants recruited was based on an a priori power analysis using G*Power 3.1 [77,78], which indicated that a sample size of 53 per condition was required to detect a medium effect size (f = 0.25) with an α of 0.05 and a desired power of 0.80 [79]. To be on the safe side, given the exclusion criteria detailed below, we recruited 195 participants (from the United States) through Amazon’s Mechanical Turk (mTurk). They completed the experiment online in exchange for $0.60. While samples from mTurk are not representative per se, they are usually considered better than conventional undergraduate samples [80,81] and panel data [82]. A series of quality controls recommended for online studies was included [80,83,84]. Firstly, to ensure participants’ attention, only those who completed the survey through a stationary computer could complete the survey. Secondly, participants who failed the comprehension check (N = 6) or the attention check (N = 4), who self-excluded their data by indicating that they did not take part seriously in this experiment (N = 5), who did not provide their income or other demographics (N = 3), or whose reported income were outliers (N = 6), were excluded from the data analyses, leaving 171 participants (Female = 106, Male = 62, Other = 3; Mage = 38.00; see Supplementary Materials S1.1 for full demographics of this experiment). Outliers were defined as below (above) the 1st (3rd) quartile minus (plus) 1.5 times the interquartile range (Q1 − 1.5 × IQR or Q3 + 1.5 × IQR).

2.1.2. Materials and Measures

After completing a consent form and reading the instructions, participants were presented with some information on cultured meat, which was a generic, non-technical description of CM (adapted from [30]). Participants were then randomly allocated to one of three conditions: positive CSR priming, negative CSR priming and control.
Each condition entailed an initial identical section, in which participants were asked to imagine that CM is already introduced in the market. A hypothetical company producing CM (“Tomorrow Foods”) was presented and the text described one of its products, the “Hope Burger”. After this description, the (positive and negative) CSR conditions included a section called “Public Reception of Tomorrow Foods” which contained a total of 15 positive or negative modifiers and phrases, whereas in the control condition, the paragraph on Tomorrow Food’s public reception was absent (see Supplementary Materials S2.1 for complete materials used in this experiment).
For instance, in the positive CSR priming condition, participants read: “Tomorrow Foods has received thus far overall mainly positive public reception. The company appears to have been founded mainly out of a motivation to make a societal contribution. (…) For instance, it was noted that the company has an excellent work culture and humane working hours. (…) Strongly praised by non-governmental organizations (NGOs), Tomorrow Foods has built a positive reputation as an ethical producer of cultured meat”.
To the contrary, in the negative CSR priming condition, participants read: “Tomorrow Foods has received thus far overall mainly negative public reception. The company appears to have been founded mainly out of a motivation to make profits. (…) For instance, it was noted that the company has a toxic work culture and inhumane working hours. (…) Strongly criticized by non-governmental organizations (NGOs), Tomorrow Foods has built a negative reputation as an unethical producer of cultured meat”.
To ensure that the experimental manipulations were successful, a manipulation check question included directly after each condition asked participants about their general impression towards Tomorrow Foods. To determine whether the CSR prime led to (halo-based) inferences on unrelated dimensions, participants were then required to report their attitudes towards CM on a 4-item scale (perceived healthiness, nutritiousness, environmental-friendliness and safety; e.g., “Compared to conventional meat, how healthy do you think the cultured meat “Hope Burger” will be?”, 1 = Much less healthy; 7 = Much more healthy; α = 0.85), adapted from [27,30,31]. Next participants completed a 3-item scale measuring the consumer acceptance of CM (willingness to try, consumption recommendation, general impression about the product; e.g., “If you were invited to try the cultured meat “Hope Burger”, would you be willing to try it?”, 1 = Definitely not; 7 = Definitely yes; α = 0.90), also adapted from [27,30,31], and a 3-item scale measuring CSR values (e.g., “All things considered, do you think companies should give less consideration or more consideration than currently to their social impact?”, 1 = Much less consideration; 7 = Much more consideration; α = 0.89) adapted from [65], and a 2-item scale measuring CM expertise (e.g., “Generally-speaking, how unknowledgeable or knowledgeable do you feel about cultured meat?”, 1 = Very unknowledgeable; 7 = Very knowledgeable; Guttman’s Split-half = 0.88) adapted from [60]. Items within each of these scales were randomized to avoid order effects. Lastly, participants were asked to report their hunger [85,86], and the survey ended with a series of demographic questions on dietary practices [87,88], age, gender, education, political orientation [89] and income (see Supplementary Materials S3.1 for all measures used in this experiment).

2.2. Results

2.2.1. Main Effects

Manipulation check. A one-way ANOVA revealed a significant effect of the experimental manipulations on general impression about the company (F(2, 168) = 96.43, p < 0.001, ηp2 = 0.53). A post-hoc test (Tukey’s HSD) indicated that compared to control (M = 5.29, SD = 1.26), the positive CSR condition (M = 5.98, SD = 0.93) led to a more positive general impression (p = 0.017, 95% CI = [−1.28, −0.10], d = 0.62), and the negative CSR condition (M = 2.74, SD = 1.67) led to a more negative general impression (p < 0.001, 95% CI = [1.96, 3.14], d = 1.72). Results thus indicated that our manipulation was successful.
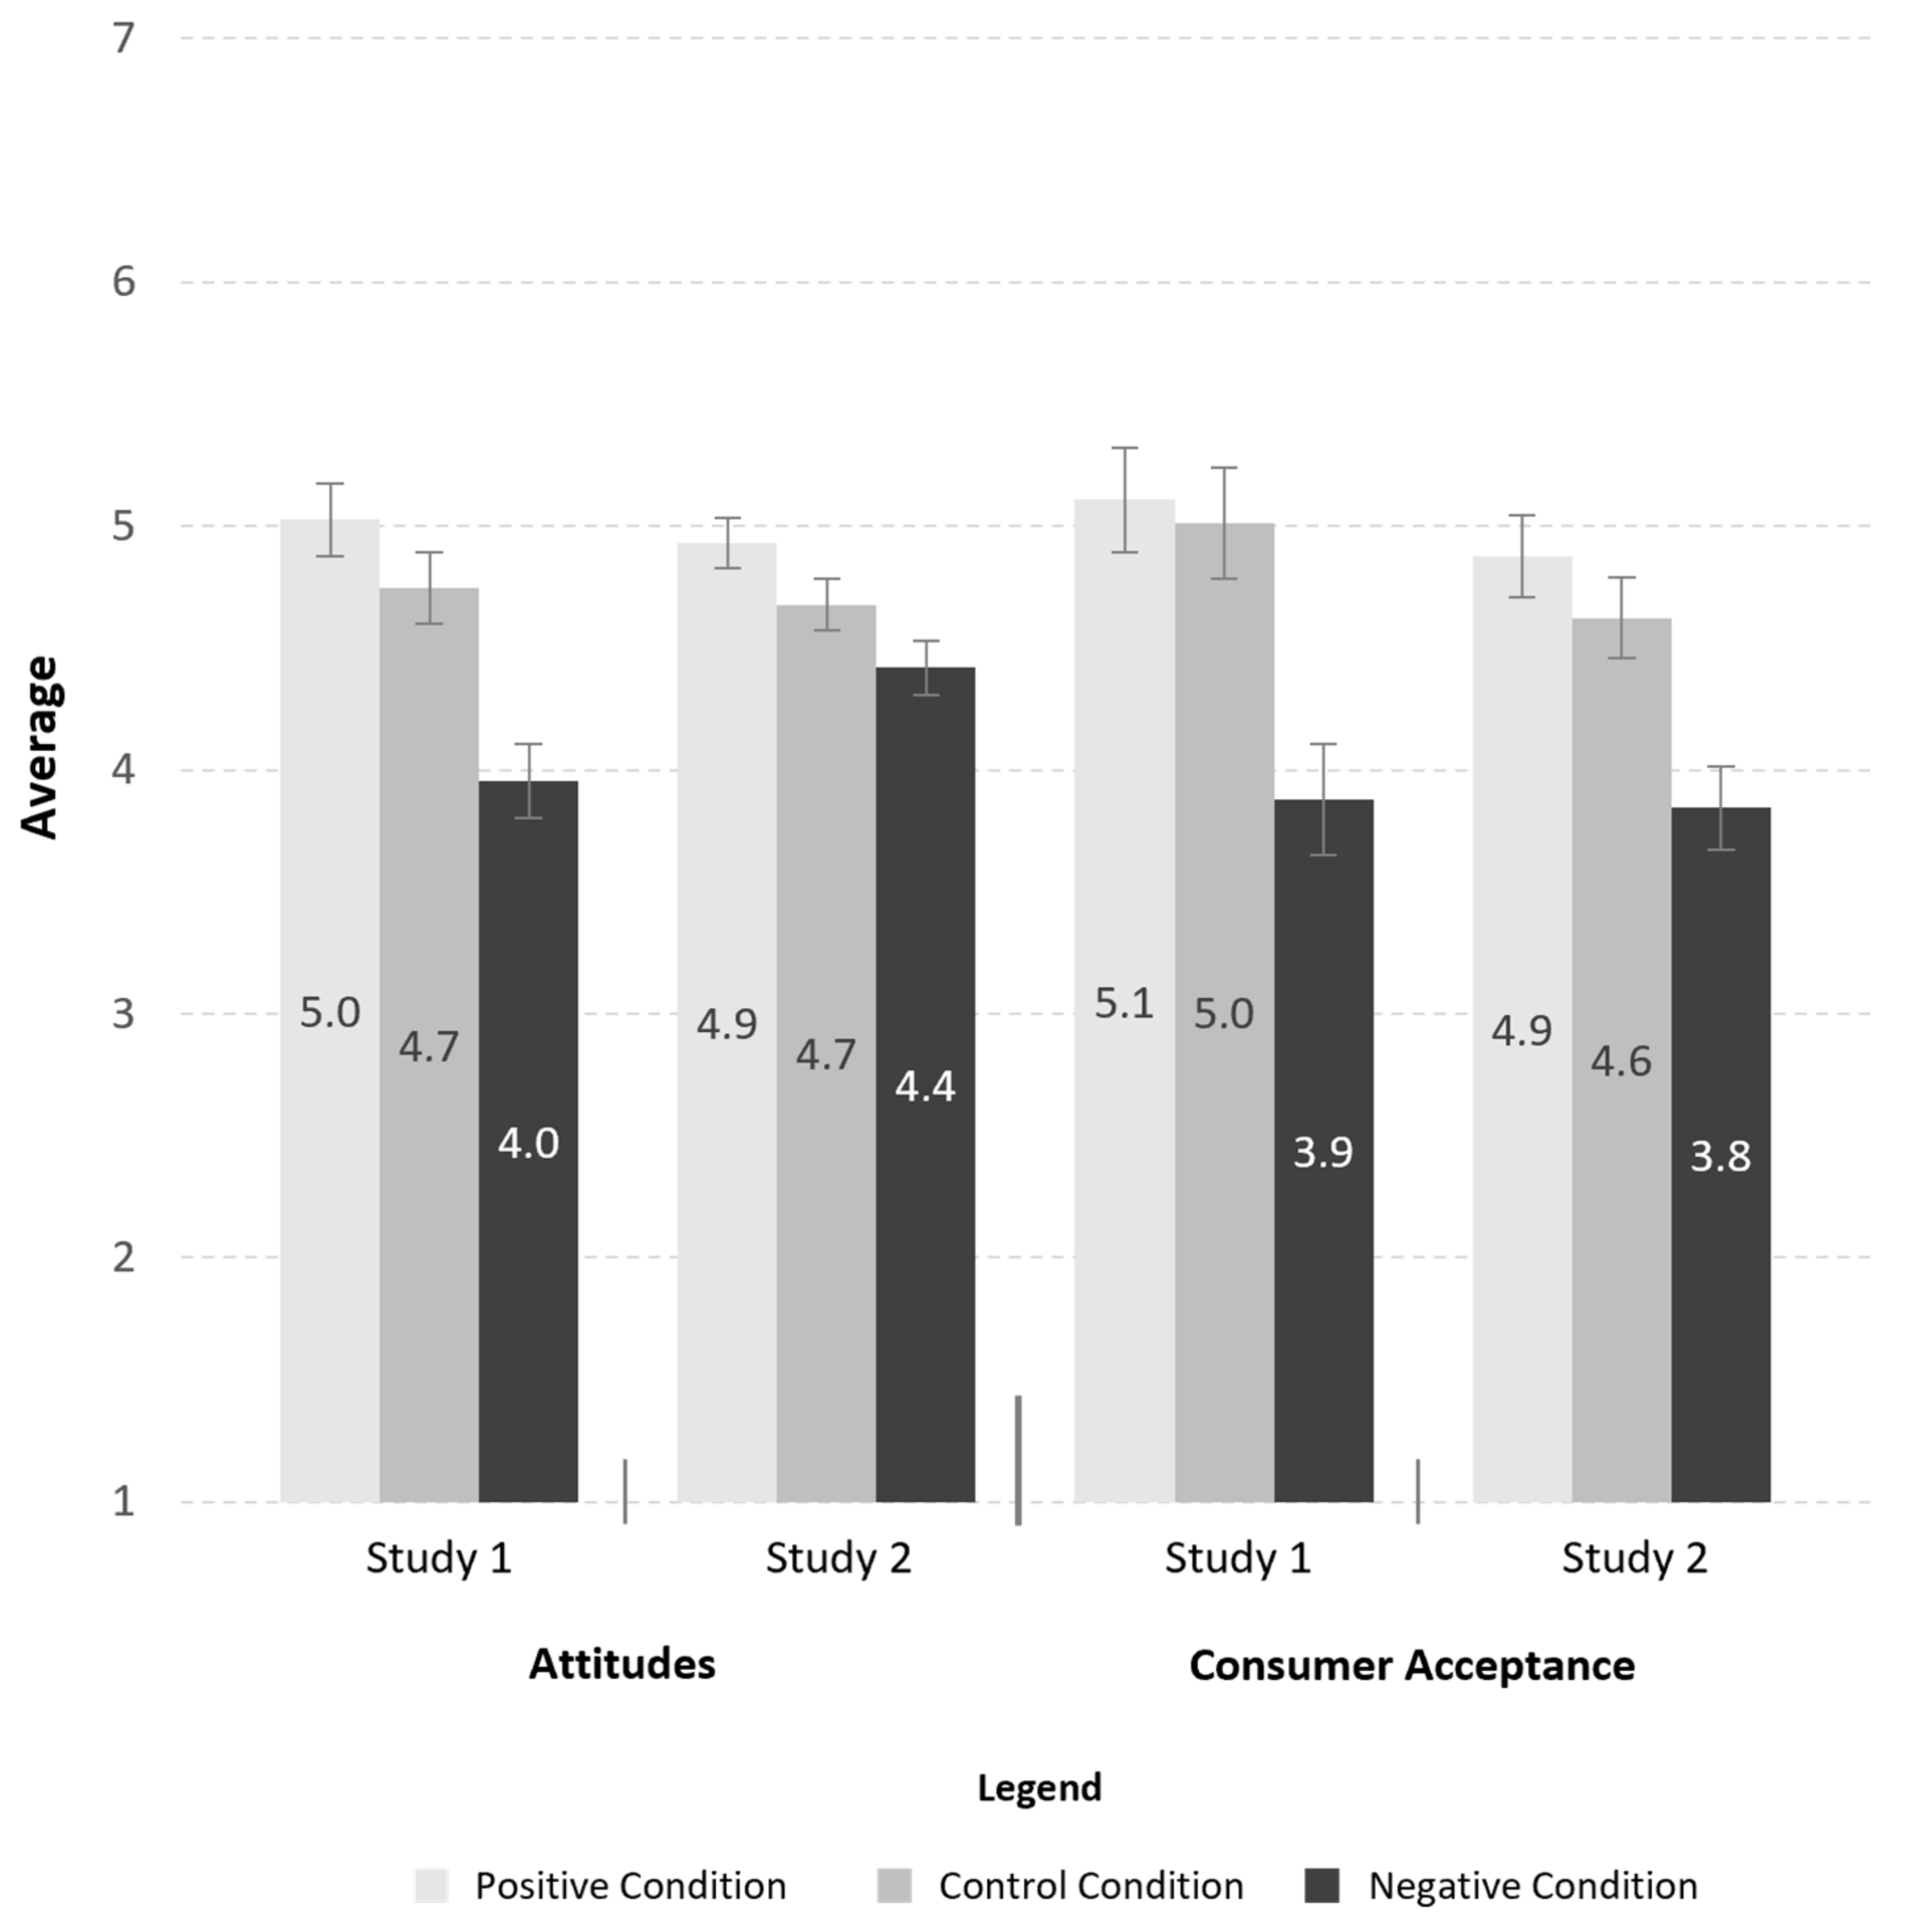
Attitudes. A one-way ANOVA showed a significant effect of the experimental manipulation on attitudes (F(2, 168) = 14.12, p < 0.001, ηp2 = 0.14). A post-hoc test (Tukey’s HSD) revealed a significant effect of the negative CSR condition (M = 3.95, SD = 1.16) when compared to the control condition (M = 4.75, SD = 1.10; p = 0.001, 95% CI = [0.29, 1.29], d = 0.59). However, the effect of the positive CSR condition (M = 5.03, SD = 1.12) on attitudes was non-significant (p = 0.385, 95% CI = [−0.78, 0.22], d = 0.25).
Consumer acceptance. A one-way ANOVA showed a significant effect of the experimental manipulation on consumer acceptance (F(2, 168) = 9.52, p < 0.001, ηp2 = 0.10). Similar to the effect on attitudes, a post-hoc test (Tukey’s HSD) showed, when compared to the control condition (M = 5.01, SD = 1.68), no significant effect of the positive CSR condition (M = 5.11, SD = 1.63) on consumer acceptance (p = 0.949, 95% CI = [−0.85, 0.65], d = 0.06), but a significant effect (p = 0.001, 95% CI = [0.38, 1.88], d = 0.66) of the negative CSR condition (M = 3.88, SD = 1.73). The averages by condition of attitudes and consumer acceptance are summarized in Figure 3.
Together, results on attitudes and consumer acceptance partially supported H1, given that we only observed the expected effects in the negative CSR condition.

2.2.2. Mediation Model

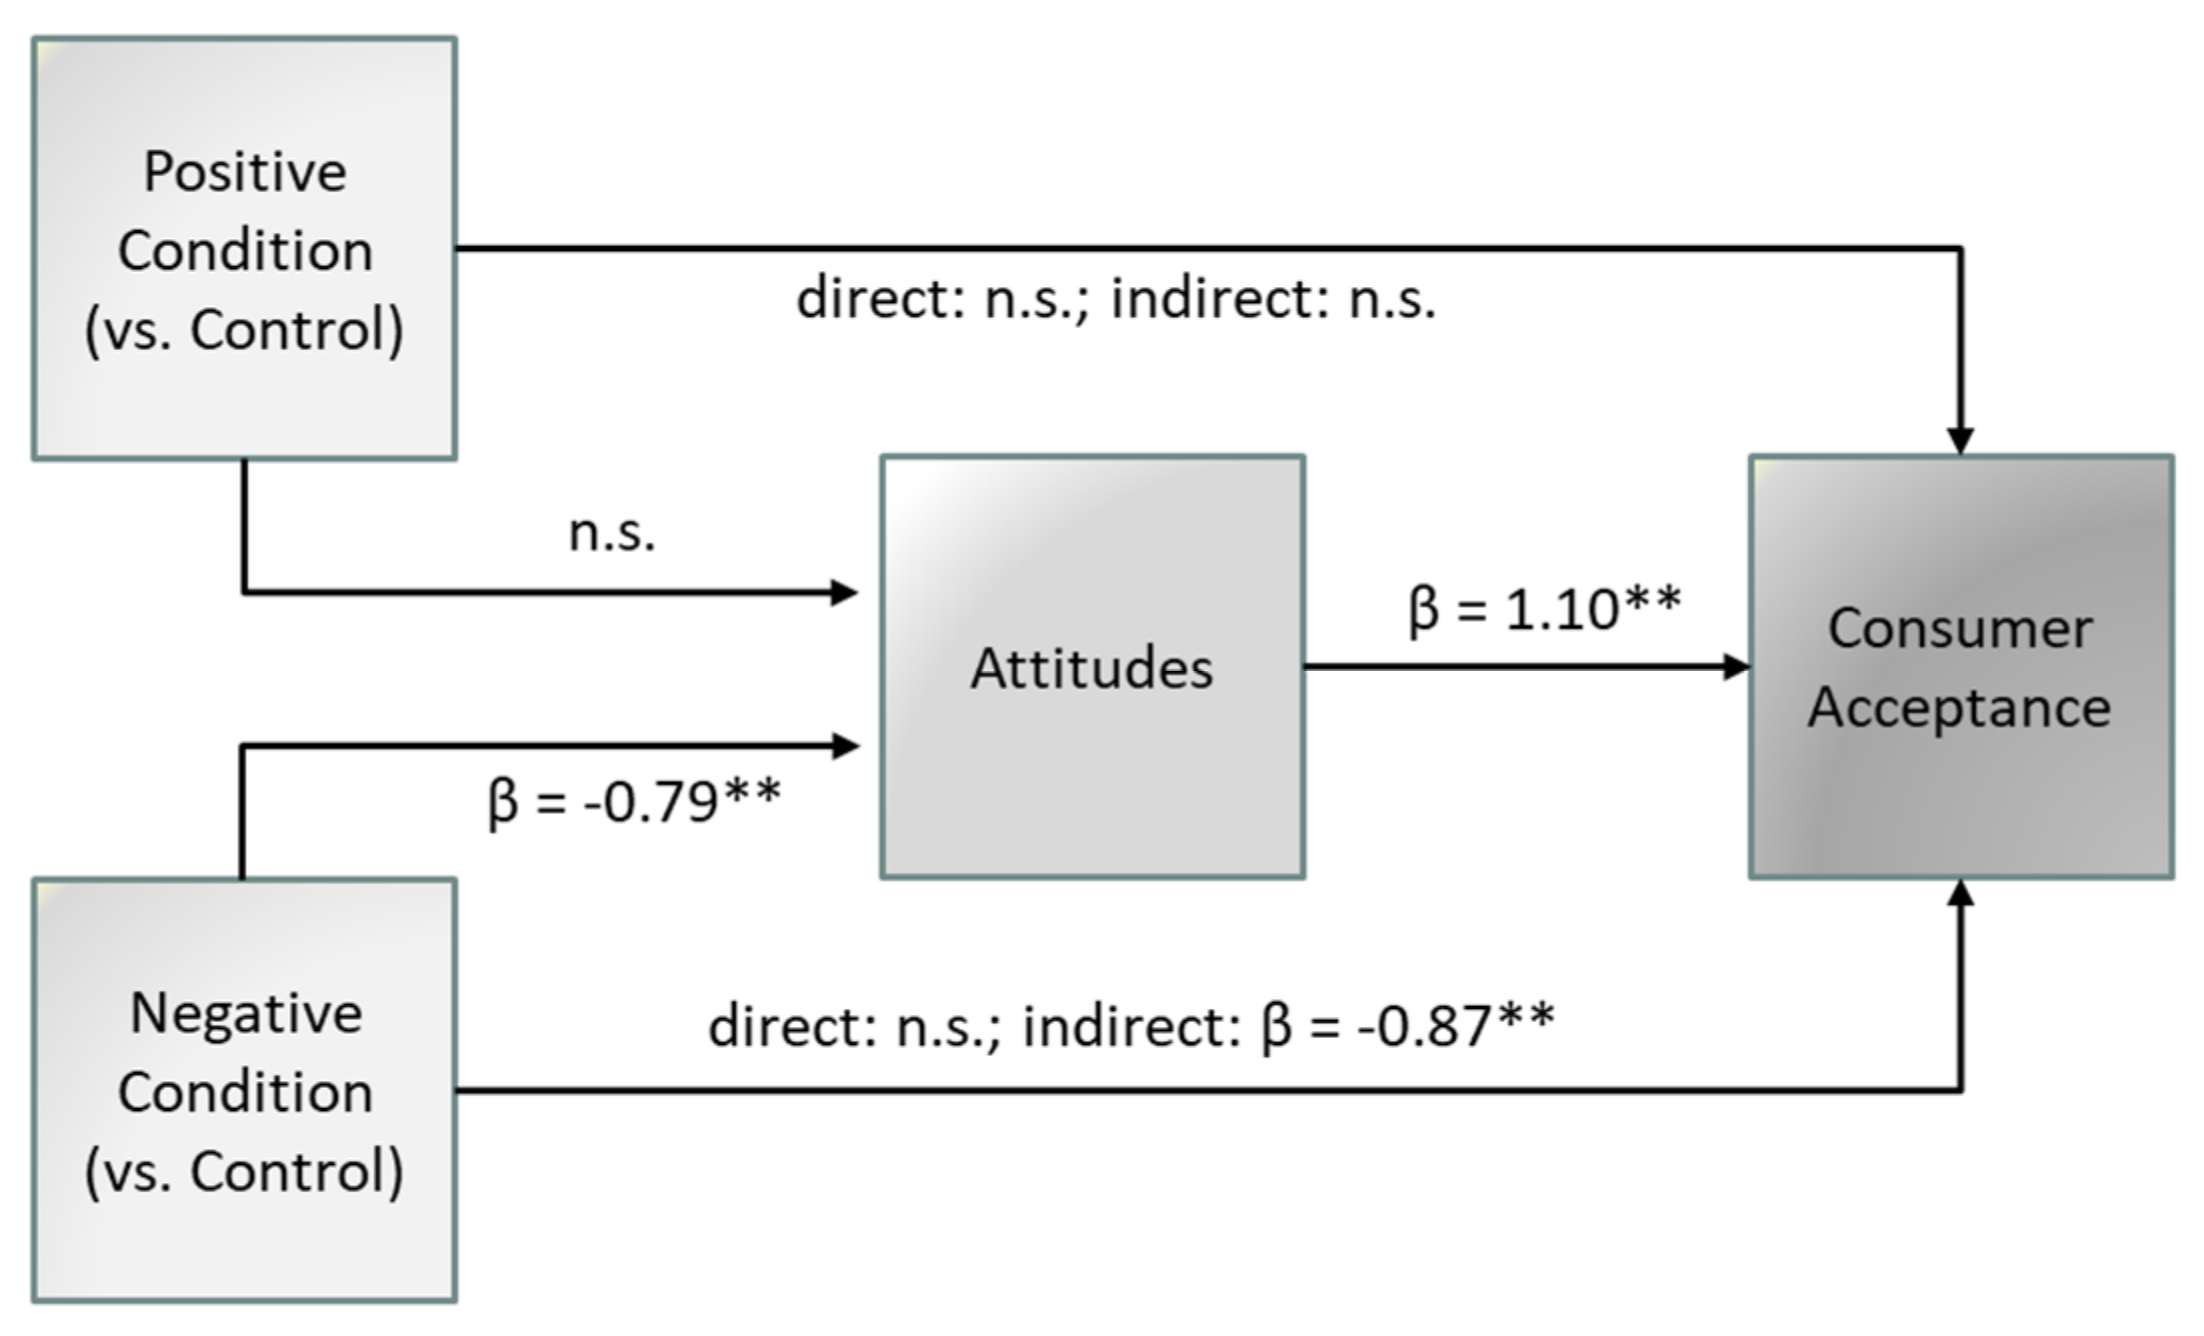
We conducted a mediation analysis using the PROCESS Model 4 macro for SPSS [75] to test the mediation of consumer acceptance by attitudes (H2) (see Figure 1 for a schematic depiction). We coded the conditions as follows: 0 = control, 1 = positive CSR, 2 = negative CSR, and we entered attitudes as potential mediator and consumer acceptance as dependent variable. We used a bias-corrected bootstrap analysis with 5000 samples. Note that for the effect of attitudes on the dependent variable, B, only one value exists. This value reflects the effect of the mediation when controlling for the effect of the conditions [75]. Overall, the mediation model explained about 59% of the variance in consumer acceptance (R2 = 0.587).
Positive CSR condition versus control. We observed both a non-significant indirect effect of the positive CSR condition (vs. control) on consumer acceptance through attitudes (A * B; β = 0.31, SE = 0.23, 95% CI = [−0.14, 0.75]), and a non-significant direct effect of this condition on consumer acceptance (C; β = −0.21, SE = 0.22, p = 0.332, 95% CI = [−0.64, 0.22]). Following this pattern, the total effect was non-significant (A * B + C; β = 0.10, SE = 0.32, p = 0.759, 95% CI = [−0.53, 0.72]).
Negative CSR condition versus control. Results indicated that the indirect effect of the negative CSR condition (vs. control) on consumer acceptance through attitudes was significant (A * B; β = −0.87, SE = 0.23, 95% CI = [−1.31, −0.42]), and that the direct effect of this condition on consumer acceptance was non-significant (C; β = −0.26, SE = 0.22, p = 0.242, 95% CI = [−0.71, 0.18]). Further, the total effect was significant (A * B + C; β = −1.13, SE = 0.32, p < 0.001, 95% CI = [−1.76, −0.51]), indicating a full mediation. The percentage of total effect mediated was 77% (PM = 0.77). The significant pathways of the model are summarized in Figure 4.
These findings suggest that attitudes fully mediated the effect of the negative CSR prime on consumer acceptance, supporting the presence of a negative halo effect. However, this pattern was not observed in the positive CSR condition. These results partially supported H2.

2.2.3. Moderated Mediation Model

We conducted a moderated mediation analysis (bias-corrected bootstrap analysis with 5000 samples) using the PROCESS Model 8 macro for SPSS [75] (see Figure 2 for a schematic depiction). The conditional effect of the moderator (W) was evaluated at +1 SD (high) and −1 SD (low) levels, following the logic of a spotlight analysis. We coded the conditions as follows: 0 = control, 1 = positive CSR, 2 = negative CSR, and we entered attitudes as potential mediator, consumer acceptance as dependent variable and CSR values as moderator. Note that PROCESS model 8 does not entail a total effect model and accordingly no total effect is reported. Overall, the moderated mediation model explained about 60% of the variance in consumer acceptance (R2 = 0.595).
Positive CSR condition versus control. Results indicated that the conditional indirect effect was non-significant at both high (A * B; W at +1 SD: β = 0.57, SE = 0.37, 95% CI = [−0.16, 1.29]) and low levels of CSR values (A * B; W at −1 SD: β = 0.03, SE = 0.33, 95% CI = [−0.64, 0.69]). Likewise, the conditional direct effect was non-significant at both high (C; W at +1 SD: β = −0.16, SE = 0.32, p = 0.618, 95% CI = [−0.80, 0.48]) and low levels of the moderator (C; W at −1 SD: β = −0.26, SE = 0.37, p = 0.481, 95% CI = [−1.00, 0.47]). Hence, there was no significant moderated mediation observed for the positive CSR condition.
Negative CSR condition versus control. Results indicated that, under high CSR values, the conditional indirect effect on consumer acceptance through attitudes was significant (A * B; W at +1 SD: β = −1.33, SE = 0.35, 95% CI = [−1.99, −0.65]). To the contrary, under low CSR values, this effect was not significant (A * B; W at −1 SD: β = −0.33, SE = 0.24, 95% CI = [−0.79, 0.13]). The conditional direct effect on consumer acceptance was marginally significant under high CSR values (C; W at +1 SD: β = −0.54, SE = 0.32, p = 0.097, 95% CI = [−1.18, 0.10], 90% CI = [−1.07, −0.01]), but non-significant under low CSR values (C; W at −1 SD: β = −0.12, SE = 0.32, p = 0.708, 95% CI = [−0.76, 0.51]). Hence, results showed a partial mediation that was (marginally) significant under high CSR values.
Overall, moderated mediation analyses showed partial support for H3. Results indicated a significant (but partial) mediation by attitudes of the effect of the negative CSR prime on consumer acceptance under high CSR values, i.e., at +1 SD level of the moderator, but not under low (−1 SD) CSR values. No significant interaction effect with CSR values was observed when participants were presented with a positive CSR prime.

2.3. Discussion of Study 1

Results from Study 1 showed partial support for our hypotheses. Indeed, as expected from H1 and H2, a negative CSR prime (vs. control) led to lower attitudes towards CM (halo-based inferences), which in turn led to lower consumer acceptance of CM. In relation to H3, this effect was increased among participants who hold high CSR values, suggesting that the more the consumers are sensitive to CSR issues, the more their attitudes towards CM and their acceptance of CM are likely to be negatively influenced by negative CSR activities, i.e., socially irresponsible behavior. The opposite effect was not observed among participants holding low CSR values, which indicates that our results partially support H3.
Main effects, mediation analyses, as well as most of the moderated mediation analyses, remained significant when controlling for various covariates related to diet, age, gender, education, political orientation and income (see Supplementary Materials S5), and are therefore robust [90].
Unexpectedly, our results did not support our hypotheses (H1–H3) when the participants were presented with a positive CSR prime (vs. control). These results and their implications are further discussed in the general discussion. The next section presents the results of Study 2 in which we tested the halo effect of food safety information on the perception of CM.

3. Study 2

3.1. Materials and Methods

3.1.1. Participants

Study 2 was a three-group between-subjects design (positive food safety priming, negative food safety priming and control) which tested whether a CM company’s positive or negative food safety behavior leads to halo-based inferences which in turn influence consumer acceptance of CM. The number of participants recruited was based on an a priori power analysis using G*Power. We assumed a medium effect size (f =0.30), an alpha of 0.05 and a power of 0.99, for which G*Power suggests a total sample size of 243. Adding 15% for invalid responses, our final total sample size should be at least 279. To be on the safe side, we decided to collect 300 participants through mTurk, yielding 314 US participants in total, who completed the survey in exchange for $0.80. Unique Turker (https://uniqueturker.myleott.com/, accessed on 28 May 2019) ensured that all participants were different from Study 1. The same quality controls as for Study 1 were applied. Were excluded participants who did not finish the survey (N = 3), who did not give consent (N = 1), who used a mobile device (N = 7), who failed the attention check question (N = 9), who self-excluded their data (N = 8), or who commented that they did not believe the manipulation (N = 1). In comparison to Study 1, income was surveyed through a fixed scale and outliers were not excluded on this variable. No participant missed demographic questions. The final sample included 285 participants (Female = 109, Male = 174, Other = 2; M age = 36.60; see Supplementary Materials S1.2 for full demographics of this experiment).

3.1.2. Materials and Measures

The procedure was identical to Study 1 with different stimuli, the experimental conditions including a food safety prime instead of a CSR prime in the section “Public Reception of Tomorrow Foods” (which was absent in the control condition). The texts contained 18 positive or negative modifiers and phrases (see Supplementary Materials S2.2 for complete materials used in this experiment).
For instance, participants read in the positive food safety priming condition: “Tomorrow Foods does everything in its power to reassure consumers’, evaluates Emma Rodriguez, an analyst with the Kaiser Family Foundation, a non-profit organization. One area that invites praise is a series of safety studies conducted by Tomorrow Foods. ‘These studies vastly surpass legal requirements and are conducted by independent researchers’, Mrs. Rodriguez claims (…) Tomorrow Foods also openly pushes for cultured meat to be clearly labelled as such—to not be confused with conventional meat. For some observers, this adds to the credible behavior of Tomorrow Foods”.
In comparison, participants read in the negative food safety priming condition: “Tomorrow Foods is not doing everything in its power to reassure consumers’, evaluates Emma Rodriguez, an analyst with the Kaiser Family Foundation, a non-profit organization. One area that invites criticism is a series of safety studies conducted by Tomorrow Foods. ‘These studies do not surpass bare legal minimum requirements and are not conducted by independent researchers’, Mrs. Rodriguez claims (…) Tomorrow Foods also openly pushes for cultured meat to be labelled as ‘meat’—despite the danger of confusion with conventional meat. For some observers, this adds to the questionable behavior of Tomorrow Foods”.
Measures were adapted from Study 1. Participants were asked for their general impression towards Tomorrow Foods as manipulation check question. Attitudes towards CM were assessed on a 3-item scale (perceived healthiness, nutritiousness and environmental-friendliness; α = 0.72). Note that, since one attitude item used in Study 1 was directly related to safety, it was not included in Study 2. We also employed the 3-item scale measuring consumer acceptance of CM (willingness to try, consumption recommendation and general impression about the product; α = 0.88) along with a 3-item scale measuring food safety values in relation to these stimuli (α = 0.76). In addition, participants answered the 10-item food neophobia scale adapted after [91] (α = 0.89). The items within each of the scales were randomized to avoid order effects. Lastly, participants answered demographic questions on dietary practices, age, gender, education, political orientation and income (see Supplementary Materials S3.2 for all measures used in this experiment).

3.2. Results

3.2.1. Main Effects

Manipulation check. A one-way ANOVA revealed a significant effect of the experimental manipulations on general impression about the company (F(2, 284) = 51.74, p < 0.001, ηp2 = 0.27). A post-hoc test (Tukey’s HSD) indicated that, when compared to control (M = 4.95, SD = 1.33), the positive food safety condition (M = 5.46, SD = 1.45) led to a more positive general impression (p = 0.056, 95% CI = [−1.05, 0.01], 90% CI = [−0.98, −0.06], d = 0.37), and the negative food safety condition (M = 3.32, SD = 1.77) led to a more negative general impression (p < 0.001, 95% CI = [1.11, 2.15], d = 1.04). Results thus indicated that our manipulation was successful in the negative food safety condition, but only reached marginal significance in the positive food safety condition.
Attitudes. A one-way ANOVA showed a significant effect of the experimental manipulation on attitudes towards CM (F(2, 284) = 5.79, p = 0.003, ηp2 = 0.04). However, contrary to our expectations, a post-hoc test (Tukey’s HSD) revealed no significant effect of the negative food safety condition (M = 4.42, SD = 1.12) when compared to the control condition (M = 4.68, SD = 1.02; p = 0.208, 95% CI = [−0.10, 0.62], d = 0.24). Likewise, the effect of the positive food safety condition (M = 4.93, SD = 1.02) on attitudes towards CM was non-significant (p = 0.221, 95% CI = [−0.62, 0.11], d = 0.25).
Consumer acceptance. A one-way ANOVA showed a significant effect of the experimental manipulation on consumer acceptance (F(2, 284) = 10.26, p < 0.001, ηp2 = 0.07). As expected, when compared to the control condition (M = 4.62, SD = 1.58), a post-hoc test (Tukey’s HSD) revealed a significant effect of the negative food safety condition on consumer acceptance (M = 3.84, SD = 1.70; p = 0.004, 95% CI = [0.22, 1.34], d = 0.48). However, there was no significant effect of the positive food safety condition (M = 4.87, SD = 1.65; p = 0.561, 95% CI = [−0.81, 0.32], d = 0.16). The averages by condition of attitudes and consumer acceptance are summarized in Figure 3.
Overall, we found inconsistent and partial support for H1, given that we only observed a significant effect of negative food safety on consumer acceptance and no significant effect, whether positive or negative, on attitudes towards CM. We nonetheless tested our subsequent hypotheses since mediation and moderation effects can be observed even when no main effect is observed [75].

3.2.2. Mediation Model

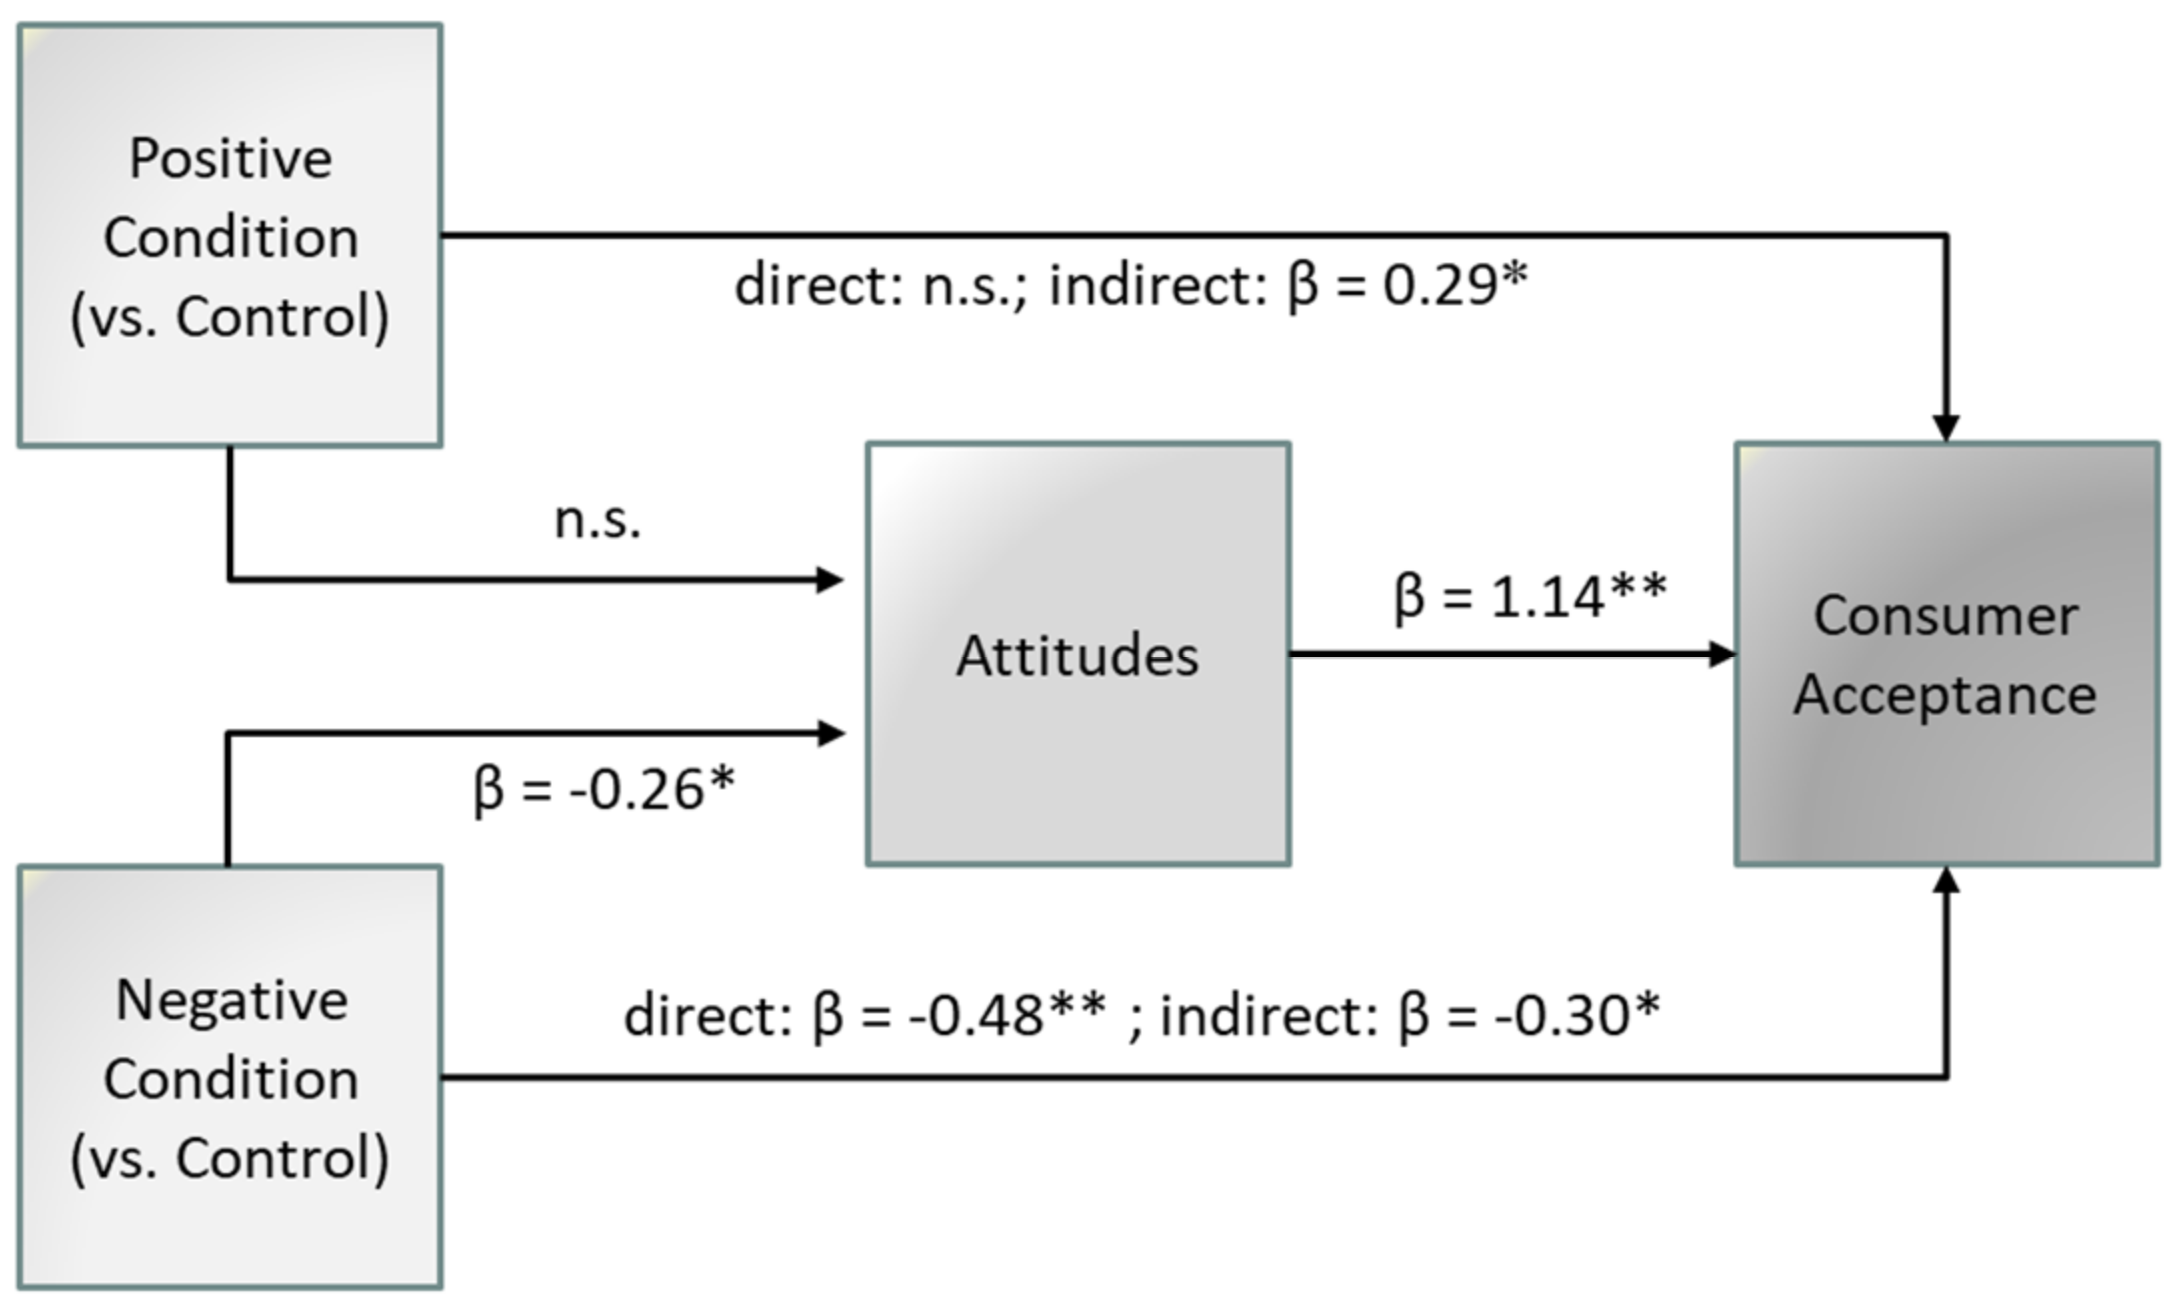
We conducted a mediation analysis using the PROCESS Model 4 macro for SPSS [75] to test the mediation of consumer acceptance by attitudes (H2) (see Figure 1 for a schematic depiction). We coded the conditions as follows: 0 = control, 1 = positive food safety, 2 = negative food safety, and entered attitudes as potential mediator and consumer acceptance as dependent variable. We used a bias-corrected bootstrap analysis with 5000 samples. Overall, the mediation model explained about 56% of the variance in consumer acceptance (R2 = 0.561).
Positive food safety condition versus control. The indirect effect of the positive food safety condition (vs. control) on consumer acceptance through attitudes was marginally significant (A * B; β = 0.29, SE = 0.17, 95% CI = [−0.04, 0.63], 90% CI = [0.01, 0.57]). However, results revealed that the direct effect of the positive food safety condition on consumer acceptance (C; β = −0.04, SE = 0.17, p = 0.790, 95% CI = [−0.37, 0.28]) and the total effect were non-significant (A * B + C; β = 0.25, SE = 0.24, p = 0.306, 95% CI = [−0.23, 0.72]). Hence, an inconsistent mediation [92] was observed for the positive food safety condition.
Negative food safety condition versus control. The indirect effect of the negative food safety condition (vs. control) on consumer acceptance through attitudes was marginally significant (A * B; β = −0.30, SE = 0.18, 95% CI = [−0.64, 0.05], 90% CI = [−0.58, −0.01]). The direct effect of the negative food safety condition on consumer acceptance (C; β = −0.48, SE = 0.16, p = 0.004, 95% CI = [−0.81, −0.16]) and the total effect were significant (A * B + C; β = −0.78, SE = 0.24, p = 0.001, 95% CI = [−1.25, −0.31]). These results indicate a partial mediation. The percentage of total effect mediated was 39% (PM = 0.39). The significant pathways of the model are summarized in Figure 5.
Overall, these results partially support H2, showing that attitudes marginally significantly and partially mediated the effect of negative food safety on consumer acceptance. In other words, in comparison to Study 1, no full mediation and only marginal significance were found. These results suggest that a mediation through attitudes was existent and aligned with the previous study, albeit this effect was less pronounced than for the negative food safety condition in Study 2.

3.2.3. Moderated Mediation Model

We conducted a moderated mediation analysis (bias-corrected bootstrap analysis with 5000 samples) using the PROCESS Model 8 macro for SPSS [75] (see Figure 2 for a schematic depiction). The conditional effect of the moderator (W) was evaluated at +1 SD (high) and −1 SD (low) levels. We coded the conditions as follows: 0 = control, 1 = positive food safety, 2 = negative food safety, and entered attitudes as potential mediator, consumer acceptance as dependent variable and food safety values as moderator. Overall, the moderated mediation model explained about 58% of the variance in consumer acceptance (R2 = 0.576).
Positive food safety condition versus control. Results indicated that the conditional effect was non-significant at high (A * B; W at +1 SD: β = 0.34, SE = 0.25, 95% CI = [−0.11, 0.89]) and low levels of food safety values (A * B; W at −1 SD: β = 0.13, SE = 0.26, 95% CI = [−0.39, 0.65]). Likewise, the conditional direct effect was non-significant at both levels of the moderator (C; W at +1 SD: β = −0.10, SE = 0.24, p = 0.670, 95% CI = [−0.57, 0.37]; W at −1 SD: β = 0.00, SE = 0.24, p = 0.991, 95% CI = [−0.47, 0.47]). Hence, there was no significant moderated mediation observed for the positive food safety condition.
Negative food safety condition versus control. Results indicated that, under high food safety values, the conditional indirect effect on consumer acceptance through attitudes was marginally significant (A * B; W at +1 SD: β = −0.50, SE = 0.26, 95% CI = [−1.01, 0.01], 90% CI = [−0.94, −0.07]) and to the contrary, under low food safety values, this effect was not significant (A * B; W at −1 SD: β = −0.01, SE = 0.24, 95% CI = [−0.55, 0.39]). The conditional direct effect was significant under high (C; W at +1 SD: β = −0.91, SE = 0.23, p < 0.001, 95% CI = [−1.37, −0.46]), but not under low food safety values (C; W at −1 SD: β = −0.08, SE = 0.22, p = 0.723, 95% CI = [−0.52, 0.36]).
Overall, these results indicated a (marginally) significant (but partial) mediation by attitudes towards CM of the effect of the negative food safety prime on consumer acceptance under high food safety values, i.e., at +1 SD level of the moderator, but not under low (−1 SD) food safety values. No significant interaction effect with food safety values was observed when participants were presented with a positive food safety prime. These results partially support H3 and their pattern is consistent with those of Study 1.

3.3. Discussion of Study 2

Although marginally significant, results from Study 2 followed the same pattern as Study 1, providing some support for H1−3 when participants were presented with a negative food safety prime but not when they were presented with a positive one. More specifically, whereas H1 was partially supported, results indicated, as expected from H2, that a negative food safety prime (vs. control) led to lower attitudes towards CM (halo-based inferences), which in turn led to lower consumer acceptance of CM. In relation to H3, this effect was increased among participants who hold high (but not low) safety values, suggesting that the more the consumers are sensitive to safety issues, the more their attitudes towards CM and their acceptance of CM are likely to be negatively influenced by negative food safety activities. Main effects, mediation analyses, as well as most of the moderated mediation analyses, remained significant when controlling for various covariates related to diet, age, gender, education, political orientation and income (see Supplementary Materials S5), and are therefore robust [90].

4. General Discussion

The goal of this article was to test the influence of halo effects on the consumer acceptance of CM. Across two pre-registered experimental studies, the present research empirically examined whether positive or negative CSR or food safety claims about a given CM company can lead consumers to rate its CM product higher or lower on attributes that are unrelated to these claims (halo-based inferences).
Our results partially supported our hypotheses as they indicated that negative, but not positive, information about a CM producer impacts attitudes towards and, in turn, consumer acceptance of a given CM product. More specifically, although these effects were more strongly pronounced in Study 1 than in Study 2, in both studies, mediation analyses consistently found that negative information in terms of CSR or food safety leads to lower attitudes towards CM on attributes that are unrelated to these claims, which decreases consumer acceptance of CM, supporting the presence of a negative halo effect.
These results are aligned with previous literature on the impact of halo effects on meat perception [49,61,62,63] (see contra, [64]). These results are also consistent with models of consumer acceptance [70,71], and prior research on the consumer acceptance of CM, which indicated that consumer acceptance changes in the direction of information [28,36]. Interestingly, whereas previous research had argued that a CSR halo effect might not be observed for a socially responsible technology [60], our findings illustrate the contrary in the case of CM.
Additionally, in accordance with our hypotheses our results suggest that these mediated paths are moderated by value congruency. Indeed, in both studies, it appeared that the more consumers shared halo-congruent values (holding high CSR or food safety values), the stronger was the negative halo effect. Again, this finding falls in line with prior research on halo effects on food products [46,48,58,59,73], albeit only for negative halos in the present research.
In summary, our findings indicate a negative halo effect acting on the perception and acceptance of CM. It is worthwhile to note, however, that our results were only marginally significant in Study 2, and that negative halo effects were not fully mediated by attitudes in both moderation analyses, which suggests that there may be other dimensions subject to halo-based inferences which contributed to reducing the acceptance of CM. More importantly, no significant effect was observed for the positive halo effect across both studies.
The main take-away from these findings is therefore that participants’ judgements of CM are disproportionately influenced by negative information about the CM company, leading to an asymmetrical halo effect. Our results are aligned with the so-called negativity bias, a well-known phenomenon in psychology, which holds that, for equal intensity and exposure, people are more greatly affected by and attracted to negative information [93,94,95]. Literature suggests that negative information carries, on average, about twice as much weight as positive information [96,97]. In addition, for food products, it was shown that people have more trust in negative information than in positive information [98,99]. In other words, what draws more attention is not only a negative content itself, but also how much people trust the information or the validity of the source of that information. The present research therefore lends further support for the negativity bias and shows that it extends to and operates for the perception and acceptance of CM.
Overall, our findings indicate that doing bad can be detrimental to a CM company by negatively impacting consumers’ evaluations of its products, but do not show that “doing good”, via socially responsible activities or safety implementations, can translate into “doing well” [60]. In this perspective, our findings support growing concerns that the behavior of a CM company could “stigmatize” CM products [23] potentially leading to a similar public (and long-lasting) resistance against CM as against genetically modified foods in Europe [21,24]. Our findings emphasize the importance of sharing high standards in terms of CSR and food safety across the CM industry [100]. Such a strategy would contribute to preventing a negative halo effect from happening and to maintaining the rather positive views that are shared across many countries [2,26,30,35,101].
These results come with three main limitations that could serve as a basis for future research. Firstly, we did not observe positive halo effects of CSR or food safety in these studies. This may be explained by additional analyses indicating, on average, positive perceptions and acceptance of CM, which may have attenuated the difference between the positive and the control conditions and led to non-significant results. Indeed, as reported in Supplementary Materials S6, one-sample t-tests show that the neutral condition led to positive attitudes and consumer acceptance significantly above the mid-point (=4) of the scales. A similar observation has already been reported in the literature on halo effects in food consumption [59]. Against this background, future research may test, for instance, whether a more subtle approach of CSR, which differentiates between some of its economic, legal, ethical, and philanthropic dimensions [102], would lead to different results.
Secondly, given that CM products are not available on the market yet, our studies focused on attitudes and behavioral intentions. Future research may explore whether halo effects alter consumers’ judgments when they directly experience a CM product. Although some previous findings suggest that halo effects tend to be more pronounced when direct experience is not readily available, e.g. [103], recent evidence also indicates halo effects when consumers directly experience a given product, e.g. [60,64]. The latter would suggest that similar halo effects may operate in the context of real CM consumption and thus may contribute to replicating our findings. Recent research shows that CM’s consumer acceptance might be even higher in real settings than surveyed online [35], which could lead to stronger or weaker halo effects. Likewise, it could be tested whether the moderating effect of CM expertise holds, or even shows an opposite pattern, after the introduction of CM on the market, as consumers will have accumulated more product-related experiences [60]. Similarly, it may also be worth investigating whether the influence of food neophobia on safety halo effects would hold after introducing CM on the market, as it will become more commonly eaten and thus appear less innovative (and less threatening). Although we measured food neophobia with the classic food neophobia scale [91], following prior research on CM [26,29,31,32], future research may prefer the food technology neophobia scale, which characterizes the aversion to food processed in new ways [104,105].
Lastly, it is important to note that the present results require cross-cultural validation. Whereas halo effects in the context of meat consumption have been observed in various countries [61,62,63,64], the present research was conducted with participants living in the United States where consumer acceptance of CM is higher than in some other countries [106]. This suggests that the observed negative halo effects might be even more pronounced in other cultures.

5. Conclusions

To our knowledge, this is the first article investigating the influence of halo effects of corporate behavior on the perception and acceptance of CM by testing the influence of two primes, CSR and food safety. Findings suggest asymmetrical halo effects indicating that a positive halo yields a negligible positive effect on the consumer acceptance of CM, whereas a negative halo yields a significant negative effect on the consumer acceptance of CM. Further, this research shows that a change in attitudes towards CM actually contributes to this negative effect and is increased by halo-congruent values, so that the more sensitive consumers are to CSR and food safety related issues, the larger is this change in attitudes, which in turn leads to a halo effect of negative corporate behavior on the consumer acceptance of CM. In a nutshell, the practical implications of this research could be summarized as a motto to CM companies: don’t do evil.

Supplementary Materials

The following Supplementary Materials are available online at https://www.mdpi.com/article/10.3390/su13126770/s1. Content: S1: Full Demographics. S2: Complete Materials. S3: All Measures. S4: Additional Moderation Analyses. S5: Additional Covariate Analyses. S6: Scale Midpoint Analyses. S7: Full Pre-registrations.

Author Contributions

Both authors contributed equally to this project. Both authors have read and agreed to the published version of the manuscript.

Funding

This research has been funded by the London School of Economics and Political Science (LSE).

Institutional Review Board Statement

The study was conducted according to the guidelines of the Declaration of Helsinki, and approved by the Ethics Committee of the Department of the Psychological and Behavioural Science (PBS) of the London School of Economics and Political Science (LSE) (date of approval: 29 March 2019).

Informed Consent Statement

Informed consent was obtained from all subjects involved in the study.

Data Availability Statement

The datasets analysed in these studies are openly available via the Open Science Framework (OSF) at https://osf.io/wtczm/.

Acknowledgments

The authors thank Patrick Toomey and Aylin Erman for their helpful comments.

Conflicts of Interest

None. The authors declare that no competing interests exist.

References

  1. Post, M.J. Cultured meat from stem cells: Challenges and prospects. Meat Sci. 2012, 92, 297–301. [Google Scholar] [CrossRef]
  2. Post, M.J.; Levenberg, S.; Kaplan, D.L.; Genovese, N.; Fu, J.; Bryant, C.; Negowetti, N.; Verzijden, K.; Moutsatsou, P. Scientific, sustainability and regulatory challenges of cultured meat. Nat. Food 2020, 1, 403–415. [Google Scholar] [CrossRef]
  3. Siegrist, M.; Hartmann, C. Consumer acceptance of novel food technologies. Nat. Food 2020, 1, 343–350. [Google Scholar] [CrossRef]
  4. Arshad, M.S.; Javed, M.; Sohaib, M.; Saeed, F.; Imran, A.; Amjad, Z. Tissue engineering approaches to develop cultured meat from cells: A mini review. Cogent Food Agric. 2017, 3. [Google Scholar] [CrossRef]
  5. Gaydhane, M.K.; Mahanta, U.; Sharma, C.S.; Khandelwal, M.; Ramakrishna, S. Cultured meat: State of the art and future. Biomanuf. Rev. 2018, 3, 1. [Google Scholar] [CrossRef]
  6. Post, M.; Hocquette, J.-F. New Sources of Animal Proteins: Cultured Meat. New Asp. Meat Qual. 2017, 16, 425–441. [Google Scholar] [CrossRef] [Green Version]
  7. Hocquette, J.-F. Is in vitro meat the solution for the future? Meat Sci. 2016, 120, 167–176. [Google Scholar] [CrossRef] [PubMed]
  8. Hopkins, P.D.; Dacey, A. Vegetarian Meat: Could Technology Save Animals and Satisfy Meat Eaters? J. Agric. Environ. Ethic 2008, 21, 579–596. [Google Scholar] [CrossRef]
  9. Lynch, J.; Pierrehumbert, R. Climate Impacts of Cultured Meat and Beef Cattle. Front. Sustain. Food Syst. 2019, 3. [Google Scholar] [CrossRef] [PubMed] [Green Version]
  10. Mattick, C.S.; Landis, A.E.; Allenby, B.R.; Genovese, N.J. Anticipatory Life Cycle Analysis of In Vitro Biomass Cultivation for Cultured Meat Production in the United States. Environ. Sci. Technol. 2015, 49, 11941–11949. [Google Scholar] [CrossRef]
  11. Tuomisto, H.L.; Ellis, M.J.; Haastrup, P. Environmental Impacts of Cultured Meat: Alternative Production Scenarios. In Proceedings of the 9th International Conference on Life Cycle Assessment in the Agri-Food Sector (LCA Food 2014), San Francisco, CA, USA, 8–10 October 2014. [Google Scholar]
  12. Boons, F.; Lüdeke-Freund, F. Business models for sustainable innovation: State-of-the-art and steps towards a research agenda. J. Clean. Prod. 2013, 45, 9–19. [Google Scholar] [CrossRef]
  13. Van der Weele, C.; Feindt, P.; van der Goot, A.J.; van Mierlo, B.; van Boekel, M. Meat alternatives: An integrative comparison. Trends Food Sci. Technol. 2019, 88, 505–512. [Google Scholar] [CrossRef]
  14. Oxford Martin School. WEF Alternative Proteins; Meat: The Future Series; WEF: Geneva, Switzerland, 2019; p. 32. [Google Scholar]
  15. Herrero, M.; Thornton, P.K.; Mason-D’Croz, D.; Palmer, J.; Benton, T.G.; Bodirsky, B.L.; Bogard, J.R.; Hall, A.; Lee, B.; Nyborg, K.; et al. Innovation can accelerate the transition towards a sustainable food system. Nat. Food 2020, 1, 266–272. [Google Scholar] [CrossRef]
  16. Allen, T.F.H.; Tainter, J.A.; Hoekstra, T.W. Supply-Side Sustainability. In Complexity in Ecological Systems; Columbia University Press: New York, NY, USA, 2003; Volume 16, pp. 403–427. [Google Scholar] [CrossRef]
  17. Creutzig, F.; Roy, J.; Lamb, W.F.; Azevedo, I.M.; De Bruin, W.B.; Dalkmann, H.; Edelenbosch, O.Y.; Geels, F.W.; Grubler, A.; Hepburn, C.; et al. Towards demand-side solutions for mitigating climate change. Nat. Clim. Chang. 2018, 8, 260–263. [Google Scholar] [CrossRef] [Green Version]
  18. Stephens, N.; Di Silvio, L.; Dunsford, I.; Ellis, M.; Glencross, A.; Sexton, A. Bringing cultured meat to market: Technical, socio-political, and regulatory challenges in cellular agriculture. Trends Food Sci. Technol. 2018, 78, 155–166. [Google Scholar] [CrossRef]
  19. Bryant, C.; Barnett, J. Consumer acceptance of cultured meat: A systematic review. Meat Sci. 2018, 143, 8–17. [Google Scholar] [CrossRef]
  20. Bryant, C.; Barnett, J. Consumer Acceptance of Cultured Meat: An Updated Review (2018–2020). Appl. Sci. 2020, 10, 5201. [Google Scholar] [CrossRef]
  21. Fernandes, A.M.; Teixeira, O.D.S.; Revillion, J.P.; de Souza Ângela, R.L. Panorama and ambiguities of cultured meat: An integrative approach. Crit. Rev. Food Sci. Nutr. 2021, 1–11. [Google Scholar] [CrossRef]
  22. Onwezen, M.; Bouwman, E.; Reinders, M.; Dagevos, H. A systematic review on consumer acceptance of alternative proteins: Pulses, algae, insects, plant-based meat alternatives, and cultured meat. Appetite 2021, 159, 105058. [Google Scholar] [CrossRef]
  23. Watson, E. The “World Is Watching” the Cell-Based Meat Industry. FoodNavigator-USA. 2019. Available online: https://www.foodnavigator-usa.com/Article/2019/02/11/The-world-is-watching-the-cell-based-meat-industry-says-Memphis-Meats-VP-Subpar-early-products-can-stigmatize-an-entire-category-for-decades-to-come (accessed on 27 June 2019).
  24. Mohorčich, J.; Reese, J. Cell-cultured meat: Lessons from GMO adoption and resistance. Appetite 2019, 143, 104408. [Google Scholar] [CrossRef]
  25. Rogers, E.M. Diffusion of Innovations, 5th ed.; Free Press: New York, NY, USA, 2003; ISBN 0743222091. [Google Scholar]
  26. Bryant, C.; Szejda, K.; Parekh, N.; Deshpande, V.; Tse, B. A Survey of Consumer Perceptions of Plant-Based and Clean Meat in the USA, India, and China. Front. Sustain. Food Syst. 2019, 3. [Google Scholar] [CrossRef]
  27. Slade, P. If you build it, will they eat it? Consumer preferences for plant-based and cultured meat burgers. Appetite 2018, 125, 428–437. [Google Scholar] [CrossRef] [PubMed]
  28. Verbeke, W.; Sans, P.; Van Loo, E.J. Challenges and prospects for consumer acceptance of cultured meat. J. Integr. Agric. 2015, 14, 285–294. [Google Scholar] [CrossRef]
  29. Wilks, M.; Phillips, C.J.; Fielding, K.; Hornsey, M.J. Testing potential psychological predictors of attitudes towards cultured meat. Appetite 2019, 136, 137–145. [Google Scholar] [CrossRef] [PubMed]
  30. Wilks, M.; Phillips, C.J.C. Attitudes to in vitro meat: A survey of potential consumers in the United States. PLoS ONE 2017, 12, e0171904. [Google Scholar] [CrossRef] [PubMed] [Green Version]
  31. Hwang, J.; You, J.; Moon, J.; Jeong, J. Factors Affecting Consumers’ Alternative Meats Buying Intentions: Plant-Based Meat Alternative and Cultured Meat. Sustainability 2020, 12, 5662. [Google Scholar] [CrossRef]
  32. Faccio, E.; Guiotto Nai Fovino, L. Food Neophobia or Distrust of Novelties? Exploring Consumers’ Attitudes toward GMOs, Insects and Cultured Meat. Appl. Sci. 2019, 9, 4440. [Google Scholar] [CrossRef] [Green Version]
  33. Siegrist, M.; Sütterlin, B. Importance of perceived naturalness for acceptance of food additives and cultured meat. Appetite 2017, 113, 320–326. [Google Scholar] [CrossRef]
  34. Siegrist, M.; Sütterlin, B.; Hartmann, C. Perceived naturalness and evoked disgust influence acceptance of cultured meat. Meat Sci. 2018, 139, 213–219. [Google Scholar] [CrossRef]
  35. Rolland, N.C.M.; Markus, C.R.; Post, M.J. The effect of information content on acceptance of cultured meat in a tasting context. PLoS ONE 2020, 15, e0231176. [Google Scholar] [CrossRef]
  36. Bekker, G.A.; Fischer, A.R.; Tobi, H.; van Trijp, H.C. Explicit and implicit attitude toward an emerging food technology: The case of cultured meat. Appetite 2017, 108, 245–254. [Google Scholar] [CrossRef]
  37. Bryant, C.; Dillard, C. The Impact of Framing on Acceptance of Cultured Meat. Front. Nutr. 2019, 6, 103. [Google Scholar] [CrossRef] [Green Version]
  38. Asioli, D.; Bazzani, C.; Nayga, R.M. Consumers’ valuation for lab produced meat: An investigation of naming effects. In Proceedings of the American Agricultural Economics Association (AAEA) Annual Meeting, Washington, DC, USA, 6–8 August 2018. [Google Scholar]
  39. Bryant, C.J.; Barnett, J.C. What’s in a name? Consumer perceptions of in vitro meat under different names. Appetite 2019, 137, 104–113. [Google Scholar] [CrossRef]
  40. GFI Clean Meat: The Naming of Tissue-Engineered Meat; Good Food Institute: Washington, WA, USA, 2016; Available online: https://gfi.org/blog/cultivatedmeat/ (accessed on 28 June 2019).
  41. GFI Cellular Agriculture Nomenclature: Optimizing Consumer Acceptance; Good Food Institute: Washington, WA, USA, 2018; Available online: https://gfi.org/images/uploads/2018/09/INN-RPT-Cellular-Agriculture-Nomenclature-2018-0921.pdf (accessed on 25 July 2019).
  42. GFI How We Talk about Meat Grown without Animals—Unpacking the Debate and the Data. Available online: https://www.gfi.org/how-we-talk-about-meat-grown-without-animals (accessed on 24 June 2019).
  43. Jo, A. Chris Bryant Messages to Overcome Naturalness Concerns in Clean Meat Acceptance: Primary Findings; Faunalytics: Olympia, WA, USA, 2018. [Google Scholar]
  44. Macdonald, B.; Vivalt, E. Effective Strategies for Overcoming the Naturalistic Heuristic: Experimental Evidence on Consumer Acceptance of “Clean” Meat; Open Science Framework: Charlottesville, VA, USA, 2017. [Google Scholar]
  45. Fernqvist, F.; Ekelund, L. Credence and the effect on consumer liking of food—A review. Food Qual. Prefer. 2014, 32, 340–353. [Google Scholar] [CrossRef] [Green Version]
  46. Schäufele, I.; Hamm, U. Consumers’ perceptions, preferences and willingness-to-pay for wine with sustainability characteristics: A review. J. Clean. Prod. 2017, 147, 379–394. [Google Scholar] [CrossRef]
  47. Fernqvist, F. Credence. Methods Consum. Res. 2018, 1, 531–555. [Google Scholar] [CrossRef]
  48. Poelman, A.; Mojet, J.; Lyon, D.; Sefa-Dedeh, S. The influence of information about organic production and fair trade on preferences for and perception of pineapple. Food Qual. Prefer. 2008, 19, 114–121. [Google Scholar] [CrossRef]
  49. Zanoli, R.; Scarpa, R.; Napolitano, F.; Piasentier, E.; Naspetti, S.; Bruschi, V. Organic label as an identifier of environmentally related quality: A consumer choice experiment on beef in Italy. Renew. Agric. Food Syst. 2012, 28, 70–79. [Google Scholar] [CrossRef] [Green Version]
  50. Wells, F.L. A Statistical Study of Literary Merit: With Remarks on Some New Phases of the Method. Arch. Psychol. 1907, 7, 5–30. [Google Scholar]
  51. Thorndike, E.L. A constant error in psychological ratings. J. Appl. Psychol. 1920, 4, 25–29. [Google Scholar] [CrossRef] [Green Version]
  52. Murphy, K.R.; Jako, R.A.; Anhalt, R.L. Nature and consequences of halo error: A critical analysis. J. Appl. Psychol. 1993, 78, 218–225. [Google Scholar] [CrossRef]
  53. Nisbett, R.E.; Wilson, T.D. The halo effect: Evidence for unconscious alteration of judgments. J. Pers. Soc. Psychol. 1977, 35, 250–256. [Google Scholar] [CrossRef]
  54. Talamas, S.N.; Mavor, K.I.; Perrett, D.I. Blinded by Beauty: Attractiveness Bias and Accurate Perceptions of Academic Performance. PLoS ONE 2016, 11, e0148284. [Google Scholar] [CrossRef] [PubMed] [Green Version]
  55. Forgas, J.P.; Laham, S.M.; Baumeister, R.; Vohs, K. Halo Effect. Encycl. Soc. Psychol. 2012, 1. [Google Scholar] [CrossRef]
  56. Petersen, M.; Brockhaus, S. Dancing in the dark: Challenges for product developers to improve and communicate product sustainability. J. Clean. Prod. 2017, 161, 345–354. [Google Scholar] [CrossRef]
  57. Ellison, B.; Duff, B.R.; Wang, Z.; White, T.B. Putting the organic label in context: Examining the interactions between the organic label, product type, and retail outlet. Food Qual. Prefer. 2016, 49, 140–150. [Google Scholar] [CrossRef] [Green Version]
  58. Schuldt, J.P.; Hannahan, M. When good deeds leave a bad taste. Negative inferences from ethical food claims. Appetite 2013, 62, 76–83. [Google Scholar] [CrossRef] [PubMed]
  59. Schuldt, J.P.; Muller, D.; Schwarz, N. The “Fair Trade” Effect. Soc. Psychol. Pers. Sci. 2012, 3, 581–589. [Google Scholar] [CrossRef] [Green Version]
  60. Chernev, A.; Blair, S. Doing Well by Doing Good: The Benevolent Halo of Corporate Social Responsibility. J. Consum. Res. 2015, 41, 1412–1425. [Google Scholar] [CrossRef]
  61. García-Torres, S.; López-Gajardo, A.; Mesías, F. Intensive vs. free-range organic beef. A preference study through consumer liking and conjoint analysis. Meat Sci. 2016, 114, 114–120. [Google Scholar] [CrossRef] [PubMed]
  62. Napolitano, F.; Braghieri, A.; Piasentier, E.; Favotto, S.; Naspetti, S.; Zanoli, R. Effect of information about organic production on beef liking and consumer willingness to pay. Food Qual. Prefer. 2010, 21, 207–212. [Google Scholar] [CrossRef] [Green Version]
  63. Napolitano, F.; Castellini, C.; Naspetti, S.; Piasentier, E.; Girolami, A.; Braghieri, A. Consumer preference for chicken breast may be more affected by information on organic production than by product sensory properties. Poult. Sci. 2013, 92, 820–826. [Google Scholar] [CrossRef] [PubMed]
  64. Anderson, E.C.; Barrett, L.F. Affective Beliefs Influence the Experience of Eating Meat. PLoS ONE 2016, 11, e0160424. [Google Scholar] [CrossRef] [PubMed]
  65. Aguinis, H.; Glavas, A. What We Know and Don’t Know About Corporate Social Responsibility. J. Manag. 2012, 38, 932–968. [Google Scholar] [CrossRef] [Green Version]
  66. Wilcock, A.; Pun, M.; Khanona, J.; Aung, M. Consumer attitudes, knowledge and behaviour: A review of food safety issues. Trends Food Sci. Technol. 2004, 15, 56–66. [Google Scholar] [CrossRef]
  67. Barlow, S.M.; Boobis, A.R.; Bridges, J.; Cockburn, A.; Dekant, W.; Hepburn, P.; Houben, G.F.; Koenig, J.; Nauta, M.J.; Schuermans, J.; et al. The role of hazard- and risk-based approaches in ensuring food safety. Trends Food Sci. Technol. 2015, 46, 176–188. [Google Scholar] [CrossRef] [Green Version]
  68. Behrens, J.H.; Barcellos, M.N.; Frewer, L.J.; Nunes, T.; Franco, B.D.; Destro, M.T.; Landgraf, M. Consumer purchase habits and views on food safety: A Brazilian study. Food Control. 2010, 21, 963–969. [Google Scholar] [CrossRef]
  69. Ergönül, B. Consumer awareness and perception to food safety: A consumer analysis. Food Control. 2013, 32, 461–471. [Google Scholar] [CrossRef]
  70. Turner, M.; Kitchenham, B.; Brereton, P.; Charters, S.; Budgen, D. Does the technology acceptance model predict actual use? A systematic literature review. Inf. Softw. Technol. 2010, 52, 463–479. [Google Scholar] [CrossRef]
  71. Fischer, A.R.; Reinders, M. Consumer Acceptance of Novel Foods. In Innovation Strategies in the Food Industry; Elsevier: Amsterdam, The Netherlands, 2016; pp. 271–292. [Google Scholar]
  72. Grankvist, G.; Lekedal, H.; Marmendal, M. Values and eco- and fair-trade labelled products. Br. Food J. 2007, 109, 169–181. [Google Scholar] [CrossRef]
  73. Sörqvist, P.; Hedblom, D.; Holmgren, M.; Haga, A.; Langeborg, L.; Nöstl, A.; Kågström, J. Who Needs Cream and Sugar When There Is Eco-Labeling? Taste and Willingness to Pay for “Eco-Friendly” Coffee. PLoS ONE 2013, 8, e80719. [Google Scholar] [CrossRef]
  74. Hüffmeier, J.; Mazei, J.; Schultze, T. Reconceptualizing replication as a sequence of different studies: A replication typology. J. Exp. Soc. Psychol. 2016, 66, 81–92. [Google Scholar] [CrossRef]
  75. Hayes, A.F. Introduction to Mediation, Moderation, and Conditional Process Analysis: A Regression-Based Approach, 2nd ed.; Methodology in the Social Sciences; Guilford Press: New York, NY, USA, 2018; ISBN 978-1-4625-3465-4. [Google Scholar]
  76. Krishna, A. A clearer spotlight on spotlight: Understanding, conducting and reporting. J. Consum. Psychol. 2016, 26, 315–324. [Google Scholar] [CrossRef]
  77. Faul, F.; Erdfelder, E.; Buchner, A.; Lang, A.-G. Statistical power analyses using G*Power 3.1: Tests for correlation and regression analyses. Behav. Res. Methods 2009, 41, 1149–1160. [Google Scholar] [CrossRef] [Green Version]
  78. Faul, F.; Erdfelder, E.; Lang, A.-G.; Buchner, A. G*Power 3: A flexible statistical power analysis program for the social, behavioral, and biomedical sciences. Behav. Res. Methods 2007, 39, 175–191. [Google Scholar] [CrossRef]
  79. Cohen, J. A power primer. Psychol. Bull. 1992, 112, 155–159. [Google Scholar] [CrossRef]
  80. Buhrmester, M.D.; Talaifar, S.; Gosling, S.D. An Evaluation of Amazon’s Mechanical Turk, Its Rapid Rise, and Its Effective Use. Perspect. Psychol. Sci. 2018, 13, 149–154. [Google Scholar] [CrossRef] [PubMed]
  81. Buhrmester, M.D.; Kwang, T.; Gosling, S.D. Amazon’s Mechanical Turk. Perspect. Psychol. Sci. 2011, 6, 3–5. [Google Scholar] [CrossRef] [PubMed]
  82. Kees, J.; Berry, C.; Burton, S.; Sheehan, K. An Analysis of Data Quality: Professional Panels, Student Subject Pools, and Amazon’s Mechanical Turk. J. Advert. 2017, 46, 141–155. [Google Scholar] [CrossRef]
  83. Mason, W.; Suri, S. Conducting behavioral research on Amazon’s Mechanical Turk. Behav. Res. Methods 2012, 44, 1–23. [Google Scholar] [CrossRef] [PubMed]
  84. Rouse, S.V. A reliability analysis of Mechanical Turk data. Comput. Hum. Behav. 2015, 43, 304–307. [Google Scholar] [CrossRef]
  85. Goldstone, A.P.; De Hernandez, C.G.P.; Beaver, J.D.; Muhammed, K.; Croese, C.; Bell, G.; Durighel, G.; Hughes, E.; Waldman, A.D.; Frost, G.; et al. Fasting biases brain reward systems towards high-calorie foods. Eur. J. Neurosci. 2009, 30, 1625–1635. [Google Scholar] [CrossRef] [PubMed]
  86. Wren, A.M.; Seal, L.J.; Cohen, M.A.; Brynes, A.E.; Frost, G.S.; Murphy, K.G.; Dhillo, W.; Ghatei, M.A.; Bloom, S.R. Ghrelin Enhances Appetite and Increases Food Intake in Humans. J. Clin. Endocrinol. Metab. 2001, 86, 5992. [Google Scholar] [CrossRef] [PubMed]
  87. Piazza, J.R.; Loughnan, S. When Meat Gets Personal, Animals’ Minds Matter Less. Soc. Psychol. Pers. Sci. 2016, 7, 867–874. [Google Scholar] [CrossRef] [Green Version]
  88. Piazza, J.; Ruby, M.B.; Loughnan, S.; Luong, M.; Kulik, J.; Watkins, H.M.; Seigerman, M. Rationalizing meat consumption. The 4Ns. Appetite 2015, 91, 114–128. [Google Scholar] [CrossRef] [Green Version]
  89. Graham, J.; Haidt, J.; Nosek, B.A. Liberals and conservatives rely on different sets of moral foundations. J. Pers. Soc. Psychol. 2009, 96, 1029–1046. [Google Scholar] [CrossRef]
  90. Simmons, J.P.; Nelson, L.D.; Simonsohn, U. False-Positive Psychology. Psychol. Sci. 2011, 22, 1359–1366. [Google Scholar] [CrossRef] [PubMed] [Green Version]
  91. Pliner, P.; Hobden, K.L. Development of a scale to measure the trait of food neophobia in humans. Appetite 1992, 19, 105–120. [Google Scholar] [CrossRef]
  92. MacKinnon, D.P.; Krull, J.L.; Lockwood, C.M. Equivalence of the Mediation, Confounding and Suppression Effect. Prev. Sci. 2000, 1, 173–181. [Google Scholar] [CrossRef] [PubMed]
  93. Baumeister, R.F.; Bratslavsky, E.; Finkenauer, C.; Vohs, K.D. Bad is Stronger than Good. Rev. Gen. Psychol. 2001, 5, 323–370. [Google Scholar] [CrossRef]
  94. Ito, T.A.; Larsen, J.T.; Smith, N.K.; Cacioppo, J.T. Negative information weighs more heavily on the brain: The negativity bias in evaluative categorizations. J. Pers. Soc. Psychol. 1998, 75, 887–900. [Google Scholar] [CrossRef]
  95. Rozin, P.; Royzman, E.B. Negativity Bias, Negativity Dominance, and Contagion. Pers. Soc. Psychol. Rev. 2001, 5, 296–320. [Google Scholar] [CrossRef]
  96. Kahneman, D.; Tversky, A. Prospect theory: An analysis of decision under risk. Econometrica 1979, 47, 263–292. [Google Scholar] [CrossRef] [Green Version]
  97. Tversky, A.; Kahneman, D. Advances in prospect theory: Cumulative representation of uncertainty. J. Risk Uncertain. 1992, 5, 297–323. [Google Scholar] [CrossRef]
  98. Roe, B.; Teisl, M.F. Genetically modified food labeling: The impacts of message and messenger on consumer perceptions of labels and products. Food Policy 2007, 32, 49–66. [Google Scholar] [CrossRef]
  99. Siegrist, M.; Cvetkovich, G. Better Negative than Positive? Evidence of a Bias for Negative Information about Possible Health Dangers. Risk Anal. 2001, 21, 199–206. [Google Scholar] [CrossRef]
  100. Guan, X.; Lei, Q.; Yan, Q.; Li, X.; Zhou, J.; Du, G.; Chen, J. Trends and ideas in technology, regulation and public acceptance of cultured meat. Futur. Foods 2021, 3, 100032. [Google Scholar] [CrossRef]
  101. Mancini, M.C.; Antonioli, F. Exploring consumers’ attitude towards cultured meat in Italy. Meat Sci. 2019, 150, 101–110. [Google Scholar] [CrossRef] [PubMed]
  102. Pino, G.; Amatulli, C.; De Angelis, M.; Peluso, A.M. The influence of corporate social responsibility on consumers’ attitudes and intentions toward genetically modified foods: Evidence from Italy. J. Clean. Prod. 2016, 112, 2861–2869. [Google Scholar] [CrossRef]
  103. Cooper, W.H. Ubiquitous halo. Psychol. Bull. 1981, 90, 218–244. [Google Scholar] [CrossRef]
  104. Cavaliere, A.; Ventura, V. Mismatch between food sustainability and consumer acceptance toward innovation technologies among Millennial students: The case of Shelf Life Extension. J. Clean. Prod. 2018, 175, 641–650. [Google Scholar] [CrossRef]
  105. Cox, D.; Evans, G. Construction and validation of a psychometric scale to measure consumers’ fears of novel food technologies: The food technology neophobia scale. Food Qual. Preference 2008, 19, 704–710. [Google Scholar] [CrossRef]
  106. Surveygoo Nearly One in Three Consumers Willing to Eat Lab-Grown Meat, According to New Research. Available online: https://www.datasmoothie.com/@surveygoo/nearly-one-in-three-consumers-willing-to-eat-lab-g/ (accessed on 24 June 2019).
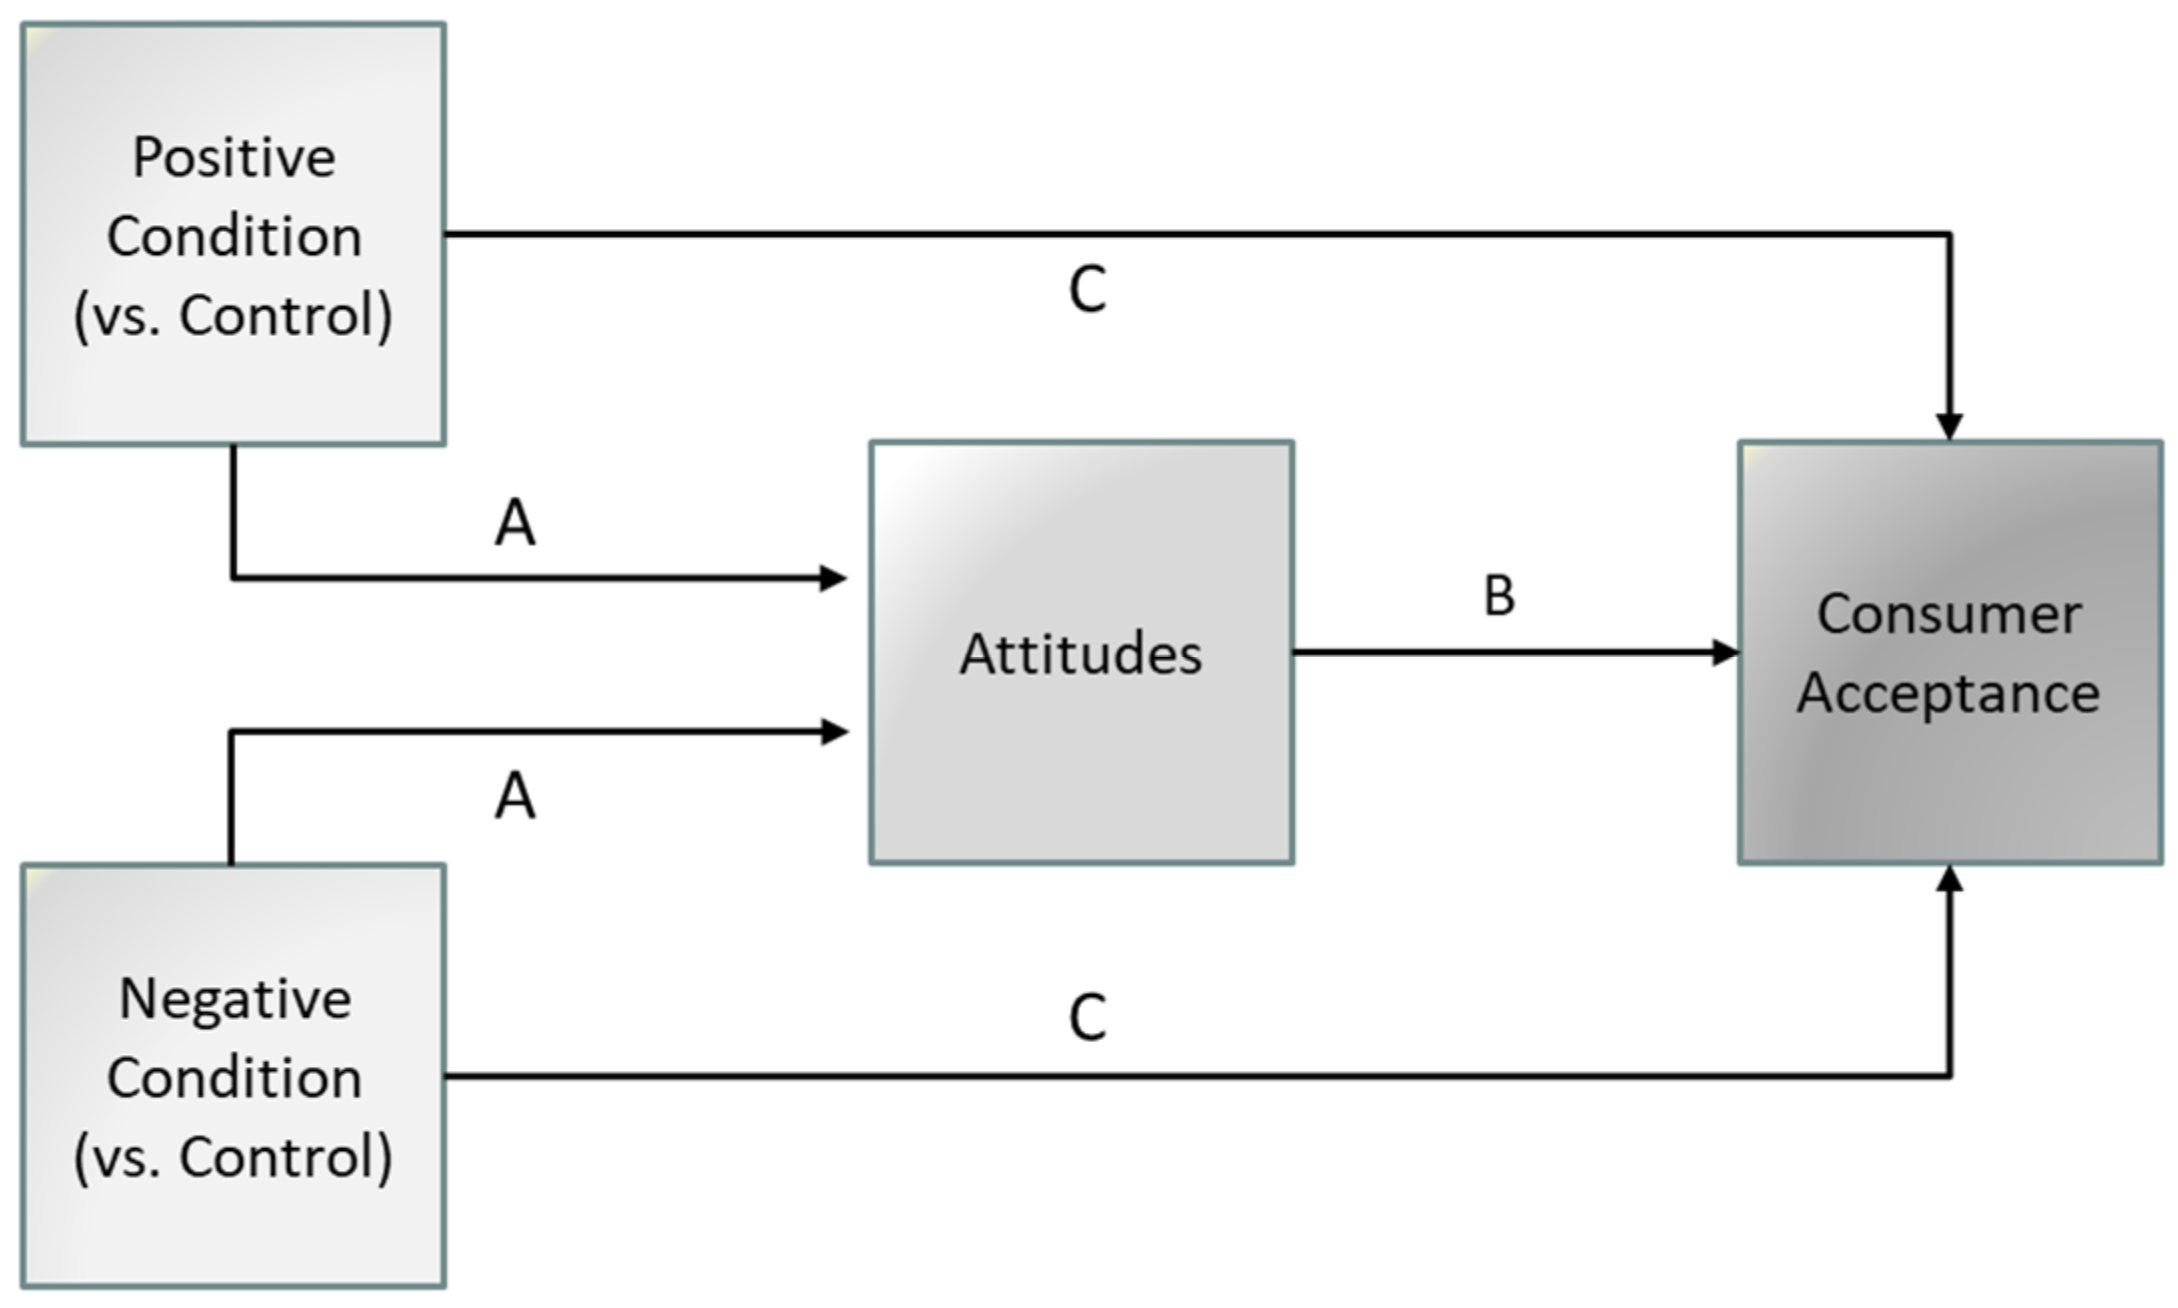
Figure 1. Mediation Model Used in Studies 1 and 2 to Test H2.
Sustainability 13 06770 g001
Figure 2. Moderated Mediation Model Used in Studies 1 and 2 to Test H3.
Sustainability 13 06770 g002
Figure 3. Descriptive Statistics of Attitudes and Consumer Acceptance by Study and Condition. Error bars representing standard error of the mean (SEM). Scale endpoints range from 1 to 7.
Sustainability 13 06770 g003
Figure 4. Model Testing that Attitudes Toward CM Mediate the Effect of CSR on Consumer Acceptance in Study 1. The model accounted for 59% of the variance in consumer acceptance (R2 = 0.587). Note: ** p < 0.05. Betas of not significant (n.s.) paths are not displayed.
Sustainability 13 06770 g004
Figure 5. Model Testing that Attitudes Toward CM Mediate the Effect of Safety on Consumer Acceptance in Study 2. The model accounted for 56% of the variance in consumer acceptance (R2 = 0.561). Note: * p < 0.10, ** p < 0.05. Betas of not significant (n.s.) paths are not displayed.
Sustainability 13 06770 g005
Publisher’s Note: MDPI stays neutral with regard to jurisdictional claims in published maps and institutional affiliations.