
The City-Wide Impacts of the Interactions between Shared Autonomous Vehicle-Based Mobility Services and the Public Transportation System


Abstract
1. Introduction
- Autonomous vehicles (AVs): upgraded versions of conventional personal vehicles that have high levels of automation to assist or replace human drivers.
- Shared autonomous vehicles (SAVs): AVs used for the purpose of providing vehicle sharing services.
- Public transportation (PT): Grouped travel systems generally operated on pre-defined schedules.
- Demand responsive transit (DRT): A PT service in which users have to book their trips in advance.
2. Literature Review
2.1. Agent-Based Simulations for Impact Analysis
2.2. City-Wide Impact Analysis
2.3. The Impact on Public Transit Systems
3. Methodology
3.1. Analyzed Cities and Selection of Types
3.2. Scenario Composition
3.2.1. Scenarios According to the Implementation of PT-Integrated Services
3.2.2. Scenarios According to the Provisioning of Autonomous Driving-Based Services
3.2.3. Scenarios According to the Travel Time Reliability of PT Services
3.2.4. Scenarios According to Various Demand–Supply Ratios
3.3. The Agent-Based Simulation Method
3.3.1. A Matching Algorithm for the Implementation of Autonomous Driving and Shared Mobility
3.3.2. Simulation Network and Settings
3.4. City-Wide Impact Analysis Method by Type of City
3.4.1. Calculation Method of the Modal Split Ratio
3.4.2. Calculating the Expected Rate of Increase or Decrease for Private Vehicles
4. Results
4.1. Results of Agent-Based Simulation Analysis
4.2. Analysis of City-Wide Impacts by Type of City
4.2.1. Analysis of Changes in Modal Split Ratio by Type of City
4.2.2. Analysis of the Change Rate of the Private Vehicle Traffic by Type of City
5. Conclusions
Author Contributions
Funding
Institutional Review Board Statement
Informed Consent Statement
Data Availability Statement
Conflicts of Interest
References
- De Almeida Correia, G.H.; van Arem, B. Solving the User Optimum Privately Owned Automated Vehicles Assignment Problem (UO-POAVAP): A model to explore the impacts of self-driving vehicles on urban mobility. Transp. Res. B Methodol. 2016, 87, 64–88. [Google Scholar] [CrossRef]
- Krueger, R.; Rashidi, T.H.; Rose, J.M. Preferences for shared autonomous vehicles. Transp. Res. C 2016, 69, 343–355. [Google Scholar] [CrossRef]
- Menon, N.; Barbour, N.; Zhang, Y.; Pinjari, A.R.; Mannering, F. Shared autonomous vehicles and their potential impacts on household vehicle ownership: An exploratory empirical assessment. Int. J. Sustain. Transp. 2019, 13, 111–122. [Google Scholar] [CrossRef]
- Brownell, C.; Kornhauser, A. A driverless alternative: Fleet size and cost requirements for a statewide Autonomous Taxi Network in New Jersey. Transp. Res. Rec. 2014, 2416, 73–81. [Google Scholar] [CrossRef]
- Clements, L.M.; Kockelman, K.M. Economic effects of automated vehicles. Transp. Res. Rec. 2017, 2606, 106–114. [Google Scholar] [CrossRef]
- Heilig, M.; Hilgert, T.; Mallig, N.; Kagerbauer, M.; Vortisch, P. Potentials of autonomous vehicles in a changing private transportation system—A case study in the Stuttgart region. Transp. Res. Procedia 2017, 26, 13–21. [Google Scholar] [CrossRef]
- Fagnant, D.J.; Kockelman, K.M. Dynamic ride-sharing and fleet sizing for a system of shared autonomous vehicles in Austin, Texas. Transportation 2018, 45, 143–158. [Google Scholar] [CrossRef]
- Jäger, B.; Brickwedde, C.; Lienkamp, M. Multi-agent simulation of a demand-responsive transit system operated by autonomous vehicles. Transp. Res. Rec. 2018, 2672, 764–774. [Google Scholar] [CrossRef]
- Daganzo, C.F. An approximate analytic model of many-to-many demand responsive transportation systems. Transp. Res. 1978, 12, 325–333. [Google Scholar] [CrossRef]
- Wilson, N.H.M.; Hendrickson, C. Performance models of flexibly routed transportation services. Transp. Res. B 1980, 14, 67–78. [Google Scholar] [CrossRef]
- Diana, M.; Quadrifoglio, L.; Pronello, C. A methodology for comparing distances traveled by performance-equivalent fixed-route and demand responsive transit services. Transp. Plan. Technol. 2009, 32, 377–399. [Google Scholar] [CrossRef]
- Li, X.; Quadrifoglio, L. Feeder transit services: Choosing between fixed and demand responsive policy. Transp. Res. C 2010, 18, 770–780. [Google Scholar] [CrossRef]
- Qiu, F.; Li, W.; Haghani, A. A methodology for choosing between fixed-route and flex-route policies for transit services. J. Adv. Transp. 2015, 49, 496–509. [Google Scholar] [CrossRef]
- Chang, S.K.; Schonfeld, P.M. Integration of fixed- and flexible-route bus systems. Transp. Res. Board J. Transp. Res. Board 1991, 1308, 51–57. [Google Scholar]
- Aldaihani, M.M.; Quadrifoglio, L.; Dessouky, M.M.; Hall, R. Network design for a grid hybrid transit service. Transp. Res. A 2004, 38, 511–530. [Google Scholar] [CrossRef]
- Li, X.; Quadrifoglio, L. Optimal zone design for feeder transit services. Transp. Res. Rec. 2009, 2111, 100–108. [Google Scholar] [CrossRef]
- Chen, T.D.; Kockelman, K.M. Management of a shared autonomous electric vehicle fleet: Implications of pricing schemes. Transp. Res. Rec. 2016, 2572, 37–46. [Google Scholar] [CrossRef]
- Mendes, L.M.; Bennàssar, M.R.; Chow, J.Y.J. Comparison of light rail streetcar against shared autonomous vehicle fleet for Brooklyn–Queens connector in New York City. Transp. Res. Rec. 2017, 2650, 142–151. [Google Scholar] [CrossRef]
- Shen, Y.; Zhang, H.; Zhao, J. Integrating shared autonomous vehicle in public transportation system: A supply-side simulation of the first-mile service in Singapore. Transp. Res. A 2018, 113, 125–136. [Google Scholar] [CrossRef]
- Dia, H.; Javanshour, F. Autonomous shared mobility-on-demand: Melbourne pilot simulation study. Transp. Res. Procedia 2017, 22, 285–296. [Google Scholar] [CrossRef]
- Overtoom, I.; Correia, G.; Huang, Y.; Verbraeck, A. Assessing the impacts of shared autonomous vehicles on congestion and curb use: A traffic simulation study in the Hague, Netherlands. Int. J. Transp. Sci. Technol. 2020, 9, 195–206. [Google Scholar] [CrossRef]
- Horni, A.; Nagel, K.; Axhausen, K.W. The Multi-Agent Transport Simulation MATSim, the Multi-Agent Transport Simulation MATSim; Ubiquity Press: London, UK, 2016. [Google Scholar] [CrossRef]
- Liu, J.; Kockelman, K.M.; Boesch, P.M.; Ciari, F. Tracking a system of shared autonomous vehicles across the Austin, Texas network using agent-based simulation. Transportation 2017, 44, 1261–1278. [Google Scholar] [CrossRef]
- Hamadneh, J.; Esztergar-Kiss, D. Impacts of shared autonomous vehicles on the travelers’ mobility. In Proceedings of the MT-ITS 2019—6th International Conference on Models and Technologies for Intelligent Transportation Systems, Cracow, Poland, 5–7 June 2019. [Google Scholar] [CrossRef]
- Vosooghi, R.; Puchinger, J.; Jankovic, M.; Vouillon, A. Shared autonomous vehicle simulation and service design. Transp. Res. Part C: Emerg. Technol. 2019, 107, 15–33. [Google Scholar] [CrossRef]
- Simoni, M.D.; Kockelman, K.M.; Gurumurthy, K.M.; Bischoff, J. Congestion pricing in a world of self-driving vehicles: An analysis of different strategies in alternative future scenarios. Transp. Res. C 2019, 98, 167–185. [Google Scholar] [CrossRef]
- Moreno, A.T.; Michalski, A.; Llorca, C.; Moeckel, R. Shared autonomous vehicles effect on vehicle-Km traveled and average trip duration. J. Adv. Transp. 2018, 2018, 8969353. [Google Scholar] [CrossRef]
- Bischoff, J.; Maciejewski, M. Autonomous taxicabs in Berlin—A spatiotemporal analysis of service performance. Transp. Res. Procedia 2016, 19, 176–186. [Google Scholar] [CrossRef]
- Martinez, L.M.; Viegas, J.M. Assessing the impacts of deploying a shared self-driving urban mobility system: An agent-based model applied to the city of Lisbon, Portugal. Int. J. Transp. Sci. Technol. 2017, 6, 13–27. [Google Scholar] [CrossRef]
- Alazzawi, S.; Hummel, M.; Kordt, P.; Sickenberger, T.; Wieseotte, C.; Wohak, O. Simulating the impact of shared, autonomous vehicles on urban mobility—A case study of Milan. EPiC Ser. Eng. 2018, 2, 94–110. [Google Scholar] [CrossRef]
- Lokhandwala, M.; Cai, H. Dynamic ride sharing using traditional taxis and shared autonomous taxis: A case study of NYC. Transp. Res. C 2018, 97, 45–60. [Google Scholar] [CrossRef]
- Chen, T.D.; Kockelman, K.M.; Hanna, J.P. Operations of a shared, autonomous, electric vehicle fleet: Implications of vehicle & charging infrastructure decisions. Transp. Res. A 2016, 94, 243–254. [Google Scholar] [CrossRef]
- Dlugosch, O.; Brandt, T.; Neumann, D. Combining analytics and simulation methods to assess the impact of shared, autonomous electric vehicles on sustainable urban mobility. Inf. Manag. 2020, 103285. [Google Scholar] [CrossRef]
- Narayanan, S.; Chaniotakis, E.; Antoniou, C. Shared autonomous vehicle services: A comprehensive review. Transp. Res. C 2020, 111, 255–293. [Google Scholar] [CrossRef]
- Williams, E.; Das, V.; Fisher, A. Assessing the Sustainability Implications of Autonomous Vehicles: Recommendations for Research Community Practice. Sustainability 2020, 12, 1902. [Google Scholar] [CrossRef]
- Ongel, A.; Loewer, E.; Roemer, F.; Sethuraman, G.; Chang, F.; Lienkamp, M. Economic assessment of autonomous electric microtransit vehicles. Sustainability 2019, 11, 648. [Google Scholar] [CrossRef]
- Alam, M.J.; Habib, M.A. Investigation of the impacts of shared autonomous vehicle operation in Halifax, Canada using a dynamic traffic microsimulation model. Procedia Comput. Sci. 2018, 130, 496–503. [Google Scholar] [CrossRef]
- Fagnant, D.J.; Kockelman, K.M. The travel and environmental implications of shared autonomous vehicles, using agent-based model scenarios. Transp. Res. C 2014, 40, 1–13. [Google Scholar] [CrossRef]
- Masoud, N.; Jayakrishnan, R. Autonomous or driver-less vehicles: Implementation strategies and operational concerns. Transp. Res. E 2017, 108, 179–194. [Google Scholar] [CrossRef]
- Childress, S.; Nichols, B.; Charlton, B.; Coe, S. Using an activity-based model to explore the potential impacts of automated vehicles. Transp. Res. Rec. 2015, 2493, 99–106. [Google Scholar] [CrossRef]
- Wang, K.; Akar, G. Factors affecting the adoption of autonomous vehicles for commute trips: An analysis with the 2015 and 2017 Puget Sound travel surveys. Transp. Res. Rec. 2019, 2673, 13–25. [Google Scholar] [CrossRef]
- Shokoohyar, S.; Sobhani, A.; Nargesi, S.R.R. On the determinants of Uber accessibility and its spatial distribution: Evidence from Uber in Philadelphia. Wiley Interdiscip. Rev. Data Min. Knowl. Discov. 2020, 10, e1362. [Google Scholar] [CrossRef]
- Shokoohyar, S.; Sobhani, A.; Sobhani, A. Impacts of trip characteristics and weather condition on ride-sourcing network: Evidence from Uber and Lyft. Res. Transp. Econ. 2020, 80, 100820. [Google Scholar] [CrossRef]
- Shokoohyar, S.; Shokoohyar, S.; Sobhani, A.; Gorizi, A.J. Shared mobility in post-COVID era: New challenges and opportunities. Sustain. Cities Soc. 2021, 67, 102714. [Google Scholar] [CrossRef]
- Salazar, M.; Rossi, F.; Schiffer, M.; Onder, C.H.; Pavone, M. On the interaction between autonomous mobility-on-demand and public transportation systems. In Proceedings of the 2018 21st International Conference on Intelligent Transportation Systems (ITSC), Maui, HI, USA, 4–7 November 2018; pp. 2262–2269. [Google Scholar] [CrossRef]
- Pinto, H.K.R.F.; Hyland, M.F.; Mahmassani, H.S.; Verbas, I.Ö. Joint design of multimodal transit networks and shared autonomous mobility fleets. Transp. Res. C 2020, 113, 2–20. [Google Scholar] [CrossRef]
- Korea Transport Database. National Passenger OD Totalization and Future Demand Forecast of Korea in 2017. 2018. Available online: https://www.ktdb.go.kr/www/selectPblcteWebView.do?key=36&pblcteNo=429 (accessed on 12 March 2021).
- Lang, N.S.; Reussmann, M.; Collie, B.E.; Wegscheider, A.K.; Moavenzadeh, J.; Loane, M. Reshaping Urban Mobility with Autonomous Vehicles—Lessons from the city of Boston. World Economic Forum: June. 2018. Available online: http://www3.weforum.org/docs/WEF_Reshaping_Urban_Mobility_with_Autonomous_Vehicles_2018.pdf (accessed on 12 March 2021).


| Classification | Private Vehicles (%) | PT (%) | Mobility-on-Demand (%) |
|---|---|---|---|
| Seoul | 27.7 | 63.1 | 9.2 |
| Incheon | 49.8 | 41.7 | 8.5 |
| Busan | 43.6 | 45.3 | 11.1 |
| Daegu | 55.3 | 33.6 | 11.1 |
| Gwangju | 63.9 | 23.2 | 12.9 |
| Daejeon | 63.8 | 26.5 | 9.7 |
| Ulsan | 65.4 | 23.5 | 11.1 |
| Sejong | 76.1 | 18.0 | 5.9 |
| Classification | Private Vehicles (%) | PT (%) | Mobility-on-Demand | ||
|---|---|---|---|---|---|
| (%) | AVs | ||||
| Type 1 city | Seoul | 13.67 | 49.14 | 37.19 | 32.72 |
| Busan | 29.65 | 31.26 | 39.09 | 34.40 | |
| Type 2 city | Gwangju | 40.94 | 25.23 | 33.83 | 29.44 |
| Incheon | 35.83 | 27.72 | 36.45 | 32.08 | |
| Daegu | 41.36 | 19.58 | 39.06 | 34.38 | |
| Daejeon | 40.82 | 28.45 | 30.73 | 26.73 | |
| Ulsan | 42.89 | 25.05 | 32.06 | 27.89 | |
| Sejong | 53.09 | 20.01 | 26.90 | 23.41 | |
| Notation | Description |
|---|---|
| Shared vehicle match rate | |
| Ratio of PT connected service use among shared mobility users | |
| Ratio of shared vehicle use among shared mobility users | |
| Current modal split ratio of public transit | |
| Future modal split ratio of public transit reflecting the simulation result | |
| Current modal split of private vehicles | |
| Future modal split of private vehicles reflecting the simulation result | |
| Current modal split ratio of mobility-on-demand | |
| Future modal split ratio of mobility-on-demand reflecting the simulation result | |
| Estimated change rate of private vehicles usage | |
| Average number of passengers when using shared vehicles | |
| Average number of passengers when using SAVs |
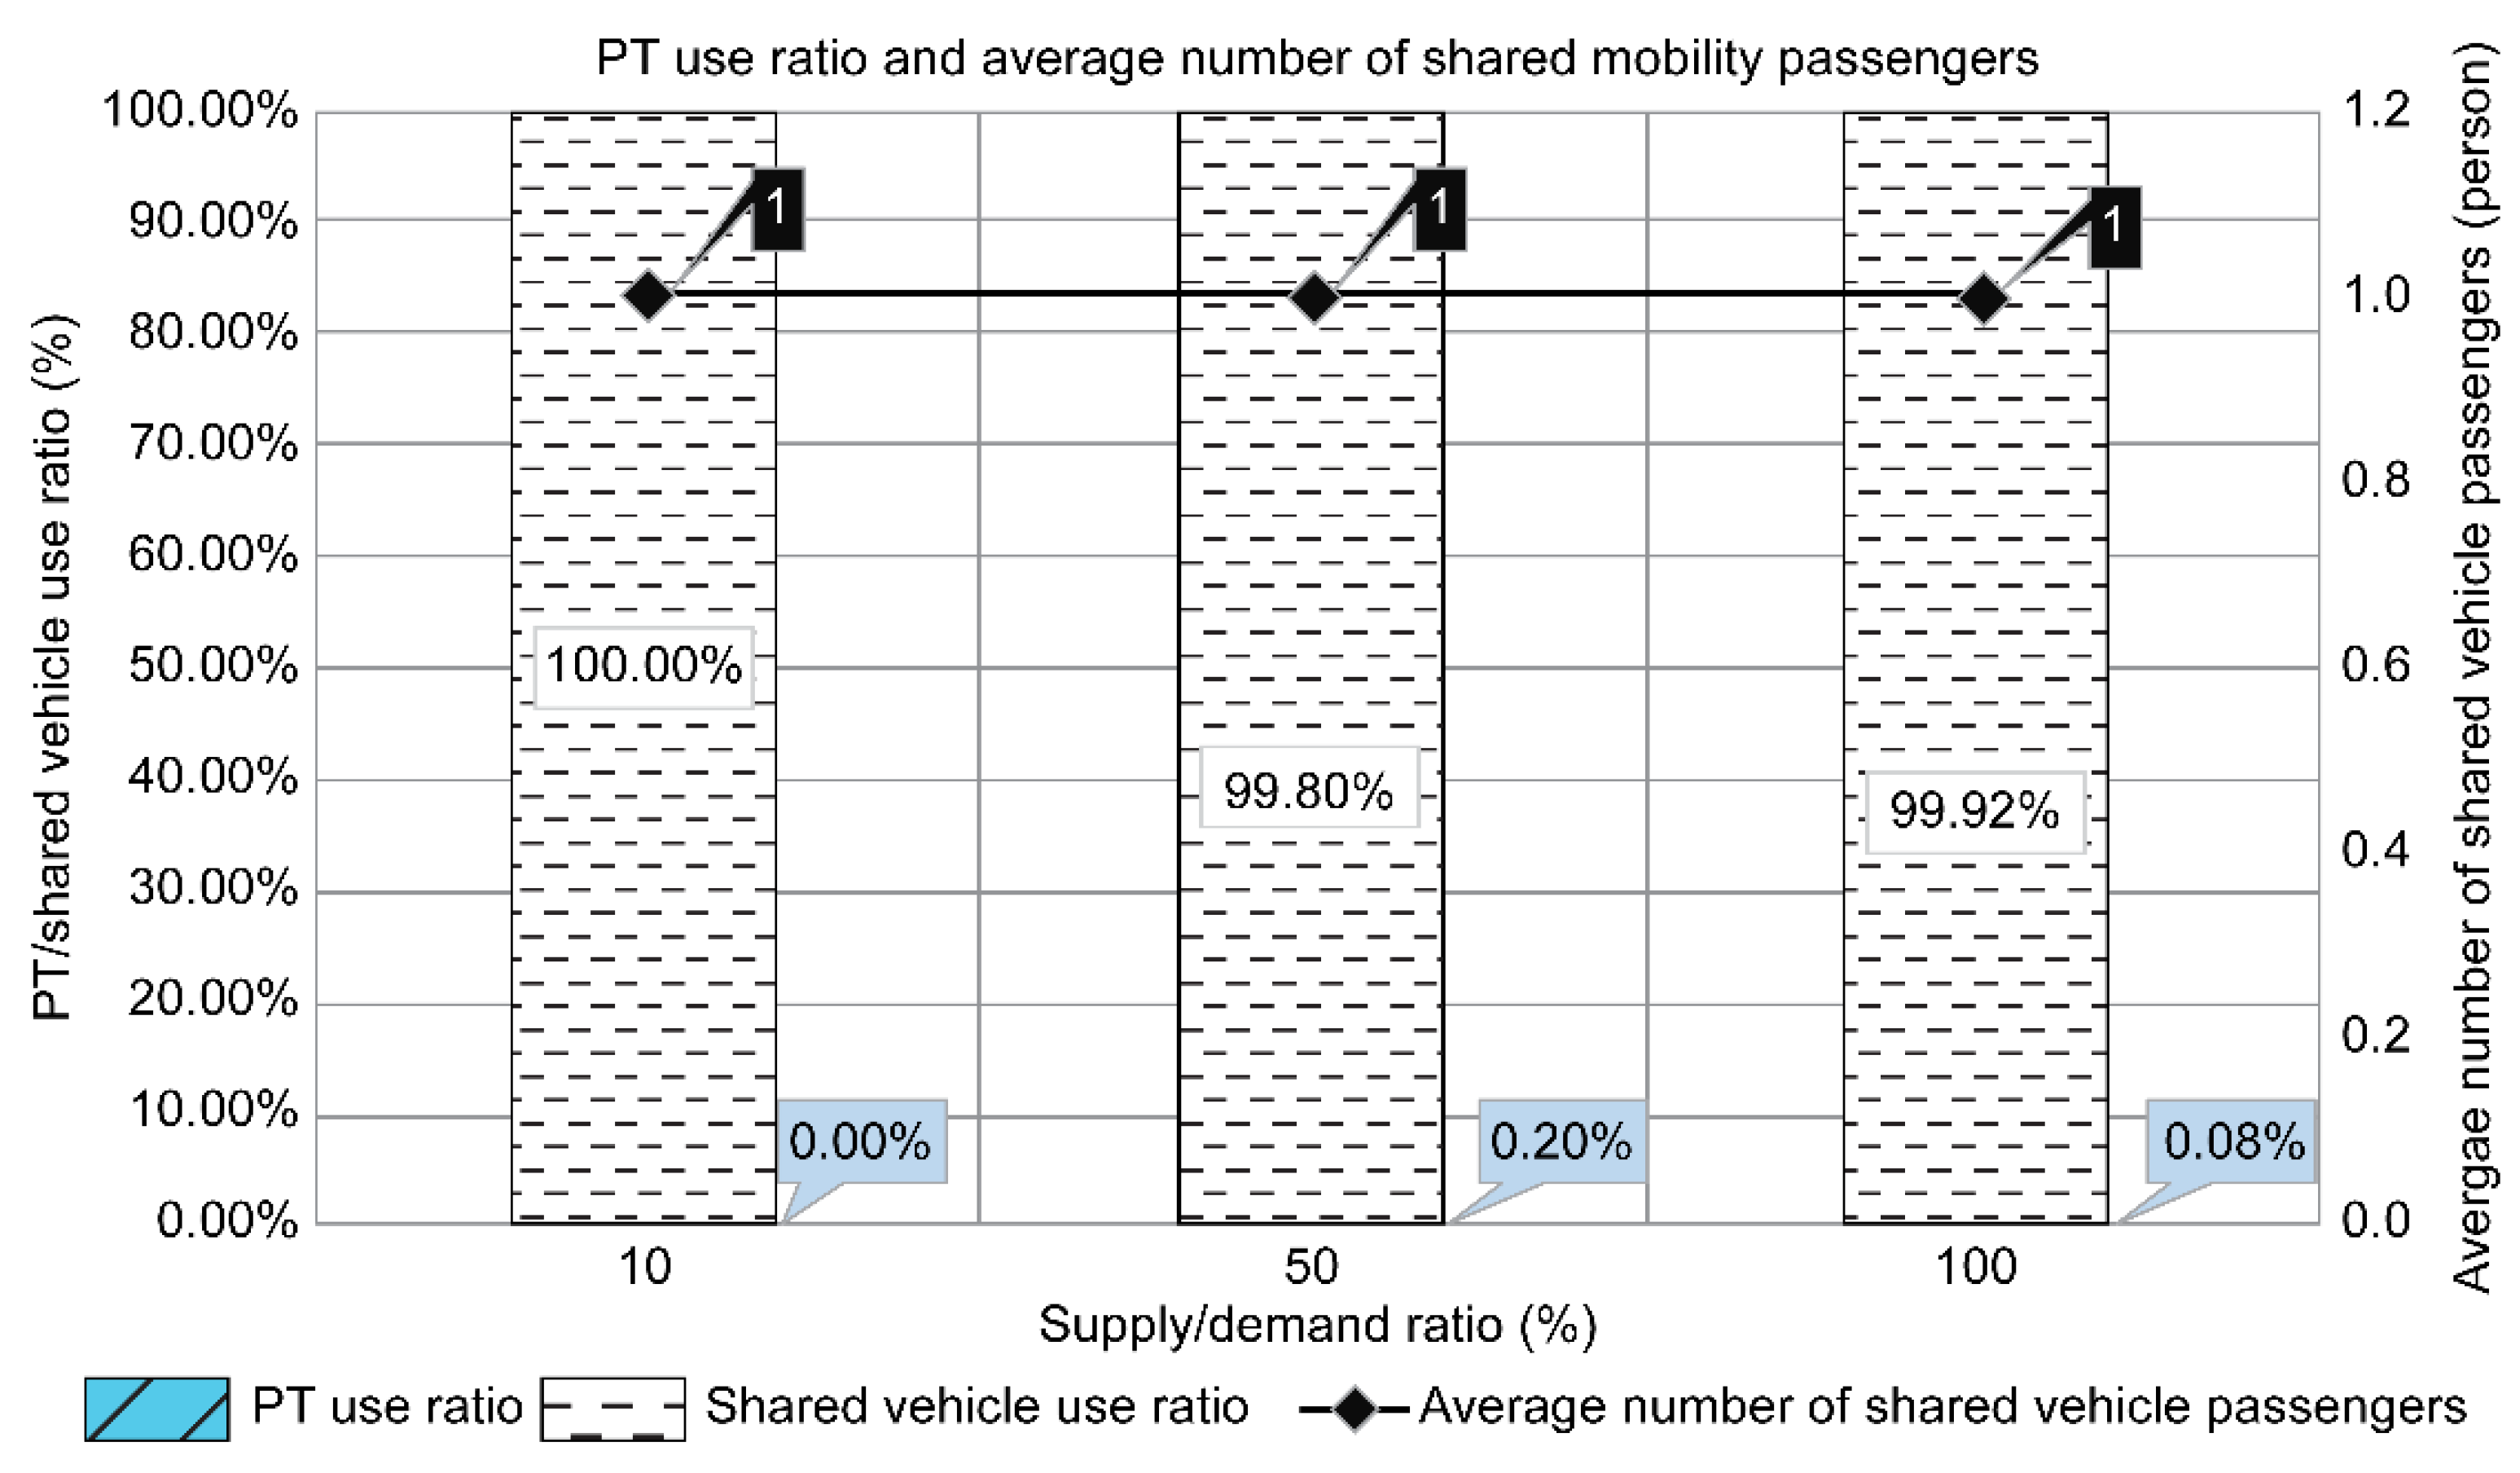
| Item | Supply/Demand Ratio (%) | ||
|---|---|---|---|
| 10 | 50 | 100 | |
| Change of shared vehicle match rate | −0.03 | −0.05 | −0.02 |
| Change of PT use ratio | −48.0% | −10.8% | −3.4% |
| Change of average number of shared vehicle passengers (persons) | −0.88 | −0.9 | −0.2 |
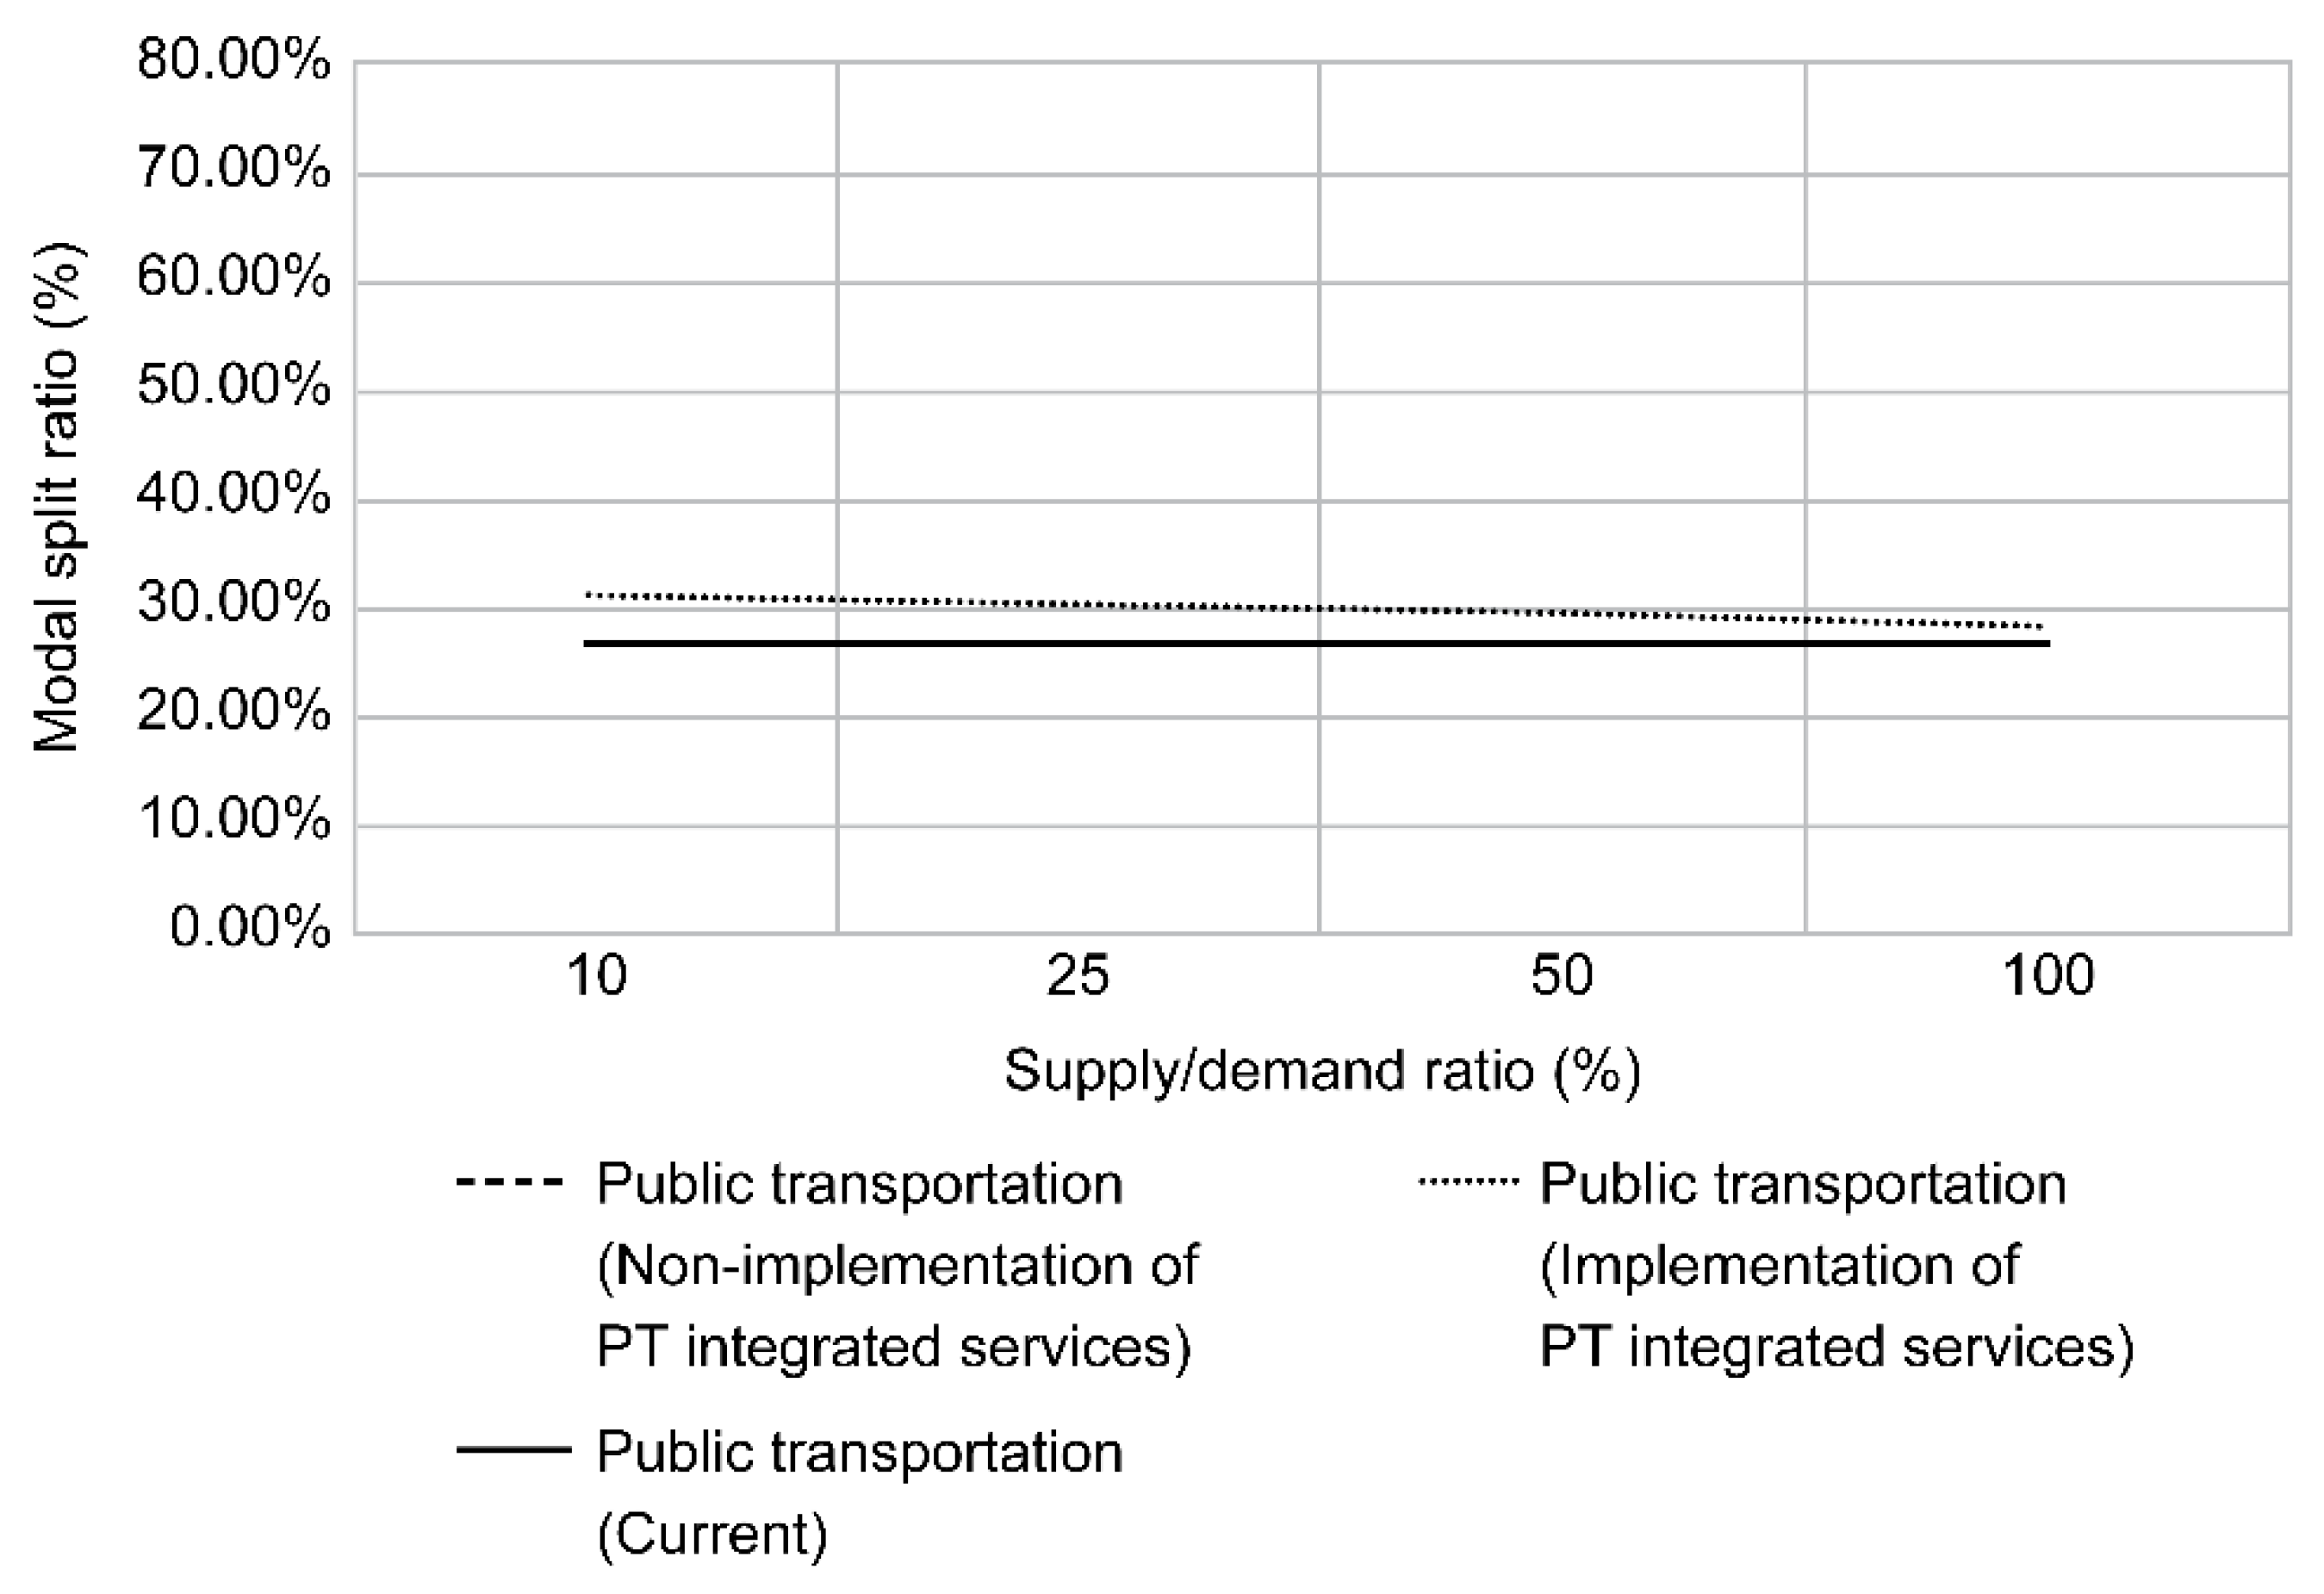
| Classification | Supply/Demand Ratio (%) | ||||
|---|---|---|---|---|---|
| 10% | 25% | 50% | 100% | ||
| Type 1 city | Current | 63.14% | 63.14% | 63.14% | 63.14% |
| Non-implementation of PT-integrated services | 61.88% | 56.19% | 45.46% | 29.68% | |
| Implementation of PT-integrated services | 62.15% | 57.25% | 50.02% | 38.70% | |
| Type 2 city | Current | 26.45% | 26.45% | 26.45% | 26.45% |
| Non-implementation of PT-integrated services | 26.45% | 26.45% | 26.45% | 26.45% | |
| Implementation of PT-integrated services | 30.96% | 30.06% | 29.33% | 28.01% | |
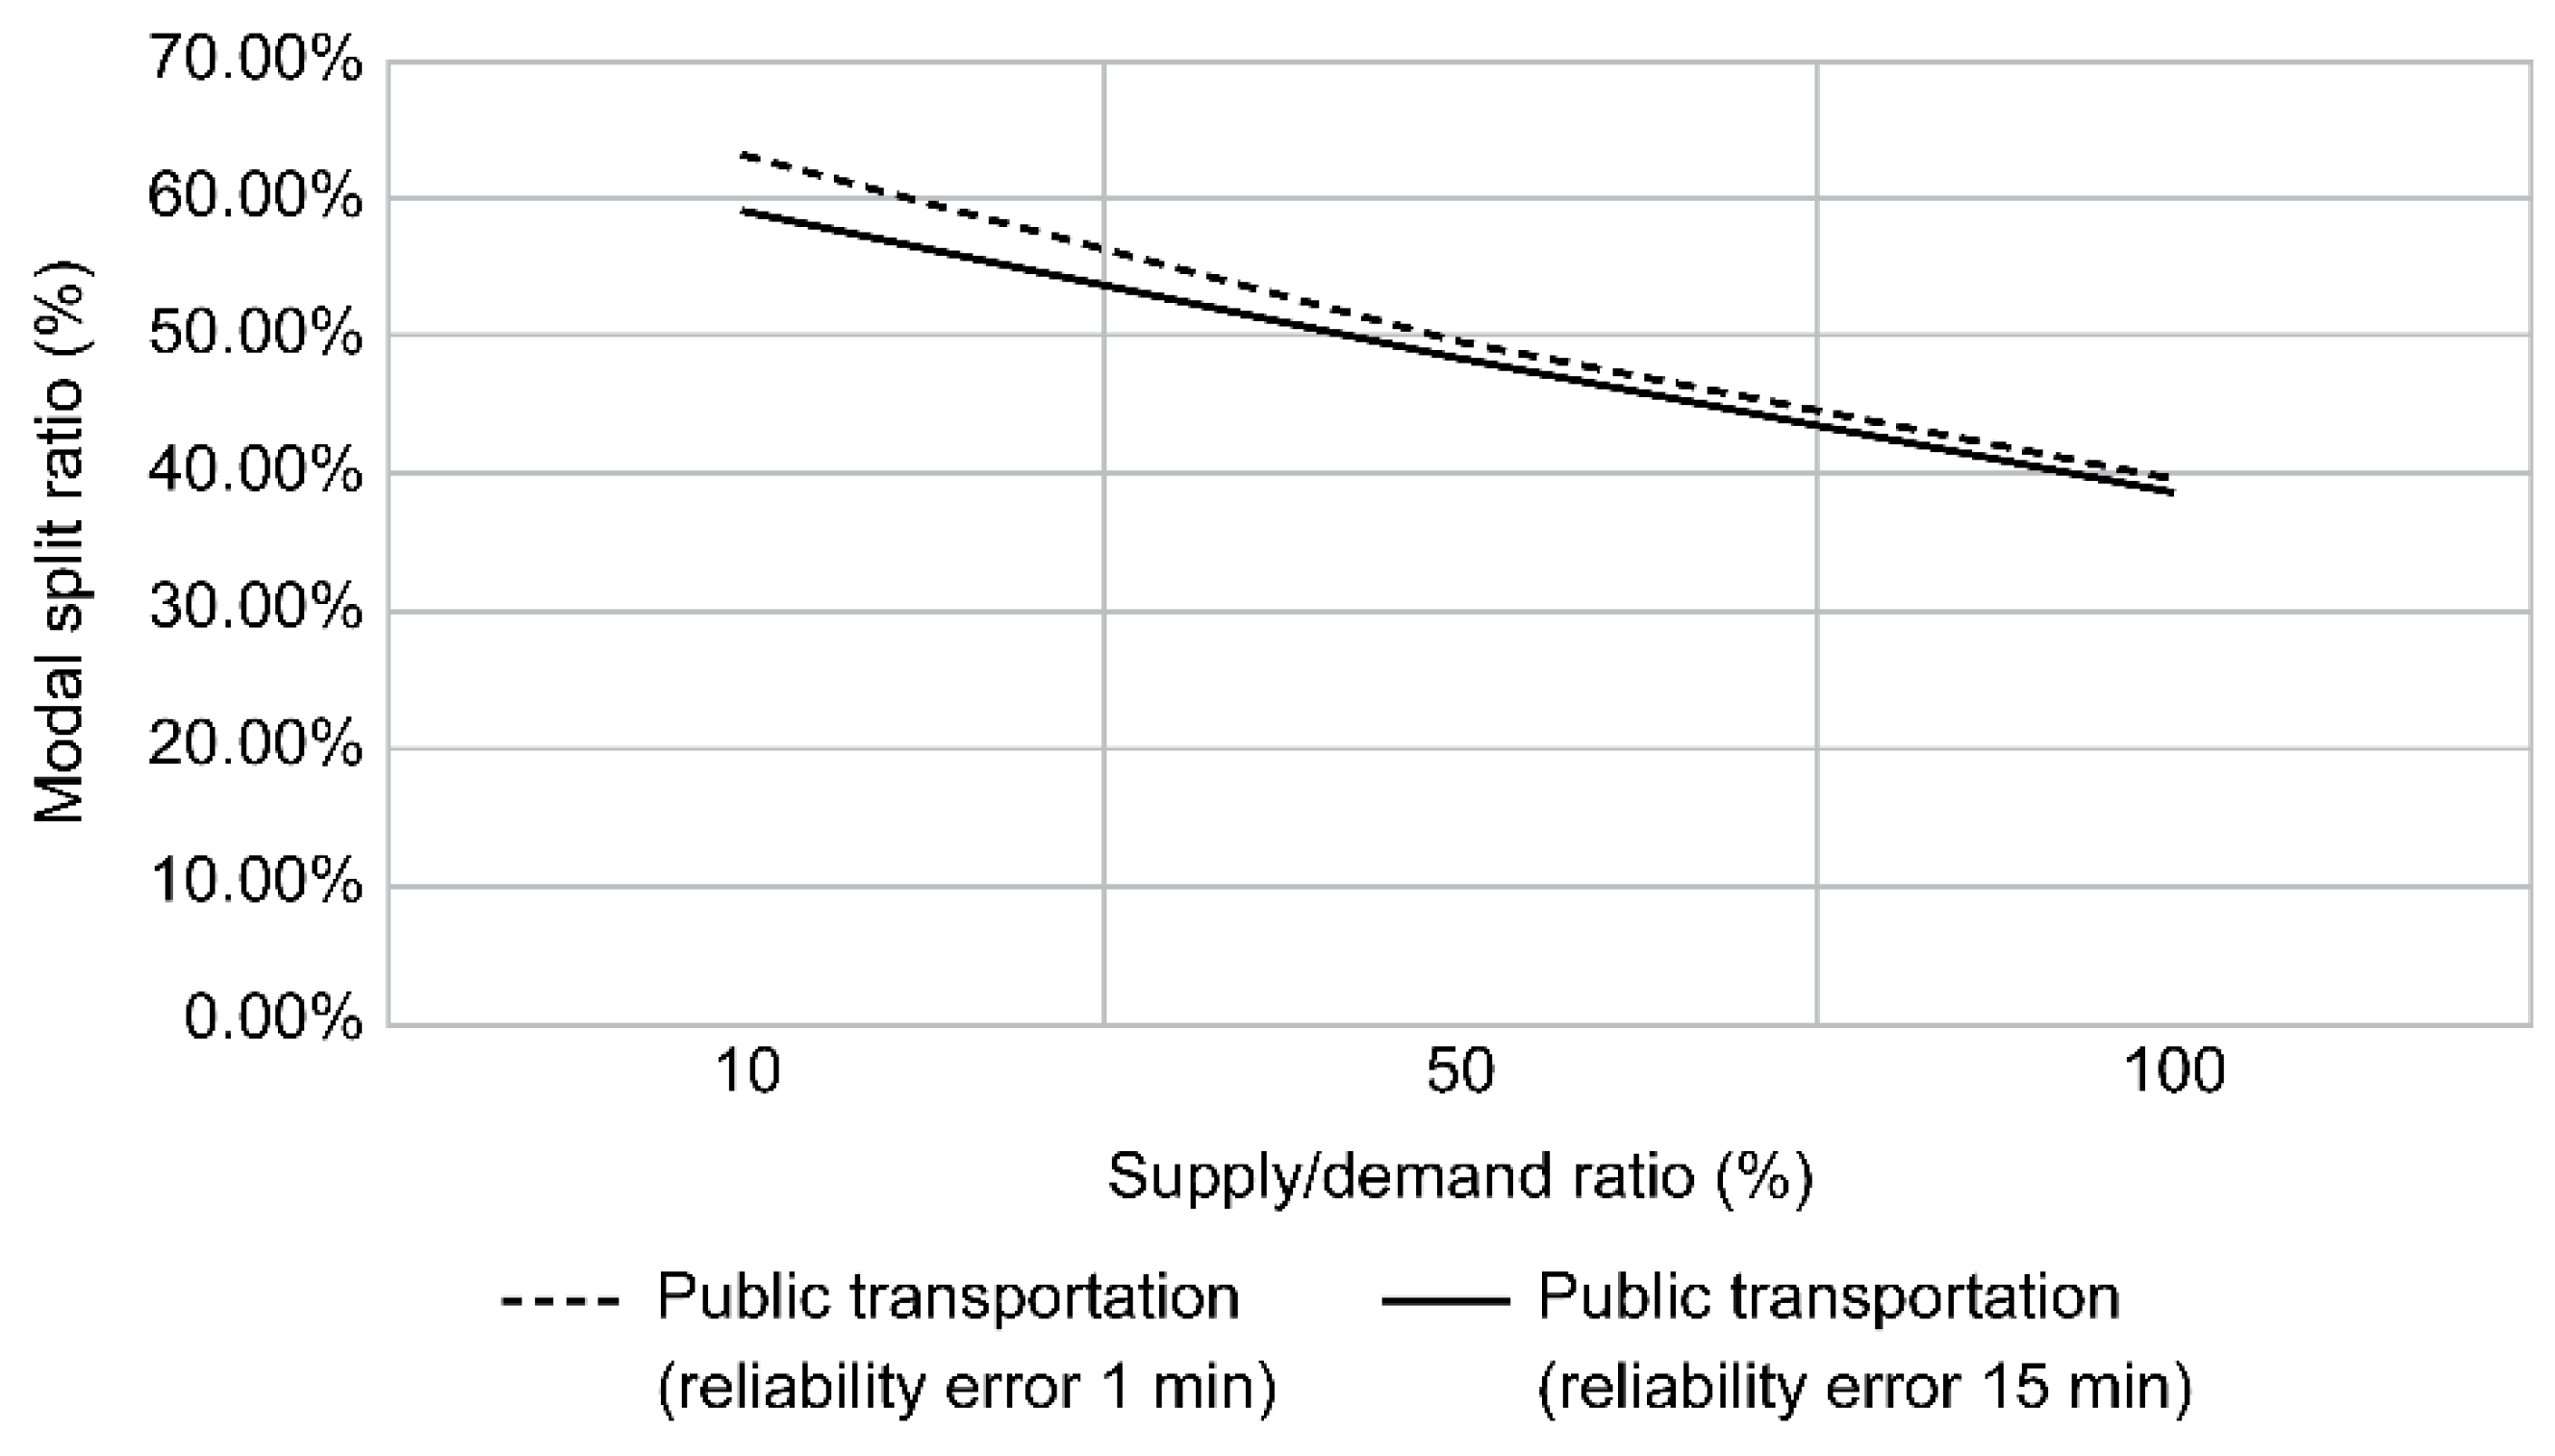
| Classification | Supply/Demand Ratio (%) | |||
|---|---|---|---|---|
| 10% | 50% | 100% | ||
| Type 1 city | Current | 63.14% | 63.14% | 63.14% |
| Reliability error 15 min | 59.14% | 48.20% | 38.68% | |
| Reliability error 1 min | 62.92% | 49.49% | 39.43% | |
| Type 2 city | Current | 26.45% | 26.45% | 26.45% |
| Reliability error 15 min | 26.45% | 26.51% | 26.49% | |
| Reliability error 1 min | 31.73% | 30.30% | 28.24% | |
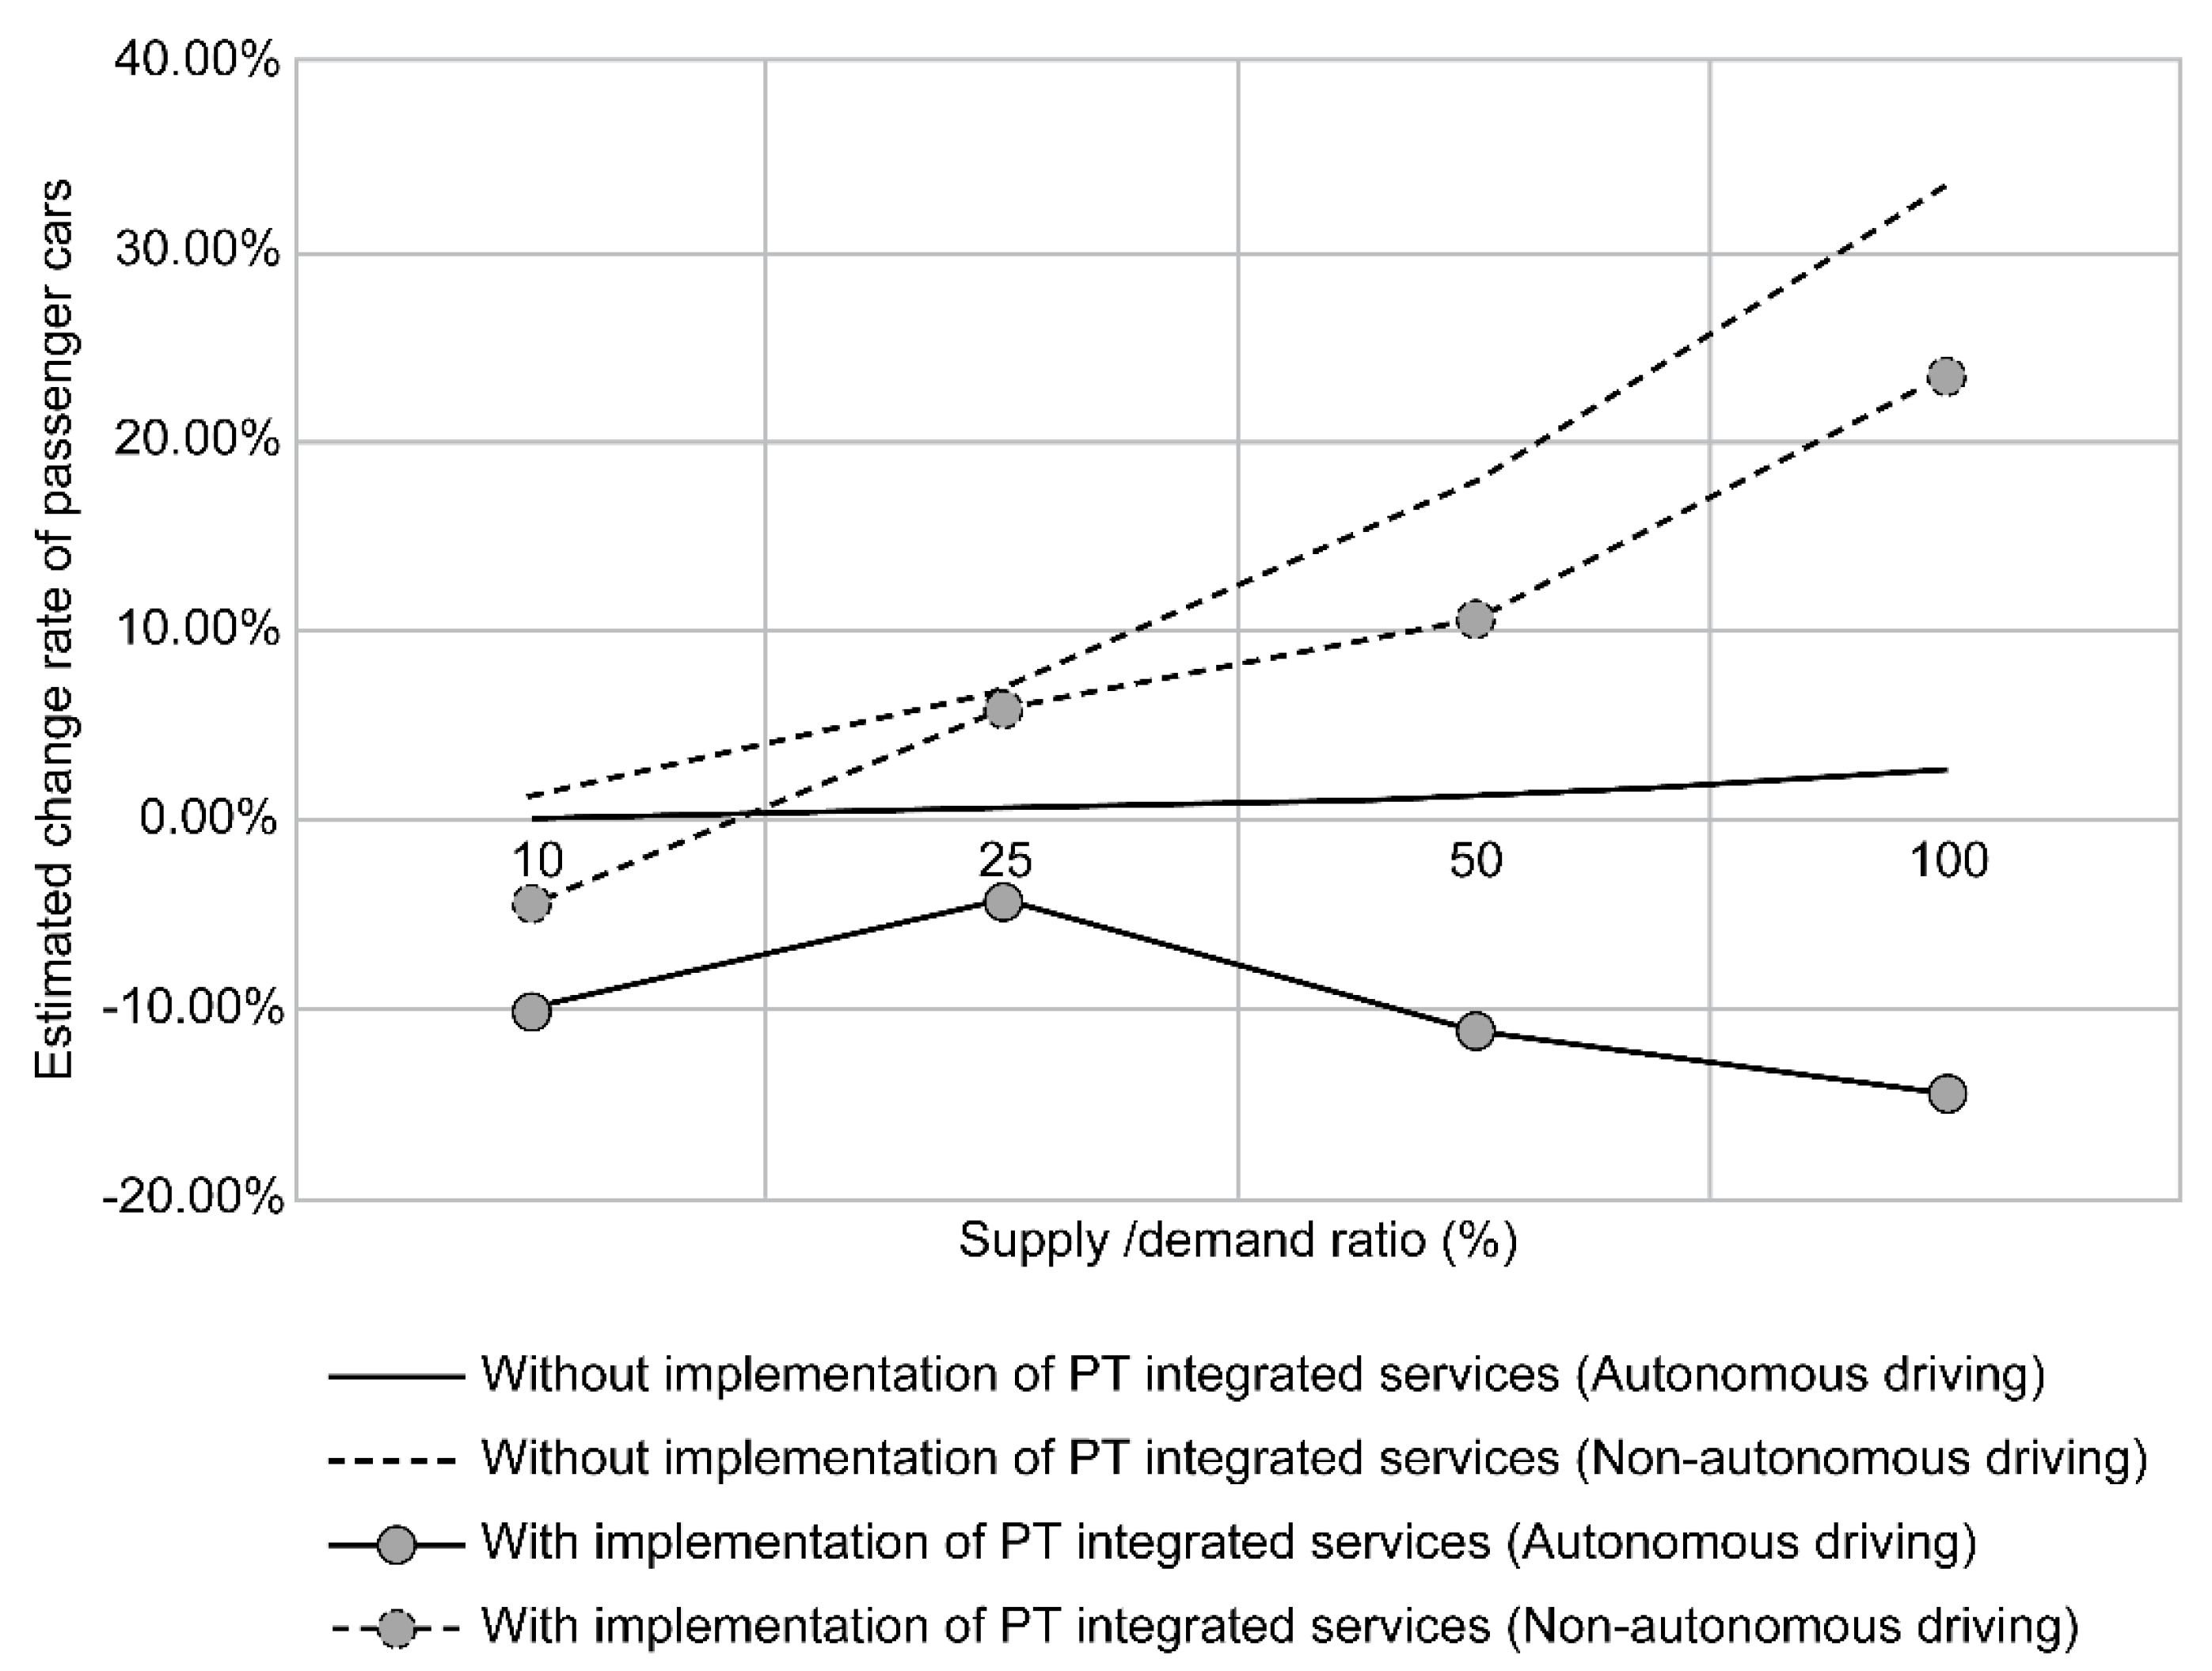
| Classification | Supply/Demand Ratio (%p) | |||||
|---|---|---|---|---|---|---|
| 10% | 25% | 50% | 100% | |||
| Type 1 city | Non-implementation of PT-integrated services | Non-autonomous driving | 1.26%p | 6.95%p | 17.68%p | 33.46%p |
| Autonomous driving | 0.10%p | 0.54%p | 1.37%p | 2.60%p | ||
| Implementation of PT-integrated services | Non-autonomous driving | −4.31%p | 5.89%p | 10.60%p | 23.44%p | |
| Autonomous driving | −10.00%p | −4.19%p | −11.16%p | −14.42%p | ||
| Type 2 city | Non-implementation of PT-integrated services | Non-autonomous driving | 0.00%p | 0.00%p | 0.00%p | 0.00%p |
| Autonomous driving | −2.00%p | −11.00%p | −28.00%p | −53.00%p | ||
| Implementation of PT-integrated services | Non-autonomous driving | −14.19%p | −3.61%p | −5.76%p | −2.60%p | |
| Autonomous driving | −25.19%p | −27.17%p | −37.76%p | −54.60%p | ||
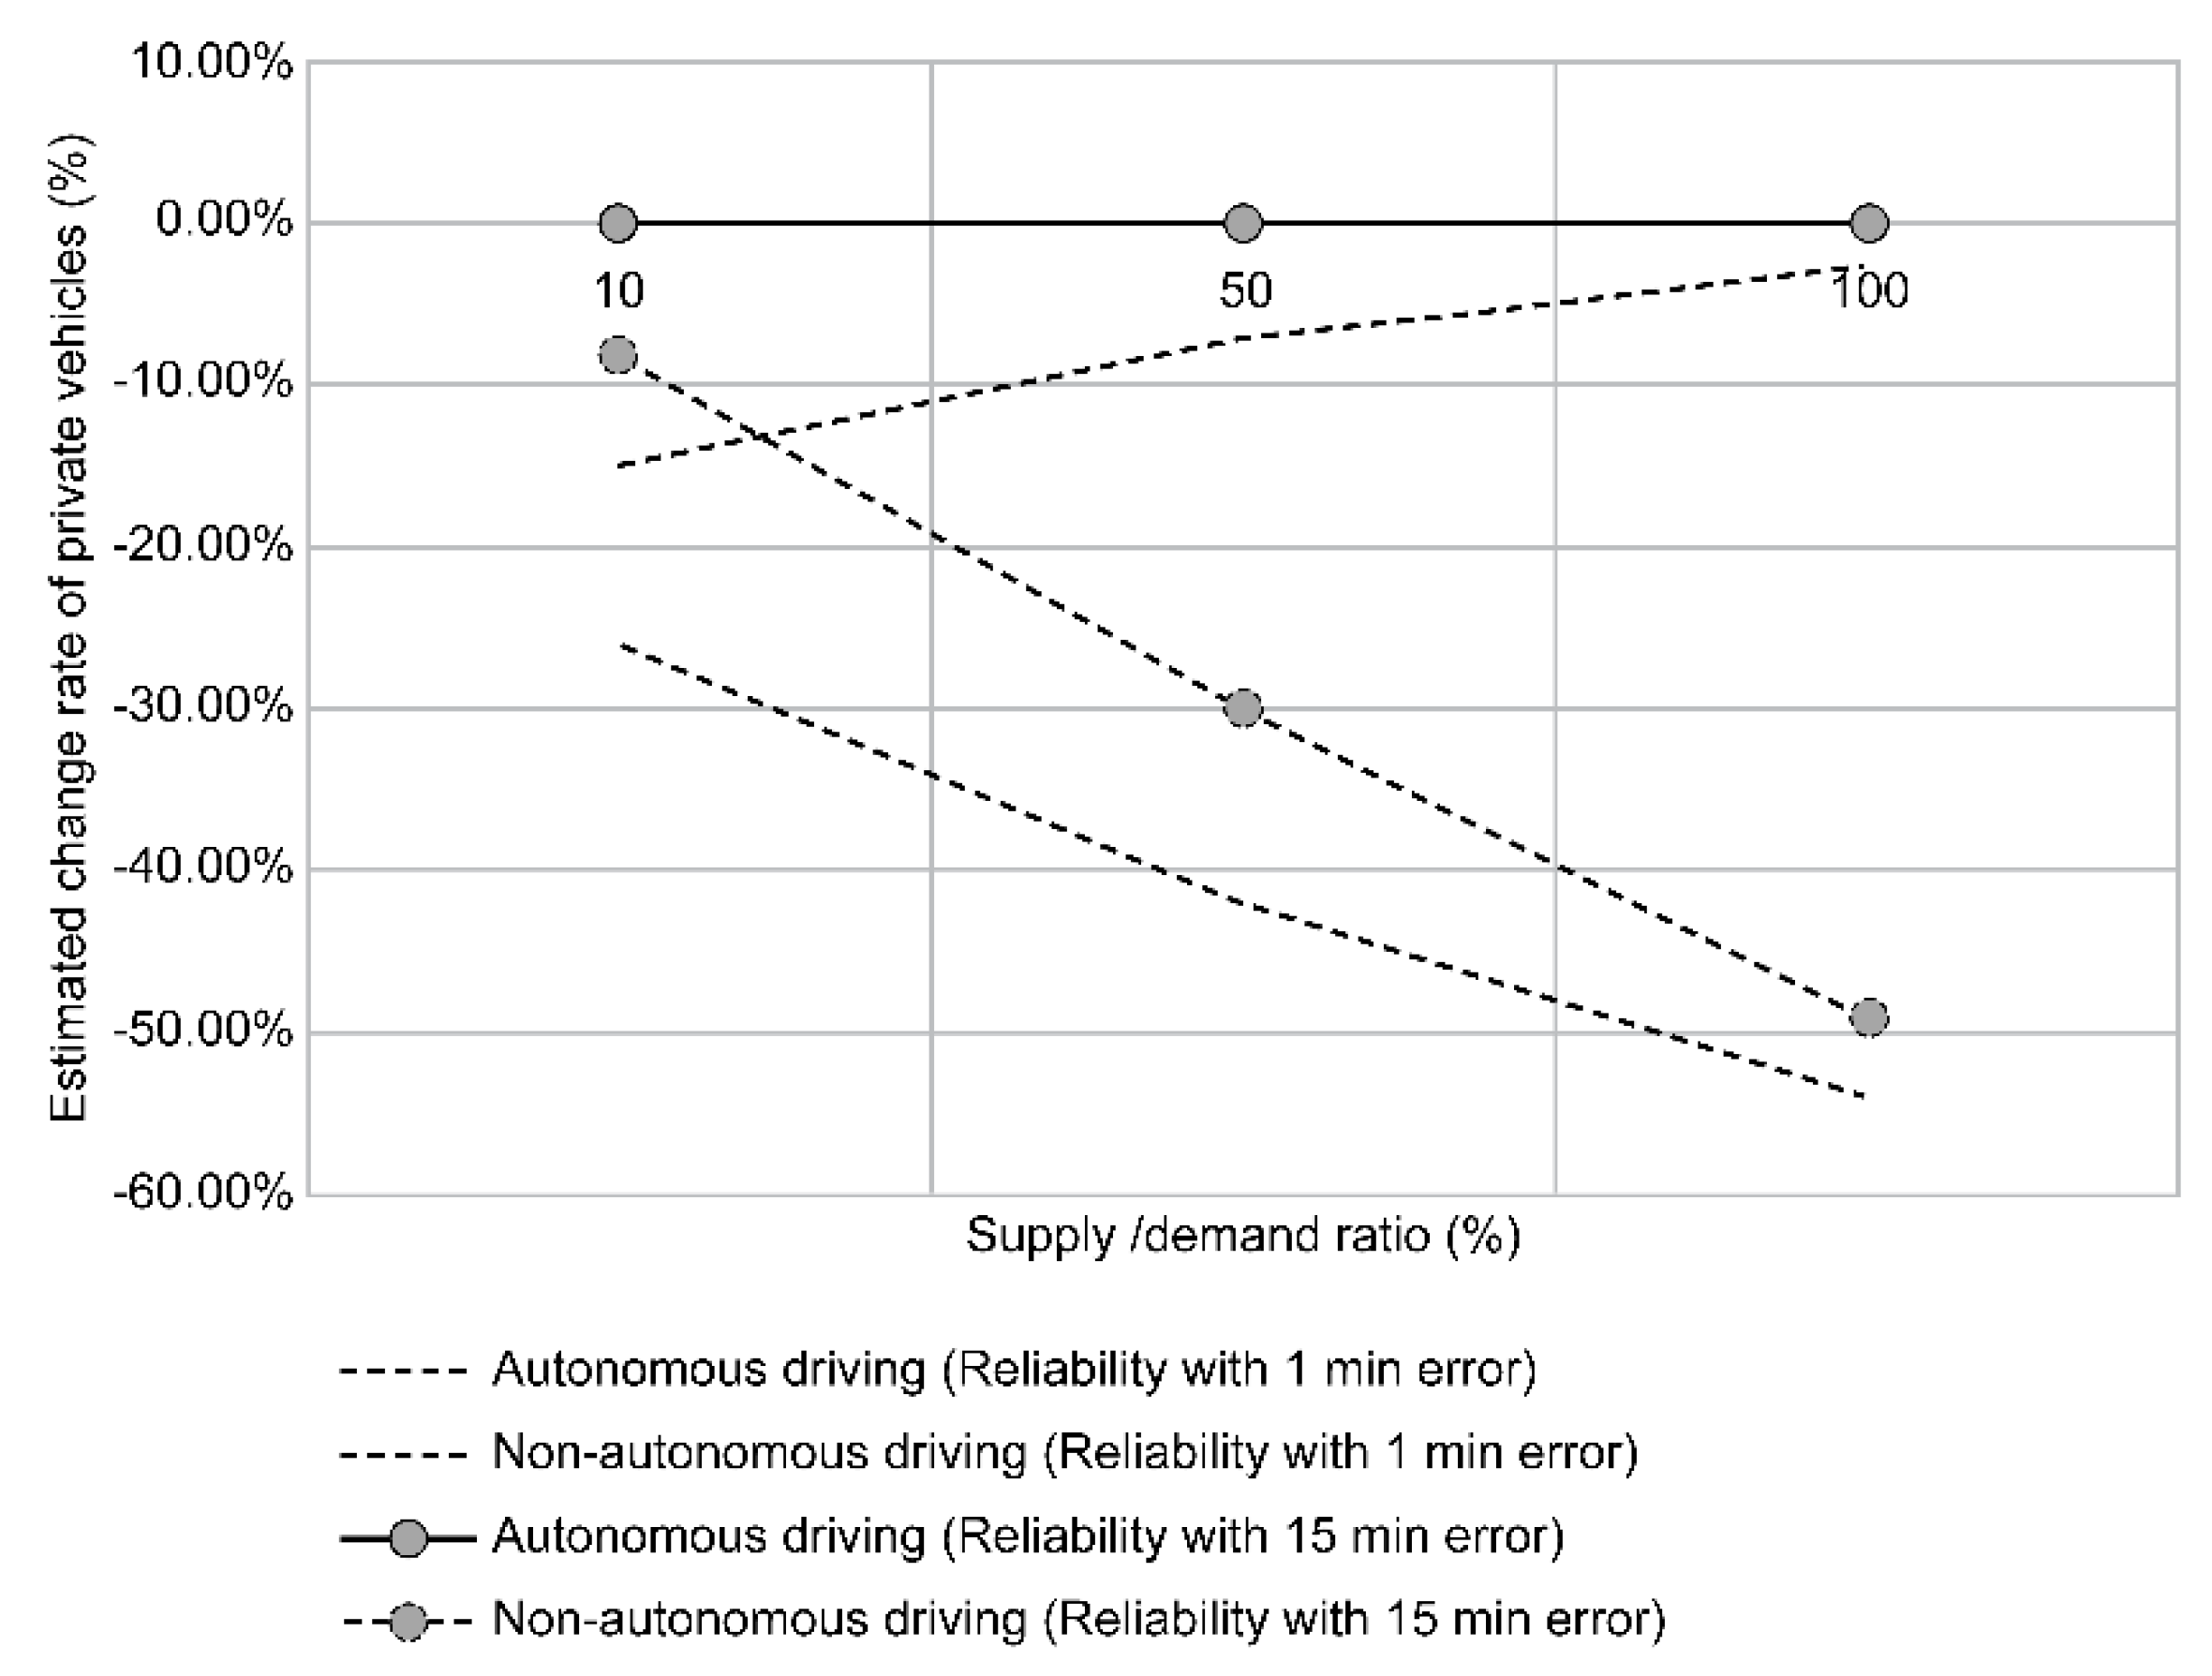
| Classification | Supply/Demand Ratio (%p) | ||||
|---|---|---|---|---|---|
| 10% | 50% | 100% | |||
| Type 1 city | Non-implementation of PT-integrated services | Reliability with 15 min error | 4.00%p | 14.94%p | 24.46%p |
| Reliability with 1 min error | −4.72%p | 10.95%p | 22.74%p | ||
| Implementation of PT-integrated services | Reliability with 15 min error | −2.00%p | −7.53%p | −12.27%p | |
| Reliability with 1 min error | −10.26%p | −12.54%p | −14.27%p | ||
| Type 2 city | Non-implementation of PT-integrated services | Reliability with 15 min error | 0.00%p | −0.06%p | −0.04%p |
| Reliability with 1 min error | −14.96%p | −7.00%p | −2.81%p | ||
| Implementation of PT-integrated services | Reliability with 15 min error | −8.00%p | −30.06%p | −49.04%p | |
| Reliability with 1 min error | −25.96%p | −42.00%p | −53.81%p | ||
Publisher’s Note: MDPI stays neutral with regard to jurisdictional claims in published maps and institutional affiliations. |
© 2021 by the authors. Licensee MDPI, Basel, Switzerland. This article is an open access article distributed under the terms and conditions of the Creative Commons Attribution (CC BY) license (https://creativecommons.org/licenses/by/4.0/).
Share and Cite
Tak, S.; Woo, S.; Park, S.; Kim, S. The City-Wide Impacts of the Interactions between Shared Autonomous Vehicle-Based Mobility Services and the Public Transportation System. Sustainability 2021, 13, 6725. https://doi.org/10.3390/su13126725
Tak S, Woo S, Park S, Kim S. The City-Wide Impacts of the Interactions between Shared Autonomous Vehicle-Based Mobility Services and the Public Transportation System. Sustainability. 2021; 13(12):6725. https://doi.org/10.3390/su13126725
Chicago/Turabian StyleTak, Sehyun, Soomin Woo, Sungjin Park, and Sunghoon Kim. 2021. "The City-Wide Impacts of the Interactions between Shared Autonomous Vehicle-Based Mobility Services and the Public Transportation System" Sustainability 13, no. 12: 6725. https://doi.org/10.3390/su13126725
APA StyleTak, S., Woo, S., Park, S., & Kim, S. (2021). The City-Wide Impacts of the Interactions between Shared Autonomous Vehicle-Based Mobility Services and the Public Transportation System. Sustainability, 13(12), 6725. https://doi.org/10.3390/su13126725