1. Introduction
With social development and progress, science and technology have increasingly become a decisive force for economic growth, and sci-tech talent, as carriers of scientific and technological innovation, have played an increasingly prominent role in economic development [
1,
2]. Tryggvi quantified the impact of talent cultivation, capital, working hours, and TFP on economic growth by using relevant data from five Nordic countries and concluded that 12–33% of the economic growth came from the input in talent cultivation [
3]. At the same time, economic growth has become an important factor in the location choice of sci-tech talent [
4], as many scholars have found that sci-tech talent are more inclined to flow into high-grade cities with advanced economic development in location selection [
5,
6]. The topic has been the focus of extensive attention by many scholars at home and abroad, who have obtained relatively fruitful results.
More specifically, existing studies mainly focus on the agglomeration of regional sci-tech talent and its role in knowledge spillover or innovation promotion, which can promote regional economic growth [
7,
8,
9,
10]. In addition, as a specific part of human capital, sci-tach talent is effective with the increasing of human capital, and more varied quantitative measures are aimed at the direct influence of human capital on regional economic development. Nelson et al. believe that human capital accelerates the development of national frontier science and technology, thus improving the total factor productivity and economic growth of the country [
11]. Feng and Li discussed the influence of human capital structure on economic growth based on the theoretical paradigm of new structural economics, and the results showed that middle- and high-level human capital had a better promoting effect on economic development [
12]. In addition, many scholars believe that sci-tech talent has a significant driving effect on regional economic growth in China, where there is a long-term and effective interaction between both [
13,
14,
15]. For example, Wang empirically analysed the interaction effect and lag effect among talent agglomeration, scientific and technological innovation, and economic growth in 31 provinces of China from 1998 to 2017 and found that an increase in sci-tech talent could drive economic growth, and the effect on economic growth was gradually enhanced [
16]. The OLS, SLM, and SEM methods were adopted by Xu to test the relationship between innovative human capital and provincial economy, and the results showed that human capital played an important role in economic growth in all Chinese provinces [
17]. On the other hand, the development of a regional economy can often effectively drive the inflow and training of sci-tech talent [
18], and as the basic guarantee of local quality, the regional economy has a direct impact on facilities, income, etc., thus determining the distribution of talent [
19,
20]. Factors such as the regional economic gap lead to the distribution characteristics of high-level talent flow in China, which shows the pattern of net inflow from the east and net outflow from the northeast and midwest [
21]. However, few studies have conducted empirical analyses on the influence mechanism or formation effect between sci-tech talent and economic growth, which are related to the perspective of many factors, including sci-tech talent or economic growth [
22,
23].
Obviously, it can be fully verified from the existing research conclusions whether a close promoting relationship exists between sci-tech talent and economic growth, which is more significant in the region of relatively high scientific and technological innovation and economic development. In addition, the Pan-Yangtze River Delta is among the regions with the most dynamic economic development, the highest degree of openness, and the strongest innovation capacity in China. The Pan-Yangtze River Delta has effectively driven economic growth through the agglomeration of scientific and technological human capital. Its high level of economic development has attracted many research institutions and positions and much sci-tech talent [
24,
25]. The sci-tech talent and economic growth of all provinces and cities in the Pan-Yangtze River Delta showed an evolutionary trend of annual growth from 1998 to 2019, which is supported by the existing conclusions (
Figure 1). It is typical and representative to choose this region as the research object, but problems remain such as whether there is ‘spurious regression’ between both, which few scholars have analysed empirically.
Therefore, this study adopts spatial coupling analysis, cointegration, and the Granger causality test model to quantitatively measure whether a mutually promoting relationship exists between sci-tech talent and economic growth in the provinces and cities of the Pan-Yangtze River Delta. The full-time equivalent of research and development (R&D) personnel per 100,000 laborers (PFEP) and per capita gross domestic product (PGDP) of the Pan-Yangtze River Delta are taken in this study as the research objects to explore the causal nexus between both, thus further reflecting the interplay between sci-tech talent and economic growth. On this basis, this study tries to solve the following scientific problems. Does sci-tech talent have a positive effect on economic growth in different regions? Is there a corresponding effect on the reverse?
Through an in-depth study of the causal mechanism between sci-tech talent and economic growth, as well as their spatial differences, and in light of describing the interplay between both factors in the Pan-Yangtze River Delta, this paper reflects and verifies the existence of a direct positive relationship. The structure is as follows.
Section 2 provides a literature review on the causal mechanism between sci-tech talent and economic growth.
Section 3 briefly introduces the data and methodology used in this study.
Section 4 analyses the spatial coupling, while
Section 5 and
Section 6 focus on the empirical analysis of the causal mechanism.
Section 7 discusses the conclusions and provides implications for further research.
2. Literature Review
Sci-tech talent is the first resource for economic growth and the development of a country or region. For example, Silicon Valley, the North Carolina Triangle Science Park, and many other advanced industrial parks in the United States have attracted talent globally, making important contributions to American economic development [
26,
27]. A number of ‘technology cities’ with intensive high-tech research and manufacturing were built around the Japanese islands, gathering much sci-tech talent to achieve rapid economic growth [
28]. In China, the strategy of reinvigorating the country through human resource development has long been an important link in the national strategic system, as ‘The Outline of the National Medium- and Long-Term Talent Development Plan (2010–2020)’ clearly points out that sci-tech talent is the primary resource for Chinese economic and social development and one of the keys to implementing China’s reform and opening up to the outside world [
29].
The importance that countries attach to sci-tech talent obviously stems from its role in regional development. Additionally, the specific interaction between sci-tech talent and economic growth presents a unidirectional or bidirectional activity relationship, rooted in the influence of one part on another. On the one hand, an increase in sci-tech talent has a positive effect on economic growth [
30,
31,
32]. For example, Lucas emphasised that the accumulation of human capital is the main driving force for economic growth and is a key factor in promoting industrial development [
33]. Uzawa found that the technology of the education sector would affect the linear improvement of technology in the production sector with the accumulation of human capital, thus achieving balanced economic growth in both sectors [
34]. As the intermediary of technological innovation, sci-tech talent can produce indirect economic growth effect [
11], and as a direct input element, sci-tech talent realises direct economic growth effect through a spillover effect at the same time [
35]. Specifically, the growth of sci-tech talent brings the innovation, acquisition, and transformation of knowledge and technology in high-tech industries, promoting the formation of new growth points [
36]. Additionally, with the expansion of scientific and technological talent, it can also collaborate on research and development effectively to improve productivity levels, driving the growth of regional economic performance [
37]. On the other hand, economic growth has a positive promoting effect on the increase in sci-tech talent [
4]. Economic interests are the main inducement to promote talent aggregation, and the level of economic development determines the cohesion of talent in the region [
38]. Romer believes that six major factors, including economies of scale, national economy, and personal disposable income, are the main drivers of talent agglomeration [
39]. Shapiro’s study attributes the growth of human capital to improved urban productivity and quality of life [
40]. Regional economic growth provides the possibility of higher-level research platforms, suitable environment, sufficient scientific research funds, and high salaries, promoting the attraction of sci-tech talent [
41,
42].
Most studies have confirmed the existence of a relationship between sci-tech talent and economic growth under certain conditions [
17,
43]. However, further empirical tests are lacking in the causal nexus between both and whether differences exist in the effects between different objects or regions in the case of a positive causal relationship. There is a total of 4.38 million R&D personnel in China, which places China first in the world, while the number of R&D personnel represents 56.5 person-years per 10,000 people employed, which is still lower than developed countries. In addition, insufficient innovation and entrepreneurship abilities are problems, as are the unreasonable structure and layout of talents, leading to a reduced contribution to economic growth. Therefore, a more detailed empirical study is needed on the relationship between sci-tech talent and economic growth.
In terms of regional differences, different regional scales and influences lead to regional competitiveness and many other aspects of difference, including the ability of interaction between sci-tech talent and economic growth [
44,
45]. Furthermore, as the gap of science and technology is often regarded as the main reason for regional economic differences [
46], factors such as the ability of interaction can both create and enhance regional disparities [
47], consistent with the theory of circulatory accumulation. In addition, Mamuneas analysed the output elasticity of factors and the social rate of return on investment for 51 countries and found that there is almost no promoting effect on economic development with low stock accumulation of sci-tech human capital, while it can create balanced and stable investment returns and effectively promote economic development with a higher stock accumulation of sci-tech human capital [
48]. Based on this, sci-tech talent is increasingly concentrated in national and regional centres or metropolitan areas [
49], creating the distributional differences and further leading to the Matthew effect that improves the development level of high-level areas tendentiously in the overall function [
50]. However, at the same time, the cultivation and flow of sci-tech talent plays an important role in improving the interaction between sci-tech talent and economic growth in each region, narrowing the regional differences and promoting balanced development [
51,
52], which is more evident within developed metropolitan areas [
53]. Under the influence of market mechanisms, policy guidance, and cultural guidance, the region tends to codevelop, promoting the balanced allocation of regional elements which further promotes the inter-regional flow of sci-tech talent, creating a new positive cycle and providing impetus for further development [
33,
54]. However, based on the same characteristics of spatial dependence, the effect between regions attenuates with the increase in distance [
55].
More specifically, the regions can be roughly divided into developed regions and undeveloped regions, which also differ in the interaction between sci-tech talent and economic growth due to differences of development degree.
From the perspective of developed regions, the interaction between sci-tech talent and economic growth takes on more complex forms. It is generally believed that there is a bidirectional effect in developed regions [
39]. For example, in a study of the relationship between the European creative industry and regional economy, the growth of creative workforces, as the direct carrier of the creative industry, plays a significant role in the regional economy, which can explain 60% of the difference in PGDP [
56], while regions with high-level economic development have higher opportunities to attract creative workforces [
57]. In addition, Francis and Chris studied the relationship between human capital and economic growth in the United States using the Granger causality test model and found that the accumulation of human capital promotes economic growth, while economic growth also provides favourable conditions for the formation of human capital and promotes its accumulation [
58]. However, there are also cases that only have unidirectional effects in developed regions [
31,
32]. As sci-tech talent has a unidirectional effect on economic growth, it is closely linked to the development of high-tech industries, which makes sci-tech talent play the role of driving the development of emerging industries and to further drive economic growth. At the same time, the limited demand for new technical talent cannot further drive the agglomeration of sci-tech talent, which is more significant in regions with the rise of single private technology companies [
59]. In addition, it is more obvious that only economic growth has a unidirectional effect on sci-tech talent. On the one hand, economic growth provides important guarantees for a series of needs, such as research platforms, funding, and salaries, which is significantly attractive to sci-tech talent [
49]. On the other hand, economic growth is more influenced by the huge market size and trade scale in developed regions, diluting the role of sci-tech talent significantly [
60]. Additionally, with the advancement and transformation of regional economies, problems such as structural shortages are further highlighted, which cannot meet the innovation needs of the new economy [
61].
From the perspective of the undeveloped regions, the interaction between sci-tech talent and economic growth tends to a weak trend, even nonexistent. For example, Hansen believes that the relationship between human capital returns and regional economic growth is affected by the size of R&D investment, resulting in a double-threshold effect of R&D investment according to threshold theory [
62]. In addition, Kancs pointed out that only when the accumulation of technical knowledge reaches a specific critical value can sci-tech talent promote economic growth [
63]. Due to the problems of insufficient accumulation, it is difficult for undeveloped regions to play the role of sci-tech talent in economic growth, and inadequate regional economic development makes it difficult to attract sci-tech talent, which even causes brain drain [
21]. However, there can still be a bidirectional effect between sci-tech talent and economic growth, especially in an emerging developmental regions with a good development trend. Song constructed a model of ‘bidirectional interaction’ between scientific and technological innovation talent and economic growth; the long-term cycle of the two could rely on scientific and technological progress and investment in science and education [
64]. Dai tested the Granger causality on Jiangxi province in central China and found that the human capital accumulation causes industrial structure upgrading, and vice versa [
65]. Although still small in aggregate, these emerging regions can achieve rapid growth in the long run, with a long-term balance between sci-tech talent and economic growth, which is also influenced by external and opening factors, such as industrial transfer, higher level policy support, etc. [
66].
In terms of the development status of various regions in China, the positive association between sci-tech talent and economic growth is increasingly significant, especially in terms of the promotion of the economy [
17]. However, although the increase in scientific and technological human capital is accompanied by the process of regional economic growth and also act as an economic driver, there are great regional differences in scientific and technological human capital, and their influence on regional economies are also different. Conversely, the effect of economic growth on scientific and technological talent is the same. On this basis, according to the data of PFEP and PGDP, this study mainly adopts the Granger causality test model to analyse the causal nexus and regional differences between sci-tech talent and economic growth of provinces and cities in the Pan-Yangtze River Delta and the correlation mechanism between them. Subsequently, we propose the following hypothesis.
Hypothesis 1. There is a positive relationship between sci-tech talent and economic growth in the Pan-Yangtze River Delta, and there is a unidirectional effect in developed regions and a bidirectional effect in undeveloped regions.
4. Spatial Coupling Analysis of Centre of Gravity
4.1. Characteristics of the Migration Trajectory of Sci-Tech Talent Centre of Gravity and Economic Centre of Gravity
Using the ArcGIS spatial analysis method, the sci-tech talent centre of gravity and economic centre of gravity during the main years in the Pan-Yangtze River Delta are represented on the map to further connect and form the migration trajectory of two centres of gravity in the Pan-Yangtze River Delta (
Figure 3).
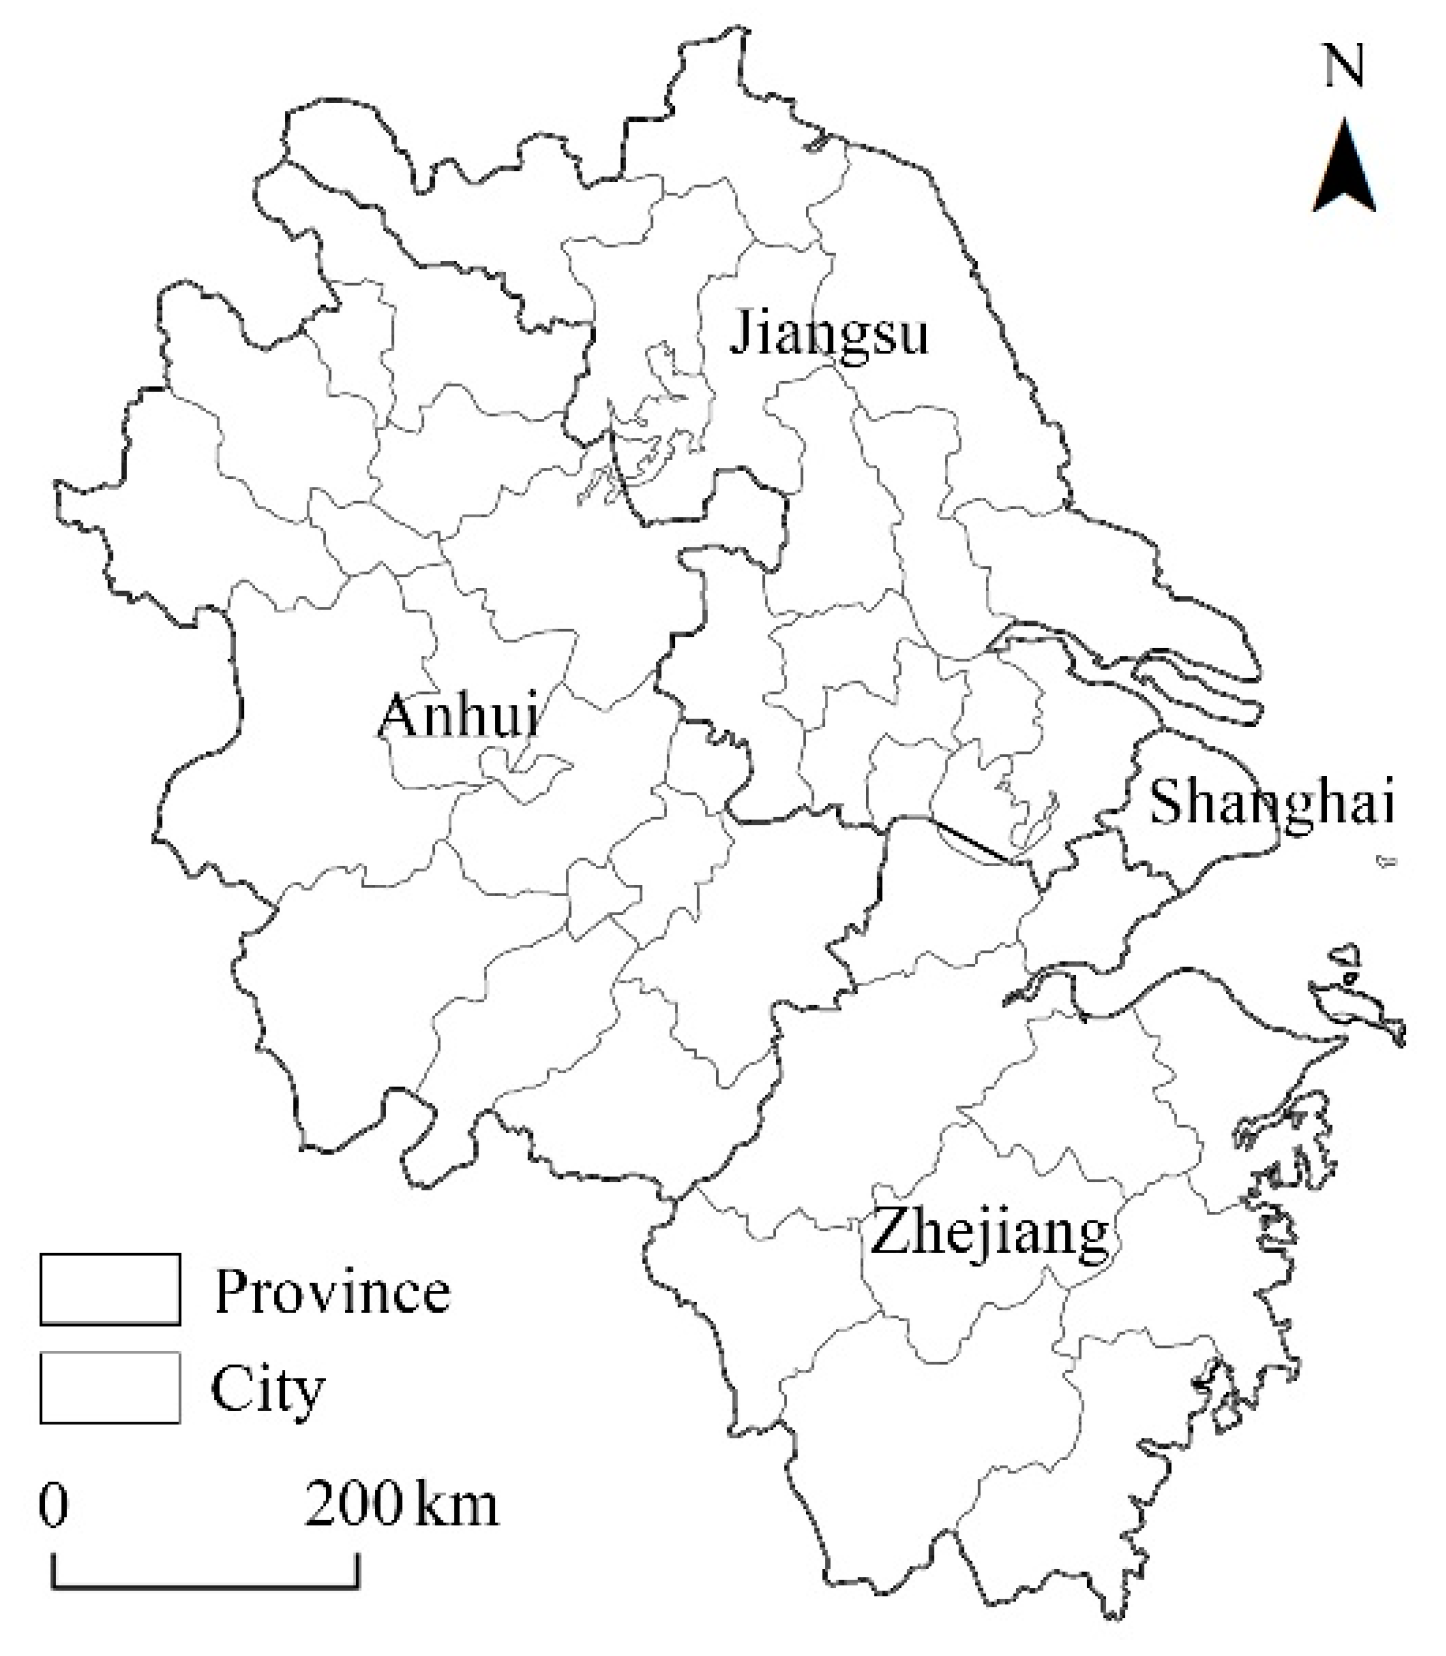
From a macroscopic point of view, all sci-tech talent centres of gravity and economic centres of gravity in the Pan-Yangtze River Delta are concentrated in Suzhou of Jiangsu; more specifically, the economic centres of gravity are all located in the Taihu Lake of Suzhou. Additionally, both of them are close to the borders of Shanghai, Jiangsu, Zhejiang, and Anhui, while the moving trajectories of the centres of gravity show as two parallel chains. This indicates that the geographical characteristics of their distribution are consistent with the overall characteristics of regional development. In addition, the sci-tech centre of gravity and economic centre of gravity of sci-tech talent show an obvious convergence, with the characteristics of westward movement, indicating that both the sci-tech talent and economic growth in the Pan-Yangtze River Delta region have a relatively good trend of balanced development. Although both centres of gravity moved a long distance to the west, they are still concentrated in the east, near Shanghai, indicating that the overall pattern of sci-tech talent and economic development remains relatively stable.
From the perspective of a smaller spatial scale, there are some differences in the migration trajectory of the centre of gravity and economic centre of gravity in the Pan-Yangtze River Delta. On the one hand, the migration trajectory of the sci-tech talent centre of gravity proceeds from northeast to southwest, then to northwest, and finally to southwest. The migration to the southwest is more prominent, while the distance to the west is longer than that to the south. In addition, the migration trajectory of the sci-tech talent centre of gravity is significant enough to be an ‘N’ shape with a long migration distance, indicating that the sci-tech talent in each region changes more significantly. Moreover, the westward migration was the most significant during 1998–2015, indicating the rapid growth of sci-tech talent in Anhui, compared with other provinces. The southward migration was the most significant during 1998–2005 and 2015−2019, mainly because the sci-tech talent in Zhejiang grew fast in the early stage, while the overall base of sci-tech talent was small in the Pan-Yangtze River Delta. Meanwhile, the demand for the development of the science and technology industry has driven the rapid growth of sci-tech talent in recent years. On the other hand, the migration trajectory of the economic centre of gravity proceeds from northeast to southwest, then from southeast to northwest, which is straighter than the migration trajectory of the sci-tech talent centre of gravity at the same time, indicating that the change of economic growth is more consistent and maintains a relatively stable situation for a long time. To be specific, there was only a small trend of the southward migration from 1998 to 2005, mainly related to the fast development of private economies in Zhejiang. Additionally, the migration to the northwest is more prominent from 2005 to 2019, indicating the rapid growth of economy of western regions, with the obvious trend of migration of the economic centre of gravity to Anhui. However, the distance of migration trajectories has decreased significantly in recent years, indicating that the equilibrium development trend has slowed down. In addition, there was a more coordinated development between sci-tech talent and economic growth in Anhui, according to the relationship between the migration trajectory of the sci-tech talent centre of gravity and the economic centre of gravity from 2005 to 2015.
4.2. Spatial Coupling Characteristics between Sci-Tech Talent Centre of Gravity and Economic Centre of Gravity
Based on the spatial analysis using ArcGIS, the spatial coupling relationship between the centre of gravity of sci-tech talent and the economic centre of gravity in the Pan-Yangtze River Delta was analysed through spatial overlapping and variation consistency (
Figure 4).
The spatial overlap between the sci-tech talent centre of gravity and the economic centre of gravity in the Pan-Yangtze River Delta always followed a low fluctuation trend, as the distance between the two centres of gravity remained approximately 9–40 km, and the overall spatial distance showed a decreasing trend. The overall development of sci-tech talent and economic growth in the Pan-Yangtze River Delta tended towards balanced regional development, with better spatial coupling. Specifically, the spatial distance between the centre of gravity of sci-tech talent and the economic centre of gravity decreased significantly from 1998 to 2005, and from 2010 to 2015, reaching approximately 23.1 km and 9.6 km, and increasing the spatial overlap significantly, mainly for relatively increasing sci-tech talent in the western region as compared to other regions. Additionally, the spatial distance remained relatively stable from 2005 to 2015, showing that sci-tech talent and economic growth tended to balance in the Pan-Yangtze River Delta in this stage. However, the spatial distance between the centre of gravity and economic centre of gravity of sci-tech talent increased from 2015 to 2019, up to 15.1 km, which is less than that in 2010, indicating some emphasis on the different regions to develop sci-tech talent or economic growth, where the overall balance is still relatively maintained.
From the perspective of variation consistency, the spatial coupling of the sci-tech talent centre of gravity and the economic centre of gravity in the Pan-Yangtze River Delta presented a wavy trend of first moving in the same direction steadily, then moving away in the opposite direction, with its curve resembling the shape of the numeral ‘7’. This indicates good coordination consistency between sci-tech talent and economic growth in the Pan-Yangtze River Delta and that the changes between both were significantly related. Specifically, the highest variation consistency was 0.921 in 2015, followed by 2019 and 2005, which were 0.910 and 0.741, respectively. This shows that the changes in sci-tech talent and economic growth were consistent, but there were still minor differences in the directions of change in different regions. In addition, the change consistency in 2019 was negative, only up to −0.204, further explaining the differences in the directions in different regions, which were small, mainly due to the rapid growth of sci-tech talent in Zhejiang. However, in general, the developmental differences in different regions are formed under the conditions of relative balance, which is consistent with the spatial overlapping changes of different regions in the Pan-Yangtze River Delta.
5. Results of Granger Causality Test of Each Province and City in the Pan-Yangtze River Delta
5.1. Augmented Dickey–Fuller (ADF) Unit Root Test
The software EViews was adopted to test the stability of the time series of variables in each province and city through the augmented Dickey–Fuller (ADF) unit root test. The logarithms of the original data are taken, and LnY and LnX are used to represent the data of economic growth and sci-tech talent processed, while D and DD are used to represent the first-order and second-order differences, respectively. At a significance level of 1%, the sequences of LnY and LnX in each region all have unit roots, indicating that they are nonstationary sequences, which shows that the sequences of LnY and LnX in all regions are flat under the condition of second-order difference after the operation of the first-order and second-order differences. Cointegration and Granger causality analyses were carried out on the two variables in each region since all sequences were second-order flat (
Table 1).
5.2. Cointegration Test
The EG two-step method was adopted to test the cointegration relationship between two variables in each region. Specifically, EViews is adopted to obtain the cointegration equation and obtain the residual sequence
e to carry out the unit root test (
Table 2). At a significance level of 1%, the residual unit root test rejects the null hypothesis of the existence of unit roots; that is, the residual sequence of each region is stable, so there is a co-integration relationship between LnY and LnX in each region.
Based on the above results, the cointegration equations of each region were compared, and the fitting results of the cointegration equation between LnY and LnX in the Pan-Yangtze River Delta are all good, with the adjusted judgement coefficient
R2 of each region being especially high. Among all regions, Jiangsu had the highest (up to 0.990), and Shanghai had the lowest value (0.889) (
Table 3). The estimated LnX coefficient represents the elasticity of the effect from sci-tech talent to economic growth in the long-run equilibrium, with values of 2.119, 1.179, 0.859, and 1.375, respectively, which are all positive for Shanghai, Jiangsu, Zhejiang, and Anhui. Among them, Shanghai has the highest flexibility; with every 1% increase in the amount of sci-tech talent, the corresponding growth rate of the economic aggregate is 2.119%, indicating that potential sci-tech talent has the highest positive promoting effect on economic growth. In addition, Zhejiang has the lowest flexibility, where every 1% increase in the amount of sci-tech talent corresponds to a 0.859% increased growth rate in the economic aggregate, indicating that the potential positive promoting effect is the lowest.
5.3. Vector Autoregression (VAR) Model
To find the optimal lag, the result is estimated by the VAR model and provides the appropriate lag lengths of LR (Likelihood), FPE (Final Prediction Error), AIC (Akaike Information Criterion), SC (Schwarz Information Criterion), and HQ (Hannan–Quinn Information Criterion). Based on this, the estimated results are as follows (
Table 4): the optimal lags of the data of Shanghai, Jiangsu, Zhejiang, and Anhui are ‘1’, ‘3’, ‘3’, and ‘1’, respectively.
5.4. Granger Causality Test
The results of the cointegration test show a long-term equilibrium between economic growth and sci-tech talent in the Pan-Yangtze River Delta. Meanwhile, according to the estimation of the optimal lag coefficient of the VAR model, the lag time of each province and city is selected, respectively. On this basis, a Granger causality test was conducted to determine whether causality was formed between variables in each region. There are differences in the causal nexus between economic growth and sci-tech talent in different regions, including unidirectional and bidirectional effects (
Table 5). The specific results are as follows.
There is a unidirectional effect from economic growth to sci-tech talent in Shanghai. At the significance level of 5%, the null hypothesis of ‘LnY does not Granger cause LnX’ was rejected, and the probability reached 0.0072, indicating that LnY is the Granger cause of LnX. Compared with the PFEP, the growth of PGDP is more stable and faster, which drives the growth of PFEP. In other words, economic growth has effectively promoted the growth and agglomeration of sci-tech talent in Shanghai and attributed to the significant attraction of various aspects, such as development prospects, innovation environment, income level, and quality of life, engendered by the rapid economic growth in Shanghai. At the same time, at the significance level of 5%, the null hypothesis of ‘LnX does not Granger cause LnY’ was accepted, and the probability reached 0.7759, indicating that sci-tech talent does not play a positive role in economic growth in Shanghai. It is mainly because the growth rate of PFEP is slower than PGDP in Shanghai and presents a relatively tortuous change. Problems remain, such as the lack of high-level sci-tech talent, uncoordinated structure, and failure to make full use of the advantages of sci-tech talent to achieve economic potential, including in the fields of finance, trade, industry, and many others.
There is also a unidirectional effect from economic growth to sci-tech talent in Jiangsu. At the significance level of 5%, the null hypothesis of ‘LnY does not Granger cause LnX’ was rejected, and the probability reached 0.0005, indicating that economic growth has a significantly positive effect on sci-tech talent in Jiangsu. The main reason for this is the rapid and large-scale growth of PGDP in Jiangsu, the second-largest economic province in China, where the per capita GDP is only second to Beijing and Shanghai, and a high level of scientific and technological innovation also plays an important role in cultivating and attracting sci-tech talent. In addition, Jiangsu also benefits from industrial transfer and inflow of sci-tech talent from Shanghai as part of the regional integration in the Pan-Yangtze River Delta. On the other hand, at the significance level of 5%, the null hypothesis of ‘LnX does not Granger cause LnY’ was accepted, and the probability reached 0.8268, indicating that the amount of sci-tech talent does not play a positive role in economic growth in Jiangsu, given that the growth rate of PFEP dropped significantly after 2008 compared with overall growth of PGDP in Jiangsu. This was the case especially in recent years, except for 2019, which showed a flattening trend related to the lack of construction and the shortage of basic research talent and research funds.
There is also a unidirectional effect between economic growth and sci-tech talent in Zhejiang, whereby sci-tech talent Granger causes economic growth. At the significance level of 5%, the null hypothesis of ‘LnX does not Granger cause LnY’ was rejected, and the probability reached 0.0117, indicating that sci-tech talent has a significantly positive effect on economic growth. The main reason is that the growth trend of PFEP is significantly higher than the rate of PGDP in Zhejiang, especially after 2017. With regard to the innovation economy, the role of sci-tech talent in providing intellectual support for economic growth can be fully used, especially in the fields of information networks and such in Zhejiang. On the other hand, at the significance level of 5%, the null hypothesis ‘LnY does not Granger cause LnX’ was accepted, and the probability reached 0.2565, indicating that economic growth does not play a positive role in sci-tech talent, as the economy lacks the attraction that the effective agglomeration of talent provides in Zhejiang. The construction of sci-tech talent in Zhejiang has yet to be improved, as it has failed to fully absorb the inflow of sci-tech talent from Shanghai. In addition, there are disadvantages in such aspects as the training platform for sci-tech talent, which makes it fail to effectively translate economic growth into favourable factors for attracting sci-tech talent.
There is a bidirectional effect between economic growth and sci-tech talent in Anhui. At the significance level of 5%, the null hypotheses of ‘LnY does not Granger cause LnX’ and ‘LnX does not Granger cause LnY’ were both rejected, and the probability reached 0.0007 and 0.0028, respectively, indicating a good bilateral circulation between the amount of sci-tech talent and economic growth in Anhui, thus promoting the long-term common development of both. Although the proportion of PGDP and PFEP of Anhui is relatively small in the Pan-Yangtze River Delta, it presents a more balanced situation. On the one hand, the industries and talent are actively transferred from the developed regions to Anhui in the Pan-Yangtze River Delta, and the transfer of scientific and technological innovation are fully realised by relying on sci-tech talent, with the adjustment of industrial structure. On the other hand, policy support is fully used to gradually implement the construction plan of sci-tech talent in Anhui, to promote the agglomeration of sci-tech talent, and to increase investment, in the form of improving the construction of scientific research platforms and guaranteeing the innovation incentive mechanism with the help of economic development.
7. Conclusions and Discussion
From the perspective of geography, this study measures the relationship between sci-tech talent and economic growth in the Pan-Yangtze River Delta from 1998 to 2019, and the results reveal the following.
In the Pan-Yangtze River Delta region, the centre of gravity and economic centre of gravity are close to each other, showing as two parallel chains, which is consistent with the overall development characteristics of the region. The spatial overlap between the centre of gravity of sci-tech talent and the economic centre of gravity in the Pan-Yangtze River Delta showed a low fluctuation trend; from the perspective of variation consistency, the spatial coupling of the sci-tech talent centre of gravity and the economic centre of gravity in the Pan-Yangtze River Delta presented a wavy trend of first moving in the same direction steadily, then moving away in the opposite direction.
There is a long-term stable equilibrium relationship between sci-tech talent and economic growth, which also shows a better fitting cointegration equation in which the latter has an effect on the former. In the cointegration equation of sci-tech talent to economic growth, Shanghai has the greatest elasticity, and the coefficient of sci-tech talent is 2.119, showing the greatest potential positive effect on economic growth, while Zhejiang has the smallest elasticity with a coefficient of 0.859, showing the least potentially positive effect on economic growth.
There are differences in the causal nexus between sci-tech talent and economic growth, as the positive unidirectional or bidirectional effect between both varies according to regional characteristics. This is consistent with the conclusion of Song et al. that there is a mutual influence and promotion between Chinese sci-tech talent and economic growth in the long term, and economic growth plays a more significant role in promoting sci-tech talent in the short term [
64]. Among both, there is a unidirectional effect from economic growth to sci-tech talent in Shanghai and Jiangsu, a unidirectional effect from sci-tech talent to economic growth in Zhejiang, and a bidirectional effect between economic growth and sci-tech talent in Anhui. There is also a unidirectional effect from economic growth to sci-tech talent in the whole of the Pan-Yangtze River Delta. This shows a good causal interaction between sci-tech talent and economic growth in the long run and a good mutual promotion between sci-tech talent and economic growth in all provinces and cities in the Pan-Yangtze River Delta [
15], but the ability of bidirectional interaction still needs to be further improved [
78].
In general, there is a unidirectional or bidirectional effect between sci-tech talent and economic growth and a relatively good level of innovation and development in all provinces and cities in the Pan-Yangtze River Delta. Based on the differences among provinces and cities within the region, as well as the differences between the whole and parts of the region, diversified development measures should be taken. In particular, the role of sci-tech talent in economic development should be brought into full play to enhance the agglomeration effect and diffusion effect of the regions with significant advantages and to promote the overall competitiveness of the region. Therefore, the government should further optimise the orientation of regional economic development and give full play to the advantages of regional talent, promote the construction of talent, and improve talent attraction and training in the Pan-Yangtze River Delta. At the same time, the government should promote the coordinated development of higher education, scientific and technological innovation, and the internal circulation of the flow of sci-tech talent to realise the sharing and common progress of regional sci-tech talent and economic development in the Pan-Yangtze River Delta. On the existing regional structure with Shanghai as the core, including Jiangsu, Zhejiang, and Anhui provinces, the talent and economic highland need to be built to achieve regional development with distinctive features. Improving the positive feasibility of cyclic causality accumulation and further expanding the external contact of the region to increase the scope of interaction between sci-tech talent will realize the comprehensive promotion of open regional economic development.
Although this paper has made some progress on the causal nexus between sci-tech talent and economic growth, some research shortcomings remain. On the one hand, this paper only selects PGDP and PFEP data as the criteria of economic growth and sci-tech talent, which might reflect some empirical one-sidedness. However, only the provinces and cities in the Pan-Yangtze River Delta are discussed, and the more detailed differences between regions and the overall characteristics within the region need to be further analysed. In future research, more indicators can be combined, more diversified research methods can be used, and regions can be further divided to explore the causal nexus between sci-tech talent and economic growth in different cities.


