Abstract
Evaluating the impact of defects in buildings and ranking the most impactful ones enables construction companies to better choose which paths to take in light of continuous improvement activities to support more sustainable decisions regarding the design and operation of buildings. As a result, the risks of the different choices are more clearly identified while assessing all tangible and intangible aspects of residential building defects in a structured way. Although recent studies on managing construction defects in residential buildings have focused on monetary losses associated with maintenance activities based on the defect’s frequency and severity, these studies do not take into account the levels of customer satisfaction. To address this gap, this paper proposes a novel evaluation method of the impact of defects to support decision-making in managing defect occurrences in residential buildings. The goal is to rank the defects’ impact based on a combination of some critical aspects: frequency of occurrence, financial considerations on repairing such defects, the impact that these defects have on customer satisfaction, and the cost and complexity of preventing and minimizing these defect occurrences through continuous improvement activities. The method consists of a structured set of steps that use data from technical assistance departments and customer satisfaction surveys, where information about the users’ level of satisfaction and the occurrence of defects is available. In this paper, data obtained from a construction company were used to test and validate the proposed method. The method also examines the challenges and barriers associated with the technique and points out that difficulties in acquiring reliable data are a bottleneck for making conscious and sustainable decisions to address construciton defects. Moreover, the case study results highlight essential capabilities needed by companies to correctly assess the impact of defects, such as correctly logging data in a structured database and having skilled personnel to verify defects users might have complained about. The paper ends by proposing a set of guidelines to use the method and stressing that structured methods for decision-making are crucial to analyze construction defects in a structured way while also incorporating the user’s perspective. The proposed method is expected to improve sustainable managerial decisions where economic, environmental, social, and technical risks can be accounted for to enhance the quality of projects from the customer’s perspective. Such analysis can help optimize and prioritize the use of resources and minimize the economic impact of activities on the construction company.
1. Introduction
An industry is a dynamic agent that must adapt to changes. Changes in the environment, in the way of working, and in the demands and offers of products generated and consumed by the industry and the society at large can happen due to several factors. It is indispensable to continuously advise and analyze various productive aspects in order to keep the industry optimized, with a reasonable allocation of resources, and adapted to the context in which it operates [1]. With that in mind, continuous improvement actions contribute to making industries and societies more sustainable. Changes in people’s lifestyles, technologies, and economic scenarios result in changes that affect clients’ preferences for design solutions, requiring constant adaptation by companies [2].
The quality of a construction project is undoubtedly related to how the building conforms to specifications and how reliably the building functions [3]. In this sense, defect occurrences in buildings are strongly related to the quality of a construction project. Evaluating the impact of defects in buildings and ranking the most impactful ones enable construction companies to choose which paths to take within continuous improvement activities, where more sustainable decisions regarding design and operations can be made.
Although recent studies on managing construction defects in residential buildings have focused on financial losses associated with maintenance activities based on the defect’s frequency and severity [4,5,6], these studies do not take into account the levels of customer satisfaction with these projects [7]. In this sense, conformity and reliability are not the only aspects of a project’s quality since the customer evaluation of the building is essential to capture the project’s value. Therefore, by not considering customer requirements and satisfaction, aspects of how residents conduct their daily activities [5] and how an organization services customer’s requests [8] are not assessed. The capture and incorporation of customer requirements in residential projects is a long process that starts even before the project’s conceptual design phase; hence the perceived quality of the built environment results from a combination of aspects such as the design, products used, construction methods, quality of the workforce, post-occupancy customer service and their management, among others [9].
Understanding how the incidence of defects affects client satisfaction in residential projects supports continuous improvement processes from conception to the use phase [7,8,9]. This understanding can support a decision-making process that considers customer’s needs alongside financial metrics related to organizations’ financial health. Defects result in reworking activities, which are likely understated in terms of the costs and impacts they cause [10]. Moreover, a high level of customer satisfaction with a building project exemplifies one factor that leads customers to be loyal to a specific company [11], thus representing an important performance metric to evaluate a project. Therefore, understanding the relationship between defects and customer satisfaction is an essential concern for the construction industry as their connection impacts an organization’s business and their ability to have satisfied and returning customers. Accordingly, given this gap, defect occurrences must have their global impact on the construction company assessed, including features from the financial and technical spheres and from the customer’s perspective. Such analysis enables optimization and prioritization of resources and the minimization of economic impact to the construction company, consequently supporting the tenets of more sustainable and environmentally conscious development over the long run.
This study presents a method to support decision-making on the management of occurrences of defects in residential buildings. More specifically, we analyze defects that occurred after the handover of the project. The proposed evaluation and ranking method consists of a structured set of steps to organize and evaluate available data. Many aspects of several defect occurrences and their mitigation are taken into account. These aspects encompass the frequency of defects, financial features on repairing such defects, the impact that defects have on customer satisfaction, and the cost and complexity of preventing and minimizing defect occurrences through continuous improvement activities.
Therefore, the proposed method uses data from technical assistance departments and customer satisfaction surveys, where information about the users’ level of satisfaction and the occurrence of defects are available. These aspects are then analyzed through the Choosing by Advantages (CBA) method to support the decision-making process to prioritize which defects are the most important to be addressed by continuous improvement activities. A case study, where data are obtained from a construction company, is deployed to test and validate the method. An implication of this case study is that challenges and barriers associated with the method could be noticed. Moreover, the results point out important capabilities needed by companies to correctly assess the impact of defects, such as correctly logging data and having skilled personnel to verify defects users might have complained about.
To accomplish the study’s goal, this introduction section is unfolded into a discussion about defects in residential buildings, where a more comprehensive discussion on the literature regarding the assessment of the impact of construction defects is presented. Then, the paper follows by showing the set of structured steps used to organize the data and the CBA tool used for supporting the decision-making process on ranking the impacts. Finally, the method is developed and its use in a case study illustrates its applicability.
2. Defects in Residential Buildings
This section introduces the literature on defects, including the definition of defects adopted in this study, alongside how defects are measured and their impact in terms of risk, cost, and customer satisfaction. It concludes with the identification of the gap addressed in this study.
2.1. Definition, Incidence, and Relationship with Managerial Indicators
One way to objectively measure the quality of buildings is by measuring the occurrence of defects in the final product [12,13] and investigating how their occurrence impacts customer satisfaction [14]. This study adopted the definision of a defect as “a shortcoming or falling short in the performance of a building element” [15], and categorizes defects into three categories: (1) technical, when the functional performance of a structure or element is decreased due to material or workmanship problems; (2) aesthetic, when there is a problem with the appearance of an element, but its functioning is not affected; and (3) functional, when elements in the residential unit do not function as planned. All defects have some impact on buildings; however, it is worth noting that technical defects might affect the health and safety of the users and are usually related to lack of compliance to regulations, whereas functional and aesthetic defects might have psychological impacts but do not compromise the health and safety of the users.
In general, three main categories of studies about defects in buildings have been identified. The first category uses data about defects to evaluate the risks and financial impact of these defects, e.g., [5,6], whereas the second one uses customer input to evaluate their satisfaction with the building, based on post-occupancy analysis, e.g., [9,14,16]. A third category focuses on identifying the causes of construction defects and measuring the incidence of rework associated with such defects [10,17], related costs of rework [18], and more recently on conceptualizing rework based on error and violation and associated consequences for quality, safety, and the environment [19,20]. However, a gap still exists in the literature combining the triad: reliable data about defects in buildings, impact of defects in customer satisfaction, and associated costs.
Recent studies on construction defects in residential buildings have focused on financial losses associated with maintenance activities to repair defects based on the frequency and severity of defects and the risks related to the occurrence of the defects [4,5,6]. While very comprehensive in their analyses, these studies did not take into consideration the levels of customer satisfaction and focused mainly on the risks associated with the defects analyzed mostly in a quantitative fashion. In contrast, another recent study proposed a holistic approach, based on organizational learning, to manage and address construction defects by involving multiple stakeholders in an organization and considering a broader array of data during the decision-making process, including building-related data, priority of repair, and customer satisfaction surveys [21]. The action research approach used by [21] also promoted the participation of multiple stakeholders in the process, which also supported organizational learning to reduce defect occurrence. A similar but not empirically tested approach was proposed by [10] to focus on detecting rework and learning from the process to address rework occurrence in buildings.
Additional studies have shown that the production process, product handover, and post-occupancy customer services have a significant impact on how customers perceive and evaluate the quality of a building project [7,8,14,22]. The occurrence of defects after the product handover and poor customer service can greatly impact customer satisfaction. In fact, the authors of [7] state that the worse impacts might result from the occurrence of multiple defects in a customer’s unit, the recurrence of the same defect, the bad handling of communications between customer satisfaction services and the customer after a claim is filed [8], and the occurrence of defects that jeopardize the functioning of the residential unit [5]. Accordingly, managerial processes addressing construction defects and their mitigation could benefit from considering how customers perceive the defects and how they impact customer satisfaction.
2.2. Defects as Perceived by Customers and Their Impact on Customer Satisfaction
Customers are usually the first to report defects in their units. However, data about defects directly reported by users or building/facilities managers are usually not reliable for collecting defect-related data. Although several studies have used only customer-reported data to identify defects in buildings [13,14,23,24], users usually forget or do not have the technical skills to fully characterize the defects they experience in their units [7]. Thus, data reporting inconsistencies can jeopardize analyses to characterize the occurrence of defects and misguide managerial action to prevent and address the causes of defects. This problem can be addressed if data are cross-checked between customer satisfaction surveys (CSSs) and data logged by skilled personnel in technical assistance departments (TADs). The CSS data enable the analysis of the impact of defects on customer satisfaction as reported by the customer, and data from TADs enable the comparison and validation of the defects claimed by the users. The TADs usually keep data with details about technical inspections conducted by skilled personnel to identify the defects claimed by the customers. Data housed in TADs also support the documentation of the company’s standard of care at the time and location where the project was built, as direct audits by qualified personnel tend to be more reliable [25].
The incidence, associated risk, cost of a defect, and related rework activities are metrics commonly used to prioritize improvement activities [4,17,18]. Companies might choose to mitigate defects that have a higher number of occurrences or risky profiles and consider them as the most critical defects to be addressed. However, while valid, these choices do not consider the impact that different defects have on customer satisfaction [7], on how residents can conduct their daily activities [5], and how an organization services customer’s requests [8].
Therefore, a combination of the number of occurrences of a particular defect, potential financial impacts resulting from repairing the defects, customer satisfaction levels, and the customer’s ability to use the building are factors that can be taken into consideration. Given the combination of inputs necessary to evaluate which defects should be prioritized considering customer input and satisfaction, related costs, and incidence of defects, the Choosing by Advantages (CBA) method is discussed next as an alternative to organizing decision-making on continuous improvement activities.
3. Choosing by Advantages
Decision-making processes have the objective to support reliable decision-making among several possible alternatives. It should help decision makers to reach a consensus and understand the factors considered during the process and focus on outcomes. Among several tools to support these processes are Multi-Criteria Decision-Making (MCDM) tools, which support decision-making between alternatives, using possibly conflicting criteria. Choosing by Advantages (CBA) was the method chosen, among other alternatives considered, to support the decision-making process to prioritize which defects are the most important ones to be addressed by continuous improvement activities. CBA uses a visual routine, which is simple to use and does not require sophisticated mathematical and computational knowledge [26], which might not be readily available to a construction company’s collaborators with different skill levels.
The use of CBA to address construction management problems has gained attention within the community studying and applying Lean Construction practices, including decision-making in the design phase [27,28], project team selection [29], public procurement process [30], analysis of protection devices in bridges [31], and contractor selection [32]. The literature reviewed on CBA builds on previous work to gather and organize data about a problem, which are then used to select the alternative with the best overall advantages during the CBA process.
CBA is based on principles that state that conscious decision-making methods must be anchored in relevant facts and should ponder decisions on the importance of the prospective differences between the various alternatives. Decisions in the CBA routine are grounded on the importance of advantages of each of the alternatives rather than advantages and disadvantages of each, avoiding double counts [26], since the advantage of one alternative is generally the disadvantage of another. For example, one alternative could be considered simple, an advantage, and another complex, a disadvantage. Thus, only the advantages of each one are emphasized.
The CBA routine is briefly explained in the research method section using a step-by-step description for its use. It is later applied to the case in point to describe the process to prioritize defects for continuous improvement activities.
4. Research Method
This section presents the proposed method, which comprises an algorithm, a sequence of well-determined steps. At first, the algorithm assesses the impact of the defects on the customer satisfaction; secondly, it considers the financial impact of the repair of the defects and their number of occurrences and, finally, the CBA routine is applied in order to rank and define which defects will be the focus of mitigation and continuous improvement activities.
The data used in this study were collected in partnership with a medium-sized construction company from the State of São Paulo, Brazil (Company A). Company A is one of the largest developers and builders of residential buildings and house condominiums in the Ribeirão Preto area and was established in 1981. The company is ISO 9001-certified since 2009, which requires the use of standardized routines to manage the quality as part of its processes, including but not limited to the quality of the products and services it provides. Design Science Research (DSR) [33] was the approach used to develop the study, in which the gained knowledge is used to develop valid and reliable solutions to solve problems, create, change, or improve existing solutions; and to generate new knowledge, insights, and theoretical explanations. Therefore, this work developed and adapted instruments to collect and organize data and proposed a method (artifact) to address the problem of assessing and ranking the impact of construction defects [34].
4.1. Phase 1—Data Pre-Processing and the Impact of the Defect Occurrences in Customer Satisfaction
Data linking customer satisfaction and potential defects in residential units are required at this first step. These data are usually obtained by cross-checking customer satisfaction surveys and data from TADs. A customer satisfaction survey (CSS) should ideally ask customers specific questions about defect occurrences and the impacts these defects had on their satisfaction. Table 1 illustrates the CSS used by Company A.

Table 1.
Questions from the CSS.
Answers to questions from Company A’s CSS (Table 1) alongside data from their TAD database were then used to compute the impact of defects on customer satisfaction. Three different projects were evaluated, namely Projects 1 (96 units), 2 (84 units), and 3 (88 units), all representing multi-story residential buildings in similar neighborhoods (with similar levels of finishes and construction methods used). According to Company A’s criteria for post-occupancy analysis, at least 25% of the number of the units in each project were sampled to answer the CSS. The time frame between the delivery of the units and the CSSs was at least six months, which is considered long enough to allow some defects to manifest and to be noticed by users. Latent defects, those that take longer to manifest and be noticed, might not be captured in this process, and that is a limitation of this method.
Company A’s TAD logs into their database the defects claimed by customers only after conducting a visit to the unit and inspecting the reported defect. This improves the reliability of the data collected, which is performed by trained personnel instead of solely relying on client reports. The logged data are used to check if the defects reported are covered under the project’s warranty policy so that the company can fix them free of charge for the customer. Divergences between defects reported by customers and data documented in the TAD database were double-checked in order to assure the integrity and reliability of the data.
Additionally, it is worth noting that multiple defects in the same unit, recurrent defects, or failure of the TAD to contact the customer to solve the problem have been found to cause a negative impact on customers. Accordingly, this impact is not necessarily caused by the type of defect that the unit has presented, so these cases should be removed from the analysis [7]. Once the TAD and CSS data were pre-processed and cross-checked for reliability, and these types of cases were removed from the database, the next step is determining the impact of the defect on customer satisfaction. Therefore, the number of times each defect was reported in the TAD database for a particular residential unit was accounted with an evaluation label of positive, neutral, or negative impact on their satisfaction.
4.2. Phase 2—Financial Impact of the Occurrence of Defects
After analyzing the impact of defects on customer satisfaction, the next step is to verify the financial impacts of the defects reported. By the financial impact, one must understand the costs of repairing such defects; therefore, the total financial impact of a particular defect can be defined based on its repair cost multiplied by the number of occurrences of such defects. The following criteria are suggested to select which defects are taken into consideration for the financial analysis considering the heterogeneity of the possible defects identified in a residential unit:
- All defects that negatively impacted customer satisfaction should have their financial impact assessed.
- Defects with a high number of occurrences should also have their financial impact examined. Among the total number of defects, we sorted and selected those with the highest number of occurrences until we reached one-third of the total number of defects. For example, within a total of 1000 defect manifestations, we selected those with the highest number of occurrences until 333 manifestations were reviewed and included in the dataset used in the analyses.
A limitation of the method is that only costs that are related to a particular defect are considered, whereas costs related to equipment, tools, and facilities, which are difficult to assign to any given defect, were chosen not to be taken into consideration. The rationale behind this choice is that it is challenging and subjective to assign fractions of these costs to the different repairs, given that tools, equipment, and facilities are usually shared among the different defect repairs. Companies that have the means to allocate these costs to specific defects proportionally can choose to include them in the analysis.
Regarding the cost of the workforce, the time taken for professionals to undertake the repair of each defect is analyzed, and the hourly cost of such professionals is considered. The hourly cost of manpower is calculated by dividing the company’s monthly expenses, including direct salary, benefits, taxes, and other costs recorded in the Human Resources Department database. For a more comprehensive cost estimation, the time it took for the repair to be completed and the total time that the employee was available for the repair must be accounted for. For example, consider a repair scheduled for the morning of a given day. The time credited to this repair should begin when the repair team is transferred to the residential unit and includes the waiting time until access to the unit is granted, the effective time the team uses to finish the repair, and the time spent for an eventual cleaning of the unit. If the employee has more than one repair to undertake in the same project, from the moment the first repair is completed, time is then credited to the next repair.
To assess the cost of third-party workers carrying out repairs on behalf of the builder/developer, the cost charged by the third-party company was taken into consideration, including materials if they are included in the invoice. In this last case, both costs are accounted for the global workforce cost.
Regarding material, costs were raised by tracking repairs. For example, the number of siphons and the amount of paint used in a given repair were evaluated. The prices of these materials were reviewed from the invoices associated with these repairs.
4.3. Phase 3—Decision-Making Support System
Finally, after assessing the impact of the defects on customer satisfaction, the number of occurrences of each defect, and their financial impact, these factors should be considered together with other essential management practices in order to rank the most important defects that must be mitigated via continuous improvement activities. Additional factors to be considered might include, for example, the complexity, time, and financial investments needed to minimize defects, or the opportunity to take action on a specific project during the analysis.
To support the decision-–making process, the CBA method uses the following definitions for the different elements used in the analyses made [26]:
- Alternatives are the object of decision-making. In the proposed method, alternatives are the defects that improvement activities should prioritize, and one or a combination of alternatives should be chosen.
- Factors are elements, parts, or components of a decision. They contain essential data for decision-making. Factors related to the occurrence of defects should be linked to the impacts they cause and their complexity, among others. Good factors are considered those that help to differentiate between alternatives. Consequently, factors that are met in the same way by all alternatives will not be able to assist decision-making, as they do not assist in differentiating the alternatives.
- Attribute is a characteristic, quality, or consequence of an alternative. In general, attributes can be understood as the possible value or possible category of a given factor. For example, for the factor “financial impact”, possible attributes would be “low”, “medium”, or “high”, or even numerical values.
- Criteria represent standards, rules, guidelines, or tests on which decision makers base their judgment. A criterion may be essential, that is, alternatives must satisfy the criterion, or they will be eliminated from the analysis. A criterion may also be desirable, i.e., each of the alternatives can satisfy the criterion to some extent.
- Advantage is the benefit and/or improvement of attributes of an alternative against the attributes of another alternative.
The deployment of the CBA is carried out in seven steps briefly described below. The product of the CBA tool is a table and a graph, as depicted in Figure 1. This is a generic figure showing an example of a table resulting from the CBA deployment. The CBA table, as shown in Figure 1, which supports the development of graphic plotting importance versus the cost of alternatives, is used in the decision-making process [35,36,37].
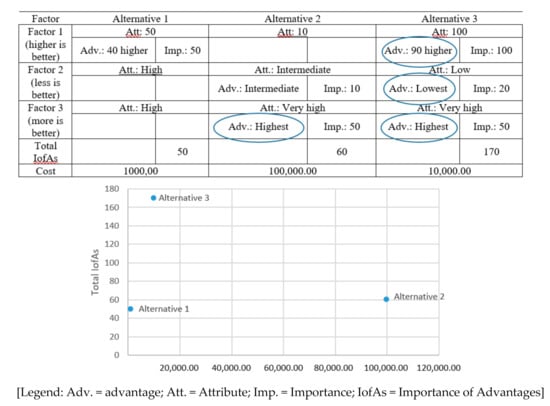
Figure 1.
Generic CBA table example and a cost vs. advantages chart for the generic example.
- Identify the alternatives that will be evaluated, shown in the CBA table as columns.
- Define the factors to evaluate the alternatives, shown as rows.
- Define the essential and desirable criteria for each factor, illustrated in the rows below each factor.
- Describe the attributes of each alternative, which are the values assigned for each alternative given a specific factor. The values can be numerical or categorical.
- Determine the advantages of each alternative, which is a numerical or categorical value that appears in the Table as an “Adv.:” and is calculated based on the less desired attribute of each factor. This illustrates the advantages of an alternative in comparison to the others. For example, for Factor 1, if Alterative 3 scores 100 and the less desired attribute scores 10 (from Alternative 2), then the Adv is 90 (100 − 10).
- For each factor, identify and circle the most important advantage. In case of a tie, both advantages must be circled. Among all circled advantages, choose the most important one, which will be the paramount advantage. Decide the importance of each advantage, starting with the paramount advantage that has the importance of 100. The importance is given by a subjective heuristic and should model the values of the company.
- Evaluate the cost of each alternative and the sum of the importance of advantages (IofAs) to make a decision. These costs are also given by a subjective heuristic.
In summary, the proposed method comprises an algorithm composed of a sequence of well-determined steps (Figure 2): at first, the algorithm assesses the impact of the defects on customer satisfaction; secondly, it selects and evaluates the financial impact of the defects, and finally, it applies the CBA routine in order to define which defects will be a focus for mitigation.
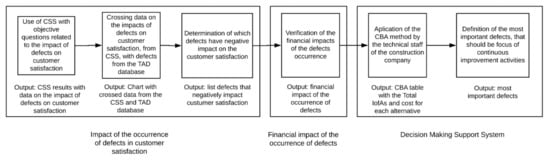
Figure 2.
Structured steps (algorithm) of the proposed method.
Please see Suhr [37] for more details on the deployment of the CBA tool.
4.4. Phase 4—Validation of the Proposed Method
The proposed method was validated using projects provided by Company A, with the support of its technical staff, who participated in an exercise to use the method. The staff was trained on the CBA routine and the steps in the algorithm of the proposed method. During the deployment meeting, when the method was introduced to the group; the first author acted as a facilitator and was present in order to help clarify any questions the group might have but in no way interfered in their decisions. After the meeting, results were generated, and the facilitator presented the results to the group to validate the method. Feedback provided by the staff was shared with the facilitator for further adjustment of the method.
5. Implementation of the Proposed Method
The proposed method was validated in an exercise with Company A, and the steps are presented next.
5.1. Phase 1—Impact of the Occurrence of Defects on Customer Satisfaction
The first step of the process consists of identifying the impact of the occurrence of defects on customer satisfaction. Accordingly, Figure 3 presents a snapshot of how Part 3 of Company A’s CSS was cross-checked alongside the registered defects from the TAD database. Defects documented consisted of aesthetics and functional problems in the residential units. However, these defects still allowed the users to live in their respective units, even when the repairs were underway. No technical defect was identified that would prevent the use of the unit.
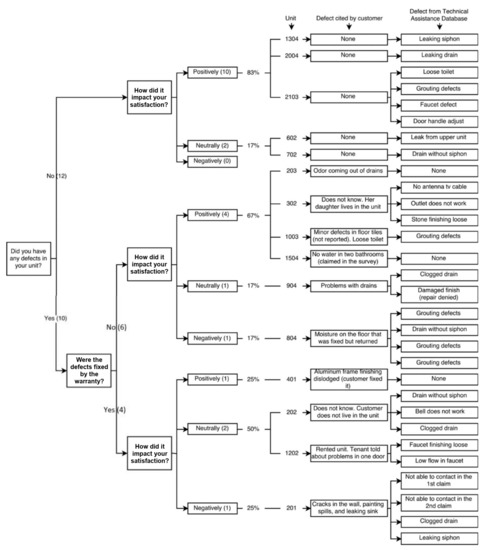
Figure 3.
Crossed data from CSS, Part 3 and TAD database, Company A, Project 1.
In some cases, during the data collection, the defects described by customers and the actual defects logged by trained personnel in the TAD database did not match or were inconsistent. To exemplify such confusion, customers might have described that no defects were found in their units. In contrast, there were defects documented in the TAD database for those same units, and vice versa. Moreover, most defects reported by customers were descriptions of the “symptoms” or visual manifestations of a defect, not the defect itself. These descriptions, for instance, would include mentions of “moisture on the floor” or “problem on the door”, and would give clues about the real defects. Thus, TAD data were checked by trained staff in order to document the defect properly and not to bias the decision-making process.
Table 2 presents the number of times each defect reported is related to positive, neutral, or negative impacts. It is important to note that the defects labeled as “Others” has no negative impact on customer satisfaction. All aesthetic defects were classified under this category and as discussed in previous sections and expected, Table 2 reveals that aesthetic defects did not negatively impact customer satisfaction. From Table 2, it is possible to determine which defects are related to the negative impact on customer satisfaction.
Table 2.
Impact of defect occurrences on customer satisfaction.
5.2. Phase 2—Financial Impact of the Occurrence of Defects
Four and a half years of data comprising the total number of occurrences of defects were retrieved from Company A’s TAD database (February 2013 to October 2017) to assess the costs of repair of each defect for residential buildings Projects 1, 2, and 3. It is important to stress that the financial impact of the occurrences of a particular defect represents the cost to repair such defects (workmanship and materials).
An assessment of the TAD database revealed that more than one-third of the defects reported are clogged drains, failure in grout adhesion, cracks noticeable at a distance of more than 1 m, and problems in sealing joints of metal fittings (siphons, hoses, valves, and drains). These defects, and the defects that negatively impacted customer satisfaction, had their financial impacts assessed.
Some defects are considered particular cases of larger groups of defects, according to Company A’s warranty policy. For instance, in this categorization, the defect labeled as “doorbell does not work” is a specific case of the broader group “bad performance of materials and thermal insulation of electrical installations—sockets, switches and circuit breakers”; likewise, “stain on the ceiling” is a particular case of the “blistering, peeling, crumbling, color change or finish deterioration of paints/varnishes (internal/external)”. Thus, the method (algorithm) uses the number of occurrences that belong to the group the defect analyzed is part of. Notice that these defects will appear in the following tables presented as part of the respective group of defects, as defined by Company A.
The labor costs associated with the repairs were obtained through Company A’s Human Resources Department and existing regulations related to salaries and benefits as of the year the data were obtained (2017). After gathering the number of defects occurrences and the company’s total cost for each employee assigned to carry out the repairs, the following steps involved calculating the hourly cost of each employee, considering 22 days worked per month, 8 h/day, adding up to 176 of worked hours per month. The calculations result from the following values (converted from Brazilian reais to US dollar values with the rate from 1 May 2017): USD 7.58/h for bricklayers, USD 8.90/h for painters, and USD 10.49/h for engineering assistants (inspecting the defects).
The labor costs related to the technical inspection, initially performed by the TAD after the customer reports a defect, were also assessed. The engineering staff performs such inspections. There is usually a time interval between the moment the TAD initially receives a call, performs the initial inspection of the reported problem, and performs the repairs. This interval can be a few days, weeks, or even months when custom materials, such as special doors, are needed. The time averaged among 10 different inspections was used to represent the inspection time. The average time taken for one inspection within 10 different inspections was 0.93 h, with an average cost of USD 10.49 per inspection. The only instances that do not include the cost of inspections are those related to clogged drain defects since they are easy to identify and repair; hence no inspections were conducted for this problem.
Finally, the materials used and their associated costs were included in the calculations alongside the labor hours spent on each repair. An example is presented to illustrate the proposed method for the defect labeled “cracks noticeable at a distance greater than 1 m” in Table 3. As shown in Table 4, the financial impact of each defect is obtained by multiplying the average repair cost of each of the defects analyzed by the number of times the defect occurred in the projects considered during the analysis.
Table 3.
Example of the financial impact assessment for the defect “cracks noticeable at a distance greater than 1 m”.
Table 4.
The total financial impact of defects.
The results presented in Table 4 reveal that the financial impact of repairing each defect varies widely. The impact caused by the occurrence of cracks, estimated at USD 18,044, is more than 200 times greater than the impact caused by clogged toilets, USD 88.83. These numbers stress the importance of accounting for the financial impact of each defect in order to prioritize improvement activities instead of just looking at the frequency of defects.
5.3. Phase 3—Decision-Making Support System—CBA Routine Deployment
The validation of the proposed solution was executed by deploying the decision-making support method in Company A, using the data previously discussed to determine the impact of defects on customer satisfaction and the financial impact of the defect occurrence. During a meeting at Company A’s headquarters, four employees participated in the validation process: the technical director, two project coordinators, and the budget coordinator. They belonged to different departments of Company A, i.e., operations, preconstruction, and the board of directors.
Initially, the results of the assessments regarding the occurrence of defects and their impact on customer satisfaction, the financial impact of defects, and the algorithm depicted in Figure 2 were presented to the staff. Participants were then instructed to use the number of occurrences of defects, their impact on customer satisfaction, and their financial impact as factors in the CBA routine.
5.3.1. Step 1—Selection of Alternatives
The group analyzed defects that had their financial impact assessed since they account for at least one-third of the occurrences in the studied projects and resulted in negative impacts on customer satisfaction. The group gave less importance to defects with lower occurrence numbers and those that are easy to repair, favoring defects with a higher number of occurrences. Thus, among the defects that had their financial impact assessed, they discarded the defects “low tap flow” and “loose tap finishes” because they were considered irrelevant; these defects are particular cases of a broader category that had a smaller number of occurrences and are considered easy to be fixed. The defects “stain on the ceiling”, “bell does not work”, “drain without siphon”, and “toilet clogged” were considered defects with low numbers of occurrences and also easy to be repaired. In the end, the defects with the highest number of occurrences were selected, regardless of their financial impact presented (this might illustrate the bias of selecting defects that frequently occur, regardless of their impact). The defects selected are listed and sorted in alphabetical order:
- Clogged drains;
- Cracks noticeable at a distance greater than 1 m;
- Failure in grout adhesions;
- Problems in sealing joints of metal fittings, siphons, hoses, valves, and drains.
During the validation process, participants tended to cite defects that occurred in large numbers in projects delivered before those considered in this study, which had generated high financial impacts on those projects. However, the defects mentioned had not occurred with the same frequency in most recent projects. Changes made in the construction methods used by Company A in the past years had reduced such defects, but that information was not widely disseminated within the organization.
5.3.2. Step 2—Definition of Factors
In the second stage of the CBA process, the group defined the factors used to evaluate the defect occurrences. Initially, the group had agreed to use the following factors: number of occurrences of the defects, the impact of the defects on customer satisfaction, and the financial impact of the defects. However, participants decided to include a factor named “immediate intervention”, which would point to possible immediate intervention in projects currently under construction. For example, if projects under construction were not already covered with mortar, it would be possible to prioritize improvement actions to mitigate cracks resulting from the construction method and materials used. At the end of the discussion, participants reached a consensus that this factor would not help the group differentiate among the alternatives during the analysis, given the different stages of the projects under construction, so the group discarded the possibility of using it.
5.3.3. Step 3—Definition of Criteria for Each Factor
The group defined the following criteria to evaluate each one of the factors:
- The higher the number of occurrences, the more important the defect occurrence is.
- If the defect occurrence harms customer satisfaction, the more important the defect occurrence is.
- The greater the financial impact, the more important the defect occurrence.
5.3.4. Step 4—Description of the Attributes for Each Factor
In the fourth step, the group described the attributes of the factors. Participants were reminded that categorical variables could be used, such as “very high”, “high”, “medium”, and “low”. The impact of the occurrence of a given defect on customer satisfaction was categorized as “with negative impact” or “without negative impact”. The group decided to use the actual numerical values over categorical values for both the number of occurrences and the financial impact of the defects.
5.3.5. Step 5—Definition of the Advantages of Each Factor
By using the CBA table, the group underlined the less important alternatives for each factor, i.e., those that presented the least important attribute according to the criteria of each factor. For example, consider a factor with the criterion “the bigger, the more important”, the smallest attribute is defined as the least important. To illustrate this rationale, consider a defect that has no negative impact on customer satisfaction. Such a defect is less critical than a defect that has a negative impact. The second part of the fifth step was then to determine the advantage of each alternative with respect to the least important alternative for each factor, which is indicated in the CBA table with an underline. For example, regarding the factor “number of occurrences”, the alternative “clogged drain” has 114 occurrences, while the alternative with the fewest occurrences is “junction seal problems metal fittings, siphons, flexible valves, and drains,” with 81 occurrences. The advantage for the “clogged drain” alternative is defined by the difference between the number of occurrences presented, i.e., 33.
5.3.6. Step 6—Definition of the Importance of Each Advantage
In the sixth step, the group determined the importance of each of the advantage by assigning a value for each of the alternatives. They started by circling items in the CBA table to identify the greatest advantages for each of the factors and choosing the paramount advantage, which was assigned the highest value (100). The group promptly agreed that the paramount advantage would be the highest financial impact of USD 17,634 related to the defect “cracks noticeable from a distance greater than 1 m”. When asked why that choice was made, the group explained that the financial impact significantly differentiates the alternatives as it is the product of the number of occurrences and the average cost of repair. The group also explained that the impact on customer satisfaction was a more abstract factor. This seems to indicate that the daily attention of the staff participating in the validation was focused on the financial performance of the projects, and the company as a whole versus on customer satisfaction. The group then proceeded to determine the importance of the other circled advantages, which negatively impacted customer satisfaction and 33 more occurrences. Comparing these advantages with the paramount advantage, the group assigned 80 points to both. Note that the assignment of the importance value is subjective and must be defined by consensus within the managerial team. Therefore, 80 was a value defined by consensus and assigned by comparing the importance of the advantage being discussed to the importance of the paramount advantage, which received a score of 100. Then, participants continued the evaluation by assigning values to indicate the importance of the other advantages.
5.3.7. Step 7—Assessment of the Total Cost of Each Alternative and the Sum of the Importance of the Advantages
It is important to note that Step 7 comprises assessing the alternative cost; that is, the cost of continuous improvement activities to mitigate the defect occurrence. This is different from the financial impact factor of the defect occurrence. For example, the financial impact of clogged drains accounts for the costs to unclog the drain, whereas the cost of choosing clogged drain as the object to continuous improvement activities involves the costs of changing design options, projects, and construction methodologies, among others.
In the seventh step, the facilitator explained to the group the difficulty of determining the total cost of continuous improvement activities of each alternative since this cost would also include the cost of activities necessary to reduce the occurrence of each defect (i.e., cost of mitigating the defects), and this cost was not known. It was also explained to the group that an option to assess such costs would be to estimate the mitigation cost of each alternative, based on their knowledge of both the financial cost and the complexity of the activities necessary to reduce the occurrence of the defects. The group could define this cost/complexity through categorical variables such as low, medium, and high, which the group adopted. The group was able to reach a consensus on the cost/complexity estimate for each of the defects evaluated. Again, we must stress that the classification of the complexity into low, medium, and high was reached through consensus by the managerial team. Sometimes during the discussions, there was confusion between the cost/complexity of activities to reduce the occurrence of defects with the cost/complexity to repair the defect. If this is a factor to be considered, a clear differentiation between these types of costs has to be established and understood by those using the method. For example, unclogging toilets is a reasonably simple task; however, preventing it from clogging is quite complex as it depends on user habits and the assurance that the final inspection of the unit is effective as objects capable of clogging the vessel might not be found until the unit is delivered.
Finally, Figure 4 presents the resulting CBA table developed by the group, and Figure 5 shows the chart illustrating the sum of the importance of the advantages of each alternative with respect to the cost/complexity of the alternatives.
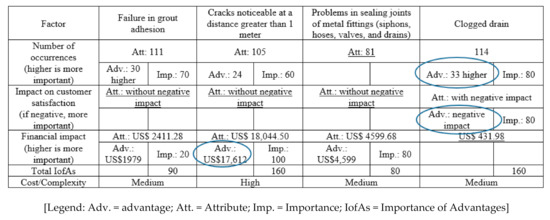
Figure 4.
Final CBA table for the case study.
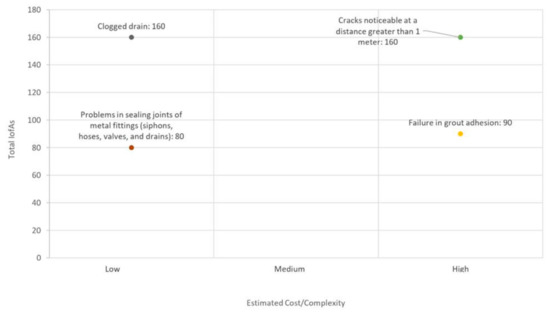
Figure 5.
The sum of the importance of the advantages of each alternative with respect to the cost/complexity.
Figure 5 reveals that the group defined “clogged drain” as the most important defect, which should be the focus of the company’s continuous improvement activities. The defect “clogged drain” presented the highest sum of the importance of the advantages, tied with the defect “perceptible cracks at a distance greater than 1m”, but it has a lower estimated cost/complexity for the mitigation activities, and it has a negative impact on the customer satisfaction.
6. Discussion
The case study was a validation exercise for the proposed method, where real data were used. Overall, the group considered the proposed method appropriate for supporting decision-making. The group also observed that the presence of the facilitator was essential to helping perform the deployment of the method. They also agreed that determining the repair costs of the defects is laborious, although adequate and that a method for determining or estimating shared costs would be important to assign costs to repairs properly. Regarding the determination of the financial impact of defects, the consensus was that the method was effective and relatively simple to perform.
Although laborious, after having data acquired and logged correctly, updating such repair costs becomes simple. It is important to highlight that the method should be continuously applied and updated. Therefore, a comprehensive IT system to access this data and update it automatically is of great value to the company.
The decision about which defect is most important is a tactical decision that should be nurtured by an organization’s strategies at the time this method is used. This is a basic premise that nurtures this kind of decision. Different aspects can be given different weights. For example, if the administration of the company (board of directors) advises its employees that the focus of their efforts as a group should be on cost reduction and cost containment, then the financial impact of defects should take center stage during the discussions. Alternatively, the board may define that one of the goals to be attained by the group is to improve the company’s relationship with customers, seeking to increase their satisfaction. Accordingly, the group should increase the weight of the impact of defects on customer satisfaction. However, it is critical that all three essential aspects, i.e., financial impact, customer satisfaction, and the number of occurrences, are assessed in order to make sustainable decisions in managing defect occurrences, even if they are given different priorities. The slight differences in weights are considered to steer decisions towards the company’s strategies. If any of these aspects are excessively overlooked or totally ignored, the company misses an opportunity to efficiently address and implement sustainable decisions. In an ideal scenario, all aspects must be equally assessed. The contribution of the proposed method when compared to previously published methods, as discussed in Section 2, is to fill in this knowledge gap through structuring the decision-making process by combining all three crucial aspects previously defined.
Considering that this process involves subjective decisions based on the input of participants and directives from an organization’s executive board, the CBA process results will likely vary depending on those using the proposed method and the goals and strategies set in place at the time. Regardless of these characteristics, those involved in the process, when the proposed method is used, should reach a consensus and validate the results obtained. All the steps of the method are eligible for being deployed when the construction company assesses the correct data regarding a project. The resulting outcome of the method when applied to other contexts, countries, and projects ought to be different since different aspects and priorities will be taken into consideration considering company-specific heuristics and subjective opinions from the managerial team. Therefore, the method can be replicated in different organizations and be supported by data that capture the appropriate input to achieve the company’s goals. In fact, as already pointed out, this method should be applied continuously in order to translate the values of the company, which should be dynamic, i.e., should change to address the needs of the company and its clients, and the market. As mentioned by the group involved in the validation phase, many variables, as well as foreseeable and unforeseeable risks, were considered as a part of the managerial decision-making process. With this method, different values can be taken into consideration, including environmental risks and sustainability goals concerning the built environment.
We must again point out that latent defects, those that take longer to manifest and be noticed, might not be assessed in this process since the time frame between the handover and the CSS inspection is of a medium average. This can be a limitation of this process; however, it could be adapted considering the companies’ requirements. For instance, the company could commit to collecting data from its projects considering longer time intervals.
The better the quality of the data logged and assessed by the company, the better the outcome of the method. This would likely increase the method’s efficiency and would overcome any limitations.
As a result, the deployment of the method in this case study has revealed that some modernization is crucial to accomplish sustainable decision-making. Different technologies can be used to improve this process, such as data analytics, cloud computing, and mobile devices to support data collection and organization, and machine learning to support processing of the data and long-term learning about the main causes of construction defects and the risks associated with them. These technologies should facilitate data acquisition and analysis in a seamless way. During the test case, data were found to be unorganized and on different platforms. Moreover, during inspections, engineering staff did not have cloud-connected devices to input data on the fly, making data collection more error-prone. Therefore, we could identify some capabilities needed for construction companies to properly assess risks related to construction defects and make sustainable decisions by eliminating wasteful practices. This modernization is crucial for making the construction industry more sustainable. The construction industry needs to prepare employees for information-system development and data analysis.
7. Conclusions
The study’s primary goal was the development of a method to support decision-making in the management of defect occurrences in residential buildings. Based on a validation exercise, the authors conclude that the proposed method defines a process to nurture conversations about priorities regarding continuous improvement activities to address defects in residential buildings. The validation process used real data obtained from projects built by a medium-sized company in Brazil and used by a group of the company’s employees in charge of operations, preconstruction, and the board of directors. The proposed method comprises an algorithm with a sequence of well-determined steps: at first, the algorithm assesses the impact of defects on customer satisfaction, secondly, it assesses the financial impact of the defects and, finally, it applies the CBA routine to define which defects should be prioritized for continuous improvement and mitigation initiatives.
During the study and use of the method developed, relevant implications for practice and deployment of the method were identified, which establishes up a set of guidelines and considerations:
- Data collected from CSSs must be cross-checked with the TAD database to verify data reliability since inconsistencies in such datasets are commonly found, as suggested by the literature. After this cross-check with the TAD database, where post-occupancy data are logged by skilled personnel, data become more reliable to assess the impact of defect occurrences on customer satisfaction. These are data that support the definition of alternatives and factors in the CBA process.
- Companies need to structure their information and management systems to obtain a data framework that enables the deployment of the method considering the incidence of defects, their impact on customer satisfaction, and related costs. Skilled personnel and new digitization and database information systems are crucial for better using the method and making sustainable decisions that deliver value to the customer and do not waste resources.
- The financial impacts, i.e., the cost of repair of those defects that are most common to occur and of those that negatively impact customer satisfaction, are assessed based on quantitative data acquired from TAD field operations where labor and material costs are documented. Shared costs are not considered since currently, there is no simple way to allocate such costs to different types of defects. However, the more data available on the costs of repairs, the more statistically reliable are the calculations on the financial impact of these defects.
- The CBA decision-making routine comprises a useful visual tool to assist individual or group management decisions based on numerical or categorical variables. Considering the discussions participants had during the validation process, the authors concluded that a consensus on which defect must be chosen as the most important one is relatively easy to achieve if the sequence of steps is structured. Moreover, the group indicated that the algorithm employed in the method greatly assists in the decision-making process. Changes in the environment, way of working, and demands and offers of products generated and consumed by the industry can happen due to several factors and offer risks for sustainable managerial actions. Therefore, when continuously applied, the method can improve sustainable managerial decisions where economic, environmental, social, and technical risks can be accounted for to improve the quality of projects from the company and customer perspective. Such aspects can be incorporated into the CBA analysis routine as factors translating the company’s values at the time.
- Customer satisfaction is a complex variable and varies widely depending on several factors, such as the region of the project, the building standard, the customer profile, and the customer service provided by the company. Repair costs might as well widely vary given the technique used by the construction company for the repairs, the location of the project, and the repair team headquarters. However, the method structures the risk analysis of different choices for improvement activities, and therefore sustainable and aware decision-making arises more clearly within a company’s context.
Future research could investigate management practices for defect occurrences in commercial/industrial projects where poor decision-making could result in high costs and harm a company’s image. Another suggestion is to use quality concepts, such as those proposed by [38,39], regarding the categorization of customer satisfaction considering attractive, required, indifferent, and other attributes and how they influence the resulting priorities.
Author Contributions
Conceptualization, R.N.M., T.d.C.L.A. and J.C.P.; methodology, R.N.M., T.d.C.L.A. and J.C.P.; validation, R.N.M.; formal analysis, R.N.M.; investigation, R.N.M.; writing—original draft preparation, R.N.M. and L.H.B.L.; writing—review and editing, T.d.C.L.A. All authors have read and agreed to the published version of the manuscript.
Funding
This research received no direct funding. It was a part of the Civil Engineering Graduate Program at the Department of Civil Engineering—Federal University of São Carlos, which is, in part, financed by the Coordenação de Aperfeiçoamento de Pessoal de Nível Superior—Brasil (CAPES)—Finance Code 001.
Institutional Review Board Statement
Ethical review and approval were not sought for this study, due to the fact that no personal information or identifiers were collected during the study. Only information about the defects studied, the management of defects, and related technical data were collected during the study.
Informed Consent Statement
Not applicable. (No personal identification or personal opinions were recorded during the validation phase; only technical information regarding the defects analyzed.).
Data Availability Statement
Raw data obtained during this study can be obtained from the corresponding author.
Conflicts of Interest
At the time of the study, the first author was an employee of the company where the study was developed. The analyses and opinions reported resulted from the work of the authors and do not represent the company’s opinion on the topics discussed. The other authors had no affiliation with the company investigated.
References
- Beier, G.; Ullrich, A.; Niehoff, S.; Reißig, M.; Habich, M. Industry 4.0: How it is defined from a sociotechnical perspective and how much sustainability it includes—A literature review. J. Clean. Prod. 2020, 259, 120856. [Google Scholar] [CrossRef]
- Minta, Y. Link between satisfaction and customer loyalty in the insurance industry: Moderating effect of trust and commitment. J. Mark. Manag. 2018, 6, 25–33. [Google Scholar]
- Othman, A.A.E. An international index for customer satisfaction in the construction industry. Int. J. Constr. Manag. 2015, 15, 33–58. [Google Scholar] [CrossRef]
- Kim, S.; Lee, S.; Ahn, Y.H. Evaluating housing maintenance costs with loss-distribution approach in South Korean Apartment Housing. J. Manag. Eng. 2019, 35, 1–9. [Google Scholar] [CrossRef]
- Au-Youg, C.; Chua, S.J.L.; Ali, A.S.; Tucker, M. Optimizing maintenance cost by prioritizing maintenance of facilities services in residential buildings. Eng. Constr. Archit. Manag. 2019, 26, 1593–1607. [Google Scholar]
- Lee, J.; Ahn, Y.; Lee, S. Post-handover defect risk profile of residential buildings using loss distribution approach. J. Manag. Eng. 2020, 36. [Google Scholar] [CrossRef]
- Milion, R.N.; Alves, T.C.L.; Paliari, J.C. Impacts of residential construction defects on customer satisfaction. Int. J. Build. Pathol. Adapt. 2017, 35, 218–232. [Google Scholar] [CrossRef]
- Forsythe, P.J. Construction service quality and satisfaction for a targeted housing customer. Eng. Constr. Archit. Manag. 2016, 23, 323–348. [Google Scholar] [CrossRef]
- Alves, T.C.L.; Costa, G.S.; de Barros Neto, J.P. Creating value in housing projects: The use of post-occupancy analysis to develop new projects. In Proceedings of the Construction Research Congress 2009, ASCE, Seattle, DC, USA, 5–7 April 2009; pp. 1105–1114. [Google Scholar]
- Love, P.E.D.; Smith, J. Benchmarking, benchaction, and benchlearning: Rework mitigation in projects. J. Constr. Eng. Manag. 2003, 19, 147–159. [Google Scholar] [CrossRef]
- Paparoidamis, N.G.; Katsikeas, C.S.; Chumpitaz, R. The role of supplier performance in building customer trust and loyalty: A cross-country examination. Ind. Mark. Manag. 2017, 78, 183–197. [Google Scholar] [CrossRef]
- Auchterlounie, T. Recurring quality issues in the UK private house building industry. Struct. Surv. 2007, 27, 241–251. [Google Scholar] [CrossRef]
- Ng, S.T.; Palaneeswaran, E.; Kumaraswamy, M.M. Satisfaction of residents on public housings built before and after implementation of ISO9000. Habitat Int. 2011, 35, 50–56. [Google Scholar] [CrossRef]
- Berr, L.R.; Echeveste, M.E.S.; Lorenzi, L.S.; Formoso, C.T. Indicador de falhas de qualidade baseado na percepção dos usuários de Habitação de Interesse Social. [Indicator of quality failures based on the perception of end users of social housing]. Ambiente Construído 2015, 15, 19–35. (In Portuguese) [Google Scholar] [CrossRef]
- Zalejska Jonsson, A.; Hungria Gunnelin, R. Defects in newly constructed residential buildings: Owners’ perspective. Int. J. Build. Pathol. Adapt. 2019, 37, 163–185. [Google Scholar] [CrossRef]
- Forcada, N.; Macarulla, M.; Gangolells, M.; Casals, M.; Fuertes, A.; Roca, X. Posthandover housing defects: Sources and origins. J. Perform. Constr. Facil. 2013, 27, 756–762. [Google Scholar] [CrossRef]
- Koch, C.; Schultz, C.S. The production of defects in construction—An agency dissonance. Constr. Manag. Econ. 2019, 37, 499–512. [Google Scholar] [CrossRef]
- Georgiou, J.; Love, P.; Smith, J. A comparison of defects in houses constructed by owners and registered builders in the Australian state of Victoria. Struct. Surv. 1999, 17, 160–169. [Google Scholar] [CrossRef]
- Fayek, A.R.; Dissanayake, M.; Campero, O. Developing a standard methodology for measuring and classifying construction field rework. Can. J. Civ. Eng. 2004, 31, 1077–1089. [Google Scholar] [CrossRef]
- Love, P.E.D.; Matthews, J.; Fang, W. Rework in Construction: A Focus on Error and Violation. J. Constr. Eng. Manag. 2020, 146, 06020001. [Google Scholar] [CrossRef]
- Hopkin, T.; Lu, S.-L.; Sexton, M.; Rogers, P. Learning from defects in the UK housing sector using action research. Eng. Constr. Arch. Manag. 2019, 26, 1608–1624. [Google Scholar] [CrossRef]
- Rotimi, F.E.; Tookey, J.E.; Rotimi, J.O.B. Homeowners and developers relationships: Exploring the cordiality factor. Struct. Surv. 2015, 33, 278–292. [Google Scholar] [CrossRef]
- Brito, J.N.D.S.; Formoso, C.T.; Echeveste, M.E.S. Análise de dados de reclamações em empreendimentos habitacionais de interesse social: Estudo no Programa de Arrendamento Residencial [Analysis of complaint data in social house-building projects: A study in the Residential Leasing Program]. Ambiente Construído 2011, 11, 151–166. (In Portuguese) [Google Scholar] [CrossRef]
- Jiboye, A.D. Post-occupancy evaluation of residential satisfaction in Lagos, Nigeria: Feedback for residential improvement. Front. Archit. Res. 2012, 1, 236–243. [Google Scholar] [CrossRef]
- Miler, E.A. What is the standard of care? J. Manag. Eng. 1996, 12, 40–46. [Google Scholar] [CrossRef]
- Love, P.E.D.; Li, H. Quantifying the causes and costs of rework in construction. Constr. Manag. Econ. 2000, 18, 479–490. [Google Scholar] [CrossRef]
- Suhr, J. The Choosing by Advantages Decision Making System; Greenwood Publishing Group: Westport, CT, USA, 1999. [Google Scholar]
- Arroyo, P.; Long, D. Collaborative design decisions. In Proceedings of the 26th Annual Conference of the International Group for Lean Construction, Chennai, India, 16–22 July 2018; pp. 463–472. [Google Scholar]
- Sahadevan, V.; Varguese, K. Stakeholder value evolution, capture and assessment in aec project design. In Proceedings of the 26th Annual Conference of the International Group for Lean Construction, Chennai, India, 16–22 July 2018; pp. 549–559. [Google Scholar]
- Schöttle, A.; Arroyo, P. Comparison of weighting-rating-calculating, best value, and choosing by advantages for bidder selection. J. Constr. Eng. Manag. 2017, 143. [Google Scholar] [CrossRef]
- Schöttle, A.; Arroyo, P.; Georgiev, C.H. Applying choosing by advantages in the public tendering procedure. In Proceedings of the 25th Annual Conference of the International Group for Lean Construction, Heraklion, Greece, 9–12 July 2017; pp. 45–52. [Google Scholar]
- Zuluaga, C.M.; Albert, A.; Arroyo, P. Protecting bridge maintenance workers from falls: Evaluation and selection of compatible fall protection supplementary devices. J. Constr. Eng. Manag. 2018, 144. [Google Scholar] [CrossRef]
- Cortes, J.P.R.; Ponz-Tienda, J.L.; Delgado, J.M.; Gutierrez-Bucheli, L. Choosing by Advantages; Benefits Analysis and Implementation in a Case Study, Colombia. In Proceedings of the 26th Annual Conference of the International Group for Lean Construction, Chennai, India, 16–22 July 2018; pp. 636–646. [Google Scholar]
- Baskerville, R.; Baiyere, A.; Gregor, S.; Hevner, A.; Rossi, M. Design science research contributions: Finding a balance between artifact and theory. J. Assoc. Inf. Syst. 2018, 19, 3. [Google Scholar] [CrossRef]
- Oyegoke, A. The constructive research approach in project management research. Int. J. Manag. Proj. Bus. 2011, 4, 573–595. [Google Scholar] [CrossRef]
- Arroyo, P. Step by Step Guide to Applying Choosing by Advantages. Available online: https://leanconstructionblog.com/applying-choosing-by-advantagesstep-by-step.html (accessed on 16 December 2018).
- Arroyo, P.; Tommelein, I.; Ballard, G.; Rumsey, P. Choosing by advantages: A case study for selecting an HVAC system for a net zero energy museum. Energy Build. 2016, 111, 26–36. [Google Scholar] [CrossRef]
- Kano, N. Attractive quality and must-be quality. Hinshitsu Qual. J. Jpn. Soc. Qual. Control 1984, 14, 39–48. [Google Scholar]
- Yang, Z.; Cai, S.; Zhou, Z.; Zhou, N. Development and validation of an instrument to measure user perceived service quality of information presenting web portals. Inf. Manag. 2005, 42, 575–589. [Google Scholar] [CrossRef]


Publisher’s Note: MDPI stays neutral with regard to jurisdictional claims in published maps and institutional affiliations. |
© 2021 by the authors. Licensee MDPI, Basel, Switzerland. This article is an open access article distributed under the terms and conditions of the Creative Commons Attribution (CC BY) license (https://creativecommons.org/licenses/by/4.0/).