Abstract
The Baltic Sea is a unique and sensitive brackish-water ecosystem vulnerable to damage from shipping activities. Despite high levels of maritime safety in the area, there is a continued risk of oil spills and associated harmful environmental impacts. Achieving common situational awareness between oil spill response decision makers and other actors, such as merchant vessel and Vessel Traffic Service center operators, is an important step to minimizing detrimental effects. This paper presents the Next-Generation Smart Response Web (NG-SRW), a web-based application to aid decision making concerning oil spill response. This tool aims to provide, dynamically and interactively, relevant information on oil spills. By integrating the analysis and visualization of dynamic spill features with the sensitivity of environmental elements and value of human uses, the benefits of potential response actions can be compared, helping to develop an appropriate response strategy. The oil spill process simulation enables the response authorities to judge better the complexity and dynamic behavior of the systems and processes behind the potential environmental impact assessment and thereby better control the oil combat action.
1. Introduction
Oil transport in the Baltic Sea has grown rapidly over the last decade, the Gulf of Finland being one of the busiest oil shipping routes in the world []. The coastal waters of the Gulf of Finland also host environmentally valuable ecosystems, which face risk from heavy vessel traffic [].
Accident statistics indicate a high level of maritime safety in the Baltic Sea, and, while accidents typically result in minor consequences in terms of oil pollution [,], risks of major oil spills remain both in open water [,] and during winter [,], for example, the spill caused by the Runner-4 accident in 2006 [], which led to large oil patches drifting into the shallow waters around Tallinn with detrimental ecological and economic consequences.
Because the effectiveness of mechanical recovery is limited both in open water [] and in icy conditions [], appropriate plans and tools are needed to minimize damage to ecosystems in case of a sizeable spill. This task is arduous, because the impact of spilled oil varies significantly by shoreline type and many cleanup methods are shoreline specific []. Therefore, strategies to contain or mitigate oil spills on or near sensitive shorelines need to establish if a response is necessary, and, if so, the nature and extent of the response. These strategies also affect significantly the final cost of mitigation [].
Spatial Decision Support Systems (SDSS) play a role in almost all emergency situations including marine oil spills [,]. SDSS integrate spatial and non-spatial data, Geographic Information Systems (GIS), and decision-making algorithms to analyze emergency situations and evaluate remedial actions [].
Decision support systems (DSS) represent another aid to tactical oil spill response planning. Most DSS employ oil trajectory and weathering models to calculate how processes such as evaporation, dissolution, emulsification, dispersion, and biodegradation affect movement of oil slicks and changes in oil slick properties [,,].
It is stated [] that the mathematical and numerical formulations of oil transport, diffusion, and transformation processes together with many simplifying hypotheses and parameterizations form the basis of a new, open source Lagrangian surface oil spill model, the so-called MEDSLIK-II, based on its precursor MEDSLIK []. The MEDSLIK II is used to simulate oil slick transport and transformation processes for realistic oceanic cases, where data from satellite or drifting buoys are available for verification. The model is also coupled with operational oceanographic currents, atmospheric analyses winds, and remote sensing data for initialization [].
As a new generation of DSS for oil spill response operations and similar systems, the WITOIL DSS is based on environmental monitoring, state-of-the-art oil drift modelling, and innovative technology platforms. It is an innovative, web-based tool based on MEDSLIK-II oil spill code coupled with the operational oceanographic and atmospheric services and has been implemented to support emergency organization in the case of oil spill accidents in the Mediterranean Sea [].
Moreover, current DSS do not fully integrate with information on the intrinsic value and environmental sensitivity to oil spills, such as the probabilistic approach presented by [], or with operational models to estimate the spatial distribution of oil spills [], and an initial conceptual outline of a more integrated spill response DSS has been generated [].
This study introduces the Next-Generation Smart Response Web (NG-SRW) tool in order to alleviate the limitations of existing DSS for oil spill response planning—with particular focus in the Gulf of Finland. NG-SRW is a web-based application intended to provide a quasi-real-time dynamic assessment of the potential oil spill impact on sensitive shorelines and biological and human use resources. We examined state of the NG-SRW development, its scientific basis, conceptual framework, implementation, and future development.
2. Study Area and Intended End Users of the DSS
The Gulf of Finland hosts environmentally valuable ecosystems within the Baltic Sea while also playing a vital role in the economic and social prosperity of its adjoining countries []. Concern continues to mount regarding the detrimental effects of accidental oil spills on both the Gulf of Finland’s ecosystems and its economic and social prosperity. Consequently, national authorities around the Baltic Sea have committed to implementing a pollution response system to respond to pollution incidents that threaten the marine environment. This agreement includes engaging in contingency planning, surveillance, sharing information, and providing appropriate mutual assistance [].
In the Gulf of Finland region, this response system is operational and continues to be advanced with, for instance, the recent development of a maritime simulator for oil spill response training [] and the addition of the Mandatory Ship Reporting System in the Gulf of Finland Traffic Area (GOFREP)—established by the International Maritime Organization (IMO) [] in 2003 and in operation since 2004—to improve navigation safety to prevent accidental ship-based spills. GOFREP provides mandatory ship reporting, including identification and monitoring of vessels, strategic planning of vessel movements, and provision of navigational information and assistance in both international and national (VTS—vessel traffic services) waters within the Gulf of Finland IMO []. The mandatory ship reporting system in the Gulf of Finland is shown in Figure 1.
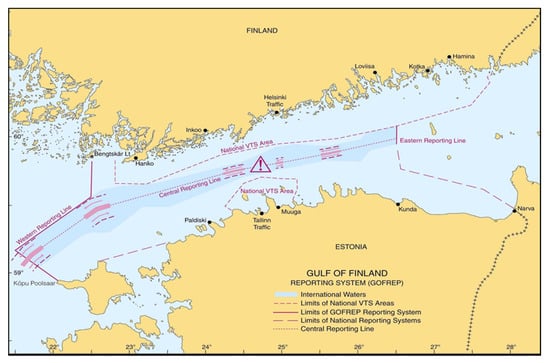
Figure 1.
The mandatory ship reporting system in the Gulf of Finland (Baltic Sea). Source: Estonian Maritime Administration.
GOFREP is managed jointly by the Finnish Transport Agency, the Estonian Maritime Administration, and the Federal Agency for Maritime and River Transport of Russian Federation and under the auspices of GOFREP Traffic Centers of Estonia (Tallinn Traffic), Finland (Helsinki Traffic), and the Russian Federation VTMIS Centre in Petrodvorets (Saint Petersburg Traffic).
The targeted end users for SDSS oil spill response are primarily the national maritime administrations responsible for oil spill response operations and the regional response secretariat. In addition, the SDSS involve VTS operators as well as stakeholders representing the societal, environmental, economic, and social interests, whose interests can be affected by oil spills. Given the numerous user types and their wide geographic locations, a web-based platform is the optimal strategy for improving oil spill response and related issues.
3. Scientific Basis
Emergency response is an integral application of SDSS application, given the urgent life-threatening nature of emergencies and their complexity. This complexity demands that modelling methods be available and usable to decision makers, especially in challenging circumstances [].
Emergency response systems demand rapid decision making, clarity of information display, and the viability for complex spatial decision making to be successful []. Oil spill impact assessment integrates risk and vulnerability, which have economic, ecological, cultural, political, geographical, and environmental consequences. The wide range of impacts suggests a modular framework for SDSS for oil spill response, i.e., that a tool should enable incorporation of one or multiple information layers with respect to the spatial impact of oil spills.
Other development needs may be more fundamental to the underlying structure of the models. For instance, increased oil transport in ice-covered waters presents the need to incorporate the complexities of dynamic sea ice into the pre-existing hydro-mechanical models []. Another example concerns the issue of changing ecosystems due to direct human activities [] and climate change [].
Stakeholder participation is considered crucial for sustainable development in natural resource and disaster risk management []. As such, participatory modelling (PM) is an interactive and iterative process in which stakeholder involvement is supported with modelling and communication tools. PM involves not only the development and use of computer-based models, but also the participation of stakeholders in the decision-making process.
SDSS help policymakers and stakeholders access to interpret and understand information in order to identify possible strategies in the decision-making process []. However, because intended users sometimes fail to embrace SDSS, it has been suggested that SDSS should incorporate social aspects involved in SDSS design, development, testing, and use. Socio-psychological aspects of the use of SDSS in creating common operational pictures are also important, concerning, for instance, information overload and the suitability of different communication methods to convey the information in the SDSS [].
4. Oil Spill Emergency Response: Conceptual Framework
It is stated [] that “oil spill response is an extremely complex and challenging cross-disciplinary activity. In the decision-making process, it combines a wide range of issues and activities under emergency conditions that include the nature of the material spilled, changes in physical and chemical properties (weathering) and biodegradation, local environmental conditions, sensitivity of impacted natural resources, and effectiveness of response/clean-up technologies”.
As a complex, dynamic, and distributed operation, oil spill response involves multiple actors [].
Referring to the work by [] and Figure 2, the scope of emergency oil spill response SDSS usually covers the short-term predictions of spill behavior and movement for tactical response planning and marine and coastal impacts, usually restricted to acute ecosystem impacts. Hence, based on a review by [], it was found that most SDSS focus on the elements 1B, 2A, and 3A, whereas some tools also consider elements 1A and 2B as a part of the tools.
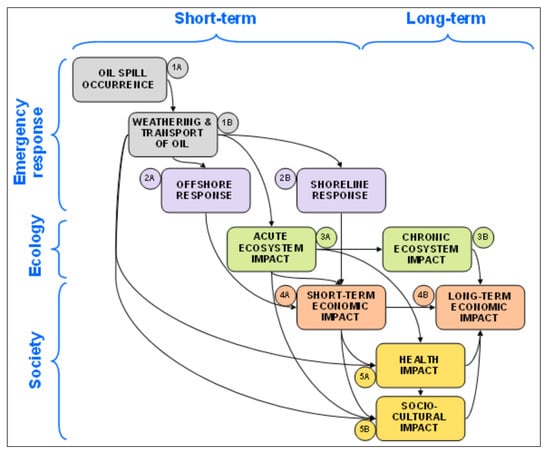
Figure 2.
Framework for classifying oil spill response and impacts (adapted from []).
Referring to IPIECA 2005 report [], “once oil has been spilled, urgent decisions need to be made about the options available for clean-up, so that environmental and socioeconomic impacts are kept to the minimum. Getting the correct balance is always a difficult process and conflicts inevitably arise which need to be resolved in the best practicable manner. The advantages and disadvantages of different responses need to be weighed up and compared both with each other and with the advantages and disadvantages of natural clean-up, a process sometimes known as Net Environmental Benefit Analysis (NEBA)”. NEBA is one of the considerations used to select spill response equipment that will effectively remove oil, are feasible to use safely in particular conditions, and will minimize the impact of the spill on the environment.
To support NEBA, knowledge about the marine and coastal ecosystem and human use values is required for a decision maker. Environmental Sensitivity Index (ESI) maps have been an integral component of oil-spill contingency planning and response in the United States since 1979, serving as a quick reference for oil spill responders []. The ESI maps rank shorelines into 10 classes in relation to sensitivity, natural persistence of oil, and ease of cleanup. They also provide information on coastal biological and human-use resources sensitive to oil spills.
The ESI framework was developed to reduce the environmental consequences of a spill and to help prioritize the placement and allocation of resources during cleanup efforts []. One of the primary objectives of oil spill planning and response, after protecting human life, is to reduce the environmental consequences of the spill and the cleanup efforts. This objective is best achieved if the location of sensitive resources are identified in advance.
Some countries outside the US have adopted the ESI approach to classify their own shorelines for similar oil spill contingency planning. Within a Gulf of Finland context, the resulting maps are referred to as Regional Environmental Sensitivity Index (RESI) maps []. Shores cannot be handled as static systems, implying that shore classification systems, including ESI and RESI classifications, must take into account the shore dynamics [].
In the Baltic Sea context, the Bayesian inference to oil spill-related situation assessment is used in order to facilitate the NEBA-based decisions in selecting the best available oil spill response alternative and in evaluating the threat or probable overall environmental impact of the spill [,].
5. Common Situational Awareness for Oil Spill Response Operations: Architecture and Implementation of the NG-SRW
5.1. Next-Generation Smart Response Web (NG-SRW)
The NG-SRW application is based on operational concepts and technical implementations for user-defined Common Situational Awareness (CSA) []. The tool addresses oil spill occurrence (phase 1A, see Figure 2), weathering and transport of oil (1B), offshore response (2A), shoreline response (2B), acute ecosystem impact (3A), short-term economic impact (4A), and socio-cultural impact (5B). Specifically, the tool aims to utilize CSA in an online operational environment, by utilizing all available information into the decision-making process.
The NG-SRW was developed and implemented as an information collecting and sharing facility of the CSA system []. The basic configuration of the NG-SRW SDSS application is presented in Figure 3. NG-SRW directly interacts with Seatrack Web [] in Sweden, and the user can define the area of response and the type and quantity of leaked oil. Seatrack Web uses that info with real-time weather data to predict oil spill trajectory in the marine environment and inform the user where an oil spill could spread in the coming hours through the NG-SRW application. Furthermore, NG-SRW contains additional data layers such as coastal vulnerability, nature assets in the marine environments, its vulnerability, and human uses, which can be observed with overlay analysis to predict oil spill spread and avoid oil spills in sensitive marine areas. Such prioritization is required because, in the case of a more significant oil spill, we will be likely unable to act and clean all the affected marine areas. As such, we need to select areas that are sensitive to oil pollution and where large amounts of oil accumulate. The user can also switch on and off some data layers in the web application, and the application calculates summary statistics with associated oil spill polygon.
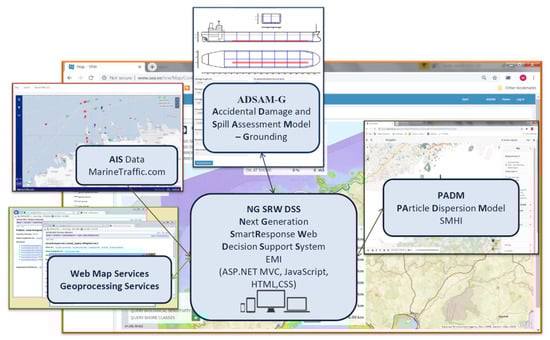
Figure 3.
Basic configuration of the NG-SRW application.
The tool employs the NET MVC with MS SQL database engine, JavaScript, ESRI ArcGIS API for JavaScript, ESRI ArcGIS Server and ArcInfo, HTML5, and CSS technologies, allowing its use on any device with Windows, iOS, or Android operating systems. The Single Page Application (SPA) allows users to interact dynamically with all controls, data, and elements on a single page, without the need to reload the page after each action.
The NG-SRW tool consists of Server and Client/User Interface. The GIS data are prepared, analyzed, and stored in the geodatabase with ArcGIS Desktop and Python scripts. ArcGIS Server is used to share GIS data as Web Map Services (WMS) and the Geoprocessing tool Services. Auxiliary tables store oil spill model results, information on WMS layers, model parameters, and user interface tables based on MS SQL database. WMSs are portrayed with ESRI ArcGIS API for Javascript. User interface implemented on the client side supports execution of the relevant geoprocessing services.
Initially, NG-SRW connects to the ADSAM-G module [], which provides initial information on the magnitude of accident damage and the extent of an oil spill resulting from a shipping accident. Subsequently, NG-SRW accesses the Seatrack Web application through direct connection to Particle Dispersion Model (PADM) [], which enables independent analysis of spill drift and weathering by providing its own user interface for calculation of oil spill scenarios. Thus, NG-SRW SDSS takes advantage of the development of calculation kernel of Seatrack Web, which, in the current version, includes recent improvements of the ice code [] but presents it within a different user interface.
MarineTraffic.com provides real-time Automatic Information System (AIS) information, such as the current position, speed, and direction of vessels. Necessary basic information on the size of vessels is obtainable for use in the ADSAM-G model. In addition, there are lights’, stations’, and ports, databases. All necessary information is readily obtained from the MarineTraffic map, which is embedded into NG-SRW. The NG-SRW SDSS platform is also linked to Environmental Sensitivity Index (ESI) map layers, implemented through the imported Web Map Services (WMS).
NG-SRW serves as a platform that collects and enables interaction with different streams of oil spill response-related online information [], by which authorities can access, filter, visualize, and share information collected during an emergency response, as shown in Figure 4.
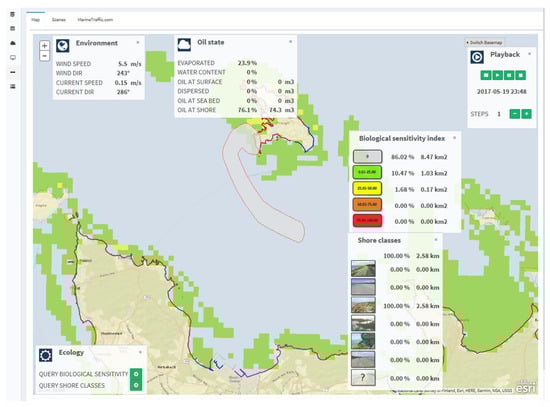
Figure 4.
NG-SRW application enables the integration of spill monitoring and evaluation functions directly into oil spill preparedness and response management processes.
Users control the content to be included in and excluded from an oil spill response scenario, thereby allowing users to select a set of criteria to address a particular oil spill accident response unit according to their needs. This ability is essential to cater to the different decision makers and stakeholders [].
5.2. Seatrack Web (STW)
The Seatrack Web is a fully operational, web-based, oil drift forecasting system for the Baltic and part of the North Sea [], which allows users to simulate an oil drift on the server with the results displayed on their computer within a minute. The server has access to the most recent weather and ocean forecasts, thereby providing the user the optimal decision tool to assess oil spills. The oil weathering and transport data are simulated by the STW PADM [], which includes the latest ice code improvements []. The Seatrack Web oil drift calculation system is the official HELCOM drift model/forecasting and hindcasting system used by national authorities and research organizations to simulate oil spills [].
Seatrack Web is used to predict the location of oil spills after some hours, thereby enabling optimal allocation of oil recovery equipment and shoreline protection. As such, STW addresses 1A oil spill occurrence and weathering and transport of oil (phases 1A and 1B, Figure 2) of oil spill response. Future development of Seatrack Web would see improvement of the interaction between oil and complex, dynamic ice conditions, in particular, ridges and the movement of oil under the ice sheet, as well as refinement to the display of model and parameter uncertainties [].
5.3. Accidental Damage and Spill Assessment Model—Grounding (ADSAM-G)
ADSAM-G is an online platform to assess rapid oil outflow from grounded tankers [], which addresses oil spill occurrence (Phase 1A, Figure 2). ADSAM-G incorporates tanker size and configuration (as accessible from AIS) to estimate the amount and duration of oil leakage by inputs of the size of the rupture and load. This information is integrated with impact conditions, including vessel speed and bottom profile.
Currently, for ADSAM-G to oil tankers and leaks from vessel grounding, future development will see inclusion of other types of vessels and collision. In addition, oil outflow calculations are rather simple; refinement is needed to include the effects of wave action and currents [].
5.4. Environmental Sensitivity Index (ESI) Map Layers
Mapping of the environment sensitivity to accidental oil pollution is vital to oil pollution preparedness, response, and cooperation. Referring to NOAA 2002 report [], Environmental Sensitivity Index (ESI) maps provide information on shoreline classification (ranked according to sensitivity, natural persistence of oil, and ease of cleanup), biological resources (an assessment of the vulnerability of organisms to oil), and human-use resources (an assessment of sensitivity to oil and value from human use).
NG-SRW uses ESI maps as a visual background for the results of the simulations based on ADSAM-G and STW. As such, this application is of universal use to the geographical area concerned. GIS data are stored on a GIS server in the MS SQL Server geo-database and shared as Web Map Services (WMS). The ESI maps currently available for NG-SRW are for Baltic Sea areas under Estonian jurisdiction.
6. Discussion
The proposal of a new DSS demands consideration of its expected effectiveness in practical response operations []. This effectiveness is difficult to assess because maritime oil spills are rare and because the large range of conceivable scenarios limit quality of assessment information. A comprehensive evaluation of the performance of the SDSS is, therefore, not yet available. However, current assessment is positive.
First, the development of the NG-SRW is rooted in the theoretical basis of SDSS, recognizing the importance of CSA in a dynamic context of decision makers, actors, and stakeholders. Furthermore, the components of NG-SRW have been used extensively by different users in a variety of contexts. For instance, the PADM model as implemented in STW is the operational tool for oil spill drift in the Baltic Sea as recommended by HELCOM [], and AIS data are used extensively for navigation support and real-time situational awareness of shipping activity []. Finally, a preliminary test of the integrated NS-SRW tool has been executed in a stakeholder workshop with maritime professionals []. Results indicate that the tool may be useful for specific organizations and that it is relatively easy to understand and use.
While the current implementation of the NG-SRW is considered a significant step forward in NEBA-based oil spill response, addressing NG-SRW’s limitations is important both for preventing over-reliance on the tool and for guiding future research and development. NG-SRW is based largely on distributed databases and the imported Web Map Services (WMS). Therefore, NG-SRW is usable in numerous geographical areas and can complement most national or regional accidental oil spill response systems. However, the lack of harmonized ESI/RESI map layers limits wider and cross-border application of the NG-SRW. Incorporation of harmonized ESI/RESI maps for the whole Baltic Sea region is necessary for future development.
A dynamic CSA that identifies shorelines sensitive to oil spills is critical in determining the kind and extent of response that may be appropriate. These choices ultimately dictate cleanup costs. Therefore, Baltic Sea ESI/RESI maps are needed that display detailed ecological and socio-economic values of shorelines and coastal waters. In addition, NG-SRW would improve if maps were incorporated that assess response performance under specific meteorological and sea ice conditions.
Finally, the functionality and effectiveness of the NG-SRW need to be evaluated in simulation-based testing, response training exercises, and in real operations. Simulation-based testing would serve as the first approach, e.g., using cross-border simulator environments []. Further evaluation could then be focused on genuine exercises, which would examine the social context of the emergency response, the interactions of end users with NG-SRW, and how NG-SRW supports wider communication and information exchange []. Importantly, the current application does not include the use of Satellite Aperture Radar and other remote sensing data. However, in the future, a broader range of information sources both at model training and product validation stage may further improve the functioning of the NG-SRW. Such research can inform design updates that consider human–machine interaction issues, team resource management, and the development of learning-oriented training programs.
7. Conclusions
This study introduced NG-SRW for building common situational awareness, providing a quasi-real-time dynamic assessment of the potential oil spill impact on sensitive shorelines, ecological values, and the human use areas. However, the SG-SRW system has yet to be practically tested in case of a future oil spill. NG-SRW enables authorities then to better simulate the complexity and dynamic behavior of the systems and processes underlying ecological risk assessment and thereby undertake oil spill mitigation more effectively. As a platform for creating a shared situational awareness, the tool also has possible use for VTS operators and it can be used in strategic pollution preparedness and response risk management.
Implementing the oil spill process simulation as an element of the NEBA processes also ensures continuous information feedback in addressing response operations, i.e., the expected drift and fate of the spilled oil, the feasibility of mitigation at sea, and the potential threat to sensitive resources.
While NG-SRW is currently operational only in Estonian marine and coastal areas and needs further evaluation and refinement, it can be used to minimize harmful effects of marine oil spills outside this area.
Author Contributions
Conceptualization, M.F., R.A., and J.K.; methodology, M.F., R.A., F.G., J.K., and P.K.; software, M.F.; investigation, M.F., R.A., F.G., and J.K.; writing—original draft preparation, M.F.; writing—review and editing, R.A., J.K., F.G., R.S.-K., and H.J.; supervision, P.K.; project administration, F.G. and P.K.; funding acquisition, F.G., J.K., and P.K. All authors have read and agreed to the published version of the manuscript.
Funding
The work presented in this article was performed in the project BONUS BALTIMARI, which has received funding from BONUS (Art. 185), funded jointly by the EU, the Academy of Finland, and the Estonian Research Council and from the Estonia-Russia Cross Border Cooperation Programme project “Adrienne”. The contributions by the third author were, in part, supported by the project ‘Safe Navigation and Environmental Protection’, funded by the Ocean Frontier Institute.
Conflicts of Interest
The authors declare that they have no known competing financial interests or personal relationships that could have appeared to influence the work reported in this paper.
References
- HELCOM. Assessment on Maritime Activities in the Baltic Sea 2018. Baltic Sea Environment Proceedings No. 152; Helsinki Commission: Helsinki, Finland, 2018; 253p. [Google Scholar]
- Sonninen, S.; Nuutinen, M.; Rosqvist, T. Development Process of the Gulf of Finland Mandatory Ship Reporting System—Reflections on the Methods; VTT Publications 614: Espoo, Finland, 2006. [Google Scholar]
- Goerlandt, F.; Goite, H.; Valdez, B.O.A.; Höglund, A.; Ahonen-Rainio, P.; Lensu, M. An analysis of wintertime navigational systems in the Northern Baltic Sea. Saf. Sci. 2017, 92, 66–84. [Google Scholar] [CrossRef]
- Goerlandt, F.; Montewka, J. A framework for risk analysis of maritime transportation systems: A case study for oil spill from tankers in a ship–ship collision. Saf. Sci. 2015, 76, 42–66. [Google Scholar] [CrossRef]
- Helle, I.; Ahtiainen, H.; Luomaa, E.; Hänninen, M.; Kuikka, S. A probabilistic approach for a cost-benefit analysis of oil spill management under uncertainty: A Bayesian network model for the Gulf of Finland. J. Environ. Manag. 2015, 158, 122–132. [Google Scholar] [CrossRef] [PubMed]
- Valdez, B.O.A.; Goerlandt, F.; Kuzmin, V.; Kujalaa, P.; Montewka, J. Risk management model of winter navigation operations. Mar. Pollut. Bull. 2016, 108, 242–262. [Google Scholar] [CrossRef]
- Valdez, B.O.A.; Goerlandt, F.; Montewka, J.; Kujala, P. A risk analysis of winter navigation in Finnish sea areas. Accid. Anal. Prev. 2015, 79, 100–116. [Google Scholar] [CrossRef] [PubMed]
- Wang, K.; Leppäranta, M.; Gästgifvars, M.; Vainio, J.; Wang, C. The drift and spreading of the Runner 4 oil spill and the ice conditions in the Gulf of Finland, winter 2006. Est. J. Earth Sci. 2008, 57, 181–191. [Google Scholar] [CrossRef]
- Lehikoinen, A.; Luoma, E.; Mäntyniemi, S.; Kuikka, S. Optimizing the Recovery Efficiency of Finnish Oil Combating Vessels in the Gulf of Finland Using Bayesian Networks. Environ. Sci. Technol. 2013, 47, 1792–1799. [Google Scholar] [CrossRef] [PubMed]
- Lu, L.; Goerlandt, F.; Valdez, B.O.A.; Kujalaa, P.; Höglund, A.; Arneborg, L. A Bayesian Network risk model for assessing oil spill recovery effectiveness in the ice-covered Northern Baltic Sea. Mar. Pollut. Bull. 2019, 139, 440–458. [Google Scholar] [CrossRef]
- Environmental Sensitivity Index Guidelines, Version 3; NOAA Technical Memorandum Nos OR&R 11; Hazardous Materials Response Division, National Ocean Service: Seattle, WA, USA, 2002.
- Montewka, J.; Weckström, M.; Kujala, P. A probabilistic model estimating oil spill clean-up costs—A case study for the Gulf of Finland. Mar. Pollut. Bull. 2013, 76, 61–71. [Google Scholar] [CrossRef]
- Pourvakhshouri, S.Z.; Mansor, S. Decision support system in oil spill cases (literature review). Disaster Prev. Manag. 2003, 12, 217–221. [Google Scholar] [CrossRef]
- Pourvakhshouri, S.Z.; Shattri, B.M.; Zelina, Z.I.; Noordin, A. Decision support system in oil spill management. In Proceedings of the ISPRS Technical Commission II Symposium, Vienna, Austria, 12–14 July 2006; pp. 93–96. [Google Scholar]
- Keenan, P.B.; Jankowski, P. Spatial Decision Support Systems: Three decades on. Decis. Support Syst. 2019, 116, 64–76. [Google Scholar] [CrossRef]
- Li, P.; Cai, Q.; Lin, W.; Chen, B.; Zhang, B. Offshore oil spill response practices and emerging challenges. Mar. Pollut. Bull. 2016, 110, 6–27. [Google Scholar] [CrossRef] [PubMed]
- Ciappa, A.C. Reverse trajectory study of oil spill risk in Cyclades Islands of the Aegean Sea. Reg. Stud. Mar. Sci. 2021, 41, 101580. [Google Scholar] [CrossRef]
- Amir-Heidari, P.; Raie, M. Response planning for accidental oil spills in Persian Gulf: A decision support system (DSS) based on consequence modeling. Mar. Pollut. Bull. 2019, 140, 116–128. [Google Scholar] [CrossRef] [PubMed]
- De Dominicis, M.; Pinardi, N.; Zodiatis, G.; Lardner, R. MEDSLIK-II, a Lagrangian marine surface oil spill model for short-term forecasting—Part 1: Theory. Geosci. Model Dev. 2013, 6, 1851–1869. [Google Scholar] [CrossRef]
- Zodiatis, G.; Lardner, R.; Hayes, D.; Georgiou, G.; Pinardi, N.; De Dominicis, M.; Panayidou, X. The Mediterranean oil spill and trajectory prediction model in assisting the EU response agencies. In Proceedings of the Congreso Nacional de Salvamento en la Mar, Cadiz, Spain, 2–4 October 2008; pp. 535–547. [Google Scholar]
- De Dominicis, M.; Pinardi, N.; Zodiatis, G.; Archetti, R. MEDSLIK-II, a Lagrangian marine surface oil spill model for short-term forecasting—Part 2: Numerical simulations and validations. Geosci. Model Dev. 2013, 6, 1871–1888. [Google Scholar] [CrossRef]
- Liubartseva, S.; Coppini, G.; Pinardi, N.; De Dominicis, M.; Lecci, R.; Turrisi, G.; Cretì, S.; Martinelli, S.; Agostini, P.; Marra, P.; et al. Decision support system for emergency management of oil spill accidents in the Mediterranean Sea. Nat. Hazards Earth Syst. Sci. 2016, 16, 2009–2020. [Google Scholar] [CrossRef]
- Kokkonen, T.; Ihaksi, T.; Jolmaa, A.; Kuikka, S. Dynamic mapping of nature values to support prioritization of coastal oil combating. Environ. Model. Softw. 2010, 25, 248–257. [Google Scholar] [CrossRef]
- Haapasaari, P.; Dahlbo, K.; Aps, R.; Brunila, O.-P.; Fransas, A.; Goerlandt, F.; Hänninen, M.; Jönsson, A.; Laurila-Pant, M.; Lehikoinen, A.; et al. Minimizing Risks of Maritime Oil Transport by Holistic Safety Strategies (MIMIC); Kotka Maritime Research Centre, Merikotka: Kotka, Finland, 2014; 64p. [Google Scholar]
- Aps, R.; Tõnisson, H.; Suursaar, Ü.; Orviku, K. Regional Environmental Sensitivity Index (RESI) Classification of Estonian Shoreline (Baltic Sea). J. Coast. Res. 2016, 75, 972–976. [Google Scholar] [CrossRef]
- HELCOM. Convention on the Protection of the Marine Environment of the Baltic Sea Area, 1992 (Helsinki Convention); as amended; HELCOM: Helsinki, Finland, 2013. [Google Scholar]
- Halonen, J.; Lanki, A. Efficiency of maritime simulator training in oil spill response competence development. TransNav Int. J. Mar. Navig. Saf. Sea Transp. 2019, 13, 199–204. [Google Scholar] [CrossRef]
- IMO. Mandatory Ship Reporting Systems; International Maritime Organization: London, UK, 2003. [Google Scholar]
- IMO. Mandatory Ship Reporting Systems. SN. 1/Circ. 258; International Maritime Organization: London, UK, 2006. [Google Scholar]
- Andrienko, G.; Andrienko, N.; Jankowski, P.; Keim, D.; Kraak, M.J.; MacEachren, A.; Wrobel, S. Geovisual analytics for spatial decision support: Setting the research agenda. Int. J. Geogr. Inf. Sci. 2007, 21, 839–857. [Google Scholar] [CrossRef]
- Arneborg, L.; Höglund, A.; Axell, L.; Lensu, M.; Liungman, O.; Mattsson, J. Oil drift modelling in pack ice: Sensitivity to oil-in-ice parameters. Ocean Eng. 2017, 144, 340–350. [Google Scholar] [CrossRef]
- Raudsepp, U.; Laanemets, J.; Maljutenko, I.; Hongisto, M.; Jalkanen, J.-P. Impact of ship-borne nitrogen deposition on the Gulf of Finland ecosystem: An evaluation. Oceanologia 2013, 55, 837–857. [Google Scholar] [CrossRef]
- Isaev, A.V.; Eremina, T.R.; Ryabchenko, V.A.; Savchuk, O.P. Model estimates of the impact of bioirrigation activity of Marenzelleria spp. on the Gulf of Finland ecosystem in a changing climate. J. Mar. Sys. 2017, 171, 81–88. [Google Scholar] [CrossRef]
- Hedelin, B.; Evers, M.; Alkan-Olsson, J.; Jonsson, A. Participatory modelling for sustainable development: Key issues derived from five cases of natural resource and disaster risk management. Environ. Sci. Policy 2017, 76, 185–196. [Google Scholar] [CrossRef]
- Rodel, R.; Bregt, A.K.; Ligtenberg, A.; Pérez-Soba, M.; Verweij, P. The social side of spatial decision support systems: Investigating knowledge integration and learning. Environ. Sci. Policy 2017, 76, 177–184. [Google Scholar] [CrossRef]
- Luokkala, P.; Nikander, J.; Korpi, J.; Virrantaus, K.; Torkki, P. Developing a concept of a context-aware operational picture. Saf. Sci. 2017, 93, 277–295. [Google Scholar] [CrossRef]
- Ivshina, I.B.; Kuyukina, M.S.; Krivoruchko, A.V.; Elkin, A.A.; Makarov, S.O.; Cunningham, C.J.; Peshkur, T.A.; Ronald, M.; Atlasd, R.M.; Philp, J.C. Oil spill problems and sustainable response strategies through new technologies. Environ. Sci. Process. Impacts 2015, 17, 1201–1219. [Google Scholar] [CrossRef]
- Luokkala, P.; Virrantaus, K. Developing information systems to support situational awareness and interaction in time-pressuring crisis situations. Saf. Sci. 2014, 63, 191–203. [Google Scholar] [CrossRef]
- Chang, S.E.; Stone, J.; Demes, K.; Piscitelli, M. Consequences of oil spills: A review and framework for informing planning. Ecol. Soc. 2014, 19, 26. [Google Scholar] [CrossRef]
- IPIECA. Choosing Spill Response Options to Minimize Damage: Net Environmental Benefit Analysis; (IPIECA Report Series, 10); International Petroleum Industry Environmental Conservation Association: London, UK, 2015. [Google Scholar]
- Jensen, J.R.; Halls, J.N.; Michel, J. A Systems Approach to Environmental Sensitivity lndex (ESI) Mapping for Oil Spill Contingency Planning and Response. PE RS 1998, 64, 1003–1014. [Google Scholar]
- Aps, R.; Tõnisson, H.; Anfuso, G.; Perales, J.A.; Orviku, K.; Suursaar, Ü. Incorporating dynamics factor to the Environmental Sensitivity Index (ESI) shoreline classification—Estonian and Spanish example. J. Coast. Res. 2014, 70, 235–240. [Google Scholar] [CrossRef]
- Aps, R.; Herkül, K.; Kotta, J.; Kotta, I.; Kopti, M.; Leiger, R.; Mander, Ü.; Suursaar, Ü. Bayesian inference for oil spill related Net Environmental Benefit Analysis. In Coastal Processes; Brebbia, C., Benassai, G., Rodriguez, G., Eds.; WIT Press: Southampton, UK; Boston, MA, USA, 2009; pp. 235–246. [Google Scholar]
- Aps, R.; Fetissov, M.; Herkül, K.; Kotta, J.; Leiger, R.; Mander, Ü.; Suursaar, Ü. Bayesian inference for predicting potential oil spill related ecological risk. In Safety and Security Engineering; Guarascio, M., Brebbia, C.A., Garzia, F., Eds.; WIT Press: Southampton, UK, 2009; pp. 149–159. [Google Scholar]
- Aps, R.; Fetissov, M.; Goerlandt, F.; Kopti, M.; Kujala, P. STAMP—Mar based safety management of maritime navigation in the Gulf of Finland (Baltic Sea). In Proceedings of the European Navigation Conference, Helsinki, Finland, 30 May–2 June 2016; pp. 1–8. [Google Scholar]
- Ambjörn, C.; Liungman, O.; Mattsson, J.; Håkansson, B. Seatrack Web: The HELCOM Tool for Oil Spill Prediction and Identification of Illegal Polluters. In Oil Pollution in the Baltic Sea. The Handbook of Environmental Chemistry; Kostianoy, A., Lavrova, O., Eds.; Springer: Berlin/Heidelberg, Germany, 2011; Volume 27, pp. 155–184. [Google Scholar]
- HELCOM. Openrisk Guideline for Regional Risk Management to Improve European Preparedness and Response at Sea; HELCOM: Helsinki, Finland, 2018. [Google Scholar]
- Ambjorn, C. SeatrackWeb, forecasts of oil spills, a new version. In Proceedings of the 2006 IEEE US/EU Baltic International Symposium, Klaipeda, Lithuania, 23–26 May 2006. [Google Scholar]
- HELCOM. HELCOM STW Oil Drift Modelling; HELCOM: Helsinki, Finland, 2020. [Google Scholar]
- Nordström, J.; Goerlandt, F.; Sarsama, J.; Leppänen, P.; Nissilä, M.; Ruponen, P.; Lubcke, T.; Sonninen, S. Vessel TRIAGE: A method for assessing and communicating the safety status in maritime distress situations. Saf. Sci. 2016, 85, 117–129. [Google Scholar] [CrossRef]
- Fournier, M.; Hilliard, R.C.; Rezaee, S.; Pelot, R. Past, present, and future of the satellite-based automatic identification system: Areas of applications (2004–2016). WMU J. Marit. Aff. 2018, 17, 311–345. [Google Scholar] [CrossRef]
- Goerlandt, F.; Laine, V.; Bal Beşikçi, E.; Baldauf, M.; Al-Quhali, M.A.; Koldenhof, Y. End-user and stakeholder views on selected risk assessment tools for marine oil spill preparedness and response, including future research and development needs. TransNav 2019, 13, 213–220. [Google Scholar] [CrossRef]
Publisher’s Note: MDPI stays neutral with regard to jurisdictional claims in published maps and institutional affiliations. |
© 2021 by the authors. Licensee MDPI, Basel, Switzerland. This article is an open access article distributed under the terms and conditions of the Creative Commons Attribution (CC BY) license (https://creativecommons.org/licenses/by/4.0/).