Article

Identifying the Source of Heavy Metal Pollution and Apportionment in Agricultural Soils Impacted by Different Smelters in China by the Positive Matrix Factorization Model and the Pb Isotope Ratio Method

1
Key Laboratory of Pollution Ecology and Environmental Engineering, Institute of Applied Ecology, Chinese Academy of Sciences, Shenyang 110016, China
2
School of Chemical Engineering, Shenyang University of Chemical Technology, Shenyang 110142, China
3
Liaoning Engineering Technology Research Center of Agricultural Products Quality and Environment Safety Control, Shenyang 110016, China
*
Author to whom correspondence should be addressed.
Sustainability 2021, 13(12), 6526; https://doi.org/10.3390/su13126526
Submission received: 19 April 2021 / Revised: 22 May 2021 / Accepted: 1 June 2021 / Published: 8 June 2021
(This article belongs to the Section Environmental Sustainability and Applications)

Abstract

:
In this study, the agricultural soil around Zhuzhou Smelter in Zhuzhou district, Hunan, China and Huludao Zinc Plant in Huludao district, Liaoning, China was selected as the research area to discuss the current situation of heavy metal pollution in the surrounding agricultural soil caused by different smelting plants for soil environmental management and sustainable development of soil resources. Eight elements’ (Cd, Pb, As, Hg, Cr, Ni, Cu, and Zn) contents were measured to assess their pollution risk level and spatial distribution distinction. Correlation analysis, the positive matrix factorization (PMF), and Pb isotope ratio method were employed to analyze the sources of soil heavy metal pollution in the research area. The contents of Cd, Pb, Hg, and Zn in the soil of the two research areas were seriously polluted, and the changes of their spatial content were related to the migration and sedimentation of the smelter waste gas. Four types of pollution sources, including the smelting source, agricultural sources, natural sources, and mixed sources of industrial activity and traffic were identified in both areas by PMF, and the contribution rates of the four pollution sources in both areas were similar. Taking the agricultural soil around Huludao Zinc Plant as an example, the contribution rates of the different pollution sources analyzed by Pb isotope ratio method were the lead smelting source (43.7%), followed by the agricultural source (34.6%), traffic source (14.2%), and natural source (7.5%), which were basically consistent with that of PMF analysis, verifying the reliability of the two methods. The results above showed that the smelters were the main cause of heavy metal pollution in agricultural soils around the two research areas, and the analysis results of element content ratio and smelting source characteristic element contribution rate ratio could provide reference for the analysis of heavy metal pollution in agricultural soil around smelters for soil pollution control decision making.

1. Introduction

Human activities such as mining production, metal smelting and sewage irrigation lead to heavy metal pollution in a huge amount of soil in agricultural areas [1,2,3]. Studies have shown that about 82% of contaminated agricultural soil in China contains excessive heavy metals (e.g., As, Cd, Hg, and Pb) [4]. It is clear that high heavy metal contamination of agricultural soil poses a threat to food safety and human health [5,6,7]. The causes of heavy metal pollution in soil have two sources: natural sources and human activities; the natural sources are influenced by the parent materials in the soil, while human activities are becoming more complex with increasing urbanization and industrialization [8]. Therefore, the issue of heavy metal pollution related to human activities is even more complex. Although the pollution status of heavy metals in agricultural soil has worsened due to industrial modernization and human activities, the source and transformation mechanism of heavy metals in agricultural soil are still not clear. To provide a basis for efficient and scientific prevention and control of heavy metal pollution in soil for soil environmental management and sustainable development, it is necessary to analyze the sources of heavy metal in agricultural soil to clarify the pollution path and contribution rates of different pollution sources. Positive matrix factorization (PMF) and isotope ratio method are commonly used in soil heavy metal source analysis [9,10]. PMF can simplify the high-dimensional variables by using the correlation matrix and covariance matrix and transform them into several comprehensive factors, which does not need detailed source component spectrum information; it can also deal with missing and imprecise data and makes non-negative constraints on the factorization matrix, so that the source component spectrum and source contribution rate will not be negative [11]. Dong et al., (2015) applied the PMF model to explore the main sources of heavy metals in farmland soil in the suburbs of Nanjing and concluded the four pollution sources as the dust source (33.0%), agricultural source (30.8%), industrial source (25.4%) and natural source (10.8%), respectively [12]. The isotope ratio method, which measures specific isotopic composition in different pollution sources, is also successfully used to identify sources of pollution due to its stable physical and chemical properties [13]. Among them, the Pb isotope ratio method is considered reliable for source analysis [14,15,16] due to the fact that Pb source has its own specific isotopic composition [17,18]. Han et al. (2017) analyzed the riparian soil samples of four different land use types, i.e., woodland, grassland, recreational land, and wasteland by 208Pb/207Pb and 206Pb/207Pb ratio, suggesting that the Pb value of soil was approximate to that of coal combustion, thus determining that coal combustion was the main manmade source of Pb [19].
Zhuzhou Smelter and Huludao Zinc Plant are both important local economic smelting enterprises. According to statistics, Zhuzhou Smelter emitted about 34 tons of toxic heavy metals such as Hg, As, Cd, and Pd per year, accounting for more than 90% of the whole toxic heavy metal emissions in Zhuzhou, and it also accumulated about 2 × 10⁶ tons of smelting waste [20]. Huludao Zinc Plant emitted about 747.66 tons of Cd through soot, which is equivalent to the annual Cd average of 24.12 tons [21]. These emissions spread through atmospheric migration with the pollution source as the center, which could cause heavy metal pollution in agricultural soils around the Zhuzhou and Huludao smelters. The agricultural soil around Zhuzhou Smelter was polluted by Cd, Pb, and Zn, among which Cd pollution was the most serious [22], and for agricultural soil around Huludao Zinc Plant, Zn, Pb, Cd, and Hg pollution were more serious [23,24]. A number of previous studies on soil heavy metal pollution at Huludao Zinc Plant mostly focused on the spatial distribution and risk assessment of heavy metals. Li et al., (2006) analyzed and explained the spatial variability of soil Pb around Huludao Zinc Plant [23]; Chang et al., (2017) studied the pollution level of major heavy metals in the soil around Huludao Zinc Plant and used the potential ecological risk index method and the geoaccumulation index method to assess the risk of heavy metal pollution [25]. There are few studies on the sources of heavy metal pollution in the soil around Zhuzhou Smelter and the conclusions are contradictory. Zhang (2019) classified the traffic source as the main pollution source of Pb in farmland soil around Zhuzhou Smelter by PMF [26], while Zhao et al., (2020) found that the main pollution source of Pb in farmland soil around Zhuzhou Smelter was smelting flue dust by using 206Pb/207Pb and 208Pb/206Pb ratios [27]. Herein, eight elements’ (Cd, Pb, As, Hg, Cr, Ni, Cu and Zn) contents in the agricultural soil around Zhuzhou Smelter and Huludao Zinc Plant were measured to analyze their pollution level and spatial distribution distinction, and the sources of heavy metals were preliminarily determined by Spearman’s correlation coefficient analysis [28]. After analyzing the soil heavy metals in the research areas by PMF and the Pb isotope ratio method, the main pollution sources and corresponding contribution rates were explored. The element content ratio and the smelting source characteristic element contribution ratio were also obtained to provide a reference basis for the pollution characteristics of heavy metals in agricultural soil around the smelter.

2. Materials and Methods

2.1. Research Area

Zhuzhou Smelter (113.017° E~113.055° E and 27.527° N~27.878° N), built in 1956, is located in the southwest of Zhuzhou City, which has a total area of 1.73 × 10⁶ m2. As one of the largest smelters in China, its scope of business includes the production of Zn, Pb, and their alloys; recovering of rare or precious metals such as Cu, Au, and Cd and producing high purity metal products; using zinc hydrometallurgy; and zinc and lead smelting with a closed blast furnace. The climate of the research area is a subtropical humid monsoon climate, which has an annual average temperature of 16–18 °C, four distinct seasons, abundant rainfall, and sufficient light and heat. The predominant wind direction in winter is northwest, while in summer, it is due south. The soil types there are red loam and purple soil, which are suitable for the growth of many kinds of crops; at present the main crops grown in this area include wheat and rice [29].
Huludao Zinc Plant (120.877° E~120.937° E and 40.728° N~40.857° N), built in 1937, is located in the southeast of Huludao City, about 8 hm2. As the largest zinc smelter in Asia, with an annual output of 33,000 t [30,31], its business scope includes the production of heavy metals such as Cu, Zn, Pb, and Cd, using vertical pot zinc smelting, zinc hydrometallurgy, zinc smelting with a closed blast furnace, etc. The climate is a warm temperate subhumid monsoon climate, which has an annual average maximum temperature of 14.3–15.1 °C, an annual average minimum temperature of 2.3–4.0 °C, and four distinct seasons. The predominant wind direction in winter and autumn is northeast, while in summer and spring, it is south. The soil types here are cinnamon soil and meadow soil, and the main crops are peanut, corn, and rice.

2.2. Soil Sampling

A total of 100 surface soil samples (0–20 cm) were collected in the Zhuzhou research area in October 2018 and the Huludao research area in September 2018 using the grid point method, of which fifty were collected in each research area (Figure 1). The Zhuzhou Smelter is surrounded by mountains, so the agricultural soils around the Zhuzhou Smelter were collected in blocks. At each sampling site, 4 topsoil (0–20 cm) samples were collected from the four corners of a 2 m × 2 m grid using a stainless-steel shovel and mixed to a composite sample of 1.0 kg by the quartile method.
Four types of samples were collected in the Huludao research area in September 2018, namely: (1) smelting, with 2 samples collected from factory soil (0–20 cm) and refining slag produced in the production process; (2) fertilizer, with 1 sample collected from the most commonly used fertilizer in the area; (3) vehicle exhaust dust, with 2 samples collected from particulate matter at the exhaust pipe of motor vehicles using a brush; and (4) soil parent materials, with 2 samples collected from the soils (40–60 cm).
The collected samples were placed in polyethylene plastic bags for transporting and storing and labeled with the sampling location, date, number, and person collecting the sample. After air-drying at room temperature, the samples were screened by a 100-mesh sieve and kept in polyethylene plastic bags for subsequent analysis.

2.3. Analytic Methods and Quality Control

Soil pH was measured using a PH meter with a glass electrode, according to NY/T 1377-2007 [32]. The concentrations of Pb, Cr, Ni, Cu, Zn, Cu, Fe, Mg, K, and Al in the samples were measured by an Inductively Coupled Plasma Optical Emission Spectrometer (ICP-OES 5100 KS-64, Perkin Elmer Corporation, Shelton, CT, USA). Soil samples were digested using triacid (HNO3 + HF + HClO4). The analytical method was similar to that described by CEPA [33]. The concentrations of Hg and As in soil samples were measured by an Atomic Fluorescence Spectrometer (AFS-9700A KS-38, Beijing Haiguang Instrument, Beijing, China). The soil samples were digested with a solution of 1:1 HCl:HNO3 (v/v), according to GB/T 22105.1-2008 [34] and GB/T 22105.2-2008 [35]. The analytical method was similar to that described by Chen et al. [36]. The concentration of Cd in the samples was measured by Inductively Coupled Plasma Mass Spectrometry (ICP-MS, NEXION 300X/KS-26, Shelton, CT, USA). The soil samples were digested by a mixed-acid solution (HNO3 + HF), according to DZ/T 0223-2001 [37]. The analytical method was similar to that described by Chen et al. [38]. Quality assurance (QA) and quality control (QC) were carried out by using the Chinese standardized reference materials (GSS-14 and GSS-16 for soil samples) and duplicate samples. Results were accepted when the relative standard deviation (RSD) was within 5%.
Pb isotopes of the soil samples were measured by a Multi-Collector-Inductively Coupled Plasma Mass Spectrometer (MC-ICPMS, Nu Plasma HR, Nu Instruments, Wrexham, UK). Pb isotopes of the soil samples were separated and purified according to DZ/T 0184.12-1997 [39]. Quality assurance (QA) and quality control (QC) were carried out by using the Pb standard substance (NBS981, American National Standards Institute) and duplicate samples. The analytical method was similar to that described by He et al. [40].

2.4. Methods

2.4.1. The Pollution Index

Single pollution index (Pi) is often applied to assess heavy metal contamination of soil, which can judge the main pollution factor in the environment and reflect the pollution degree of a pollutant. To assess contamination level of the heavy metals, a Pi for each metal was calculated using the following equation [41]:
P i = C i S i
where Pi is the pollution index corresponding to each sample, Ci (mg·kg−1) is the measured concentration of each heavy metal, and Si (mg·kg−1) is the standard value of screening risk of soil pollution in agricultural land, according to GB 15618—2018 [42].

2.4.2. The Nemerow Integrated Pollution Index

As a widely used comprehensive evaluation method, the Nemerow Integrated Pollution Index (NIPI) can comprehensively reflect the contamination degree of heavy metals in the environment [43]. The NIPI was calculated using the following equation [44]:
N I P I = ( P i a v e ) 2 + ( P i m a x ) 2 2
where NIPI is the Nemerow Integrated Pollution Index, Piave is the average pollution index of element i, and Pimax is the highest rate of element pollution index i.
The classification standards of soil heavy metal pollution [45] in this study are shown in Table 1.

2.4.3. Positive Matrix Factorization Model

The positive matrix factorization (PMF) model was used for soil pollutant source apportionment. According to the EPA-PMF 5.0 User Instructions, the equation is as follows:
X i j = K = 1 P g i k f k j + e i j
where Xij is the concentration of element j in sample i, gik is the concentration contributed by source k to the ith sample, fkj is the content of the jth element in the source, and eij is the residuals matrix that is not accounted for by the model.
In order to obtain the best concentration matrix and source distribution map, the objective function Q is minimized. Q is expressed by the followed equation:
Q = i = 1 n j = 1 m ( X i j k = 1 p g i k f k j u i j ) 2
where uij is the uncertainty of element j in sample i.
uij is calculated as:
U n c = 5 6 × M D L ( c M D L ) U n c = ( σ × c ) 2 + M D L 2 ( c > M D L )
where σ is the relative standard deviation, c is the content of every element, and MDL is the corresponding method detection limit.

2.4.4. Isotope Ratio Method

This model is based on the binary and ternary mixing model, using the principle of conservation of mass and repeated calculation rules to produce a combination of multiple source ratios. According to the EPA-IsoSource user instructions, the equation is as follows [46]:
Q = [ ( 100 i ) + ( s 1 ) ] ! ( 100 i ) ! ( s 1 ) !
where Q is the number of combinations, i is the source increment, s is the number of pollution sources, and ! is the factorial.

2.4.5. Data Treatment and Statistical Analysis

To identify the relationships among heavy metals in the soil samples and their possible sources, descriptive statistics analysis, regression analysis, Spearman’s correlation coefficient analysis, Shapiro-Wilk (SW) normality testing, Least Significance Difference (LSD) analysis, paired t-test, and one-way ANOVA analysis were performed using Statistical Product and Service Solutions (SPSS 22.0, IBM Company, Chicago, IL, USA). Data analysis was performed using Excel 2013 and Origin 2020. The PMF software (Ver.5.0, USEPA, Washington, DC, USA) and the Pb isotope ratio method software (EPA-IsoSource, Washington, DC, USA) were used for source apportionment.

3. Results and Discussion

3.1. Heavy Metal Pollution Analysis

3.1.1. Heavy Metal Concentrations

The descriptive statistics of the concentrations of soil heavy metals in the agricultural soil around Zhuzhou Smelter and Huludao Zinc Plant are shown in Table 2.
In the Zhuzhou research area, the mean concentrations of As, Ni, Cu, Cr, Zn, Pb, Hg, and Cd exceeded the background values of Hunan Province soils [47] by 0.9, 1.1, 1.6, 1.7, 2.7, 3.2, 4.0, and 17.8 times, respectively. Moreover, the proportion of sample content in which Cd, Pb, Zn, and Hg exceeded the soil background values was 100%, 100%, 98%, and 92%, respectively, indicating that the pollution of the four metals was severe, which is consistent with the conclusions of previous research [48,49].
In the Huludao research area, except for Cr and Ni, the mean concentrations of Hg, Cd, Zn, Pb, Cu, and As were 76.3, 47.6, 6.4, 3.9, 2.6, and 1.3 times the background values of soil in Liaoning Province [47], respectively. The contents of Cd, Hg, Zn, and Pb seriously exceeded the standard [47] with all samples exceeding the background value.
From the discussion above, both research areas were polluted by Cd, Pb, Hg, and Zn. This could be due to the main smelter mineral i.e., lead−zinc ore, of which Cd is the main companion product and which also contains a small amount of Hg [50,51]. These emissions spread through atmospheric migration, which could cause heavy metal pollution in agricultural soils around Zhuzhou and Huludao smelters.

3.1.2. Heavy Metal Pollution Assessment

Both research areas are agricultural soils, and the average pH of agricultural soil around Zhuzhou Smelter and Huludao Zinc Plant was 5.84 and 6.11, respectively. Therefore, the soil pollution risk screening value of agricultural land (flood and drought rotation land, 5.5 < pH ≤ 6.5) in the soil environmental quality-risk control standard for soil contamination in agricultural land (GB 15618–2018) [42] was adopted to assess the pollution of heavy metal. The standard values of Cd, Hg, As, Ni, Pb, Cu, Zn, and Cr are 0.4, 1.8, 40, 70, 100, 150, 200 and 250 mg·kg−1, respectively. The pollution index (Pi) and the Nemerow Integrated Pollution Index (NIPI) for all soil elements in the research area were calculated with the above Formulas (1) and (2) (Figure 2).
As shown in Figure 2a, the mean value of the Pis for the heavy metals in the Zhuzhou research area descended in the order: Cd (5.78) > Zn (1.29) > Pb (0.95) > Ni (0.51) > Cr (0.49) > As (0.39) > Cu (0.29) > Hg (0.27). Heavy metal pollution was observed in the research area, among which Cd pollution was the most serious concern, with approximately 86% of the sampling points moderately or highly contaminated with Cd, and all sampling points over standard. As shown in Figure 2b, the mean value of the Pis for the heavy metals in the Huludao research area were, in descending order: Cd (13.08) > Zn (2.05) > Hg (1.69) > Pb (0.83) > Ni (0.39) > Cu (0.34) > As (0.29) > Cr (0.22), indicating that the pollution of Cd was the most serious concern, with all the 50 sampling points classified as high contamination, and that the pollution of Zn was also serious, with approximately 86% of the sampling points classified as moderately or highly contaminated.
Heavy metal in the soil is considered high contamination when NIPI > 3, while the mean values of NIPI for the topsoil in the Zhuzhou research area and Huludao research area were 3.56 and 8.6, respectively, indicating that most of the samples in both research areas were heavily contaminated by heavy metals.
The above data showed that the topsoils in the two research areas were contaminated by Cd and Zn to varying degrees. Cd was a high contaminant in both areas. However for Zn, the pollution contamination status in the Zhuzhou research area was slightly contaminated, while it was serious in the Huludao research area.
Table 3 compares the mean value of the pollution indexes (the ratio of heavy metal mean content to the background value) for the heavy metals of this study with other smelting areas in China. The soil surrounding the lead mining and smelting plant in Yongzhou, Hunan Province accumulated more Cd and Zn, which is similar with the results of Huludao Zinc Plant in this study. The mean value of the pollution index of Cd in the soil surrounding the lead−zinc smelter in Shaoguan, Guangdong Province was 95.7, while that of zinc was only 4.93. Similarly, the Henan lead smelter also had a larger accumulation of Cd and a significantly slight accumulation of Zn, which is consistent with the results of the Zhuzhou research area in this study. The difference in the degree of Zn accumulation in the soil may be a distinction between the lead-based smelting contaminated soil and the mining and smelting contaminated soil.

3.1.3. Spatial Distribution of Heavy Metals

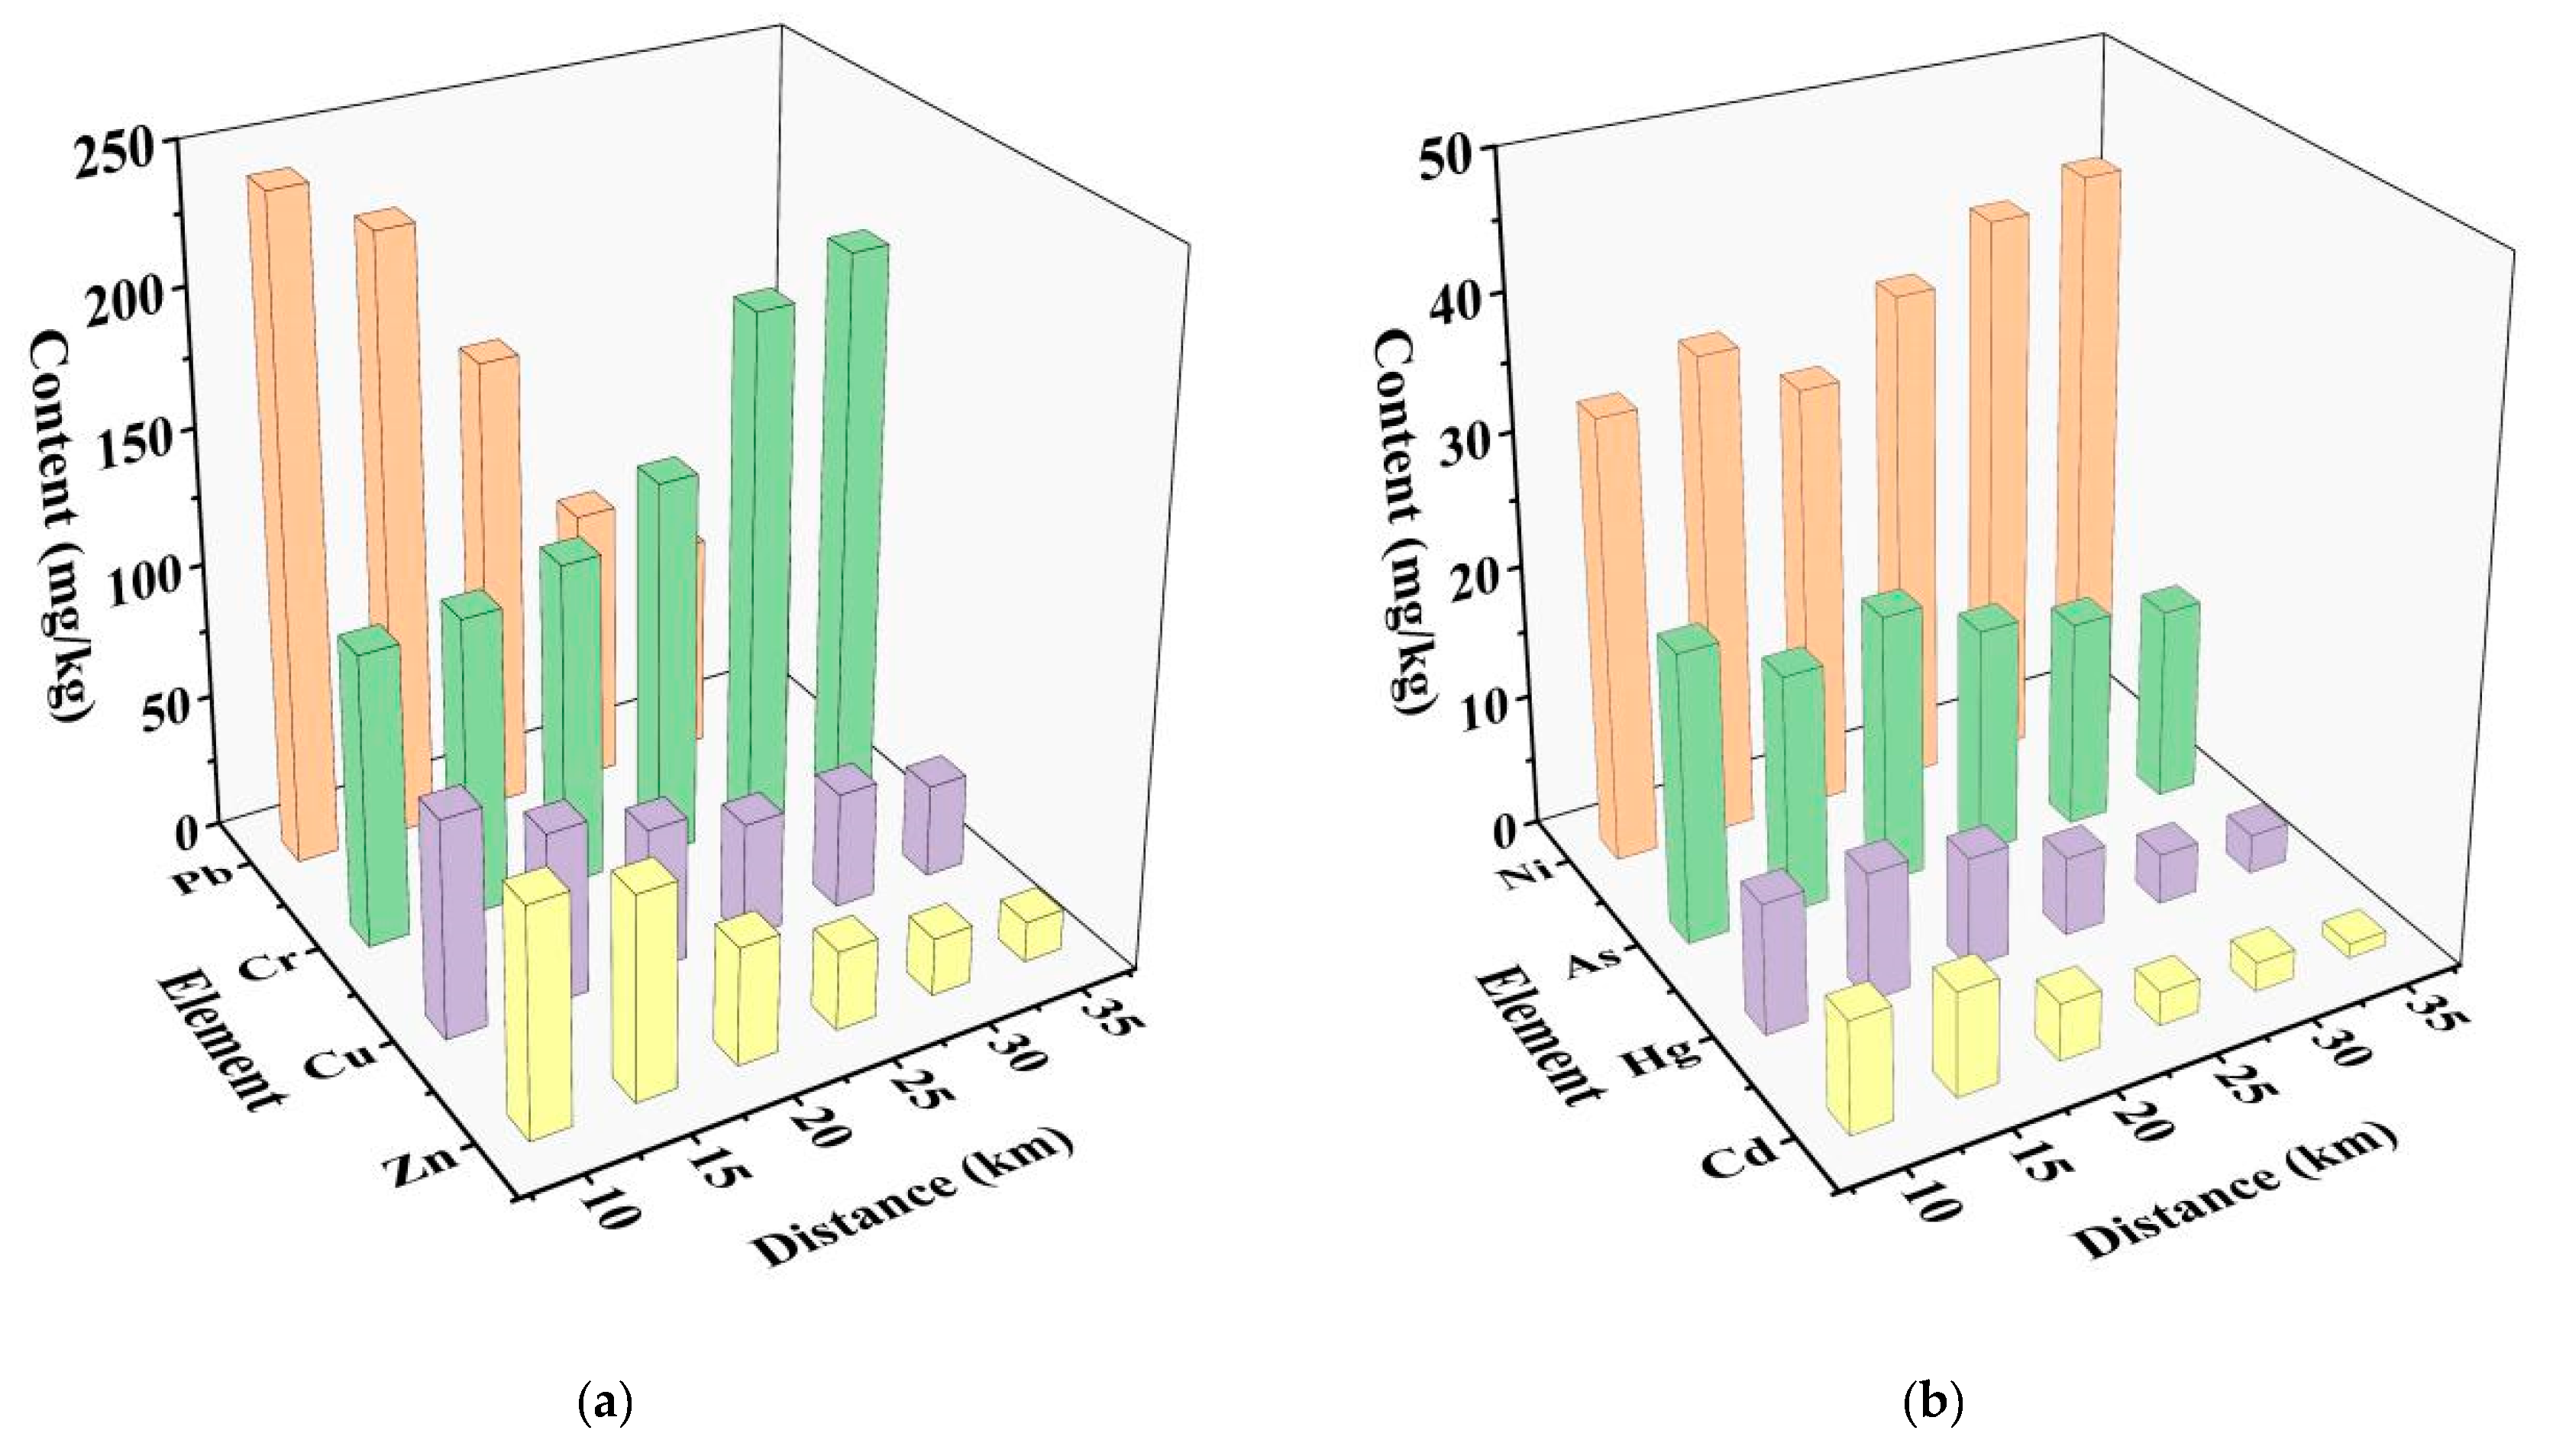
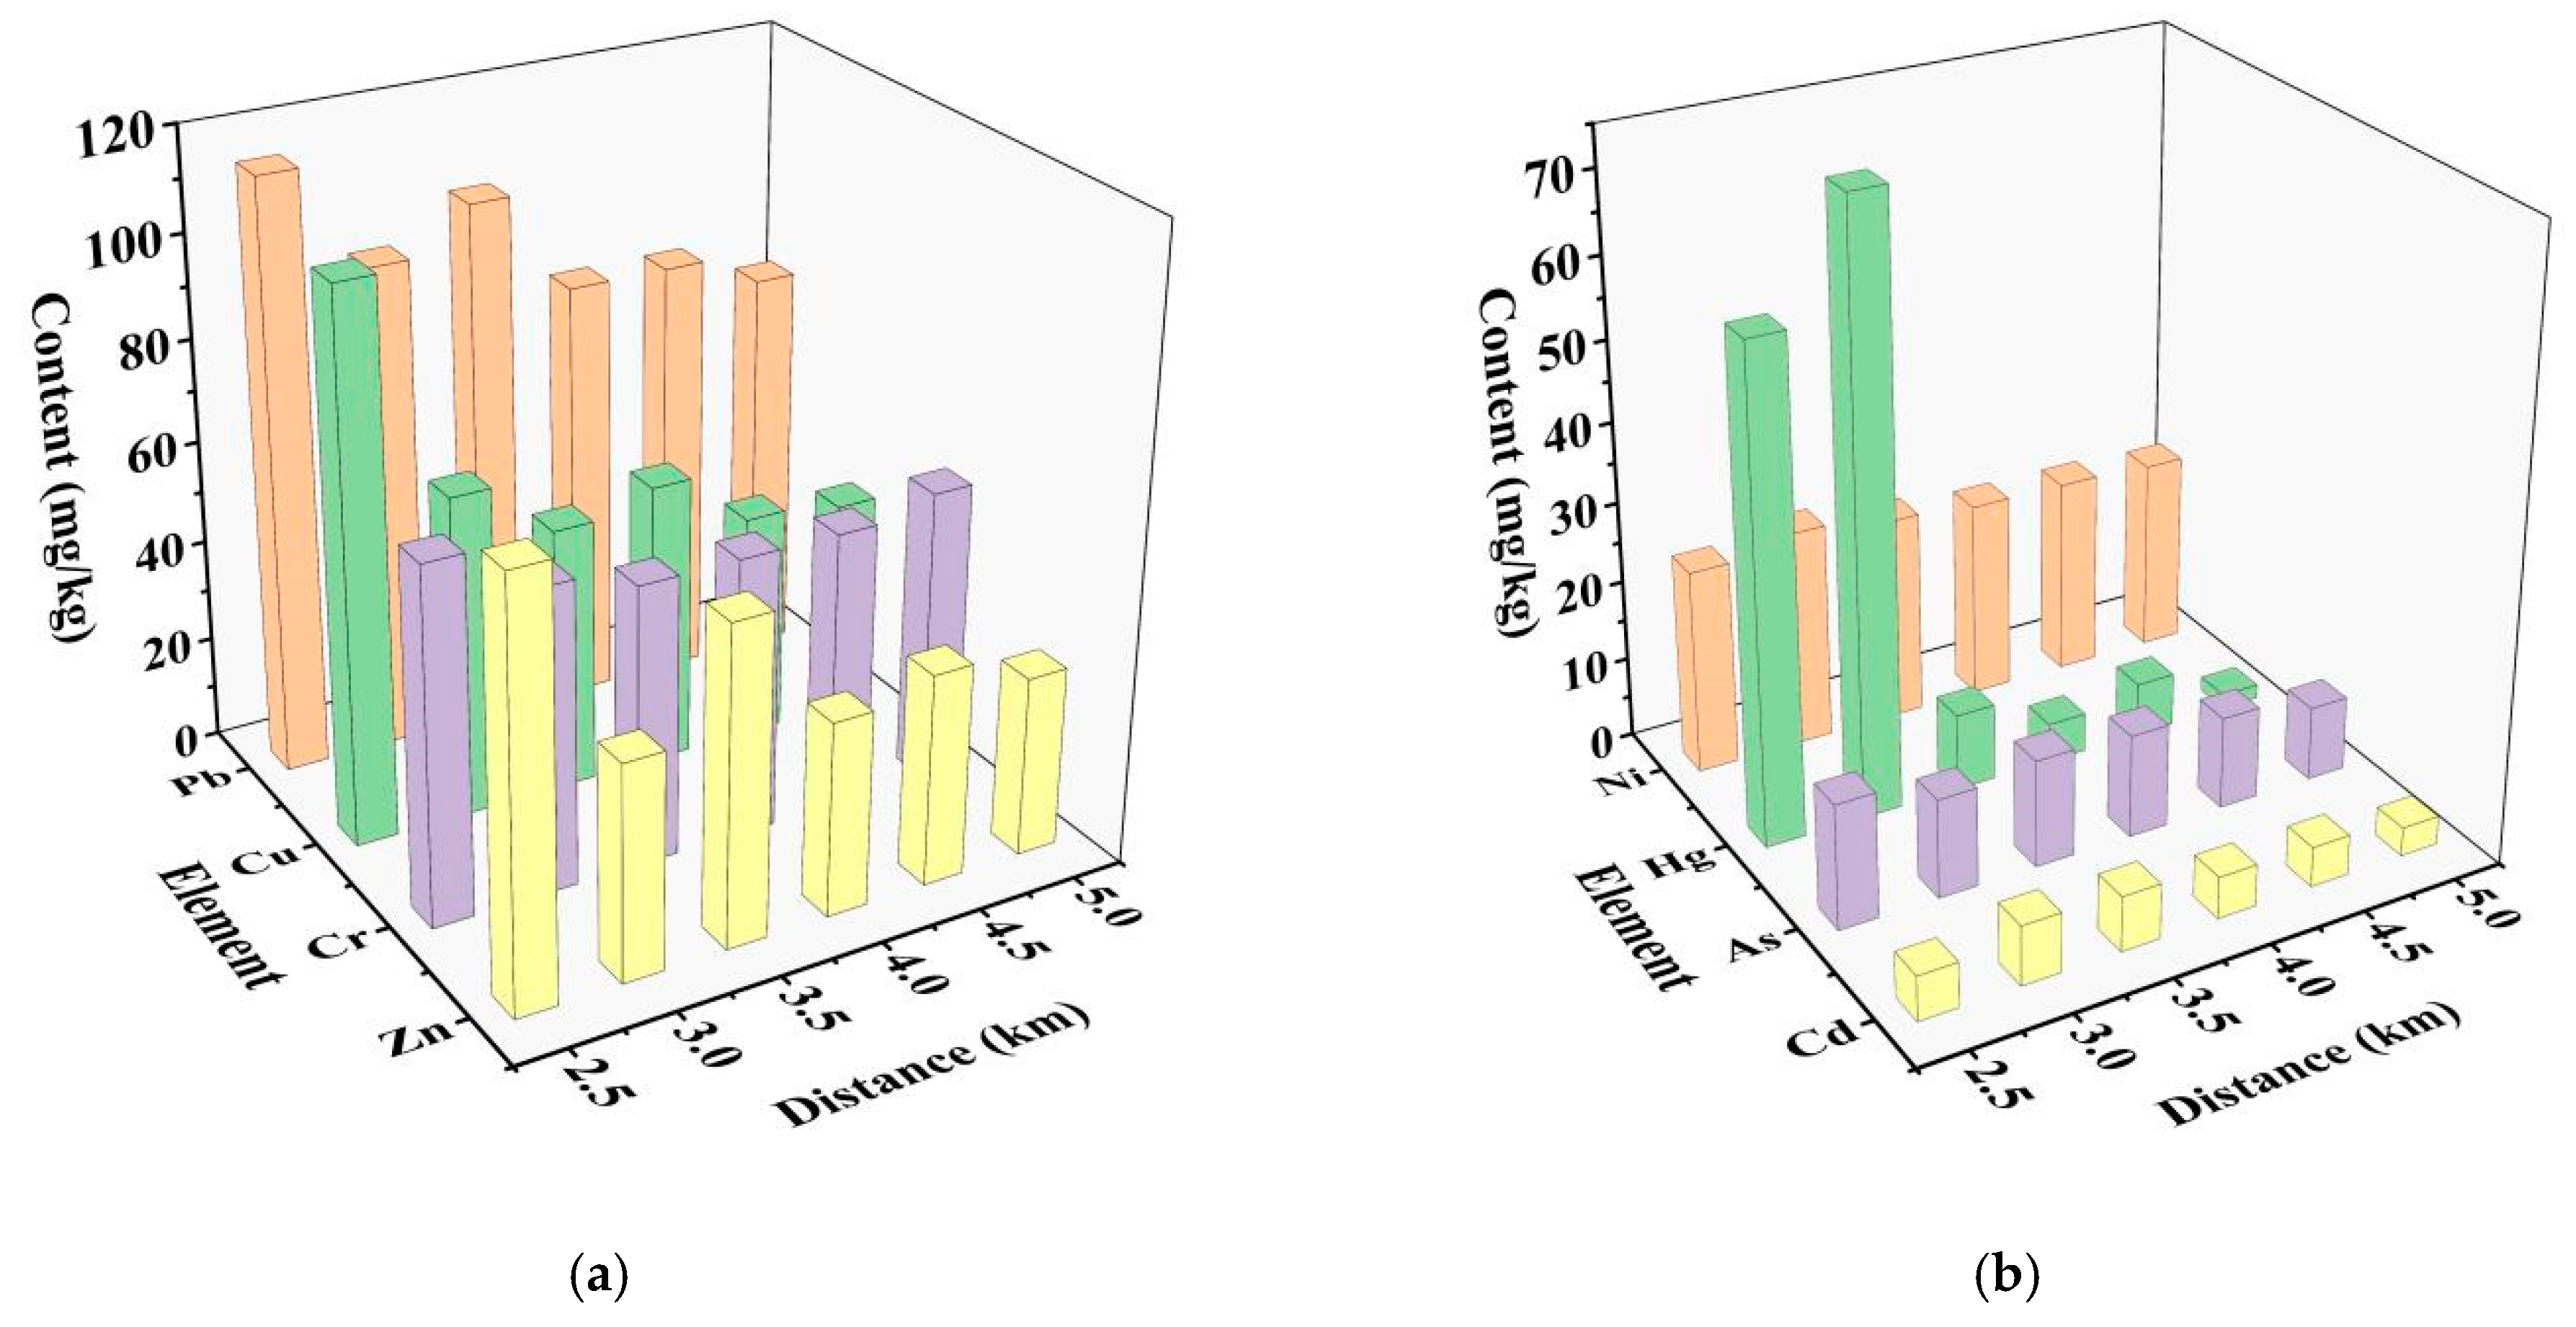
The spatial distribution of heavy metal concentrations is a useful aid to explore the effects of smelters on the properties of heavy metals in surrounding agricultural soils and the difference between the mean concentrations of heavy metals between the two research areas. The mean concentrations of heavy metals in sampling sites at 2.5–5 km and 10–35 km from Huludao Zinc Plant and Zhuzhou Smelter, respectively, were proposed to form a three-dimensional histogram (Figure 3 and Figure 4). The regression relationship between heavy metal content and distance from sample site to smelter is shown in Supplementary Table S1 (Supplementary Materials).
The results of Zhuzhou research area (Figure 3 and Supplementary Table S1) showed that the distribution of Cr and Ni had some similar features, with the content of Cr and Ni in topsoil rising with the increase of distance to a maximum increase of 37.45% and 16.41%. However, with the increase of distance, the content of the other six kinds of heavy metal gradually decreased. The largest decreases of heavy metal concentrations were as follows, in declining order: Zn (72.65%) > Pb (64.29%) > Cd (22.97%) > Hg (21.88%) > Cu (18.47%) > As (15.36%). As for the results of Huludao research area (Figure 4 and Supplementary Table S1), the contents of all eight heavy metals decreased with distance. The largest decreases of heavy metal concentrations descended in the order: Zn (93.82%) > Hg (87.19%) > Cu (40.64%) > Cd (28.67%) > As (26.15%) > Pb (19.34%) > Cr (16.95%) > Ni (6.35%).
By comparing the spatial distribution of the serious pollutants Pb, Cd, Hg, and Zn between the two research areas, different distribution rules were observed for different elements in each area. The change of the Zn content varied greatly with distance in both research areas and that of Cd was relatively slight. As for the content of Pb, in Zhuzhou research area, it changed greatly with distance, while in Huludao research area, the change was small, and Hg and Pb were just the opposite. This was probably due to the characteristics of the migration of pollutants from the smelter in the surrounding soil [54,55]. Zhuzhou City is located in a subtropical humid monsoon climate with a humid summer, which is negative to the migration of pollutants, while the winter is dry with a northwest monsoon, which is conducive to the migration of pollutants with the atmosphere [56,57]; thus, the Cd, Pb, Zn, and Hg spatial distribution showed a NW trend [27]. The climate of Huludao research area belongs to a warm temperate subhumid monsoon climate, which has four distinct seasons. The predominant wind direction in winter and autumn is northeast, while in summer and spring it is south. The study of Liu et al. (2003) showed that the Cd content distribution in the farmland soil around Huludao Zinc Plant was related to the orientation with an order of South > Southwest > North > Northwest > West [21]. The rainfall and wind force were also considered as potential factors for the pollution diffusion area in the research area [23], which explained the difference of Pb and Hg content between the research areas in Zhuzhou and Huludao. In the process of atmospheric migration, with the increase of migration distance, the difference of the mean concentrations of the easily diffusible heavy metals could become smaller [52]. The results above indicated that Cd diffused more easily into a larger area than Zn, and the farther away from the smelter, the more uniform the distribution of contaminated elements in the soil.

3.1.4. Correlation between Heavy Metals

The Spearman’s correlation coefficient analysis was used to measure the correlation relationship between different heavy metals in the agricultural soil around Zhuzhou Smelter and Huludao Zinc Plant, in order to provide some information on the homologous relationship of the heavy metals [58,59]. Table 4 shows the correlation matrix of the heavy metals.
Significantly correlated means that there is a greater than 95% or 99% chance that the variables are correlated. In the Zhuzhou research area, Cd, Hg, Pb, and Zn were significantly positively correlated (r > 0.600) with each other at 0.01 level, suggesting that the sources of these four heavy metals are closely related. In comparison, Cr showed weak correlation with the other six heavy metals, which indicated that the source of Cr may be different from the sources of the other heavy metals. The significant correlation was found between Cr−Ni (r = 0.701) at 0.01 level, suggesting that Cr and Ni were closely related, which is consistent with Section 3.1.3. In the Huludao research area, a significant correlation was found between Cd−Pb (r = 0.847), Cr−Ni (r = 0.852), Cd−Zn (r = 0.882) and Pb−Zn (r = 0.890) at 0.01 level, suggesting that these heavy metals had similar pollution sources. However, Pb−Ni (0.281) and Ni−Cu (0.293) had no significant correlation, which implied different influential factors. From the discussion above, Cd, Pb, and Zn were significantly positively correlated with each other at 0.01 level in both research areas.

3.2. Source Apportionment by PMF

In this study, PMF was performed with the EPA PMF software (Ver. 5.0, USEPA, Washington, DC, USA) to analyze the sources of heavy metals in the research area. Four factors were identified, and their contributions are presented in Table 5.
For the research area in Zhuzhou (Table 5a), the first factor was loaded predominantly on Zn (74.7%), Cd (69.7%), and Pb (66.6%). Moreover, concentrations of Zn, Cd, and Pb were significantly positively correlated (p < 0.01, r > 0.6), indicating similar sources. Many related studies have shown that Cd, Pb, and Zn are generally associated with medium and high temperature hydrothermal mineralization [60,61]. When mining and smelting lead and zinc ores, volatile oxides are generated [51,62] and spread away through atmospheric migration with the pollution source as the center, which could ultimately pollute surrounding soils. Therefore, the first factor was identified as the smelting source.
The second factor was weighted heavily on Mg (47.7%), Ca (42.5%), and Fe (24.5%). Mg is mainly composed of magnesite and dolomite, Ca is generally considered the most abundant element in the crust and the major element in limestone and gypsum [63], and Fe is mainly derived from rock weathering products [64], indicating that these heavy metals above were probably predominantly present at natural background concentrations controlled by the parent material. Based on this analysis, the natural source was determined to be the second factor.
The third factor was predominated by K (69.9%), As (56.5%), Al (43.8%), and Cr (40.2%). Considering that most of the samples came from the agricultural soil around the smelter and that irrigation and fertilization are essential steps in the actual agricultural production process, the high K contribution rate may be related to the application of potassium fertilizer in the soil. Additionally, chemical fertilizers contain large amounts of Cr [65]. Large-scale use of agricultural chemicals (such as manure, fertilizers, and pesticides) caused the enrichment of heavy metals in the cropland. These heavy metals in fertilizers would eventually accumulate in the topsoil. In view of the above, the third factor was interpreted as the agricultural source.
For the fourth factor, Hg received prominently higher weighting than other elements, accounting for 88.8%. Hg was easy to migrate with the atmosphere [66,67], which led to the intricacy of the Hg pollution sources in the research area. Coal burning and nonferrous metal smelting are the main anthropogenic Hg emission sources in China, accounting for about 80% of the total annual Hg release [68,69], which had significant impacts on Hg accumulation. Additionally, the high concentrations of Hg in the soil was also linked to traffic emissions [70]. Therefore, the fourth factor could be a mixed source of industrial activity and traffic.
From the discussion above, four sources were apportioned, including the smelting source, agricultural source, natural source, and mixed source of industrial activity and traffic. The calculated results of the PMF indicated the contribution rate of heavy metals in agricultural soil around Zhuzhou Smelter was, in descending order: smelting source (37.6%) > agricultural source (26.9%) > natural source (22.4%) > mixed source of industrial activity and traffic (13.1%). Therefore, heavy metal pollution in agricultural soil around Zhuzhou Smelter was mainly affected by the smelting source, although the impact of the agricultural source, mixed source of industrial activity and traffic could not be ignored.
Table 5b showed that the main identification elements on each corresponding source identified by PMF in the agricultural soil around Huludao Zinc Plant were basically the same as those in the Zhuzhou research area, resulting in little difference in the discrimination of source types, so similar source identification results were obtained. The contribution rate of heavy metals was as follows, in declining order: smelting source (34.1%) > agricultural source (29.4%) > natural source (24.3%) > mixed source of industrial activity and traffic (12.2%).
Based on the results of PMF, the differences and similarities between source identification and apportionment of heavy metals in agricultural soils in the two research areas were compared and explained. Firstly, similar source identification results were obtained among the two research areas. Meanwhile, the contribution rates of the four sources in the two research areas analyzed by PMF were examined by small sample Shapiro−Wilk (SW) normality testing. The results showed that the p values of the research areas in Zhuzhou and Huludao were 0.983 and 0.707, respectively, which suggested that the data were regarded to follow normal distribution (p > 0.050). Therefore, the comparison of differences between two samples was investigated using the paired t-test. The result showed that p was 0.998 (p > 0.050), indicative of the similarity between the contribution rate of heavy metals in the two research areas.

3.3. Source Apportionment by Pb Isotope Ratio Method

Taking the agricultural soil around Huludao Zinc Plant as an example, the source of heavy metal pollution and apportionment analyzed by Pb isotope ratio method was performed to compare the source analysis results with that of PMF.
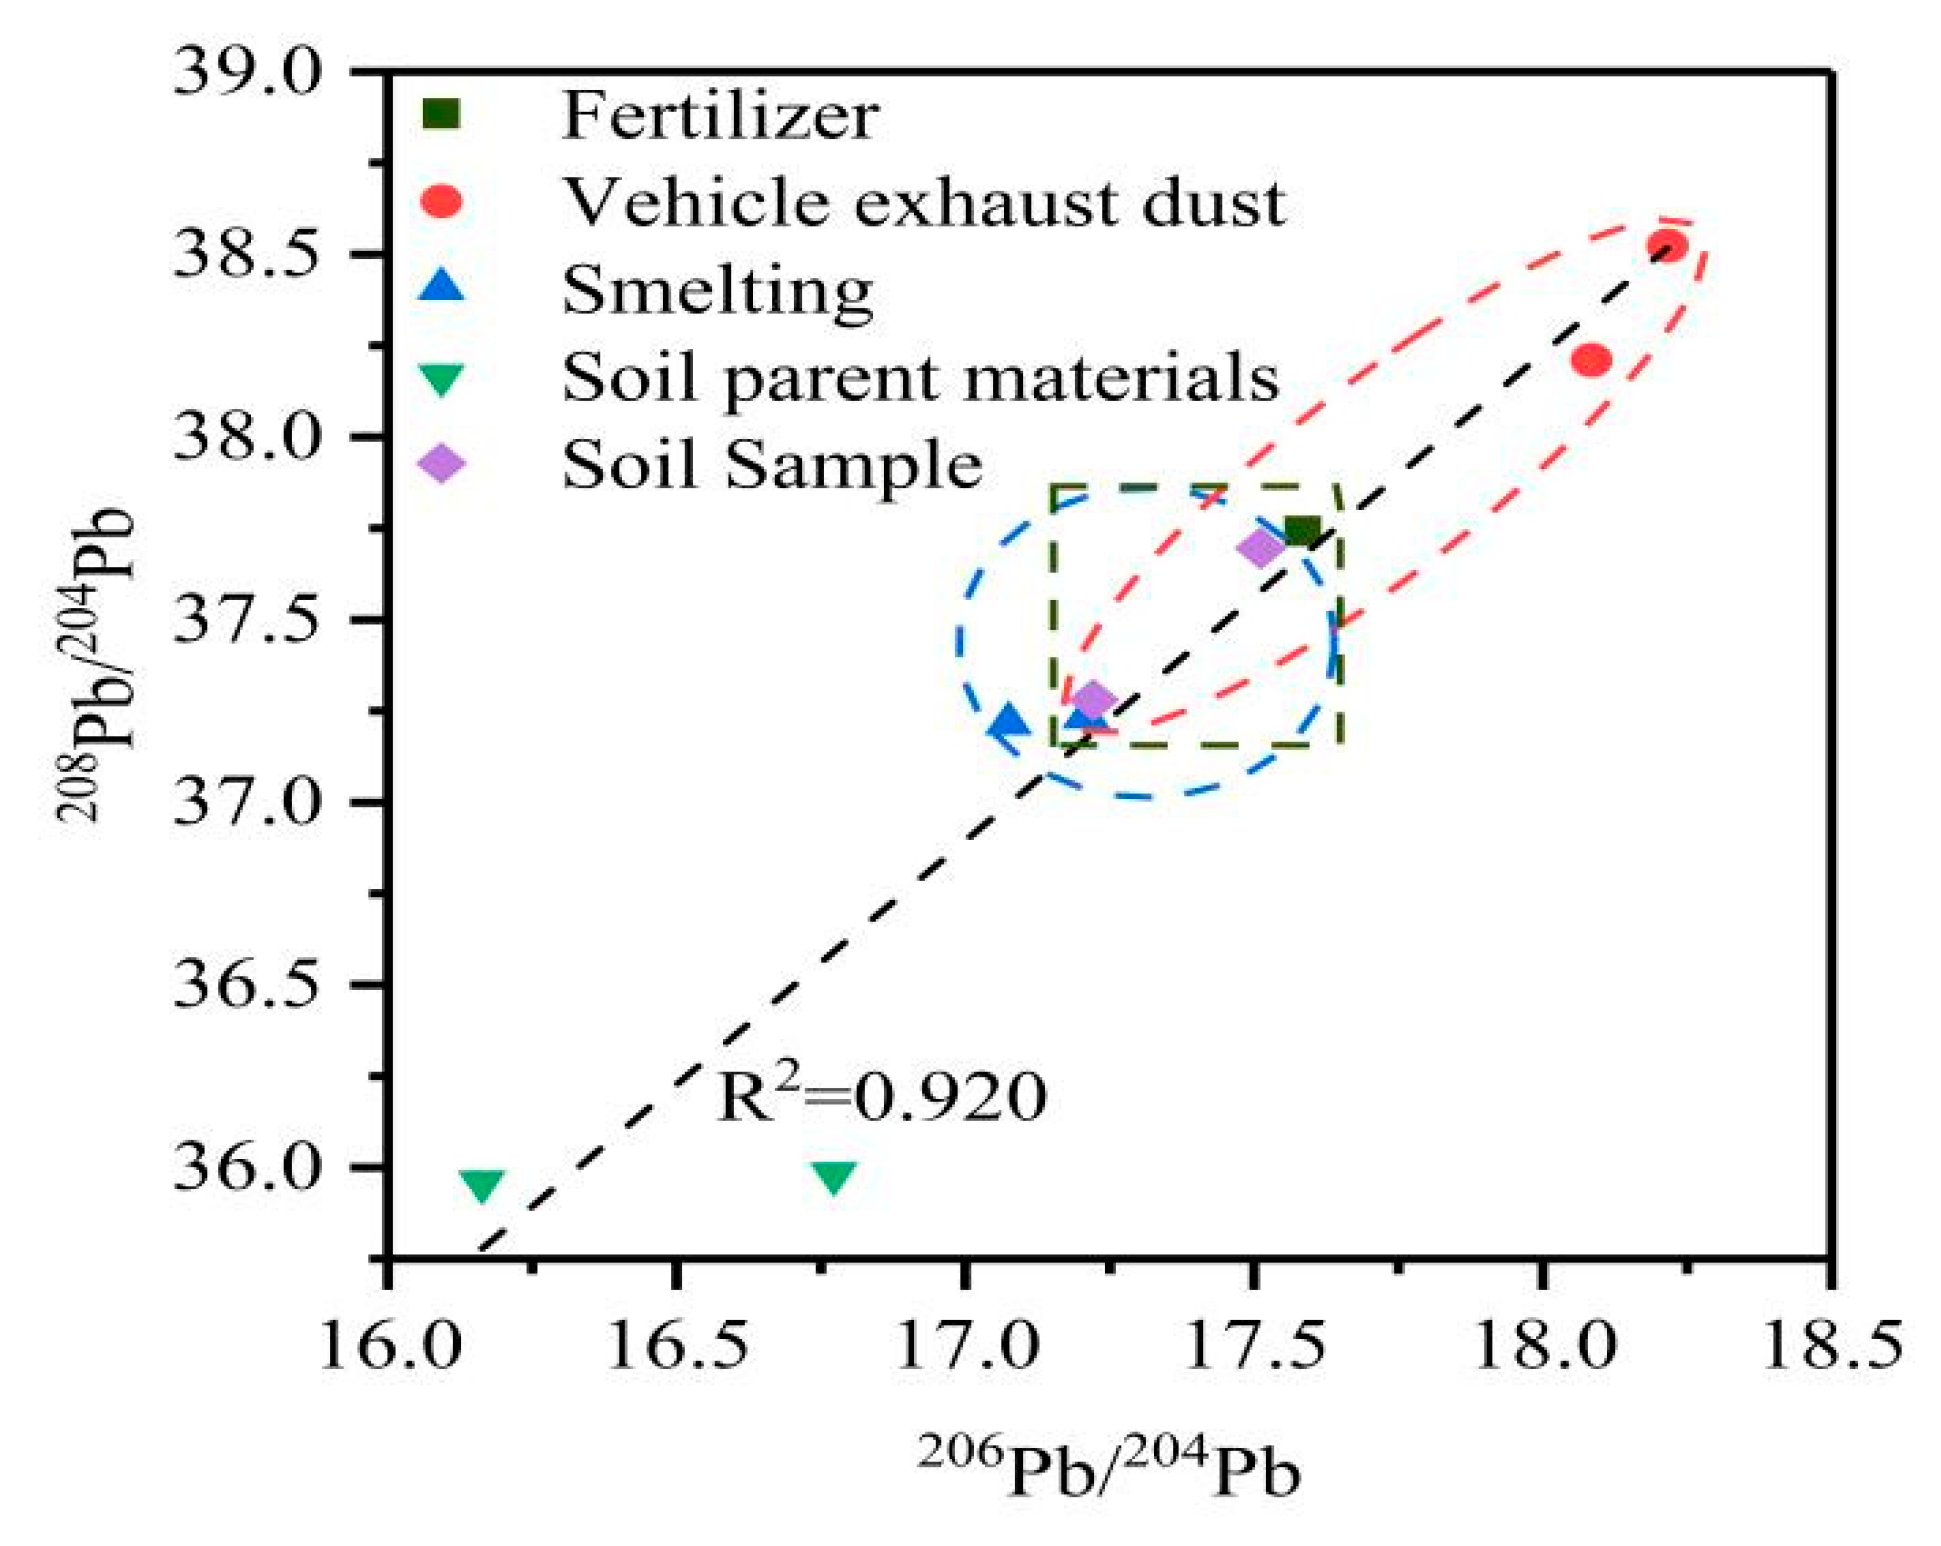
The mean concentration of Pb in the research was 83.33 mg·kg−1, 3.9 times of the soil background value in Liaoning Province [47], indicative of the obvious external intrusion of a Pb source in the soil. The isotope ratio scatter diagram (Figure 5) was made to analyze the Pb isotope compositions of the recipient soil and the potential pollution sources. For soil Pb pollution, each Pb source has its own background concentration and its own specific isotopic composition. By comparison of the measured Pb isotopic compositions of the receptor soils and the four end-members (vehicle exhaust dust, smelting, fertilizer, and soil parent materials), it is possible to identify the sources of soil Pb pollution [18].
The prerequisite for using the isotope ratio method is that a significant difference occurred for at least two end-members of the isotope ratios. The result of one-way ANOVA analysis was a significant difference in Pb isotopic compositions for at least two members in the smelting, fertilizer, soil parent materials, and vehicle exhaust dust (F > 1, p < 0.050). Therefore, the posthoc analysis between the isotope ratios of Pb analyzed was investigated using the Least Significance Difference (LSD) analysis. The result showed the significant difference in Pb isotopic compositions for soil parent materials and vehicle exhaust dust (p < 0.050). Based on these end-member samples with obvious Pb isotopic compositions, the source of heavy metal Pb in agricultural soil around Huludao Zinc Plant could be effectively traced and identified. A good linear relationship is very important to ensure the accuracy and reliability of the source identification and apportionment. The results showed that the good linear relationship between 206Pb/204Pb and 208Pb/204Pb was 0.920 (when R2 > 80%, it is highly correlated). Therefore, the diagram of 206Pb/204Pb-208Pb/204Pb ratio in different sources was drawn to analyze the potential anthropogenic Pb sources in agricultural soil (Figure 5).
The Pb isotope ratio of recipient soil fell between the smelting, vehicle exhaust dust, and fertilizer. However, the Pb isotope ratio of receptor soil is quite different from the soil parent materials. In view of the above, analysis indicated that Pb from smelting, vehicle exhaust dust, and fertilizer might be the main input pathway for anthropogenic Pb to the soils, not soil parent materials.
The contribution rates of each pollution source analyzed using EPA-IsoSource software according to the Pb isotope ratio of different potential pollution sources (Figure 6) were the lead smelting source (43.7%), followed by the agricultural source (34.6%), traffic source (14.2%) and natural source (7.5%).
The pollution sources of Pb using PMF in the soil of the Huludao research area were the smelting source, agricultural source, mixed source of industrial activity and traffic, and natural source with contribution rates of 52.9%, 28.5%, 11.3% and 7.3%, respectively. The p values for the contribution rates of Pb analyzed by PMF and the Pb isotope ratio method calculated by the small sample Shapiro−Wilk (SW) normality testing were 0.459 and 0.562, respectively. Both p values were larger than 0.050, which suggested that the two groups of data were regarded to follow normal distribution. Therefore, the comparison of differences between the contribution rates of Pb analyzed by PMF and the Pb isotope ratio method was investigated using the paired t-test. The result showed that p was 0.989 (p > 0.050), indicative of the similarity between the contribution rates of Pb by two different methods that confirmed that the two source analysis methods can be reasonably used to identify the source of heavy metal pollution and apportionment.
The Pb isotope ratio method is a chemical analytical method through isotope ratio identification, which is successfully used to identify sources of pollution due to its stable physical and chemical properties but requires predetermination of isotope ratios in end-member, while PMF is a mathematical method to find the solution through correlation matrix−covariance matrix, which does not need to determine the original spectrum but requires a large amount of data. Both methods have their own advantages and disadvantages in heavy metal source analysis. By complementing them to form a multisource analysis system, the results of heavy metal source analysis could be more reliable.

3.4. Analysis of Pollution Types in Smelter

The results above have shown that the two smelters were the main cause of heavy metal pollution for the surrounding agricultural soil, which was consistent with the previous studies by Zhao et al. [71] and Li et al. [72]. Huludao Zinc Plant adopts the production mode of mixing ore and intermediate oxidizing materials, while Zhuzhou Smelter adopts the production mode of burning mixed ore with zinc concentrate and intermediate materials, and both modes produced heavy metal wastes such as Cu, Zn, Cd, and Pb. Due to the lack of environmental protection measures, these heavy metal oxides or salts spread into the atmosphere with the smoke and dust, which could ultimately pollute surrounding soils [21,73,74].

3.4.1. Element Content Ratio

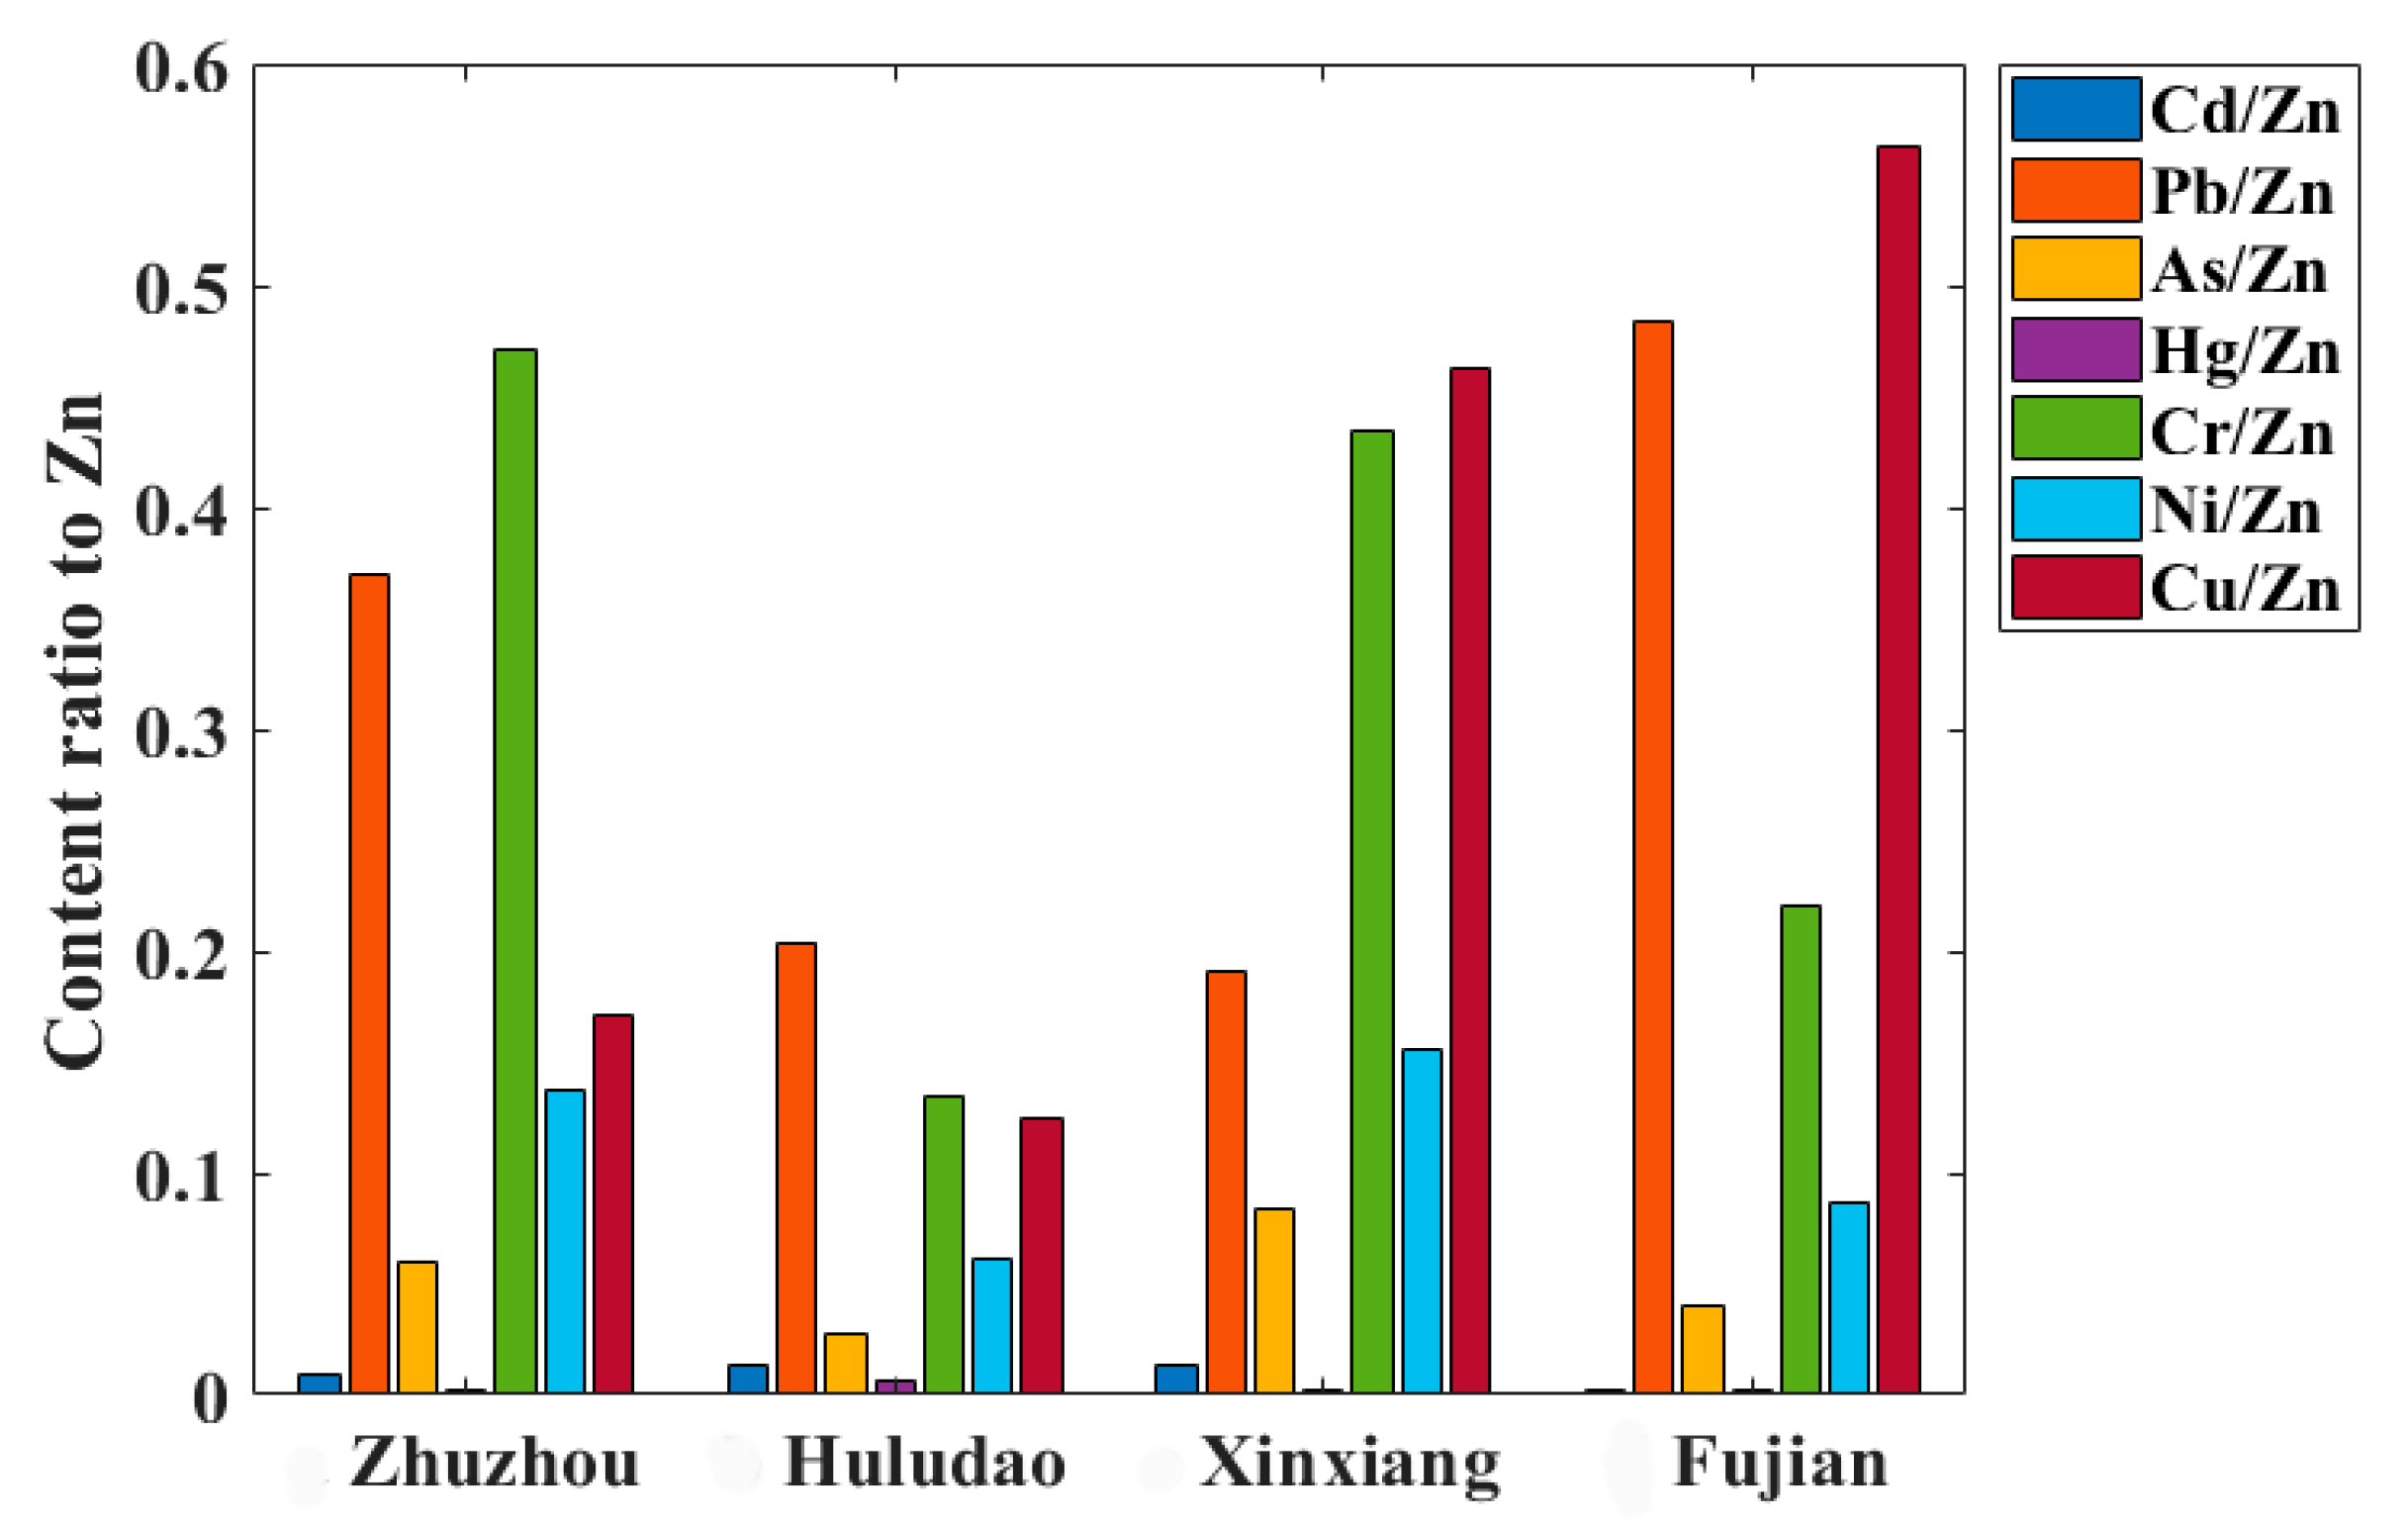
The content ratios of Cd, Pb, As, Hg, Cr, Ni, Cu, and Zn in 50 samples of the Zhuzhou research area and the Huludao research area were randomly selected to establish the heavy metal element fingerprint in order to discuss the differences and similarities of element pollution characteristics between the two smelters. The results are shown in Figure 7.
Overall, the element content ratio in the two research areas showed a similar and regular wavy distribution with Cd/Zn, As/Zn, Hg/Zn, and Ni/Zn in low peaks and Pb/Zn, Cr/Zn, and Cu/Zn in steep peaks, which is mainly consistent with the overall profile of the agricultural soil around other smelting areas summarized in previous studies [75,76], proving the reliability of our results. Therefore, the establishment of the heavy metal element fingerprint (Figure 7) can provide references for the analysis of heavy metal pollution characteristics of agricultural soil around the smelter.

3.4.2. Element Contribution Ratio

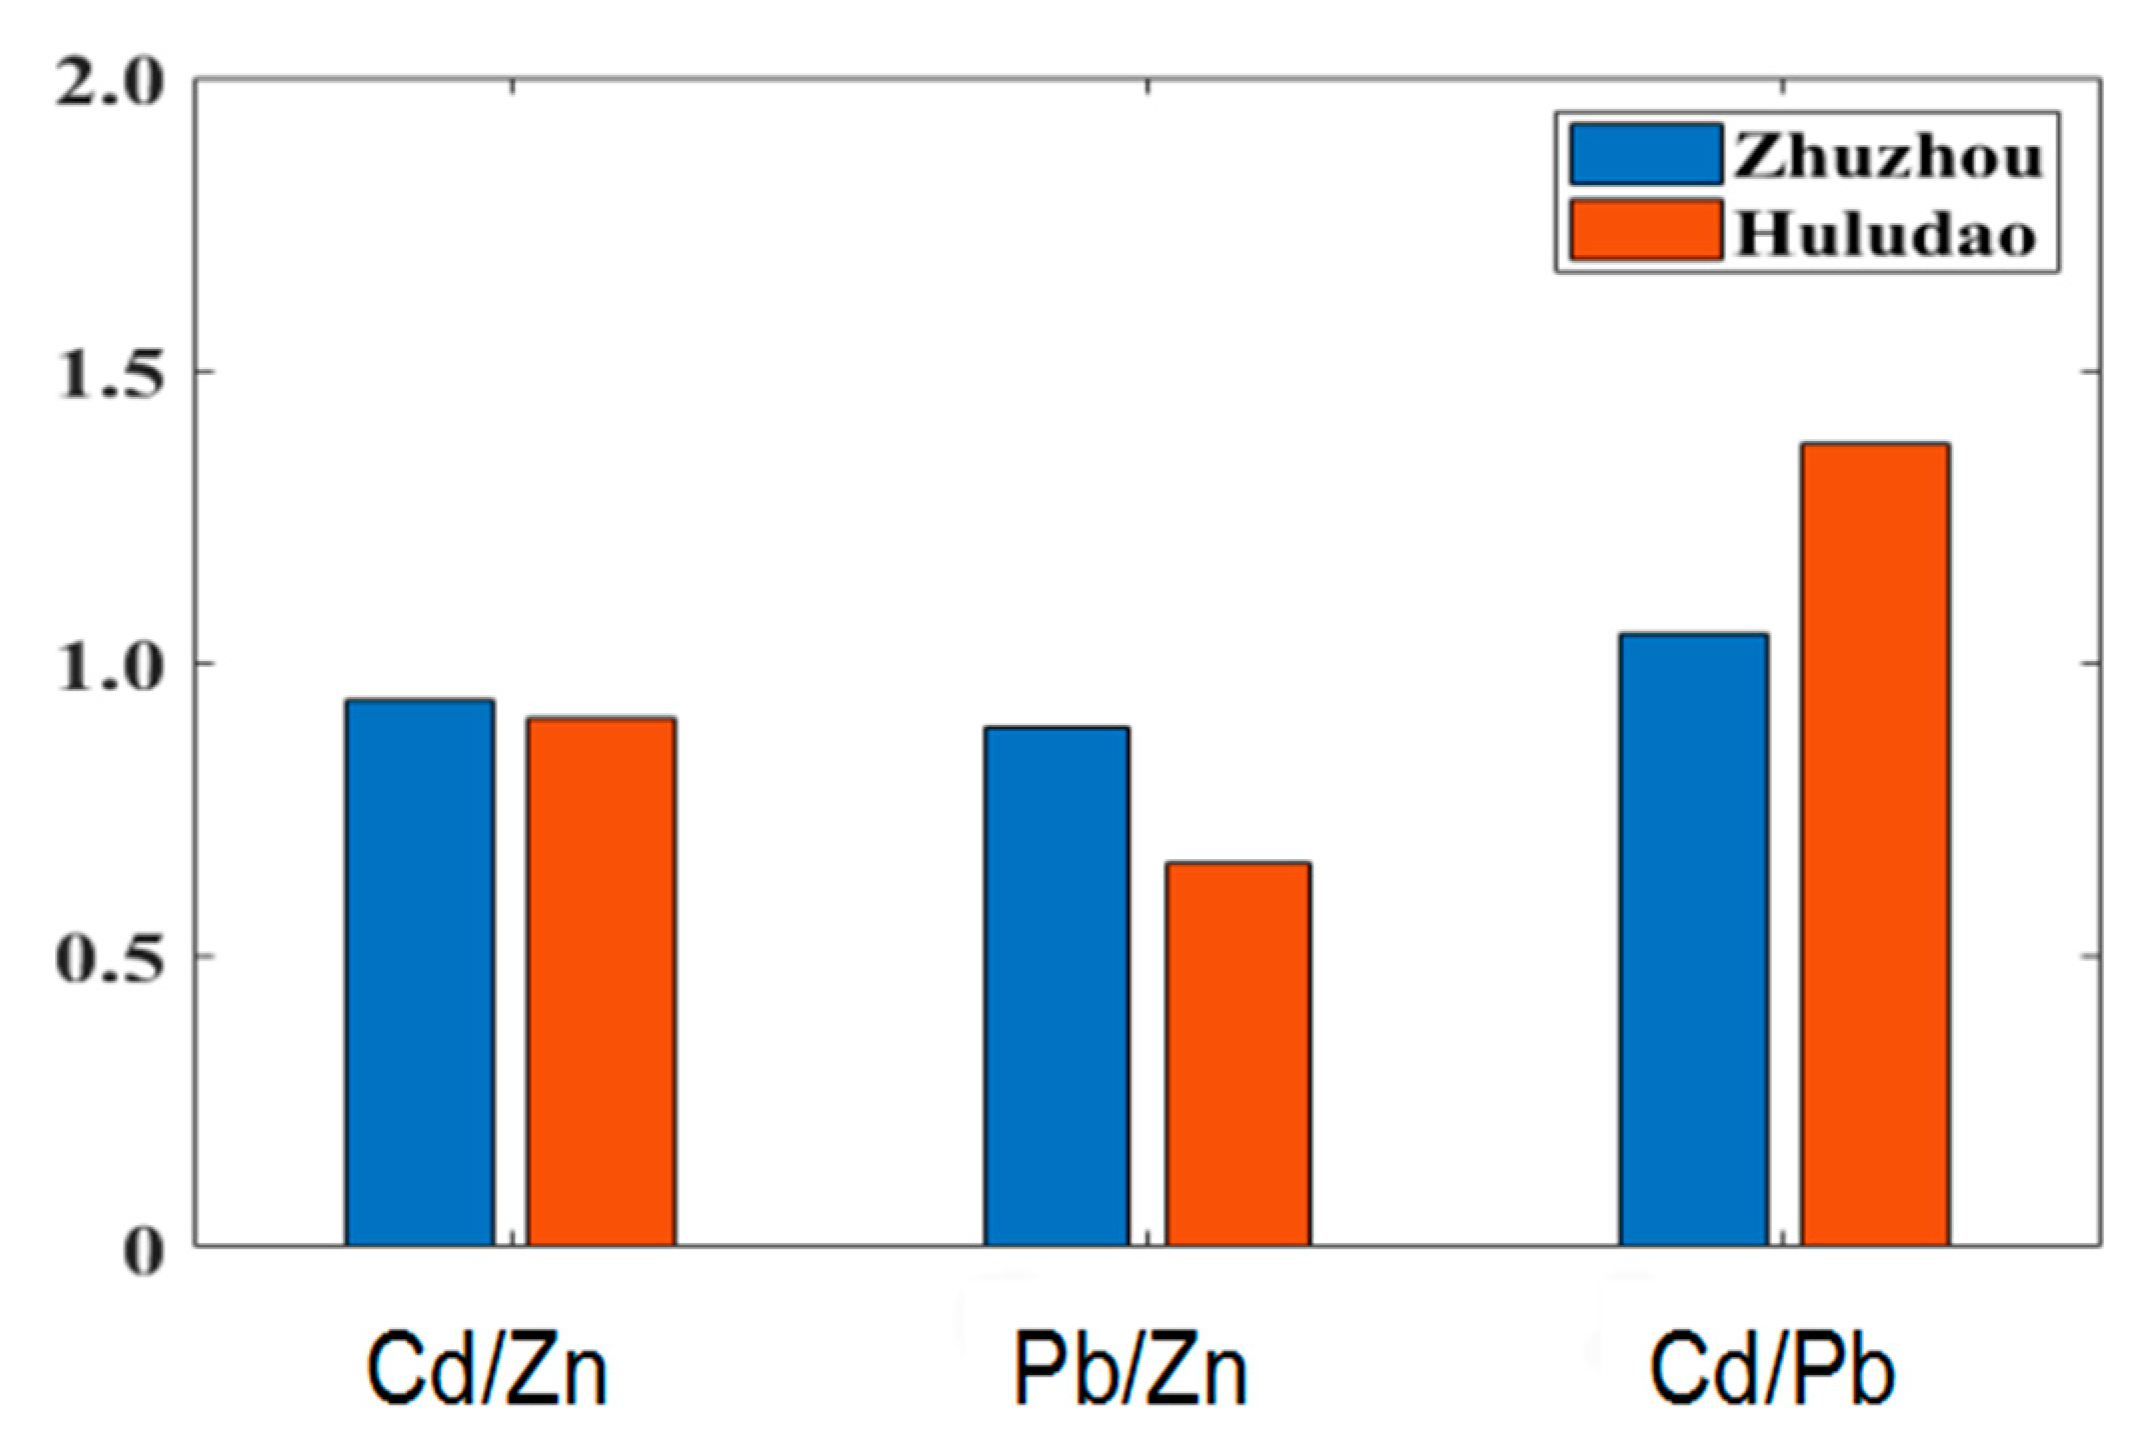
The contribution rate ratios of characteristic elements from the smelting source identified by PMF and the isotope ratio method in the Zhuzhou research area and the Huludao research area were selected to establish the contribution rate fingerprint of characteristic elements. The distribution law of characteristic element contribution rate ratio of the smelting source in two research areas is shown in Figure 8. The contribution rate ratios of agricultural soil to Cd/Zn, Cd/Pb, and Pb/Zn were 0.933, 1.047, and 0.890 in Zhuzhou Smelter and 0.904, 1.374, and 0.657 in Huludao Zinc Plant, respectively. The p values for the contribution rates of the two groups in the two research areas calculated by the small sample Shapiro−Wilk (SW) normality testing were 0.512 and 0.661, respectively, both larger than 0.050, which suggested that the two groups of data were regarded to follow normal distribution. Therefore, the comparison of differences between the contribution rate ratios of the two groups was investigated using the paired t-test. The result showed that p was 0.907 (p > 0.050), indicative of the similarity distribution trend between the ratio of characteristic element contribution rate of the smelting source of the two groups in the smelters. By using the ratio as the sample statistical number for sampling distribution, the confidence interval of the population mean ratio was estimated, meaning the possible range of parameters under a certain probability guarantee. According to the non-negative principle to set the confidence level at 85%, the values of Cd/Zn, Pb/Zn, and Cd/Pb fall at (0.858, 0.978), (0.288, 1.259), and (0.529, 1.892), respectively. Wei et al., (2018) analyzed the sources of heavy metals in agricultural soil around Shuikoushan Lead−Zinc Mine in Hunan Province using PMF, which showed that Cd/Zn and Cd/Pb in the smelting source were 0.873 and 0.880, respectively [77]. Xue (2013) analyzed the main sources of heavy metals in agricultural soil around the polluted site by PMF, and the Pb/Zn of industrial source was 0.783 [78]. These results were in consistent with this work, proving the reliability of our results. The contribution rate fingerprint of characteristic elements from the smelting source provide references for the analysis of heavy metal sources in agricultural soil around the smelter.

4. Conclusions

Based on the study of the pollution characteristics of Zhuzhou and Huludao smelters with serious metal pollution, the following conclusions can be made:
(1)
The soils in the two research areas were both polluted by Cd, Pb, Hg, and Zn. The pollution contamination status of Zn in the Zhuzhou research area was slightly contaminated, while it was serious in the Huludao research area. In terms of spatial distribution, with the increase of the distance, the largest decreases of the main pollution elements concentrations in Zhuzhou research area were as follows, in declining order: Zn (72.65%) > Pb (64.29%) > Cd (22.97%) > Hg (21.88%). In the Huludao research area, the largest decreases of heavy metal concentrations declined in the order: Zn (93.82%) > Hg (87.19%) > Cd (28.67%) > Pb (19.34%). The difference in content reduction of Pb and Hg in the two research areas was related to the migration and sedimentation of smelting waste gas from the smelter with the atmosphere. Correlation analyses have shown that Cd, Pb, and Zn were significantly positively correlated with each other at 0.01 level in both research areas.
(2)
Based on the results of PMF, the contribution rate of heavy metals in agricultural soil around Zhuzhou Smelter was, in descending order: smelting source (37.6%) > agricultural source (26.9%) > natural source (22.4%) > mixed source of industrial activity and traffic (13.1%), while in the Huludao research area, it was as follows, in declining order: smelting source (34.1%) > agricultural source (29.4%) > natural source (24.3%) > mixed source of industrial activity and traffic (12.2%), indicative of the similarity between the source identification and apportionment of heavy metal in the two research areas. The contribution rates of the different pollution sources analyzed by Pb isotope ratio method were the lead smelting source (43.7%), followed by the agricultural source (34.6%), traffic source (14.2%) and natural source (7.5%), which were basically consistent with that of PMF. By complementing PMF and the Pb isotope ratio method to form a multisource analysis system, the results of heavy metal source analysis could be more reliable.
(3)
The results of the analyses using PMF and the Pb isotope ratio method have shown that the two smelters were the main cause of heavy metal pollution for the surrounding agricultural soil. By establishing the heavy metal element content ratio fingerprint and the contribution rate fingerprint of characteristic elements of the agricultural soil around the two smelters, it is suggested that the element content ratio in the Zhuzhou and Huludao smelters showed a similar and regular wavy distribution, and the contribution rate ratios of characteristic elements from smelting source to Cd/Zn, Pb/Zn, and Cd/Pb showed a similar distribution trend in the two research areas, with a ratio interval of (0.858, 0.978), (0.288, 1.259), and (0.529, 1.892), respectively. This may reflect the characteristics of heavy metal pollution in the surrounding agricultural soil around the smelter for soil pollution control decision making.

Supplementary Materials

The following are available online at https://www.mdpi.com/article/10.3390/su13126526/s1, Table S1: Regression relationship between heavy metal content (X) and distance (Y) from sample site to smelter (n = 50).

Author Contributions

Conceptualization, D.Y. and Y.W.; methodology, D.Y.; software, D.Y.; validation, D.Y., Y.W. and J.W.; formal analysis, D.Y.; investigation, X.D.; resources, D.Y.; data curation, D.Y.; writing—original draft preparation, D.Y.; writing—review and editing, Y.W.; visualization, D.Y. and J.W.; supervision, Y.W., G.L., B.L. and J.W.; project administration, Y.W.; funding acquisition, Y.W. All authors have read and agreed to the published version of the manuscript.

Funding

This research was funded by National Key Research and Development Program of China, grant number 2016YFD0800303.

Acknowledgments

We thank the staff of Institute of Applied Ecology for their help.

Conflicts of Interest

The authors declare no conflict of interest.

References

  1. Sharma, R.K.; Agrawal, M.; Marshall, F. Heavy metal contamination of soil and vegetables in suburban areas of Varanasi, India. Ecotoxicol. Environ. Safe. 2007, 66, 258–266. [Google Scholar] [CrossRef]
  2. Xiao, Q.; Zong, Y.T.; Lu, S.G. Assessment of heavy metal pollution and human health risk in urban soils of steel industrial city (Anshan), Liaoning, Northeast China. Ecotox. Environ. Safe. 2015, 120, 377–385. [Google Scholar]
  3. Bi, C.; Zhou, Y.; Chen, Z.; Jia, J.; Bao, X. Heavy metals and lead isotopes in soils, road dust and leafy vegetables and health risks via vegetable consumption in the industrial areas of Shanghai, China. Sci. Total Environ. 2018, 619, 1349–1357. [Google Scholar] [CrossRef] [PubMed]
  4. Shi, T.R.; Ma, J.; Zhang, Y.Y. Status of lead accumulation in agricultural soils across China (1979–2016). Environ. Int. 2019, 129, 35–41. [Google Scholar] [CrossRef]
  5. Zhu, Y.G.; Williams, P.N.; Meharg, A.A. Exposure to inorganic arsenic from rice: A global health issue? Environ. Pollut. 2008, 154, 169–171. [Google Scholar] [CrossRef] [PubMed]
  6. Zhao, F.J.; Mcgrath, S.P.; Meharg, A.A. Arsenic as a food chain contaminant: Mechanisms of plant uptake and metabolism and mitigation strategies. Annu. Rev. Plant Biol. 2010, 61, 535–559. [Google Scholar] [CrossRef] [Green Version]
  7. Li, Z.Y.; Ma, Z.W.; Kuijp, T.J. A review of soil heavy metal pollution from mines in China: Pollution and health risk assessment. Sci. Total Environ. 2014, 468, 843–853. [Google Scholar] [CrossRef]
  8. Alloway, B.J. Sources of Heavy Metals and Metalloids in Soils; Springer: Dordrecht, The Netherlands, 2013; pp. 11–50. [Google Scholar]
  9. Khillare, P.S.; Hasan, A.; Sarkar, S. Accumulation and risks of polycyclic aromatic hydrocarbons and trace metals in tropical urban soils. Environ. Monit. Assess. 2014, 186, 2907–2923. [Google Scholar] [CrossRef]
  10. Liang, J.; Zeng, G.; Gao, X. Spatial distribution and source identification of heavy metals in surface soils in a typical coal mine city, Lianyuan, China. Environ. Pollut. 2017, 225, 681–690. [Google Scholar] [CrossRef] [PubMed]
  11. Kuang, H.F.; Hu, C.H.; Wu, G.L.; Chen, M. Combining Principal Component Analysis (PCA) and Positive Definite Matrix Factorization (PMF), Source Analysis of Heavy Metals in Surface Sediments of Poyang Lake in High Water Period. Lake Sci. 2020, 32, 964–976. [Google Scholar]
  12. Dong, L.R.; Hu, W.Y.; Huang, B. Source apportionment of heavy metals in suburban farmland soils based on positive matrix factorization. China Environ. Sci. 2015, 35, 2103–2111. [Google Scholar]
  13. Munksgaard, N.C.; Batterham, G.J.; Parry, K.L. Lead isotope rations determined by ICP-MS: Investigation of anthropogenic lead in seawater and sediment from the Gulf of Carpentaria, Australia. Mar. Pollut. Bullt. 1998, 36, 527–534. [Google Scholar] [CrossRef]
  14. Komárek, M.; Ettler, V.; Chrastny, V. Lead isotopes in environmental sciences: A review. Environ. Int. 2008, 34, 562–577. [Google Scholar] [CrossRef]
  15. Wu, L.H.; Zhang, C.B.; Zhang, H.B. Application of Lead Stable Isotope in Source Identification of Soil Pollutants. Environ. Sci. 2009, 30, 227–230. [Google Scholar]
  16. Xie, W.C.; Peng, B.; Kuang, X.L. Lead isotopic geochemical tracing of heavy metal pollution sources in the sediments of the Changtan section of the Xiangjiang River. Geochemistry 2017, 46, 380–394. [Google Scholar]
  17. Hansmann, W.; Koppel, V. Lead-isotopes as tracers of pollutants in soils. Chem. Geol. 2000, 171, 123–144. [Google Scholar] [CrossRef]
  18. Liu, Y.; Wang, C.J.; Liu, H.; Feng, T.; Ma, H.Z.; Zhang, Q.H.; Sun, D.L. The application of lead isotope analysis technology in industrial park pollution source tracing. Techn. Equip. Environ. Pollut. Cont. 2015, 9, 3031–3036. [Google Scholar]
  19. Han, L.F.; Gao, B.; Lu, J.; Zhou, Y.; Xu, D.Y.; Gao, L.; Sun, K. Pollution characteristics and source identification of trace metals in riparian soils of Miyun Reservoir, China. Ecotox. Environ. Saf. 2017, 144, 321–329. [Google Scholar] [CrossRef]
  20. Lei, M.; Zeng, M.; Zheng, Y.M.; Liao, B.H.; Zhu, Y.G. Heavy metal pollution and potential risk assessment of paddy soil in Hunan mining and smelting areas. Acta Sci. Circum. 2008, 6, 1212–1220. [Google Scholar]
  21. Liu, C.H.; Yi, Y.L.; Zhang, D.G.; Zhu, H.G.; Yang, Y. Study on the status of soil cadmium pollution around Huludao Zinc Factory. Soil Bullet. 2003, 4, 326–329. [Google Scholar]
  22. Wu, S.T.; Wu, X.F.; Hu, Y.L. Study on soil pollution and heavy metal accumulation plants in Pb zinc smelter. Ecol. Environ. 2004, 13, 156–157. [Google Scholar]
  23. Li, L.L.; Wang, Y.S.; Zhang, D.G. Spatial distribution and pollution evaluation of soil lead in Huludao City. Soil 2006, 38, 465–469. [Google Scholar]
  24. Zhang, X.W.; Wang, Q.C.; Zheng, D.M. Spatial pattern and risk assessment of soil arsenic pollution around Huludao Zinc Plant. J. Agric. Environ. Sci. 2008, 5, 1769–1773. [Google Scholar]
  25. Chang, S.; Xu, W.D.; Huang, D.N.; Fu, J.X. Heavy metal pollution status and ecological risk assessment of soil around Huludao Zinc Factory. J. Hunan Ecol. Sci. 2017, 4, 8–14. [Google Scholar]
  26. Zhang, X.W. Analysis of Heavy Metal Pollution Sources in Soil and Rice in an Industrial Zone in Hunan; Chinese Academy of Agricultural Sciences: Beijing, China, 2019. [Google Scholar]
  27. Zhao, Y.R.; Gu, J.H.; Wan, W.; Zhang, H.; Wang, M.Q. Characteristics of heavy metal pollution and Pb isotopic tracing of farmland soil in Zhuzhou suburbs. Acta Sci. Circum. 2020, 40, 1074–1084. [Google Scholar]
  28. Xiao, C.; Ye, J.; Esteves, R.M.; Rong, C. Using Spearman’s correlation coefficients for exploratory data analysis on big dataset. Concurr. Comp. Pract. Exp. 2016, 28, 3866–3878. [Google Scholar] [CrossRef]
  29. Lu, J.B. China’s Rice Industry: Supply and Demand, Circulation and Future Policy Orientation: Speech at the World Rice Trade Conference of the First International Rice Conference. Chin. Rice 2002, 6, 11–13. [Google Scholar]
  30. Na, Z.; Wang, Q.; Zheng, D. Mercury contamination and health risk to crops around the zinc smelting plant in Huludao City, northeastern China. Environ. Geochem. Health 2007, 29, 385–393. [Google Scholar]
  31. Zhang, Z.S.; Wang, Q.; Zheng, D. Mercury distribution and bioaccumulation up the soil-plant-grasshopper-spider food chain in Huludao City, China. J. Environ. Sci. 2010, 22, 1179–1183. [Google Scholar] [CrossRef]
  32. Determination of Soil pH (NY/T 1377-2007); Ministry of Agriculture of the PRC: Beijing, China, 2007.
  33. Chinese Environmental Protection Administration. Environmental Quality Standard for Soils (GB 15618-1995); CEPA: Beijing, China, 1995.
  34. Soil Quality-Determination of Total Mercury, Total Arsenic and Total Lead-Atomic Fluorescence Method-Part 1: Determination of Total Mercury in Soil (GB/T 22105.1-2008); Standardization Administration: Beijing, China, 2018.
  35. Soil Quality-Determination of Total Mercury, Total Arsenic and Total Lead-Atomic Fluorescence Method-Part 2: Determination of Total Arsenic in Soil (GB/T 22105.2-2008); Standardization Administration: Beijing, China, 2018.
  36. Chen, T.; Liu, X.M.; Li, X. Heavy metal sources identification and sampling uncertainty analysis in a field-scale vegetable soil of Hangzhou, China. Environ. Pollut. 2009, 157, 1003–1010. [Google Scholar] [CrossRef]
  37. General Rules for Inductively Coupled Plasma Mass Spectrometry (DZ/T 0223-2001); Ministry of Ecology and Environment of the People’s Republic of China: Beijing, China, 2001.
  38. Chen, H.Y.; Teng, Y.G.; Li, J. Source apportionment of trace metals in river sediments: A comparison of three methods. Environ. Pollut. 2016, 211, 28–37. [Google Scholar] [CrossRef] [PubMed]
  39. Determination of Trace Lead Isotopic Composition in Rocks and Minerals (DZ/T 0184.12-1997); Ministry of Geology and Mineral Resources, PRC: Beijing, China, 1997.
  40. He, H.X.; Yu, R.L.; Hu, G.R. Pollution history and source of heavy metals in coastal sediments from Xiamen Western Bay. China Environ. Sci. 2014, 34, 1045–1051. [Google Scholar] [CrossRef]
  41. Chen, T.B.; Zheng, Y.M.; Lei, M.; Huang, Z.C.; Wu, H.T.; Chen, H. Assessment of heavy metal pollution in surface soils of urban parks in Beijing, China. Chemosphere 2005, 60, 542–551. [Google Scholar] [CrossRef]
  42. Soil Environmental Quality Standards for Risk Control of Soil Pollution on Agricultural Land (GB 15618-2018); Standardization Administration: Beijing, China, 2018.
  43. Chen, H.; Lu, X.; Chang, Y.; Xue, W. Heavy metal contamination in dust from kindergartens and elementary schools in Xi’an, China. Environ. Earth Sci. 2014, 71, 2701–2709. [Google Scholar] [CrossRef]
  44. Ma, L.; Yang, Z.; Li, L.; Wang, L. Source identifcation and risk assessment of heavy metal contaminations in urban soils of Changsha, a mine-impacted city in Southern China. Environ Sci. Pollut. Res. 2016, 23, 17058–17066. [Google Scholar] [CrossRef] [PubMed]
  45. Yari, A.A.; Varvani, J.; Zare, R. Assessment and zoning of environmental hazard of heavy metals using the Nemerow integrated pollution index in the vineyards of Malayer city. Acta Geophys. 2021, 69, 149–159. [Google Scholar] [CrossRef]
  46. Yan, Y.; Zhang, X.W.; Guo, B.L. Research progress of lead-cadmium-zinc-mercury stable isotopes in the analysis of heavy metal pollution sources. Environ. Chem. 2020, 39, 2712–2721. [Google Scholar]
  47. China National Environmental Monitoring Station. Background Value of Soil Elements in China, Beijing; China Environmental Science Press: Beijing, China, 1990. [Google Scholar]
  48. Xi, C.Z.; Dai, T.G.; Huang, D.Y. Distribution characteristics and pollution evaluation of soil heavy metals in Zhuzhou City, Hunan. Geol. China 2008, 3, 172–178. [Google Scholar]
  49. Liu, C.Z. Soil Heavy Metal Pollution and Potential Risk Assessment in the Main Watersheds of Hunan Province; Hebei Agricultural University: Baoding, China, 2011. [Google Scholar]
  50. Li, J.; Yang, Z.W.; Li, Y.; Tan, W.; Yuan, W.Z.; Jiang, J.Y. Comparative Study on the Effect of Two Receptor Models to Analyze the Source of Soil Heavy Metal. Environ. Sci. Res. 2020, 1–13. [Google Scholar]
  51. Abkhoshk, E.; Jorjani, E.; Al-Harahsheh, M.S.; Rashchi, F.; Naazeri, M.J.H.V. Review of the hydrometallurgical processing of non-sulfide zinc ores. Hydrometallurgy 2014, 149, 153–167. [Google Scholar] [CrossRef]
  52. Cheng, Y.X.; Zhao, Z.S.; Wang, Y.Z.; Qiu, K.Y.; Fu, Y.L.; Zhao, E.S.; Li, L.P. Heavy metal pollution characteristics of farmland soil near a lead smelter in Henan Province. Soil Bullet. 2014, 45, 1505–1510. [Google Scholar]
  53. Zhang, C.; Huang, L.; Luan, T. Structure and function of microbial communities during the early stages of revegetation of barren soils in the vicinity of a Pb/Zn smelter. Geoderma 2006, 136, 555–565. [Google Scholar] [CrossRef]
  54. Bi, X.; Feng, X.; Yang, Y.; Qiu, G.; Li, G.; Li, F.; Jin, Z. Environmental contamination of heavy metals from zinc smelting areas in Hezhang County, western Guizhou, China. Environ. Int. 2006, 32, 883–890. [Google Scholar] [CrossRef] [PubMed]
  55. Douay, F.; Pruvot, C.; Roussel, H. Contamination of urban soils in an area of northern France polluted by dust emissions of two smelters. Water Air Soil Pollut. 2008, 188, 247–260. [Google Scholar] [CrossRef]
  56. Xu, L. Statistical Analysis and Numerical Simulation Study on the Characteristics of Severe Convective Weather in Hunan; Nanjing University of Information Technology: Nanjing, China, 2011. [Google Scholar]
  57. Guo, L.Y.; Liao, Y.F.; Li, J. The construction of historical wind and hail disaster sequence in Hunan and its changing characteristics. Dis. Sci. 2018, 33, 122–127. [Google Scholar]
  58. Chai, S.W.; Wen, Y.M.; Zhang, Y.N. Characteristics of heavy metal content in agricultural soils in the suburbs of Guangzhou. China Environ. Sci. 2003, 23, 592–596. [Google Scholar]
  59. Guo, G.H.; Wu, F.C.; Xie, F.Z. Spatial distribution and pollution assessment of heavy metals in urban soils from southwest China. J. Environ. Sci. 2012, 24, 410–418. [Google Scholar] [CrossRef]
  60. Andreas, A. Magmatic-hydrothermal evolution in a fractionating granite: A microchemical study of the Sn-W-F mineralized Mole Granite (Australia). Geochim. Cosmochim. Acta 2000, 64, 3373–3393. [Google Scholar]
  61. Wei, J.X.; Cen, K.; Zhao, L.S. Discussion on the genesis of the forward zoning of magma-hydrothermal deposits. Min. Res. Geolog. 2018, 32, 65–71. [Google Scholar]
  62. Safarzadeh, M.S.; Bafghi, M.S.; Moradkhani, D. A review on hydrometallurgical extraction and recovery of cadmium from various resources. Miner. Eng. 2007, 20, 211–220. [Google Scholar] [CrossRef]
  63. Ai, J.C.; Wang, N.; Yang, J. Analysis of soil heavy metal sources in Jiapigou gold mining area based on UNMIX model. Environ. Sci. 2014, 35, 3530–3536. [Google Scholar]
  64. Huang, D.W.; Gui, H.R. The characteristics and source analysis of soil heavy metals in Sunan mining area. Earth Environ. 2017, 45, 546–554. [Google Scholar]
  65. Jiao, W.; Chen, W.; Chang, A.C. Environmental risks of trace elements associated with long-term phosphate fertilizers applications: A review. Environ. Pollut. 2012, 168, 44–53. [Google Scholar] [CrossRef] [PubMed]
  66. Devasena, M.; Nambi, I.M. Migration and entrapment of mercury in porous media. J. Contam. Hydrol. 2010, 117, 60–70. [Google Scholar] [CrossRef]
  67. Li, C.; Duan, Y.; Tang, H. Study on the Hg emission and migration characteristics in coal-fired power plant of China with an ammonia desulfurization process. Fuel 2018, 211, 621–628. [Google Scholar] [CrossRef]
  68. Qiu, Q.L.; Feng, X.B. Environmental contamination of mercury from Hg-mining areas in Wuchuan, northeastern Guizhou, China. Environ. Pollut. 2006, 142, 549–558. [Google Scholar] [CrossRef]
  69. Feng, X.B.; Qiu, G.L.; Fu, X.W.; He, T.R.; Li, P.; Wang, S.F. Mercury pollution in the environment. Prog. Chem. 2009, 21, 436–455. [Google Scholar]
  70. Hongling, G. Atmospheric mercury pollution in Beijing. Chin. J. Popul. Res. Environ. 2009, 7, 92–96. [Google Scholar] [CrossRef]
  71. Zhao, Z.; Shi, Y.H.; Mao, X.J.; Li, H.C. Evaluation and Analysis of Heavy Metal Pollution and Source Apportionment in the Soil Around a Smelter. Chin. J. Inorg. Chem. 2020, 10, 22–27. [Google Scholar]
  72. Li, Y.M.; Li, H.P.; Zhang, L.K.; Fan, J.; Jiao, K.L.; Sun, P. Distribution characteristics and source analysis of soil heavy metals around a copper factory in Baotou. J. Agric. Environ. Sci. 2016, 35, 1321–1328. [Google Scholar]
  73. Yan, D.; Bai, Z.; Liu, X. Heavy-metal pollution characteristics and influencing factors in agricultural soils:Evidence from Shuozhou city, Shanxi province, China. Sustainability 2020, 12, 1907. [Google Scholar] [CrossRef] [Green Version]
  74. Zhang, S.; Liu, Y.; Ni, X.; Arif, M.; Charles, W.; Li, C. Trace elements in soils of a typical industrial district inNingxia, northwest China: Pollution, source, and risk evaluation. Sustainability 2020, 12, 1868. [Google Scholar] [CrossRef] [Green Version]
  75. Jiang, Z.L. Investigation and Evaluation of Soil Pollution in the Surrounding Farmland of a Molybdenum Mining Area in Fujian; Fujian Agriculture and Forestry University: Fujian, China, 2014. [Google Scholar]
  76. Jiang, Y.L.; Ruan, X.L.; Ma, J.H. The characteristics and classification management of heavy metal pollution in sewage irrigated farmland near a battery factory in Xinxiang City. Acta Sci. Circum. 2020, 40, 645–654. [Google Scholar]
  77. Wei, Y.H.; Li, G.C.; Wang, Y.H.; Zhang, Q.; Li, B.; Wang, S.C.; Cui, J.H.; Zhang, H.; Zhou, Q. Investigation on the influencing factors of PMF model—Taking the analysis of heavy metal sources in farmland surrounding a lead-zinc mine as an example. Agric. Environ. Sci. J. 2018, 37, 2549–2559. [Google Scholar]
  78. Xue, J.L. Pollution Characteristics of Heavy Metals in Farmland Soil around Contaminated Sites and PMF Source Analysis; Zhejiang University: Hangzhou, China, 2014. [Google Scholar]
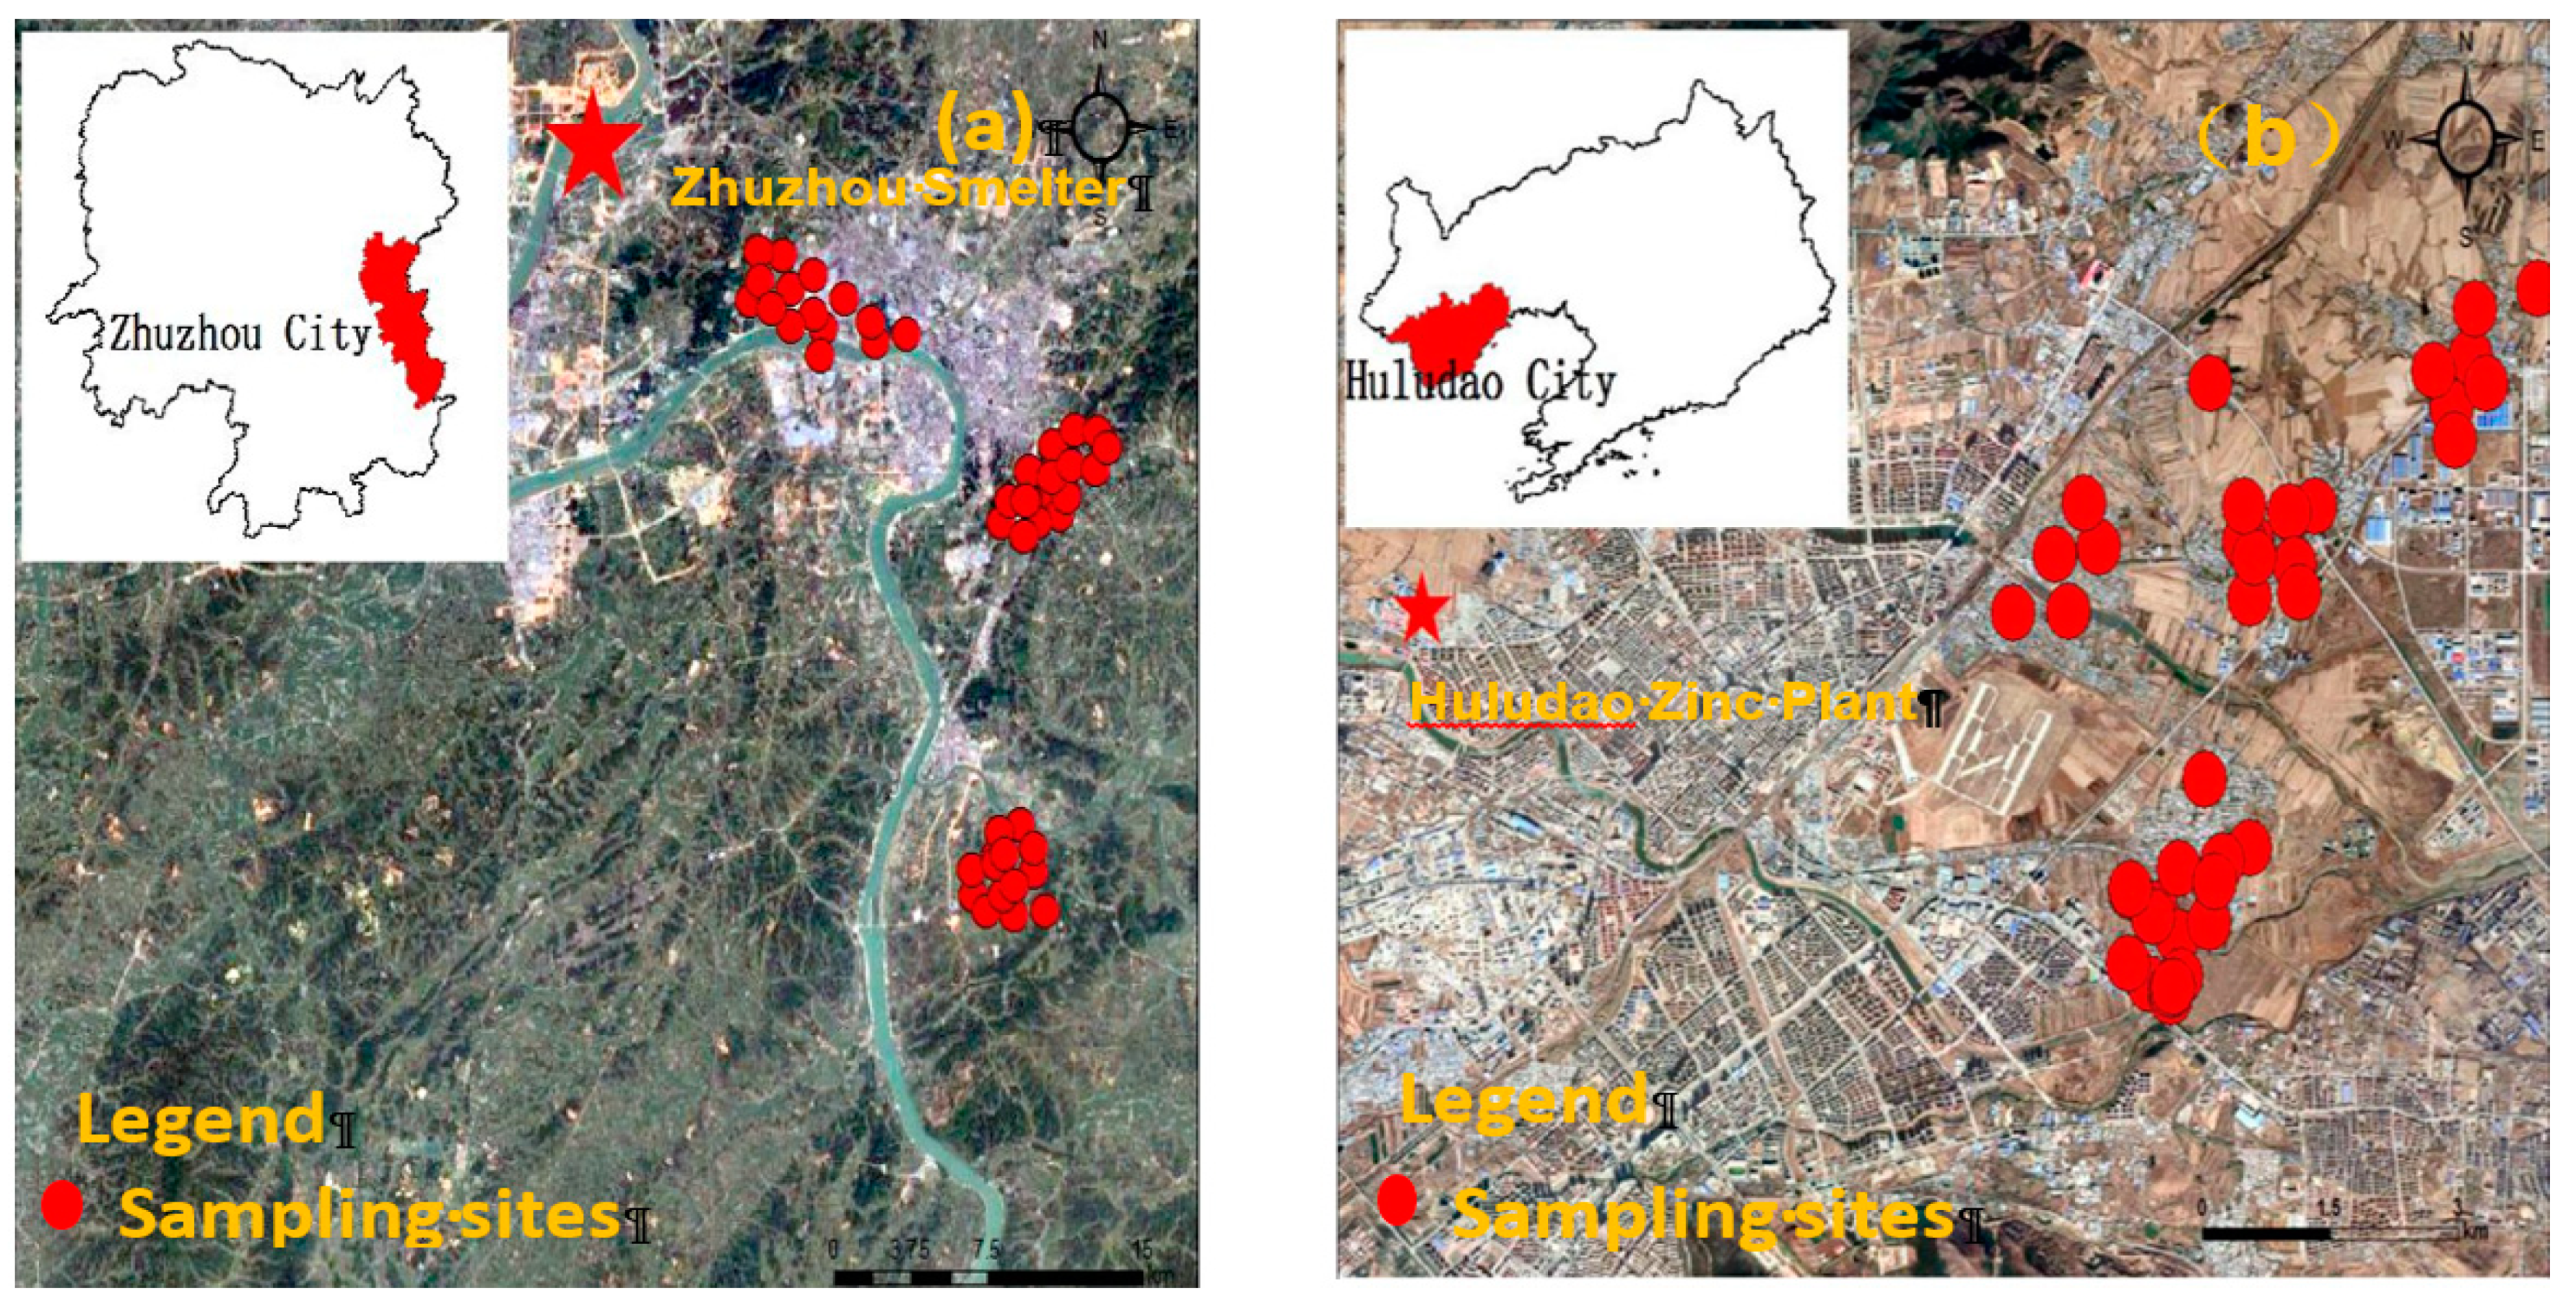
Figure 1. Location of the sampling sites in the Zhuzhou research area (a) and Huludao research area (b).
Sustainability 13 06526 g001
Figure 2. Pi of heavy metals in the Zhuzhou research area (a) and Huludao research area (b) (n = 50). Note: Pi: single pollution index.
Sustainability 13 06526 g002
Figure 3. Spatial distribution of heavy metal concentration in the Zhuzhou research area. Note: (a): Spatial distribution of Pb, Cr, Cu and Zn concentration in the Zhuzhou research area; (b): Spatial distribution of Ni, As, Hg and Cd concentration in the Zhuzhou research area; The concentration of Zn was 0.1 times the actual concentration, and the concentration of Hg was 10 times the actual concentration.
Sustainability 13 06526 g003
Figure 4. Spatial distribution of heavy metal concentration in the Huludao research area. Note: (a): Spatial distribution of Pb, Cu, Cr and Zn concentration in the Huludao research area; (b): Spatial distribution of Ni, Hg, As and Cd concentration in the Huludao research area; The concentration of Zn was 0.1 times the actual concentration, and the concentration of Hg was 10 times the actual concentration.
Sustainability 13 06526 g004
Figure 5. 208Pb/204Pb—206Pb/204Pb in soils and potential sources.
Sustainability 13 06526 g005
Figure 6. Source contribution for different sources by the Pb isotope ratio method in the Huludao research area.
Sustainability 13 06526 g006
Figure 7. The heavy metal element content ratio fingerprint in the agricultural soil around Zhuzhou Smelter and Huludao Zinc Plant. Note: Content ratio to Zn: Ratio of contents of Cd, Pb, As, Hg, Cr, Ni, Cu, to Zn.
Sustainability 13 06526 g007
Figure 8. The contribution rate fingerprint of characteristic elements from the smelting source in the agricultural soil around Zhuzhou Smelter and Huludao Zinc Plant.
Sustainability 13 06526 g008
Table 1. Grade standards for the pollution index (Pi) and Nemerow Integrated Pollution Index (NIPI).
ClassPiNIPIQuality Value
1Pi ≤ 0.7NIPI ≤ 0.7Practically uncontaminated
20.7 < Pi ≤ 1.00.7 < NIPI ≤ 1.0Relatively uncontaminated
31.0 < Pi ≤ 2.01.0 < NIPI ≤ 2.0Low contamination
42.0 < Pi ≤ 3.02.0 < NIPI ≤ 3.0Moderate contamination
5Pi > 3.0NIPI > 3.0High contamination
Table 2. Descriptive statistics of soil heavy metal concentrations (mg·kg−1, n = 50).
ElementCdPbAsHgCrNiCuZn
ZhuzhouMin0.5132.204.980.0856.1026.4018.5072.50
Max9.25307.5023.702.37212.4048.8085.40922.50
Mean2.3195.1015.440.48121.2835.3843.96257.30
SD2.5869.783.450.4036.495.4914.62226.26
BVHP0.1329.4015.700.1271.4031.9027.3094.40
Percent of over BVHP%100.00100.0050.0092.0098.0070.0096.0098.00
HuludaoMin0.9622.503.600.0741.0019.0019.8092.30
Max22.50210.3027.7020.0077.5037.60151.701268.20
Mean5.2383.3311.663.0555.1024.7851.21409.40
SD3.1836.584.694.746.313.3225.91247.71
BVLP0.1121.108.800.0457.9025.6019.8063.50
Percent of over BVLP%100.00100.0082.00100.0024.0092.00100.00100.00
Notes: SD: standard deviation; BVHP: background values of Hunan Province; BVLP: background values of Liaoning Province.
Table 3. The mean value of pollution indexes for Zn and Cd in this study and other smelting areas in China.
CityTypeZnCdReference
HenanPb smelting1.2278.1[52]
ShaoguanPb−Zn smelting4.9395.7[53]
YongzhouPb mining and smelting 10.095.38[20]
ZhuzhouPb smelting3.217.8This work
HuludaoZn mining and smelting6.447.6This work
Table 4. Spearman’s correlations matrix of the heavy metal concentrations.
ElementCdPbAsHgCrNiCuZn
ZhuzhouCd1.000
Pb0.675 **1.000
As0.758 **0.573 **1.000
Hg0.714 **0.718 **0.677 **1.000
Cr0.436 **0.490 **0.326 *0.342 *1.000
Ni0.1410.176−0.0320.0430.701 **1.000
Cu0.2730.364 **0.1110.2450.592 **0.725 **1.000
Zn0.708 **0.691 **0.469 **0.652 **0.558 **0.398 **0.485 **1.000
HuludaoCd1.000
Pb0.847 **1.000
As0.356 *0.306 *1.000
Hg0.422 **0.551 **0.382 **1.000
Cr0.0280.198−0.464 **0.1031.000
Ni0.1260.281 *−0.2450.340 *0.852 **1.000
Cu0.627 **0.734 **0.2390.335 *0.1820.293 **1.000
Zn0.882 **0.890 **0.376 **0.364 **0.0810.1310.785 **1.000
Note: * correlation is significant at p < 0.05 (two-tailed); ** correlation is significant at p < 0.01 (two-tailed).
Table 5. Source contribution for different elements by the positive matrix factorization (PMF) in the Zhuzhou research area (a) and Huludao research area (b).
Element(a) Contribution Rate (%)(b) Contribution Rate (%)
Factor 1Factor 2Factor 3Factor 4Factor 1Factor 2Factor 3Factor 4
Cd69.711.86.112.472.78.76.312.3
Zn74.719.206.280.411.61.36.7
Pb66.618.48.46.652.97.328.511.3
Cu61.623.59.15.751.720.421.46.5
Ca17.142.59.530.912.645.711.730.0
Fe34.824.537.03.724.432.240.23.2
Mg36.747.715.6027.349.822.90
Al33.818.043.84.419.528.349.23.0
K19.01.669.99.520.90.372.76.1
Hg10.80.6088.61.010.73.584.8
Ni32.722.739.65.023.226.545.94.4
Cr33.023.040.23.725.524.946.43.2
As34.1056.59.432.66.758.32.4
Total37.622.426.913.134.124.329.412.2
Publisher’s Note: MDPI stays neutral with regard to jurisdictional claims in published maps and institutional affiliations.