Abstract
Based on the benefits of integrated gasification combined cycles (IGCCs), a cogeneration plant for providing electricity and freshwater is proposed. The main novelties of the devised system are the integration of biomass gasification and a regenerative gas turbine with intercooling and a syngas combustor, where the syngas produced in the gasifier is burned in the combustion chamber and fed to a gas turbine directly. The energy discharged from the gas turbine is utilized for further electricity and freshwater generation via Kalina and MED hybridization. The proposed system is analyzed from energy, exergy, exergoeconomic, and reliability–availability viewpoints. The optimal operating condition and optimum performance criteria are obtained by hybridizing an artificial neural network (ANN), the multi-objective particle swarm optimization (MOPSO) algorithm. According to results obtained, for the fourth scenario of the optimization process, optimal values of , , , and are obtained for the exergy efficiency, freshwater production rate, sum unit cost of products, and net output power, respectively. According to reliability and availability assessment, the probability of the healthy working state of all components and subsystems is the system is shown to be available of the time over the 20-year lifetime.
1. Introduction
Considerable reduction in fossil fuel resources, greenhouse gases (carbon dioxide, Sulfur dioxide, and nitrogen oxide) emission, and environmental issues, such as global warming and acid rain, prompted the researchers to explore carbon-free and more environmentally benign energy sources []. Renewable energy sources, such as biofuels, are receiving significant attention worldwide. Being available extensively and replenishable, biomass and wastes from various resources such as residues of agricultural, forestry, dairy, and domestic activities can be regarded as sustainable resources []. Moreover, biomass and various wastes can be employed to drive several systems for such products as electricity, heat, cooling, potable water, ethanol, and renewable biodiesel, through various conversion pathways [].
Among the conversion pathways, biomass gasification is an efficient method for syngas production. Gasification of biomass and wastes includes partial oxidation in a closed chamber that yields to gaseous products []. Among the different gasifier types, the fixed-bed downdraft gasifier is recognized as advantageous since it has a relatively high conversion efficiency compared to other gasification methods [].
The final syngas produced during the gasification process is usually used in subsequent conversion processes, including combustion in a gas turbine. The concept of integration of the gasification process with a gas turbine cycle for power generation was introduced by Weil [] in 1950. The integrated gasification combined cycle (IGCC) combines a solid fuel gasification unit with an integrated gas turbine–steam power plant to enhance performance and achieve higher efficiency []. To enhance the power generation capacity, the off-gases of the gas turbine are used as an energy source to drive a steam cycle through a heat recovery steam generator (HRSG) []. For instance, Soltani et al. [] analyzed an integrated biomass gasification and gas turbine combined cycle from energy and exergy perspectives. They showed that, for a particular gas turbine inlet temperature and cold-end temperature difference of the heat exchanger, the thermal efficiency of the system could be maximized by adjusting the pressure ratio. Gholamian et al. [] proposed a novel multi-generation system based on an IGCC, which includes a biomass gasification system, a gas turbine cycle, a supercritical CO2 cycle, and a domestic water heater. For the case of wood as the biomass input, the highest exergy efficiency was calculated to be . Ahmadi et al. [] applied a steam Rankine cycle (SRC) to recover the waste energy of a micro gas turbine, and analyzed the system from thermodynamic, environmental, and exergoeconomic viewpoints. They also carried out optimization, and employed evolutionary algorithms to determine the optimum design parameters. Köse et al. [] investigated the utilization of a steam Rankine cycle and an organic Rankine cycle (ORC) as the bottoming cycle of the gas turbine. They performed a parametric optimization to analyze the effects of various working fluids on the ORC subsystem. Optimum performance criteria were obtained for the overall system, including the SRC-ORC bottoming cycle with R141b as the working fluid. Optimal values of energy efficiency, exergy efficiency, and the net output power were evaluated as , and , respectively.
Freshwater shortages are significant concerns for many nations, especially in the Middle East. Water desalination processes are options for addressing such problems []. The main technologies of water desalination are thermal and membrane methods. Thermal desalination processes include multi-effect thermal vapor compression (ME-TVC), multi-effect distillation (MED), and multi-stage flash (MSF), while membrane processes mainly include reverse osmosis (RO) and electrodialysis (ED) []. Thermal desalination processes, especially those combined with power generation cycles, constitute a considerable share of the global desalination market; in the Persian Gulf region, for example, thermal processes account for of the desalination industry []. Among the different types of thermal desalination systems, MED units have several advantages: including (1) exploitation of low-grade energy sources such as solar energy, geothermal energy, and waste energy [], and (2) straightforward integration of MED units into energy systems []. Hence, a promising application for heat recovery is with thermal desalination systems, especially MED units. Baccioli et al. [] employed a MED system for waste heat recovery in an ORC plant, and showed that the hybridization of the MED unit to ORC decreases the payback period and lessens the initial cost. An integrated plant comprising GT, MED, and RO systems for electricity and freshwater production was developed by Mokhtari et al. []. They concluded that the total cost could be decreased from to by supplying excess power to the RO system.
In addition, several studies have been performed to evaluate the achievements and challenges in the establishment of eco-efficient water infrastructure towards sustainable urban development. Chini et al. [] examined the relationship between water and energy in typical household appliances and fixtures. They revealed that applying a cost abatement analysis for the average U.S. household yields a potential annual savings of 7600 kWh and 39,600 gallons per household. Notaro et al. [] presented a decision support tool to analyze the water and energy balance in the integrated water service in the Favara di Burgio system (Sicily, Italy). They revealed that the decision support tool could offer efficient solutions, according to the operator objectives, concerning energy and water loss management. Additionally, the proposed method could provide guidelines for choosing the best management solutions, depending on the particular analyzed system, and allow, at the same time, energy and water resources saving. Freni and Sambito [] studied the principal energy saving and recovery measures that can be employed in complex integrated urban water systems. By using such techniques, the reduction of water losses can be obtained through the control strategies, resulting in decreased energy consumption and environmental impact.
As in traditional power systems, IGCC systems include various components, where the failure of any part can lead to the failure of the entire system. Hence, the study of the failure and the reasons for the failure offer better identification of the system and precise determination of the final cost of the products []. Few researchers have analyzed the availability and reliability of cogeneration systems. Two component-reliability-importance metrics, including FCI (failure cost importance) and PI (potential failure cost importance), were developed by Jiang et al. [] for assessment of the maintenance prioritization of constituents in a combined cooling, heating, and power cycle. A combined system consisting of a multi-stage flash (MSF) desalination unit, a gas turbine (GT), and an HRSG unit was studied by Hosseini et al. [] from thermodynamic and reliability viewpoints. They determined that the application of reliability analysis could increase the water and electricity generation costs by about and , respectively. A reliability and economic study of a hybrid system of gas turbine cycle and an MSF desalination unit was performed by Arani et al. []. They applied the variable reliability over the operating lifetime, and observed that the payback period increased about nine months, while the net present value (NPV) decreased by around USD 18 million. Wang et al. [] developed a modified exergoeconomic analysis considering space-state reliability assessment to study the cost assignations in a biomass-based multi-generation plant. Their results revealed that the gasification system’s repair and failure rates considerably affect the product cost. In addition, by considering reliability analysis, an approximate rise of in the specific exergy cost of the products can be observed. Razmi and Janbaz [] performed an exergoeconomic analysis considering reliability and availability indices on an electricity and distilled water cogeneration system. Their results determined that the cost of electricity and distilled water was improved by and , by accounting for reliability considerations.
Main Novelties and Contributions
As discussed in previous paragraphs, based on the benefits of integrated gasification combined cycles (IGCCs) and multi-effect distillation (MED), a cogeneration plant for providing electricity and freshwater is proposed. The devised system’s main novelties lie in the integration of biomass gasification and a regenerative gas turbine with intercooling and a syngas combustor, where the syngas produced in the gasifier is burned in the combustion chamber and directly fed to a gas turbine. In most previously published papers, the combusted syngas is used indirectly through heat recovery systems for various commodity production aims. Using syngas produced in the gasifier directly may lead to various challenges, such as tar and char production through the gasification process. To address these problems, the gasification process is properly designed using a fixed-bed downdraft gasifier and gas cleaning unit. The downdraft gasifier is categorized among the cocurrent reactors where the produced syngas flows down through the high-temperature hot ash bed, which enables the gasifier to favorably crack the tar particles. The syngas produced leaves and ash drops to the bottom of the gasifier. For this reason, the lowest tar content () is produced in a downdraft gasifier among various types of gasifiers. In addition, the fixed-bed downdraft gasifier matches more appropriately the combustion chamber since a shorter time is needed to fire and bring the plant to the operating mode in a downdraft gasifier in comparison to other types of gasifiers. Furthermore, using a proper gas cleaning unit makes the produced syngas applicable in combustion chambers.
Waste heat produced in the topping plant is a favorable option to supply the energy needed for desalination units. Low-grade waste heat has been defined as the heat that is not economically efficient to be recovered in the relevant process. Waste heat utilization is a viable choice to raise energy efficiency, which can reduce global carbon-dioxide emissions. Thus, the energy discharged from the gas turbine is utilized through a HRSG for further electricity and freshwater generation. Another key motivation of the proposed system is the combination of a SRC and a MED desalination unit, where the latter device acts as the condenser in the SRC plant. Such an arrangement results in higher thermal and exergy efficiencies than either plant would have individually.
In addition, despite various studies on IGCC-based cogeneration systems from multiple viewpoints, the availability and reliability of IGCC-based cogeneration plants have not been studied extensively. Hence, the proposed electricity and freshwater production plant is evaluated from the reliability and availability points of view by employing the Markov theory. A multi-objective optimization is carried out to determine the optimum values of the main design parameters and objective functions using an artificial neural network (ANN), with MOPSO as the optimization algorithm and the TOPSIS method as the decision-maker.
2. Materials and Methods
2.1. System Description
Figure 1 provides a schematic layout of the devised cogeneration plant for electricity and freshwater production. The proposed cogeneration system consists of four main subsystems: a downdraft gasification system, a regenerative Brayton cycle, a steam Rankine cycle, and a multi-effect desalination system. The system operation process is described next.
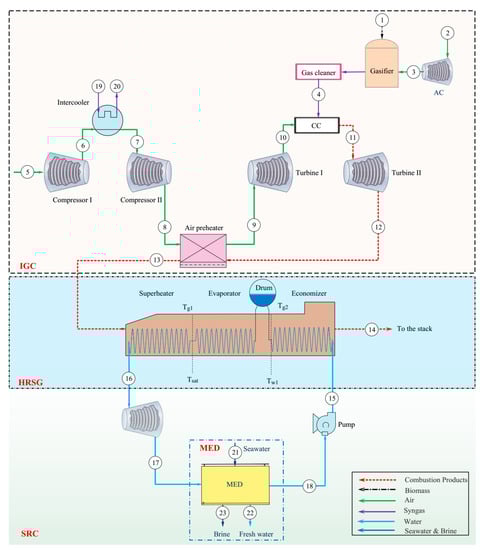
Figure 1.
Schematic of the proposed integrated gasification combined cycle for electricity and freshwater production.
Air is compressed in a two-stage compressor with an intercooler between the stages. First, air enters compressor 1 at 1.013 bar and 298.15 K (the environmental condition, state 5) and is compressed (state 6). In the compression process, the air temperature increases considerably; thus, to raise the net power output and potential for regeneration, the air is cooled in an intercooler (process 6–7), which uses a cooling water flow (process 19–20), before entering compressor 2. The pressurized and cooled air (state 7) is compressed in the second stage compressor to the final pressure (process 7–8). The high-pressure air leaving compressor 2 is heated in the air preheater (regenerator) using high-temperature flue gases of the second turbine (process 8–9). The high-pressure and high-temperature air (state 9) expands through the turbine (Turbine 1); the first stage power generation process occurs in the gas turbine system. The hot turbine exhaust (state 10) enters the combustor.
Air is provided for the gasification process by the companion of the air compressor (AC) between states 2 and 3, and the biomass fuel enters the gasifier at state 1. After the reactions occur in the gasifier, solid wastes and other pollutants are removed in the gas cleaner unit. The synthesis gas (syngas) produced is delivered to the combustion chamber (state 4). The syngas is fired with air as the oxidant in the combustion chamber. The flue gas produced by the combustion process enters the second turbine (Turbine 2) and expands to produce electricity (process ). The outlet flue gas of the second stage turbine at state 12 is delivered to the air preheater (regenerator), where it is cooled by transferring its energy to the air flow (process ). The exhaust gas in the air preheater is still of high temperature and has a significant energy content that can be harnessed economically. Thus, the integrated gasification unit and gas turbine cycle are combined with a steam Rankine cycle. The gas and steam power cycles are combined by an interconnecting HRSG. Finally, the flue gas is discharged to the environment at .
In the steam Rankine cycle, water enters the pump at state 18 as a saturated liquid and is pumped to the boiler pressure with a slight increase in the water temperature (state 15). The compressed water enters the HRSG and, upon being heated by the combustion gases, leaves the HRSG as a superheated vapor at state 16. This superheated vapor enters the steam turbine (ST), where it expands and generates electricity (process ). During the expansion process in the steam turbine, the temperature and pressure of the steam decrease. The exhaust steam discharges to the condenser at state 17. There, steam is condensed at constant pressure by rejecting heat to a cooling media, and the saturated liquid at state 18 returns to the pump, completing the steam cycle. Among the various cooling mediums, multi-effect desalination (MED) is a good candidate for utilization instead of the condenser. Compared to widely used thermal processes such as multi-stage flash, MED desalination has advantages such as lower primary energy consumption, lower heat transfer area, lower capital cost, longer life, less corrosion, lower scaling rate, and less need for prefiltering []. A parallel-cross heat exchanger arrangement is used in this study since it performs better in terms of energy consumption and gain output ratio (GOR) [].
2.2. Modeling and Assumptions
The governing mathematical equations for the thermodynamic, exergoeconomic, economic, and reliability analysis are presented. First, several thermodynamic assumptions are considered to simplify the study [,,]:
- The operation of each process in the cycle is considered steady-state.
- Changes in the potential and kinetic energy rates are neglected; thus, only physical and chemical exergies are considered.
- Pressure drops in the steam Rankine cycle are neglected, and the pressure loss in the combustion chamber is taken to be
- The input air composition is and .
- The reference environment properties and are taken to be and , respectively.
- The temperature differences for the flows in all effects of the MED are equal.
- The spray of seawater in all effects of the MED occurs with an equal flow rate.
Other primary input parameters and prerequisites for simulation of the proposed electricity and freshwater generation system are listed in Table 1.

Table 1.
Selected input parameters and considerations for the modeling of the proposed system [,].
2.2.1. Thermodynamic Modeling
Mass, energy, and exergy balances are applied in the assessment of the proposed cycle. Mass and energy balance equations can be written as follows []:
where denotes mass flow rate, is the specific enthalpy, and are the heat transfer rate and mechanical power, respectively.
Additionally, the exergy rate balance equation can be written as []:
where indicates the exergy destruction rate, is the work, and is the heat transfer rate across the boundary of the control volume with a temperature of . The exergy of a material flow has four main parts: physical, chemical, potential, and kinetic. Variations of the velocities and heights in the elements are negligible. Thus, the total exergy rate for the stream can be expressed as []:
where and are the physical and chemical exergy rates, respectively. For stream, the physical exergy can be computed by []:
where and are the specific enthalpy and entropy, respectively. In addition, based on the materials used in the proposed cycle, the following relations can be used for the chemical exergy rate []:
where denotes the coefficient of the fuel chemical exergy [], is the standard chemical exergy of a pure species, is the universal gas constant, and is the molar fractions of species.
A detailed analysis of system components and subsystems from the energy and exergy viewpoints is presented in [].
2.2.2. Exergoeconomic Analysis
In order to evaluate the exergoeconomic performance of energy systems, especially thermodynamic plants, various schemes have been proposed, among which the specific exergy costing (SPECO) methodology has been extensively employed to assess the exergoeconomic performance. To apply the SPECO method on the energy systems, the cost balance equations and auxiliary relations are used on all elements for obtaining the cost for exergy flows. The relation for the cost rate balance of component as a control volume of the system is presented as follows []:
Additionally, Equation (8) can be rewritten as []:
Here, denotes the corresponding cost rate for the inlet and outlet exergy flows, heat, and work. In addition, denotes the capital cost rate, which is defined as []:
The capital cost rate contains the capital investment cost rate () and operation/maintenance cost rate (). Moreover, is the maintenance factor that is tuned to ; is the number of operational hours of the cycle in a year (calculated from the reliability analysis); is the equipment cost, which is listed for each component of the system in Table 2; and is the capital recovery factor, which is defined as follows []:
Table 2.
Cost function equations for components of the proposed system [,].
Here, is the interest rate (tuned to ), and denotes the number of operational years. In addition, the cost of element is updated for the year 2020 by employing the Chemical Engineering Plant Cost Index (CEPCI) as follows []:
The CEPCI factor for year 2020 is set as 668 []. Moreover, the cost rate balances, as well as the relevant auxiliary relations, are provided in Table 3 for each element.
Table 3.
Cost rate balances and auxiliary equations for components of the proposed system.
2.2.3. Main Performance Indices
Several performance metrics are considered to evaluate the proposed cycle from different perspectives. The net output power is defined as follows:
and the rate of produced freshwater by the MED system is defined as follows:
The exergy efficiency for the devised system is expressed as the ratio of the produced/useful exergy to the total input exergy to the cycle:
In addition, the exergy loss rate for the proposed cycle is expressed by:
The sum unit cost of products (SUCP) for the system considered here is defined as:
2.2.4. Reliability and Availability Analysis
Reliability is described as the probability that a system provides the desired response in a specific period (t). Reliability indicates the probability that failure will not occur for the system over time. The reliability function can be expressed as follows []:
In this equation, , , and . For a specific value of , is defined as a probability that the time to failing is greater than or equal to . In reliability analysis, the cumulative distribution function (CDF) is used, which indicates the probability that a failure will occur before the time t and is defined as follows []:
Two other important parameters that are used in evaluating the reliability and availability of systems are failure rate and repair rate . The mean time to failure (MTTF) and the mean time to repair (MTTR) can also be obtained []:
Figure 2 shows the failure rate curve, sometimes referred to as the bathtub curve. It can be seen that, in the fielding stage (burn-in), the failure rate is higher due to manufacturing and installation defects. By starting the system and eliminating the defects, the failure rate is reduced to a stabilized failure rate. The second stage of the bathtub curve (useful life), where the failure rate is almost constant, represents the system’s main working period. In the third part of the curve (wear-out), the failure rate increases due to the effects of aging and operation of the components, and this area is referred to as the system aging stage []. In the present study, constant values were considered for the failure rates and repair rates of the system components. Thus, the system is memoryless, which means that the probability of system for a period of time in the future is independent of the life (aging) of the system []. The assumed values for failure rate and component repair rate are given in Table 4.
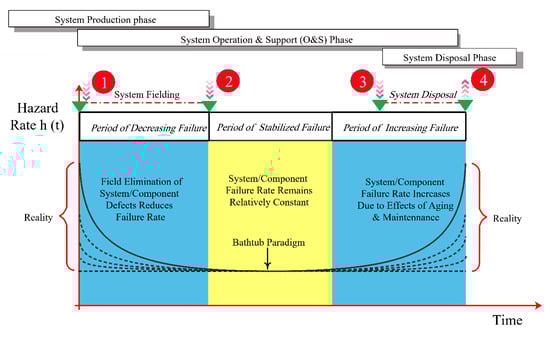
Figure 2.
Bathtub curve.
Table 4.
Values of failure and repair rates for the three main subsystems in series configuration.
How to configure the system is vital in assessing reliability, and it is important to know how the system components are connected. Subsystems can be connected in series or parallel. In the series configuration, the condition for system performance is that all subsystems are working. In the parallel configuration, not all segments are required for the overall system to function. Among the parallel components, at least one of them is sufficient for the overall system to operate []. Figure 1 shows a schematic of the cycle considered in this study, which has a series configuration. The proposed cogeneration system in this work consists of three main subsystems: integrated gasification cycle, heat recovery steam generator, and steam Rankine cycle.
There are several methods to analyze a system from a reliability perspective. In the present study, Markov chain analysis is used for the reliability assessment of the system. The Markov method can model the stochastic behavior of systems that change continuously or discontinuously with time or in the state space. The behavior of the systems should also indicate memorylessness of the exponential distribution. More specifically, failure and repair rates in the system are time-independent. Otherwise, the processes are called non-Markov. To facilitate the analysis of Markov’s continuous and discontinuous processes, a state-space diagram is used. All possible states for the system and ways to change each state are presented along with the change rate in the state-space diagram. The state-space diagram of the proposed system, which describes different states and relationships between the state, is illustrated in Figure 3. Note that, for the subsystems (IGC, HRSG, and SRC), there are possible functional states based on the combination of the possibilities for the failure or operation of the subsystems [].
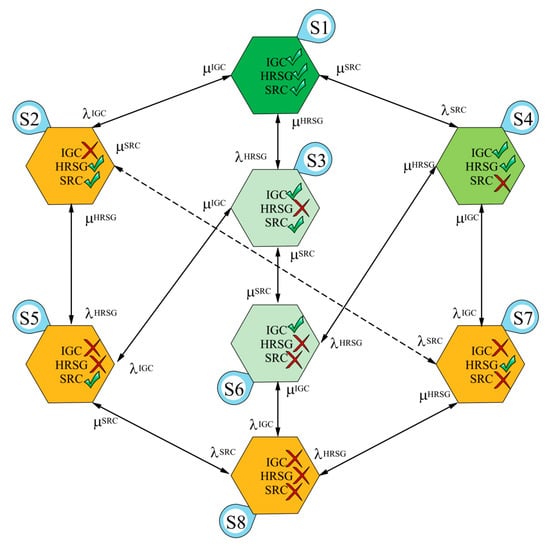
Figure 3.
State transition diagram for electricity and freshwater production.
The Markov chain method, which uses the state space diagram for analysis, forms a matrix in which each row of this matrix represents a state for the system. According to Figure 3, the probability that the system is in state () at time and before it is denoted by , the following equation is used to evaluate the probability of the system being in state () []:
where is the Markov transition matrix, which is expressed as follows:
The following boundary conditions can be used to solve Equation (24):
Additionally, the following auxiliary equation is utilized to solve Equation (24):
Another parameter used in the system’s reliability assessment is availability. Availability is defined as the probability that a component or system performs to its expected capacity at a specified point in time or over a stated period when maintained and operated in a prescribed demeanor. Availability is a different concept from reliability. It means that part of the system may have already failed but returned to normal function after the repair; hence, the value of availability is always higher than that of reliability []. For series systems, the relationships related to failure rate, repair rate, availability, and reliability are expressed as follows []:
2.2.5. Multi-Objective Optimization and Accuracy Check
Usually optimization is used for performance improvement. Optimization seeks to improve performance by identifying an optimal point or points. Many actual problems are, in fact, multi-objective optimization problems. To solve such problems, researchers have developed various optimization algorithms. The particle swarm optimizer (PSO) performs well in solving continuous and discrete single-objective optimization problems. In recent years, researchers have developed versions of this algorithm for use in solving multi-objective optimization problems. The multi-objective particle swarm optimizer (MOPSO) uses an external archive to store non-dominated solutions. Additionally, in the MOPSO algorithm, an elitist-mutation operator is employed to diversify the Pareto solution. The PSO algorithm is praised for its high speed. This speed, however, especially in a multi-objective optimization algorithm, may converge towards the wrong side of the Pareto front. To overcome this problem, a mutation operator is used to change the position of the particles randomly. Using the mutation operator allows the algorithm to explore more efficiently in the search space. This factor prevents the solutions from being trapped in a local optimum [].
Employing the state data collected from the energy, exergy, and economic analysis for the proposed cogeneration system, a total of 1500 samples of input and output points were applied for the artificial neural network (ANN) training. The employed artificial neural network is presented as the fitness function of the MOPSO algorithm, and the multi-objective PSO optimizer is executed on it. Predicting the objective functions using ANN leads to a considerable decrease in the computational cost and run time. In order to evaluate the accuracy and efficiency of the neural network in estimating the responses and outputs, the coefficient of determination () index is employed. This indicator measures response data’s variance, and the closer the is to 1, the higher the ANN model’s accuracy.
In the present study, four parameters, including compressor pressure ratio (), preheater effectiveness (), superheating temperature difference (), and feedwater temperature () are selected as design parameters. In addition, net output power (), exergy efficiency (), freshwater production rate (), and total unit cost of production () are considered as objective functions. Thus, the optimization space with the relevant constraints is as follows:
subject to:
Figure 4a demonstrates the optimization process which involves the coupling of thermodynamic models of the proposed system to the artificial neural network and shows the coupling between ANN and MOPSO. Moreover, the flowchart of the MOPSO algorithm is shown in Figure 4b. Additionally, as seen in Figure 4a, the last step in the optimization process involves selecting optimum points. In this regard, the TOPSIS (technique for order of preference by similarity to ideal solution) decision-making method is used. The TOPSIS method is a multi-attribute decision making (MADM) method that ranks alternatives. In this method, the two concepts of “ideal solution” and “similarity to the ideal solution” are used. As its name implies, the ideal solution is the best in every aspect, which generally does not exist in practice, and it tries to get closer to it. To measure the similarity of an alternative to an ideal solution () and non-ideal solution (), the distances of that alternative from the ideal solution () and non-ideal solution are measured. The alternatives are then evaluated and ranked based on the ratio of the distance from the non-ideal solution to the summation of distances from the ideal and non-ideal solution []. That is,
where

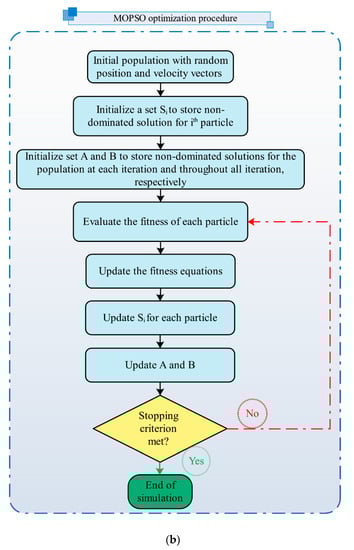
Figure 4.
(a) Schematic diagram of the modeling and optimization process, and (b) MOPSO flowchart.
Accordingly, the maximum value of is chosen to be the final optimal solution.
2.3. Validation
To ensure the validity of the results obtained from the modeling process in Engineering Equation Solver (EES) software, it is necessary to measure the validity of the model with previously published independent research or with experimental data. The results presented by Gholamian et al. [], Zainal et al. [], and experimental results [] are used to validate the gasification process by comparison of gas yield within the gasification step. In this validation step, conditions and considerations are considered similar to comparative sources. For the gasification, the composition of produced syngas is obtained at a gasification temperature of for wood with moisture content. The results of the study presented by Hatzikioseyian et al. [] are also used to validate the multi-effect desalination unit []. Comparative results for the validation of the gasification unit and the MED system are listed in Table 5.
Table 5.
Validation of the modeling results for the gasification and MED units.
As shown in Table 5, for the gasification process, taking into account the root-mean-squared deviation () criterion, the results obtained in the present study are consistent with experimental results and other theoretical studies.
Moreover, in order to show the reliability of the MED unit, the relative error () is calculated. Based on these results, it can be inferred that the results of the model presented in this study for the MED unit are compatible with the results of relevant sources.
3. Result and Discussion
As mentioned earlier, the proposed system is evaluated from various perspectives. The main operating results, the results of the parametric study, the optimization results, and the reliability results are given and discussed in this section.
3.1. Main Operating Results
The values for the main performance metrics are presented in Table 6. For the base cycle, the net output power is . This value is the sum of the net output power of the gas turbine cycle and the steam Rankine cycle. The rate of freshwater is produced in the MED unit is . The exergy efficiency for the proposed cycle is . The sum unit cost of products (SUCP) for the base cycle is evaluated as .
Table 6.
Main performance criteria at the base case condition.
The exergy rates for all flows and the exergy destruction rates for the system components are shown in a Sankey diagram in Figure 5. The maximum amount of exergy destruction is related to the combustion chamber, which is mainly due to the nature of combustion reactions and heat transfer. Of the of total input exergy to the system, is destroyed in the combustion chamber. The second-largest exergy destruction rate is related to the gasifier, which is equal to . The rate of exergy loss for the overall system shown in the Sankey diagram is .
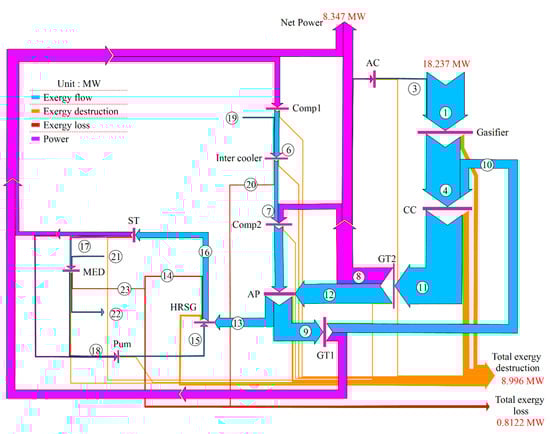
Figure 5.
Sankey diagram showing the exergy flow rates and exergy destruction, and loss rates for the cogeneration system.
The effect of simultaneously varying pressure ratio () and preheater effectiveness () on the main performance criteria, including freshwater production capacity (), net output power (), exergy efficiency (), and sum unit cost of products (), is examined. The range of decision variables for the parametric analysis is as follows:
Figure 6a illustrates the effect of varying pressure ratio and air preheater effectiveness on the freshwater production capacity. It is seen that, at a constant pressure ratio, as air preheater effectiveness rises, the temperature of the motive flow () of steam Rankine cycle decreases; this decrease results in lower freshwater production rate in the MED unit. For fixed air preheater effectiveness, however, raising the pressure ratio causes the mass flow rate of combustion products to reduce, due to the reduction in the mass flow rate of air needed for combustion. Therefore, less heat is transferred to the bottoming cycle, which leads to lower freshwater capacity.
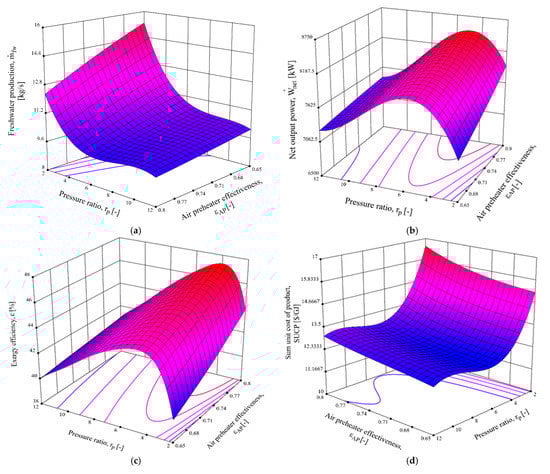
Figure 6.
Effect of varying compressor pressure ratio and air preheater effectiveness on the (a) freshwater production, (b) net output power, (c) exergy efficiency, and (d) sum unit cost of product.
The effect of varying pressure ratio and air preheater effectiveness on the net output power rate is demonstrated in Figure 6b. According to this figure, for a fixed value of compressor pressure ratio, the power generation rate increases with air preheater effectiveness. The main reason for this trend is that, as increases, the inlet temperature of the first turbine in the IGC system increases, which leads to an increased power generation rate of the first turbine. In addition, the inlet temperature of the combustion chamber increases, which results in a higher enthalpy of combustion products; as a result, a higher power generation rate in the second turbine is obtained. However, at a fixed value of preheater effectiveness, the net output power increases to a maximum and then decreases as the compressor pressure ratio increases. The main reason for this trend originates from the interaction of the power generation rate of turbines and the power consumption of compressors. At lower pressure ratios, the power generation rates of the turbines overwhelm the power consumption rates of compressors; thus, the net output power exhibits an increasing trend with compressor pressure, while at higher pressure ratios (), the power consumptions overcome the power generation rate; therefore, the net output power shows a decreasing trend.
Figure 6c shows the effect of varying pressure ratio and air preheater effectiveness on exergy efficiency. As can be seen, the variation of exergy efficiency is similar to that for the net output power. This means that, by increasing the pressure ratio at a constant value of effectiveness, the exergy efficiency first increases to a maximum and then decreases.
Figure 6d shows the effect of simultaneously varying of compressor pressure ratio and air preheater effectiveness on the SUCP of the proposed system. Based on this figure, at a constant value of pressure ratio, the rate of net output power increases with air preheater effectiveness; thus, the SUCP decreases. At fixed values of air preheater effectiveness, however, SUCP decreases as compressor pressure ratio rises.
3.2. Optimization and ANN Accuracy Check
The artificial neural network is applied to fit the objective functions in this study. The accuracy check of the calculated network is analyzed employing , adjusted , and predicted . Figure 7a–d demonstrate the predicted results by ANN against actual data obtained from the simulation. The values closer to unity show higher performance accuracy for the ANN. As shown in Figure 7a–d, the values obtained for freshwater production rate, net output power, exergy efficiency, and SUCP are , , , and .
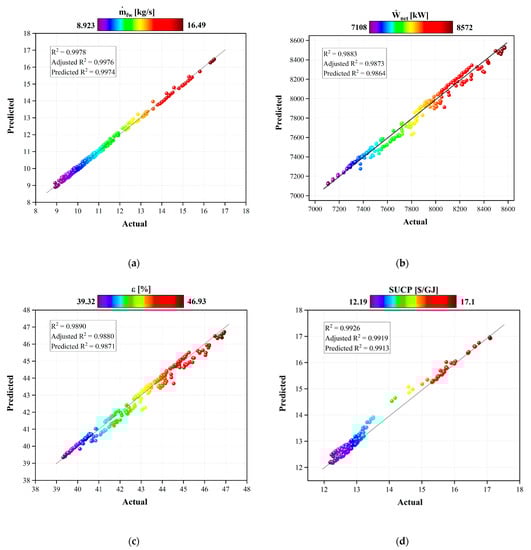
Figure 7.
Comparative diagram of predicted data vs. actual data for (a) freshwater production, (b) net output power, (c) exergy efficiency, and (d) sum unit cost of product.
Figure 8a–d demonstrate the Pareto front of the system optimization. Figure 8a shows the state in which the net output power () and the freshwater production rate () are considered as objective functions. For the first scenario, the optimization aims at maximizing the net output power and the freshwater production rate. It is observed that by changing the decision variables, different values for the target parameters are obtained as the Pareto front. It is also observed that if one of the target parameters is maximized, the other is minimized. Due to the conflict between the target parameters, the TOPSIS method has been used to select the optimal point among the Pareto front point, which is marked in red in the figure. The selected point for the optimum values provides the values of and for net power and freshwater production rate, respectively.
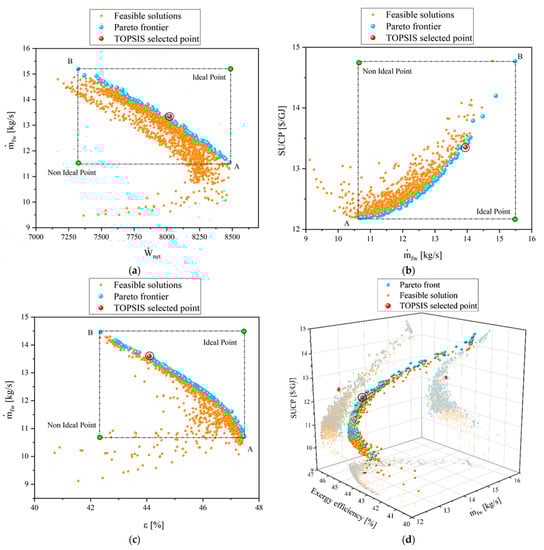
Figure 8.
Pareto front of the optimum solution points for several optimization scenarios, (a) -, (b) -, (c) -, and (d) --.
Figure 8b shows the scenario in which the freshwater production rate and sum unit cost of the product are considered as the objective functions. This scenario aims to minimize the sum unit cost of product and maximize the freshwater production rate. Regarding the distribution of the Pareto front in this scenario, it is clear that the SUCP also increases with freshwater production rate. In this scenario, the objective functions are in conflict with each other, which means that improving one parameter will worsen the other, and this indicates the accuracy of the optimization. As mentioned before, all points of the Pareto front are optimal points, and the designer selects the desired point according to the importance of one of the parameters based on the TOPSIS method, which reports the values of and for the freshwater production rate and SUCP, respectively.
Figure 8c shows the third scenario in which the objective functions are exergy efficiency (ε) and freshwater production rate. The optimal values for these parameters selected by the TOPSIS method from the Pareto front values are and , respectively.
In multi-objective optimization problems, a higher number of objective functions results in a more desirable the optimization. Therefore, in the fourth scenario, shown in Figure 8d, three parameters, including exergy efficiency, freshwater production rate, and SUCP, are selected as the objective functions. Note that, because the trend of changes in exergy efficiency and net output power are similar, only one of them was employed as an objective function. Additionally, of all the scenarios mentioned, the last, shown in Figure 8d, is selected as the main scenario. The optimization results obtained from this scenario are reported as optimal values for the objective functions. Therefore, using the TOPSIS method, the optimal values are , , , and for exergy efficiency, freshwater production rate, SUCP, and net output power, respectively.
The scattered distribution of the decision parameters, including , , , and of the devised power and freshwater production system are presented in Figure 9. The scatter distribution of design parameters represents an appropriate visual overview of the results obtained by MOPSO. Figure 9a demonstrates that the optimal distribution of points for the compression ratio is in the range of nearby the lower bound. It is clear that all the optimal points are in an allowable range. Additionally, Figure 9b presents that the optimum distribution of points for the air preheater efficiency; they are seen to range from in the proximity of lower bound. However, Figure 9c demonstrates the distribution of optimal results for the feedwater temperature that are mostly located in the vicinity of the upper bound. Moreover, the distribution of optimal points for the superheating temperature difference is presented in Figure 9d. As shown in this figure, most of the optimal points are located at the average value of .
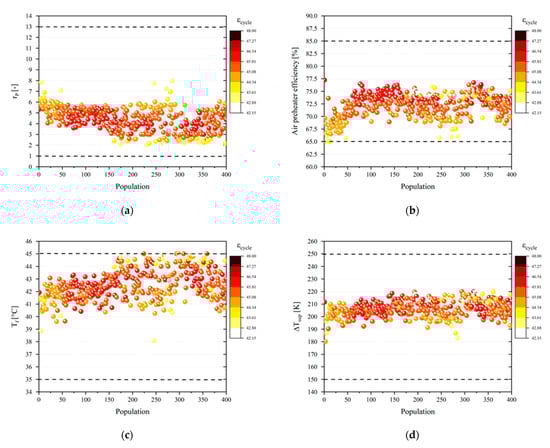
Figure 9.
Scatter distribution of design decision variables, (a) compression ratio, (b) air preheater efficiency, (c) feedwater temperature, and (d) superheating temperature difference.
3.3. Reliability Analysis
Figure 10 shows the probability of the system being in different states. This figure is obtained by solving Equation (24) in MATLAB software. indicates the probability that the system will be in state one (). When the system starts up, the probability of state one is , but over time, due to breakdowns and defects, the system’s probability of remaining in state one decreases. Reducing the probability of the system being in state one expresses the probability of the system being in other states. According to Figure 10, the probability for each state becomes smooth over time, which means that the system reaches a stable condition. The values for the probability in the stabilized situation are given in Table 7. According to this table, the probability of state 1 () that expresses the healthy working of all components and subsystems comes to a constant value of . Moreover, the state of that shows the simultaneous failure of all subsystems, holds the minimum probability of .
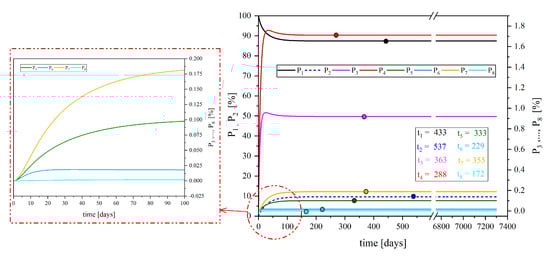
Figure 10.
Probability of the system at different operating states from the reliability viewpoint.
Table 7.
Probability of each state at the stable conditions.
Figure 11 shows the availability of each of the subsystems (IGC, HRSG, and SRC). Obviously, the availability of subsystems decreases over time due to the impact of repair and failure. According to the figure, when the subsystems reach a stable condition, the values of availability will also be equal to the fixed value, which are given in Table 8. It should be noted that the area under the curves shown in Figure 11 represents the total time when each of the subsystems is in operation.
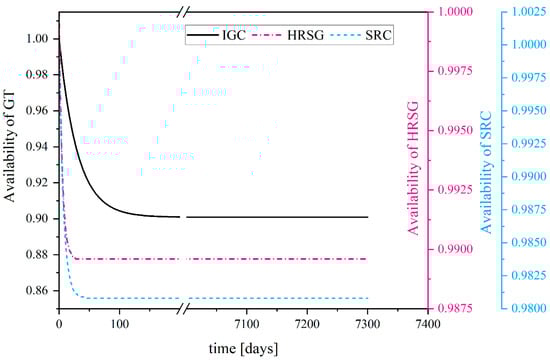
Figure 11.
Variations in trend of the availability for each of the subsystems over the plant’s lifetime.
Table 8.
Availability of subsystem at the stable conditions.
Figure 12 shows the availability of the overall system. The under-curve area shown in the figure indicates the total time-length that the system will be available during its 20-year lifespan to generate electricity and freshwater. For the present system, the numerical value of availability in the stabilized condition is . However, from the availability curve, it is clear that the final value of availability for the system is higher than this value () because, according to the figure, the availability from its maximum value () reaches its minimum value (). According to the calculations, the final value of the system availability is .
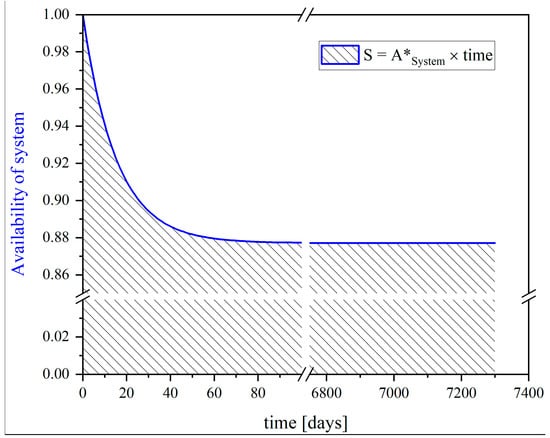
Figure 12.
Variation in trend of the availability for the overall system over the plant’s lifetime.
4. Conclusions
Integrated gasification combined cycles can be employed for the simultaneous production of several products. In this work, a cogeneration system based on biomass gasification, regenerative-recompression gas turbine cycle, steam Rankin cycle, and multi-effect desalination system is proposed. To evaluate system performance, energy, exergy, exergoeconomic, and reliability analysis were performed. Among several methods to analyze a system from the reliability and availability perspectives, Markov chain analysis was used. The Markov method can model the stochastic behavior of systems that change continuously or discontinuously with time or in the state space. In addition, the optimal operating condition and optimum performance criteria are obtained by coupling an artificial neural network, the multi-objective particle swarm optimization algorithm, and the TOPSIS decision-maker. The main results of the system assessment and the conclusions follow:
- The highest exergy destruction value is related to the combustion chamber, mainly due to combustion reactions and heat transfer. Of the rate of total input exergy to the system, is destroyed in the combustion chamber.
- By coincident variation of compressor pressure ratio and air preheater effectiveness, net output power and exergy efficiency increase to maximum values and then decrease.
- The ANN employed can predict the results precisely with the values 0.9978, 0.9883, 0.9890, and 0.9926 for freshwater production rate, net output power, exergy efficiency, and SUCP, respectively.
- For the optimization scenario, using the TOPSIS decision-making method, optimum values of , , , and are obtained for exergy efficiency, freshwater production rate, SUCP, and net output power, respectively.
- Based on the reliability and availability analysis, the probability of the healthy working state of all components and subsystems is determined to be it is shown that the system is available in the 20-year lifetime.
Author Contributions
F.H.: Conceptualization, Methodology, Software, Validation. S.M.S.M.: Conceptualization, Methodology, Supervision, Project administration. M.A.R.: Language review, Supervision. All authors have read and agreed to the published version of the manuscript.
Funding
This research received no external funding.
Institutional Review Board Statement
Not applicable.
Informed Consent Statement
Not applicable.
Data Availability Statement
Not applicable.
Conflicts of Interest
The authors declare no conflict of interest.
Nomenclature
| Symbols | |
| Availability | |
| Artificial neural network | |
| Cost per unit exergy () | |
| Cost rate () | |
| Cumulative distribution function | |
| Chemical Engineering Plant Cost Index | |
| Capital recovery factor | |
| Distributed energy resource | |
| Engineering Equation Solver | |
| Specific exergy () | |
| Exergy rate (kW) | |
| Gain output ratio | |
| Gas turbine cycle | |
| Specific enthalpy () | |
| Heat recovery steam generator | |
| Interest rate | |
| Integrated gasification combined cycle | |
| Lower heating value () | |
| Mass flow rate () | |
| Multi-effect distillation | |
| Moisture content () | |
| Multi-objective PSO | |
| Mean time to failure | |
| Mean time to repair | |
| Operation hours per year () | |
| Cycle lifetime () | |
| Organic Rankine cycle | |
| Pressure () | |
| Probability density function | |
| Probability | |
| Particle swarm optimization | |
| Pinch point temperature difference () | |
| Heat transfer rate () | |
| Pressure ratio | |
| Universal gas constant () | |
| Reliability | |
| Specific entropy () | |
| Steam Rankine cycle | |
| Specific exergy costing | |
| Sum unit cost of product () | |
| Temperature () | |
| Time () | |
| Technique for order of preference by similarity to ideal solution | |
| Electrical power () | |
| Waste heat recovery | |
| Mole fraction | |
| Purchased equipment cost () | |
| Levelized cost () | |
| Subscripts | |
| Air compressor | |
| Air preheater | |
| Combustion chamber | |
| Chemical | |
| Capital investment | |
| Compressor | |
| Condenser | |
| Control volume | |
| Destruction | |
| Exergy | |
| Freshwater | |
| Gasifier | |
| Gas turbine | |
| Inlet | |
| Isentropic | |
| Gas turbine | |
| Inlet | |
| Investment | |
| Isentropic | |
| component | |
| Loss | |
| Net value | |
| Operation and maintenance | |
| Outlet | |
| Physical | |
| Pump | |
| Heat transfer | |
| Reference | |
| Steam turbine | |
| System | |
| Superheating | |
| Work | |
| Cycle locations | |
| Dead state | |
| Total | |
| Vapor generator | |
| Work | |
| Cycle locations | |
| Dead state | |
| Greek Symbols | |
| Failure rate | |
| Repair rate | |
| Maintenance factor | |
| Coefficient of the fuel chemical exergy | |
| Exergy efficiency () | |
References
- Alam, M.S.; Al-Ismail, F.S.; Salem, A.; Abido, M.A. High-Level Penetration of Renewable Energy Sources into Grid Utility: Challenges and Solutions. IEEE Access 2020, 8, 190277–190299. [Google Scholar] [CrossRef]
- Liu, B.; Rajagopal, D. Life-cycle energy and climate benefits of energy recovery from wastes and biomass residues in the United States. Nat. Energy 2019, 4, 700–708. [Google Scholar] [CrossRef]
- Tonini, D.; Hamelin, L.; Alvarado-Morales, M.; Astrup, T.F. GHG emission factors for bioelectricity; biomethane; and bioethanol quantified for 24 biomass substrates with consequential life-cycle assessment. Bioresour. Technol. 2016, 208, 123–133. [Google Scholar] [CrossRef]
- Yao, Z.; You, S.; Ge, T.; Wang, C.-H. Biomass gasification for syngas and biochar co-production: Energy application and economic evaluation. Appl. Energy 2018, 209, 43–55. [Google Scholar] [CrossRef]
- Gambarotta, A.; Morini, M.; Zubani, A. A non-stoichiometric equilibrium model for the simulation of the biomass gasification process. Appl. Energy 2018, 227, 119–127. [Google Scholar] [CrossRef]
- Weil, K.S. Coal gasification and IGCC technology: A brief primer. Proc. Inst. Civ. Eng. 2010, 163, 7–16. [Google Scholar] [CrossRef]
- Parraga, J.; Khalilpour, K.R.; Vassallo, A. Polygeneration with biomass-integrated gasification combined cycle process: Review and prospective. Renew. Sustain. Energy Rev. 2018, 92, 219–234. [Google Scholar] [CrossRef]
- Sahraei, M.H.; McCalden, D.; Hughes, R.; Ricardez-Sandoval, L.A. A survey on current advanced IGCC power plant technologies; sensors and control systems. Fuel 2014, 137, 245–259. [Google Scholar] [CrossRef]
- Soltani, S.; Mahmoudi, S.M.S.; Yari, M.; Rosen, M.A. Thermodynamic analyses of an externally fired gas turbine combined cycle integrated with a biomass gasification plant. Energy Convers. Manag. 2013, 70, 107–115. [Google Scholar] [CrossRef]
- Gholamian, E.; Mahmoudi, S.M.S.; Zare, V. Proposal; exergy analysis and optimization of a new biomass-based cogeneration system. Appl. Therm. Eng. 2016, 93, 223–235. [Google Scholar] [CrossRef]
- Ahmadi, P.; Rosen, M.A.; Dincer, I. Multi-objective exergy-based optimization of a polygeneration energy system using an evolutionary algorithm. Energy 2012, 46, 21–31. [Google Scholar] [CrossRef]
- Köse, Ö.; Koç, Y.; Yağlı, H. Performance improvement of the bottoming steam Rankine cycle (SRC) and organic Rankine cycle (ORC) systems for a triple combined system using gas turbine (GT) as topping cycle. Energy Convers. Manag. 2020, 211, 112745. [Google Scholar] [CrossRef]
- Ghaffour, N.; Bundschuh, J.; Mahmoudi, H.; Goosen, M.F.A. Renewable energy-driven desalination technologies: A comprehensive review on challenges and potential applications of integrated systems. Desalination 2015, 356, 94–114. [Google Scholar] [CrossRef]
- Al-Karaghouli, A.; Kazmerski, L.L. Energy consumption and water production cost of conventional and renewable-energy-powered desalination processes. Renew. Sustain. Energy Rev. 2013, 24, 343–356. [Google Scholar] [CrossRef]
- Al-Mutaz, I.S.; Wazeer, I. Comparative performance evaluation of conventional multi-effect evaporation desalination processes. Appl. Therm. Eng. 2014, 73, 1194–1203. [Google Scholar] [CrossRef]
- Saldivia, D.; Rosales, C.; Barraza, R.; Cornejo, L. Computational analysis for a multi-effect distillation (MED) plant driven by solar energy in Chile. Renew. Energy 2019, 132, 206–220. [Google Scholar] [CrossRef]
- Razmi, A.; Soltani, M.; Tayefeh, M.; Torabi, M.; Dusseault, M.B. Thermodynamic analysis of compressed air energy storage (CAES) hybridized with a multi-effect desalination (MED) system. Energy Convers. Manag. 2019, 199, 112047. [Google Scholar] [CrossRef]
- Baccioli, A.; Antonelli, M.; Desideri, U.; Grossi, A. Thermodynamic and economic analysis of the integration of Organic Rankine Cycle and Multi-Effect Distillation in waste-heat recovery applications. Energy 2018, 161, 456–469. [Google Scholar] [CrossRef]
- Mokhtari, H.; Sepahvand, M. Thermoeconomic and exergy analysis in using hybrid systems (GT+ MED+ RO) for desalination of brackish water in Persian Gulf. Desalination 2016, 399, 1–15. [Google Scholar] [CrossRef]
- Chini, C.M.; Schreiber, K.L.; Barker, Z.A.; Stillwell, A.S. Quantifying energy and water savings in the US residential sector. Environ. Sci. Technol. 2016, 50, 9003–9012. [Google Scholar] [CrossRef] [PubMed]
- Notaro, V.; Puleo, V.; Fontanazza, C.M.; Sambito, M.; La Loggia, G. A Decision Support Tool for Water and Energy Savingin the Integrated Water System. Procedia Eng. 2015, 119, 1109–1118. [Google Scholar] [CrossRef][Green Version]
- Freni, G.; Sambito, M. Energy saving and recovery measures in integrated urban water systems. In AIP Conference Proceedings; AIP Publishing LLC: Thessaloniki, Greece, 2017; Volume 1906, p. 190008. [Google Scholar]
- Zare, V. Exergoeconomic analysis with reliability and availability considerations of a nuclear energy-based combined cycle power plant. Energy 2016, 96, 187–196. [Google Scholar] [CrossRef]
- Jiang, J.; Wei, X.; Gao, W.; Kuroki, S.; Liu, Z. Reliability and maintenance prioritization analysis of combined cooling; heating and power systems. Energies 2018, 11, 1519. [Google Scholar] [CrossRef]
- Hosseini, S.R.; Amidpour, M.; Behbahaninia, A. Thermoeconomic analysis with reliability consideration of a combined power and multi stage flash desalination plant. Desalination 2011, 278, 424–433. [Google Scholar] [CrossRef]
- Arani, A.M.A.; Zamani, V.; Behbahaninia, A. Economic analysis of a combined power and desalination plant considering availability changes due to degradation. Desalination 2017, 414, 1–9. [Google Scholar] [CrossRef]
- Wang, J.; Li, M.; Ren, F.; Li, X.; Liu, B. Modified exergoeconomic analysis method based on energy level with reliability consideration: Cost allocations in a biomass trigeneration system. Renew. Energy 2018, 123, 104–116. [Google Scholar] [CrossRef]
- Razmi, A.R.; Janbaz, M. Exergoeconomic assessment with reliability consideration of a green cogeneration system based on compressed air energy storage (CAES). Energy Convers. Manag. 2020, 204, 112320. [Google Scholar] [CrossRef]
- Wang, Y.; Lior, N. Performance analysis of combined humidified gas turbine power generation and multi-effect thermal vapor compression desalination systems—Part 1: The desalination unit and its combination with a steam-injected gas turbine power system. Desalination 2006, 196, 84–104. [Google Scholar] [CrossRef]
- Al-Sahali, M.; Ettouney, H. Developments in thermal desalination processes: Design; energy; and costing aspects. Desalination 2007, 214, 227–240. [Google Scholar] [CrossRef]
- Rostamzadeh, H.; Ghiasirad, H.; Amidpour, M.; Amidpour, Y. Performance enhancement of a conventional multi-effect desalination (MED) system by heat pump cycles. Desalination 2020, 477, 114261. [Google Scholar] [CrossRef]
- Bejan, A.; Tsatsaronis, G.; Moran, M.J. Thermal Design and Optimization; John Wiley & Sons: Hoboken, NJ, USA, 1995. [Google Scholar]
- Sayyaadi, H.; Saffari, A. Thermoeconomic optimization of multi effect distillation desalination systems. Appl. Energy 2010, 87, 1122–1133. [Google Scholar] [CrossRef]
- Singh, O.K. Performance enhancement of combined cycle power plant using inlet air cooling by exhaust heat operated ammonia-water absorption refrigeration system. Appl. Energy 2016, 180, 867–879. [Google Scholar] [CrossRef]
- Hamrang, F.; Shokri, A.; Mahmoudi, S.M.; Ehghaghi, B.; Rosen, M.A. Performance Analysis of a New Electricity and Freshwater Production System Based on an Integrated Gasification Combined Cycle and Multi-Effect Desalination. Sustainability 2020, 12, 7996. [Google Scholar] [CrossRef]
- Anvari, S.; Mahian, O.; Taghavifar, H.; Wongwises, S.; Desideri, U. 4E analysis of a modified multigeneration system designed for power; heating/cooling; and water desalination. Appl. Energy 2020, 270, 115107. [Google Scholar] [CrossRef]
- CEPCI. The Chemical Engineering Plant Cost Index. Chem. Eng. 2020. Available online: https://www.chemengonline.com (accessed on 12 March 2020).
- Ebeling, C.E. An Introduction to Reliability and Maintainability Engineering; Tata McGraw-Hill Education: New York, NY, USA, 2004. [Google Scholar]
- Lewis, E.E. Introduction to Reliability Engineering; Wiley: New York, NY, USA, 1987. [Google Scholar]
- Coello, C.A.C.; Pulido, G.T.; Lechuga, M.S. Handling multiple objectives with particle swarm optimization. IEEE Trans. Evol. Comput. 2004, 8, 256–279. [Google Scholar] [CrossRef]
- Tzeng, G.-H.; Huang, J.-J. Multiple Attribute Decision Making: Methods and Applications; CRC Press: Boca Raton, FL, USA, 2011. [Google Scholar]
- Zainal, Z.A.; Ali, R.; Lean, C.H.; Seetharamu, K.N. Prediction of performance of a downdraft gasifier using equilibrium modeling for different biomass materials. Energy Convers. Manag. 2001, 42, 1499–1515. [Google Scholar] [CrossRef]
- Alauddin, Z.A.Z. Performance and Characteristics of a Biomass Gasifier System; University of Wales: Cardiff, Wales, 1996. [Google Scholar]
- Hatzikioseyian, A.; Vidali, R.; Kousi, P. Modelling and thermodynamic analysis of a multi effect distillation (MED) plant for seawater desalination. Natl. Tech. Univ. Athens J. GREECE 2003, 17–25. [Google Scholar]
Publisher’s Note: MDPI stays neutral with regard to jurisdictional claims in published maps and institutional affiliations. |
© 2021 by the authors. Licensee MDPI, Basel, Switzerland. This article is an open access article distributed under the terms and conditions of the Creative Commons Attribution (CC BY) license (https://creativecommons.org/licenses/by/4.0/).