
Energy Management System Optimization of Drug Store Electric Vehicles Charging Station Operation

 ,
,  ,
,  ,
,  ,
,  ,
,  and
and 
Abstract
1. Introduction
- First, due to the unpredictability of environmental conditions, power generation can spike up or down over specific time intervals, causing the frequency and distribution voltage of the original power system to rapidly fluctuate.
- Second, the rapid deployment of solar power generation systems has resulted in an excessive increase in power supply during the day, resulting in the duck curve issue.
- Third, the interconnection between photovoltaic power generation systems and power systems will hit a breaking point in some places.
- Added a suggestion for selling goods in drug stores (corner stores or convenience stores) and demonstrated the feasibility: selling renewable electricity energy.
- This article proposes a plan for household photovoltaic power generation to be used and sold nearby. It solves the current problem of low photovoltaic power generation on the roof of homes and low electricity recycling prices. It improves the homeowner’s income while improving energy utilization.
- Based on the convenience of the geographical location of drug stores, a plan to establish a charging stations for electric vehicles using renewable energy is proposed. This provides an energy supply service guarantee for the coming electric vehicle era.
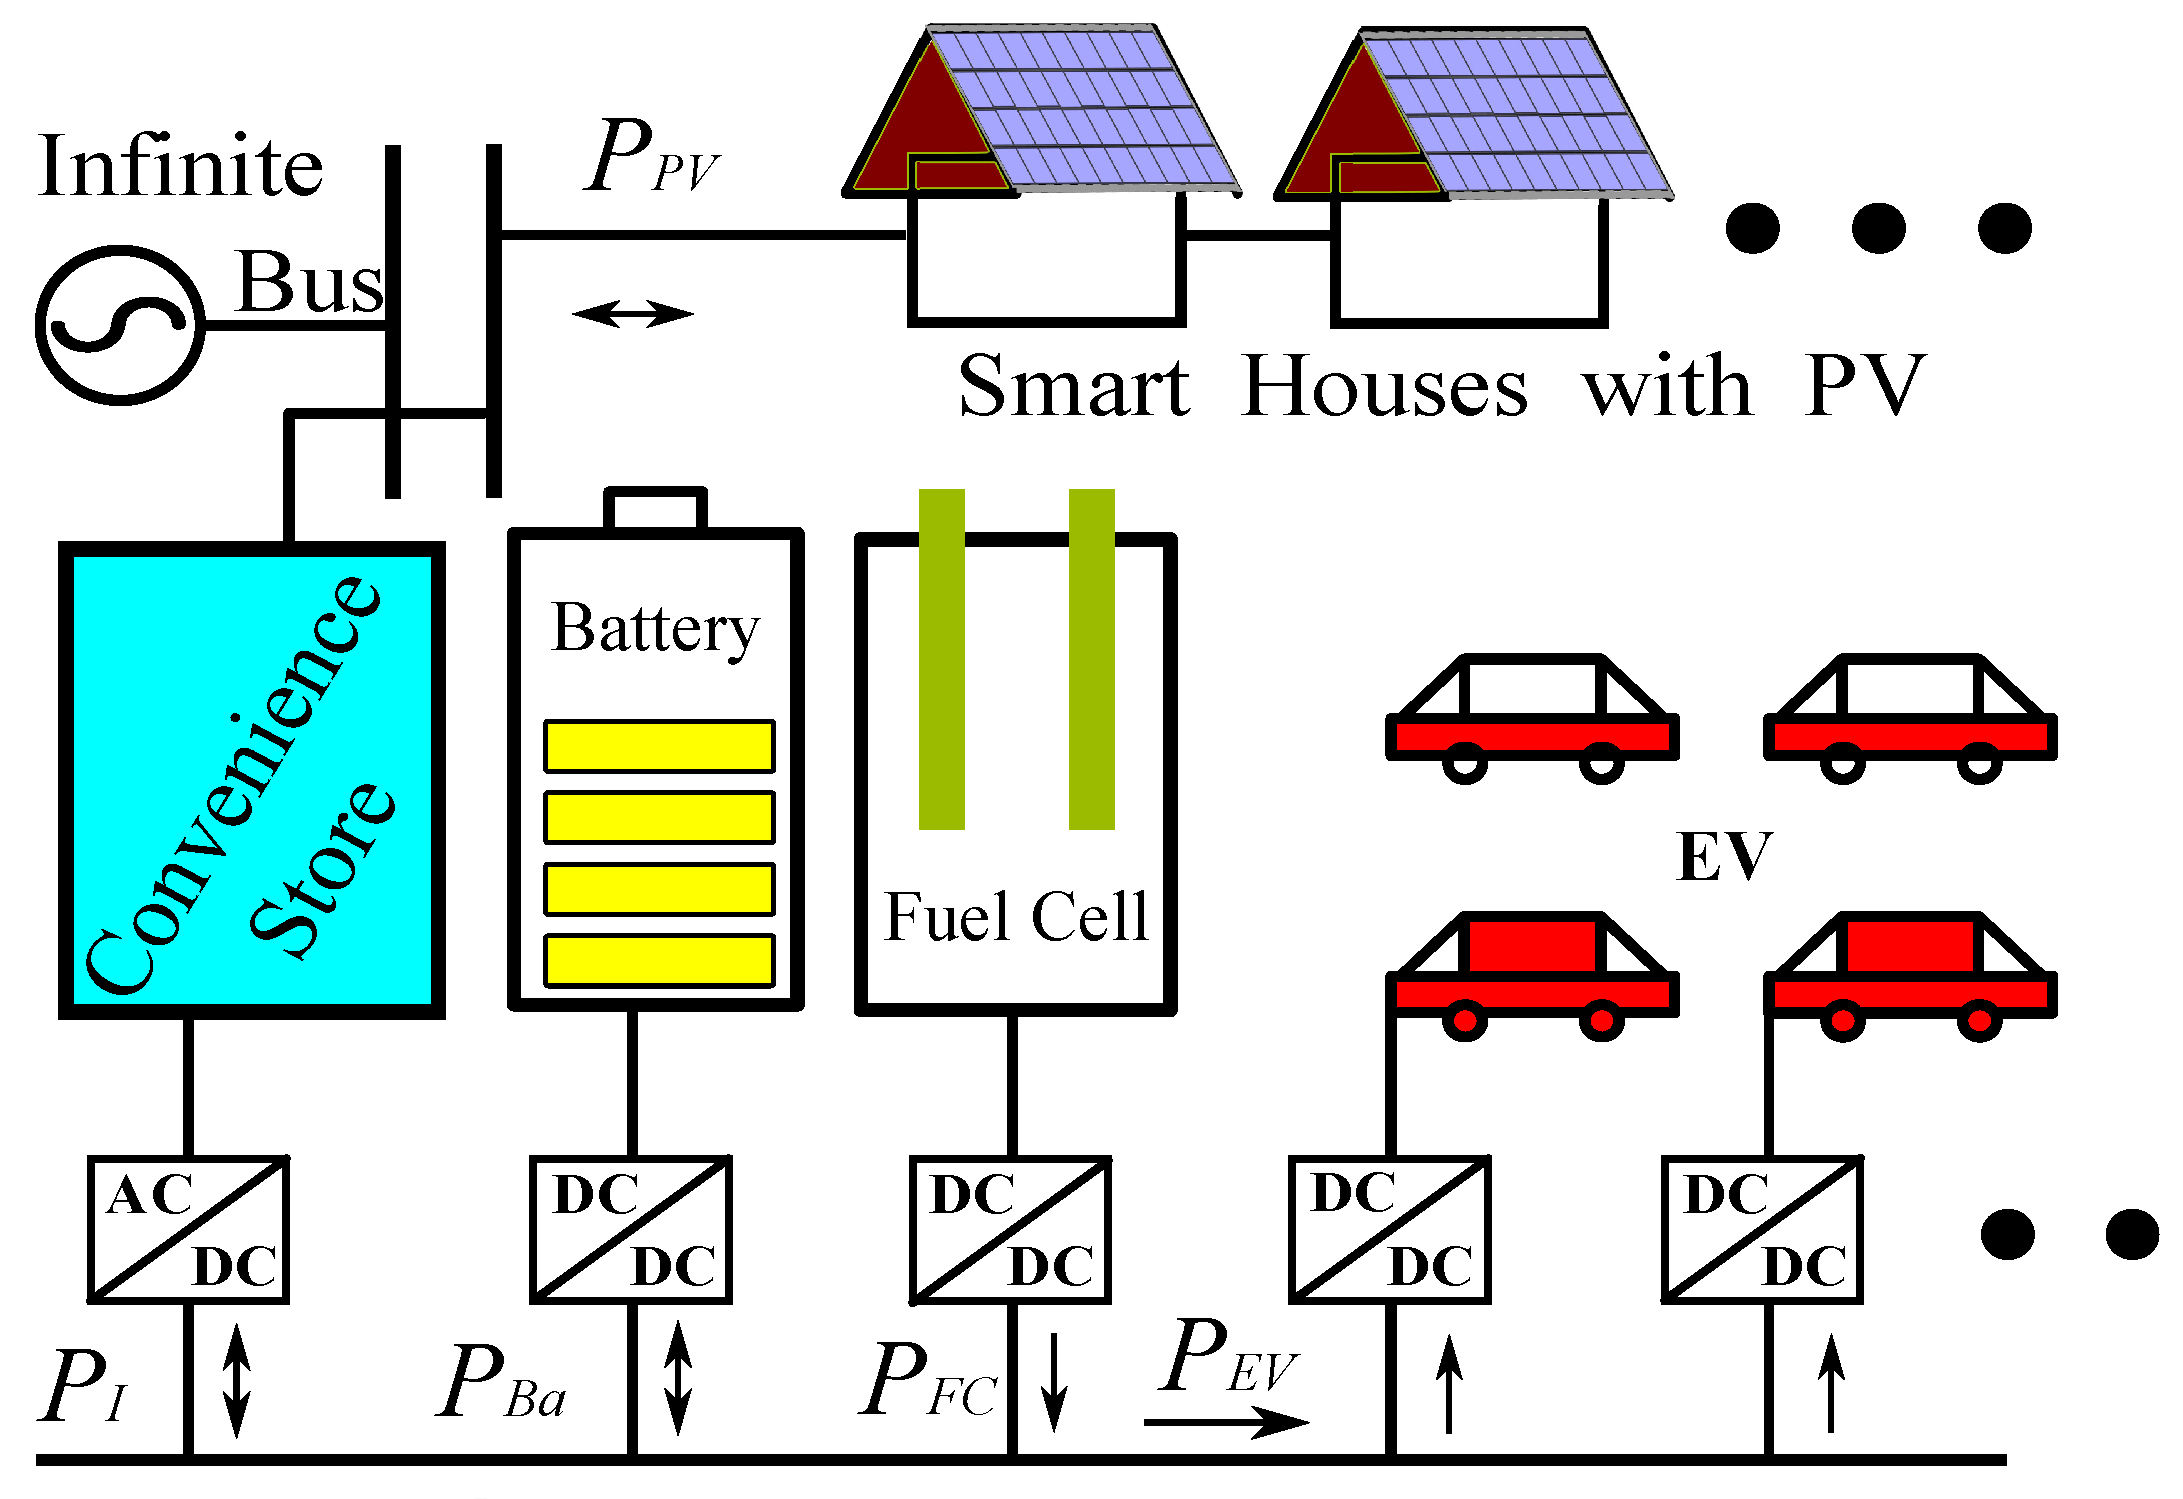
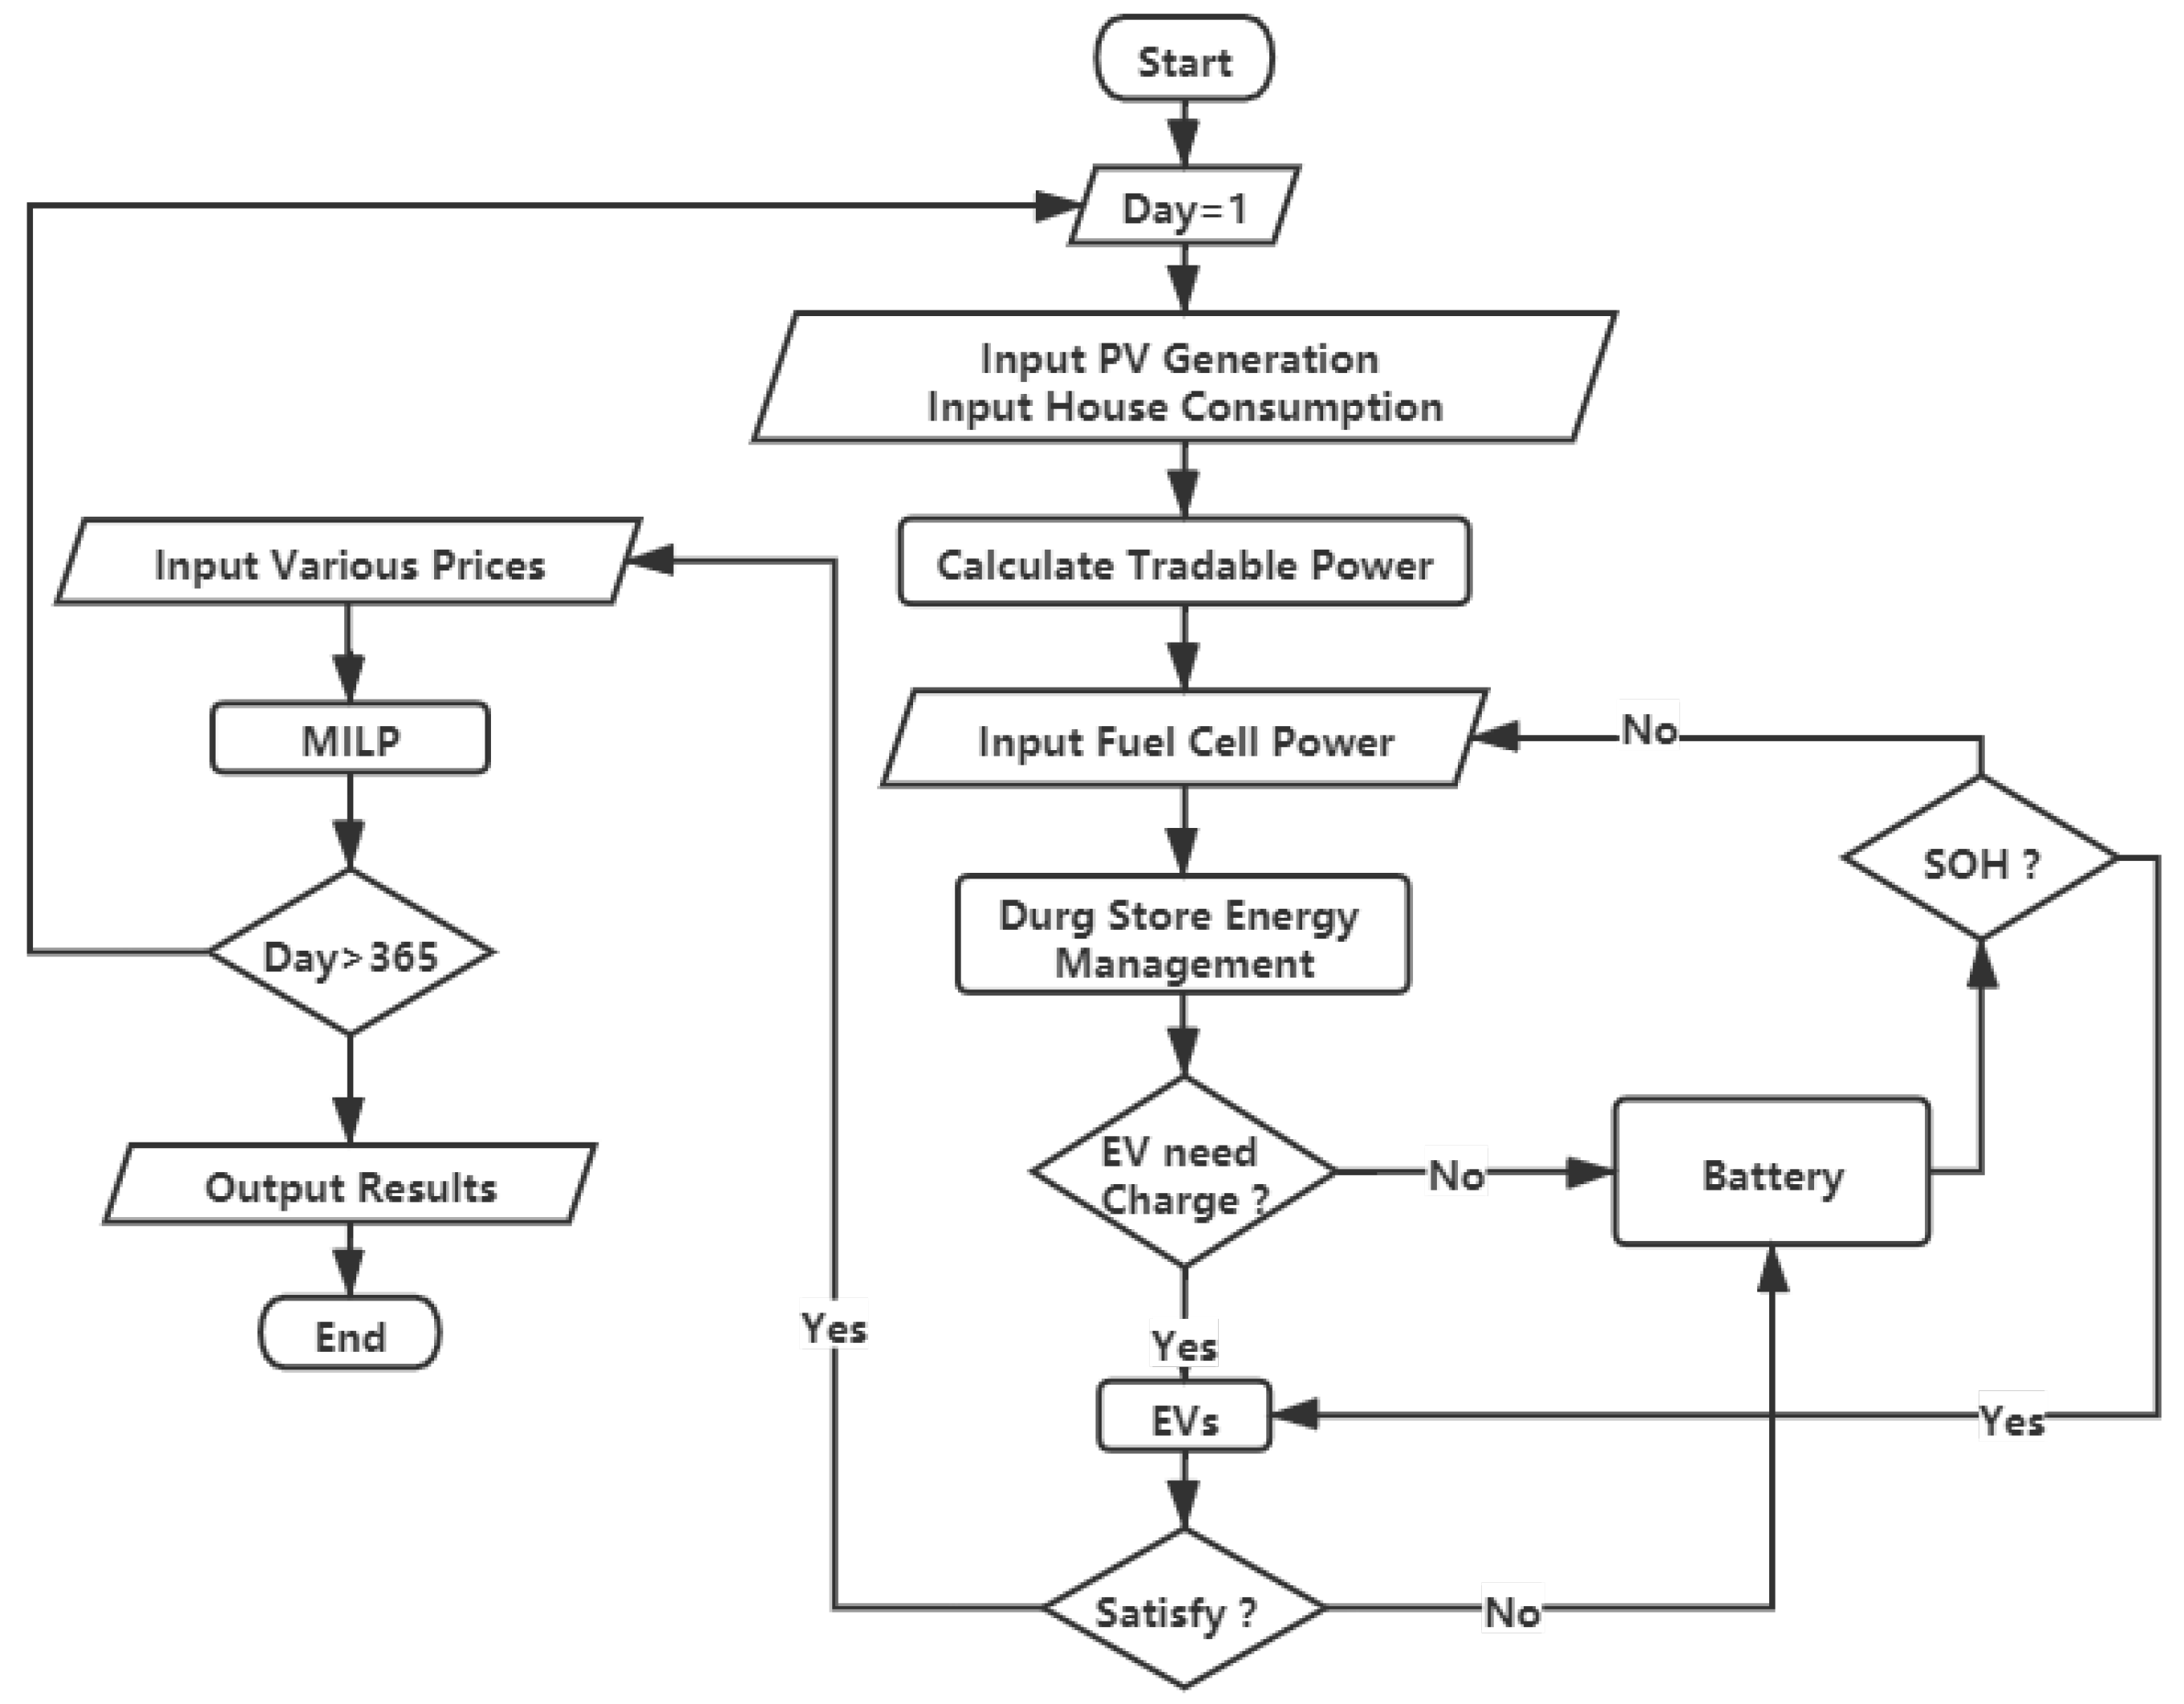
2. Community Energy Management System Model
2.1. Objective Function
2.2. Restrictions
3. Simulation Conditions Scenarios
3.1. EV Charging Station
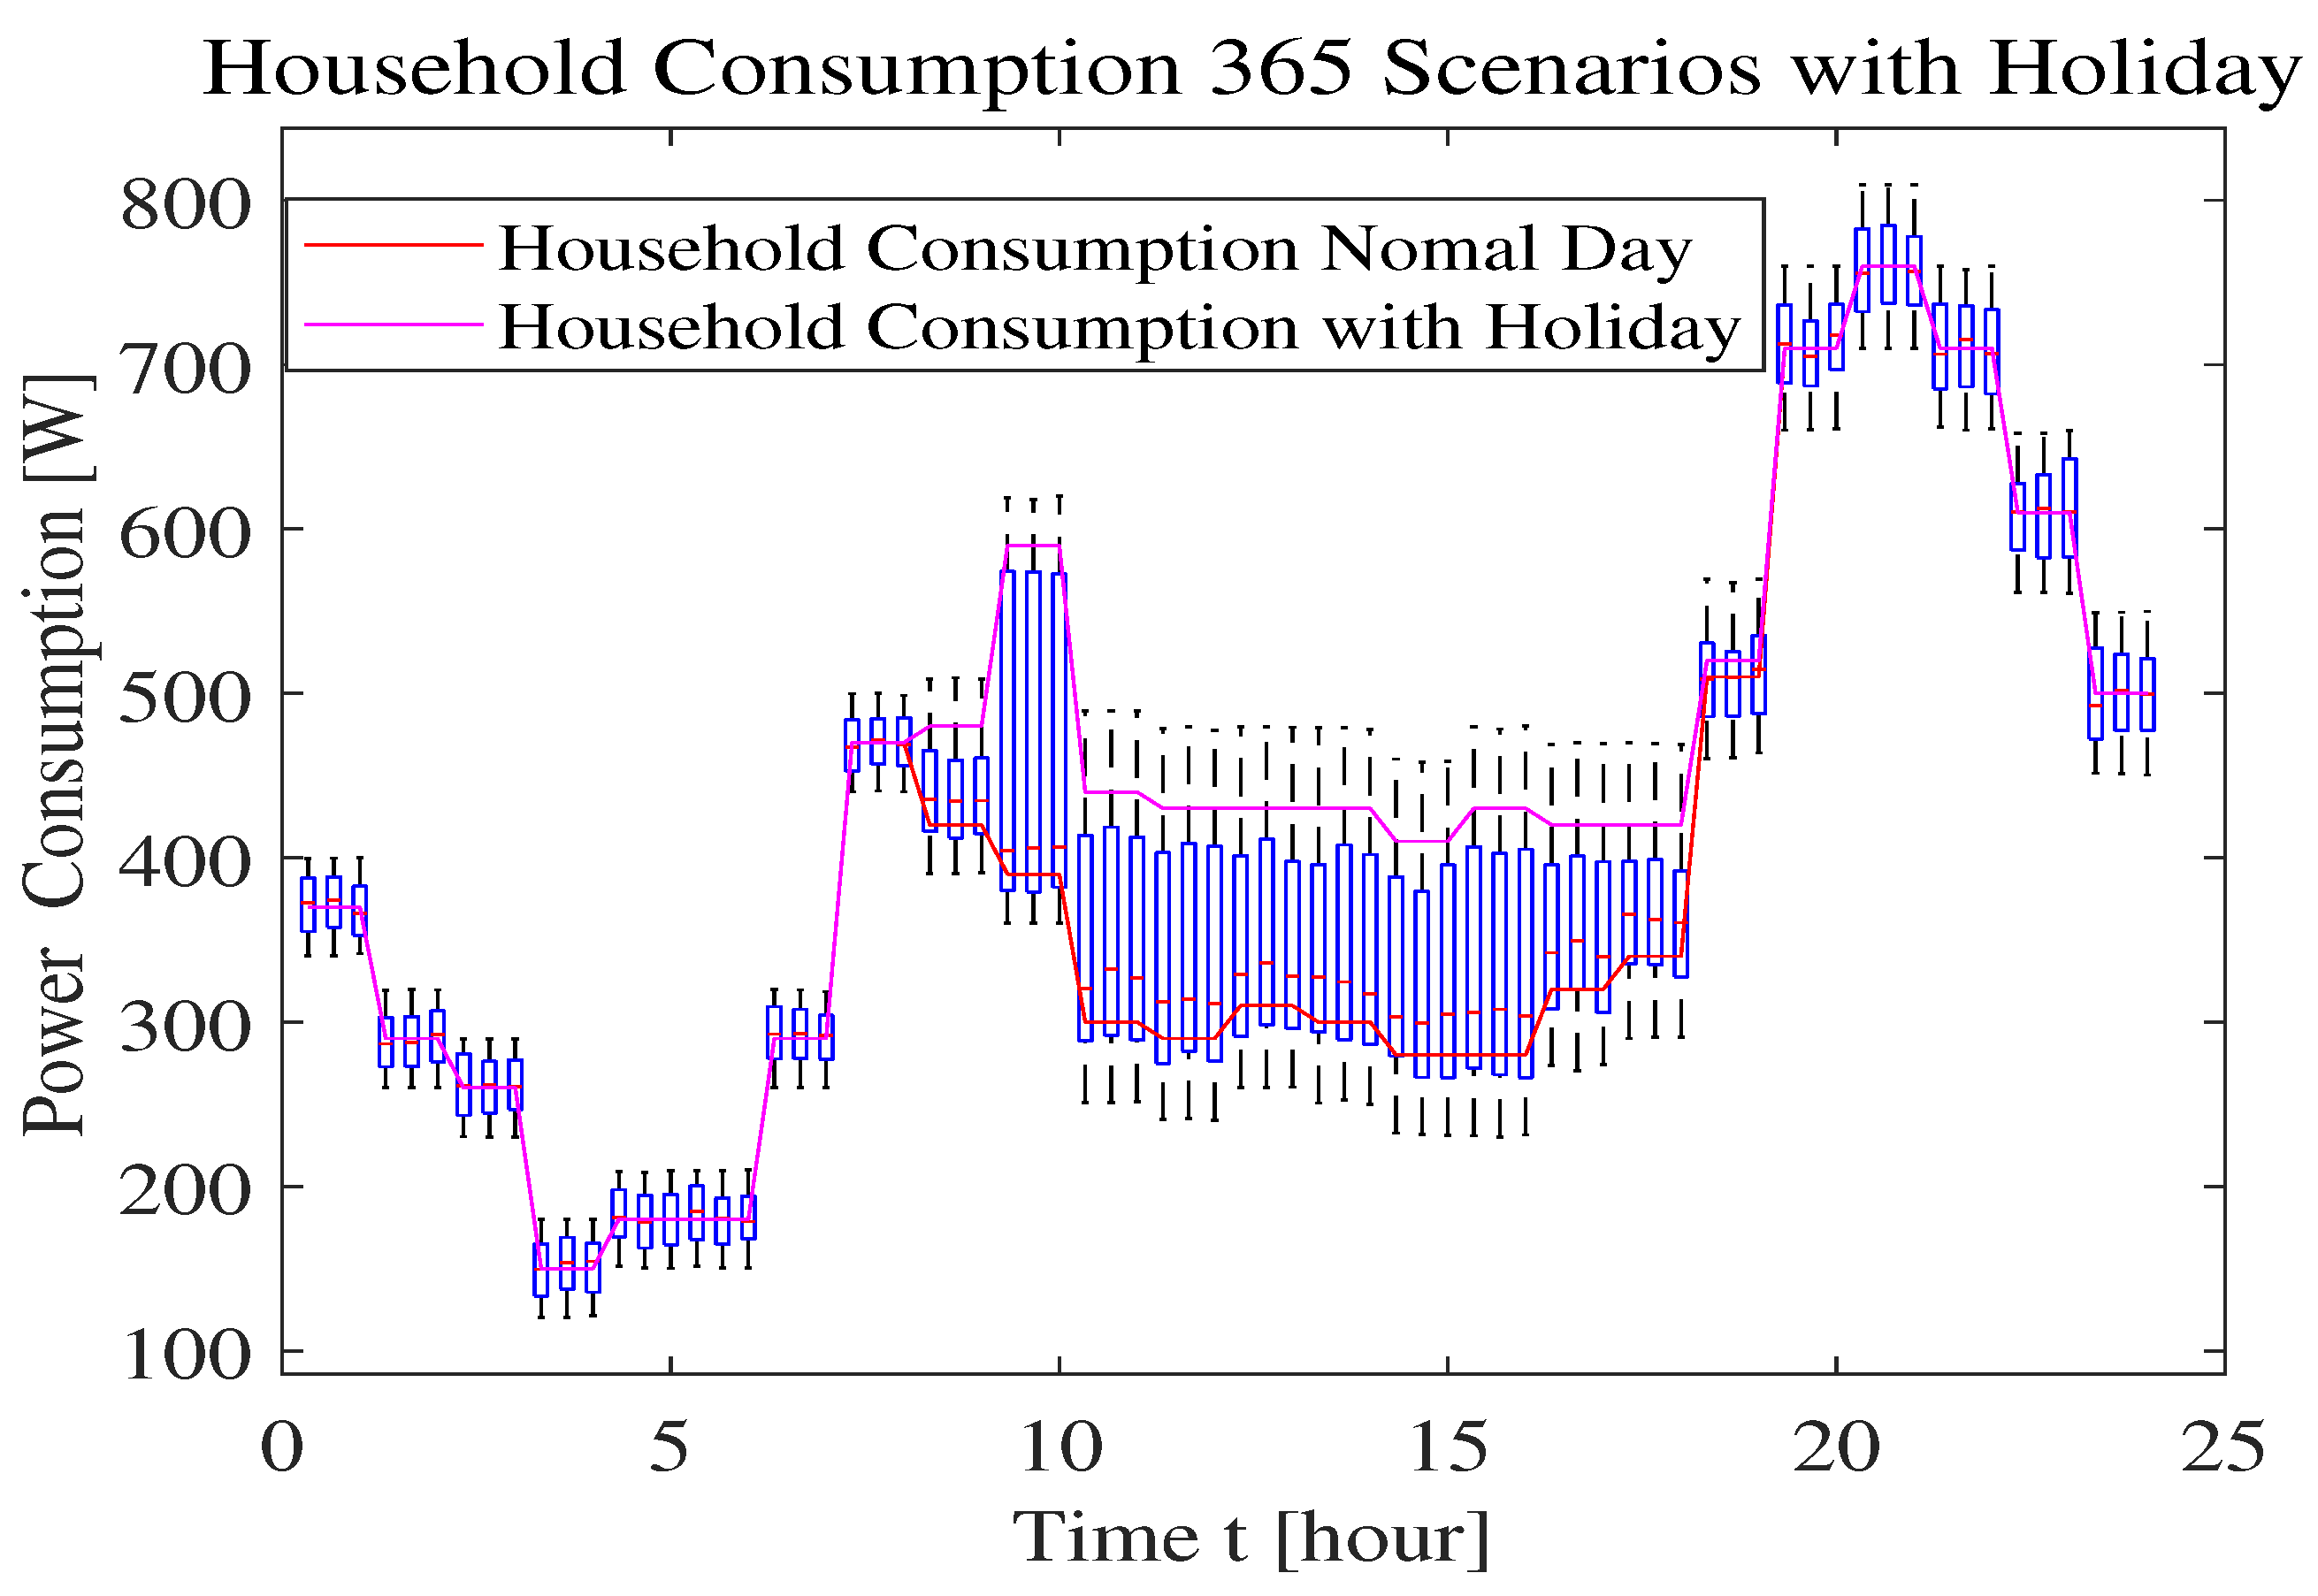
3.2. Household Consumption
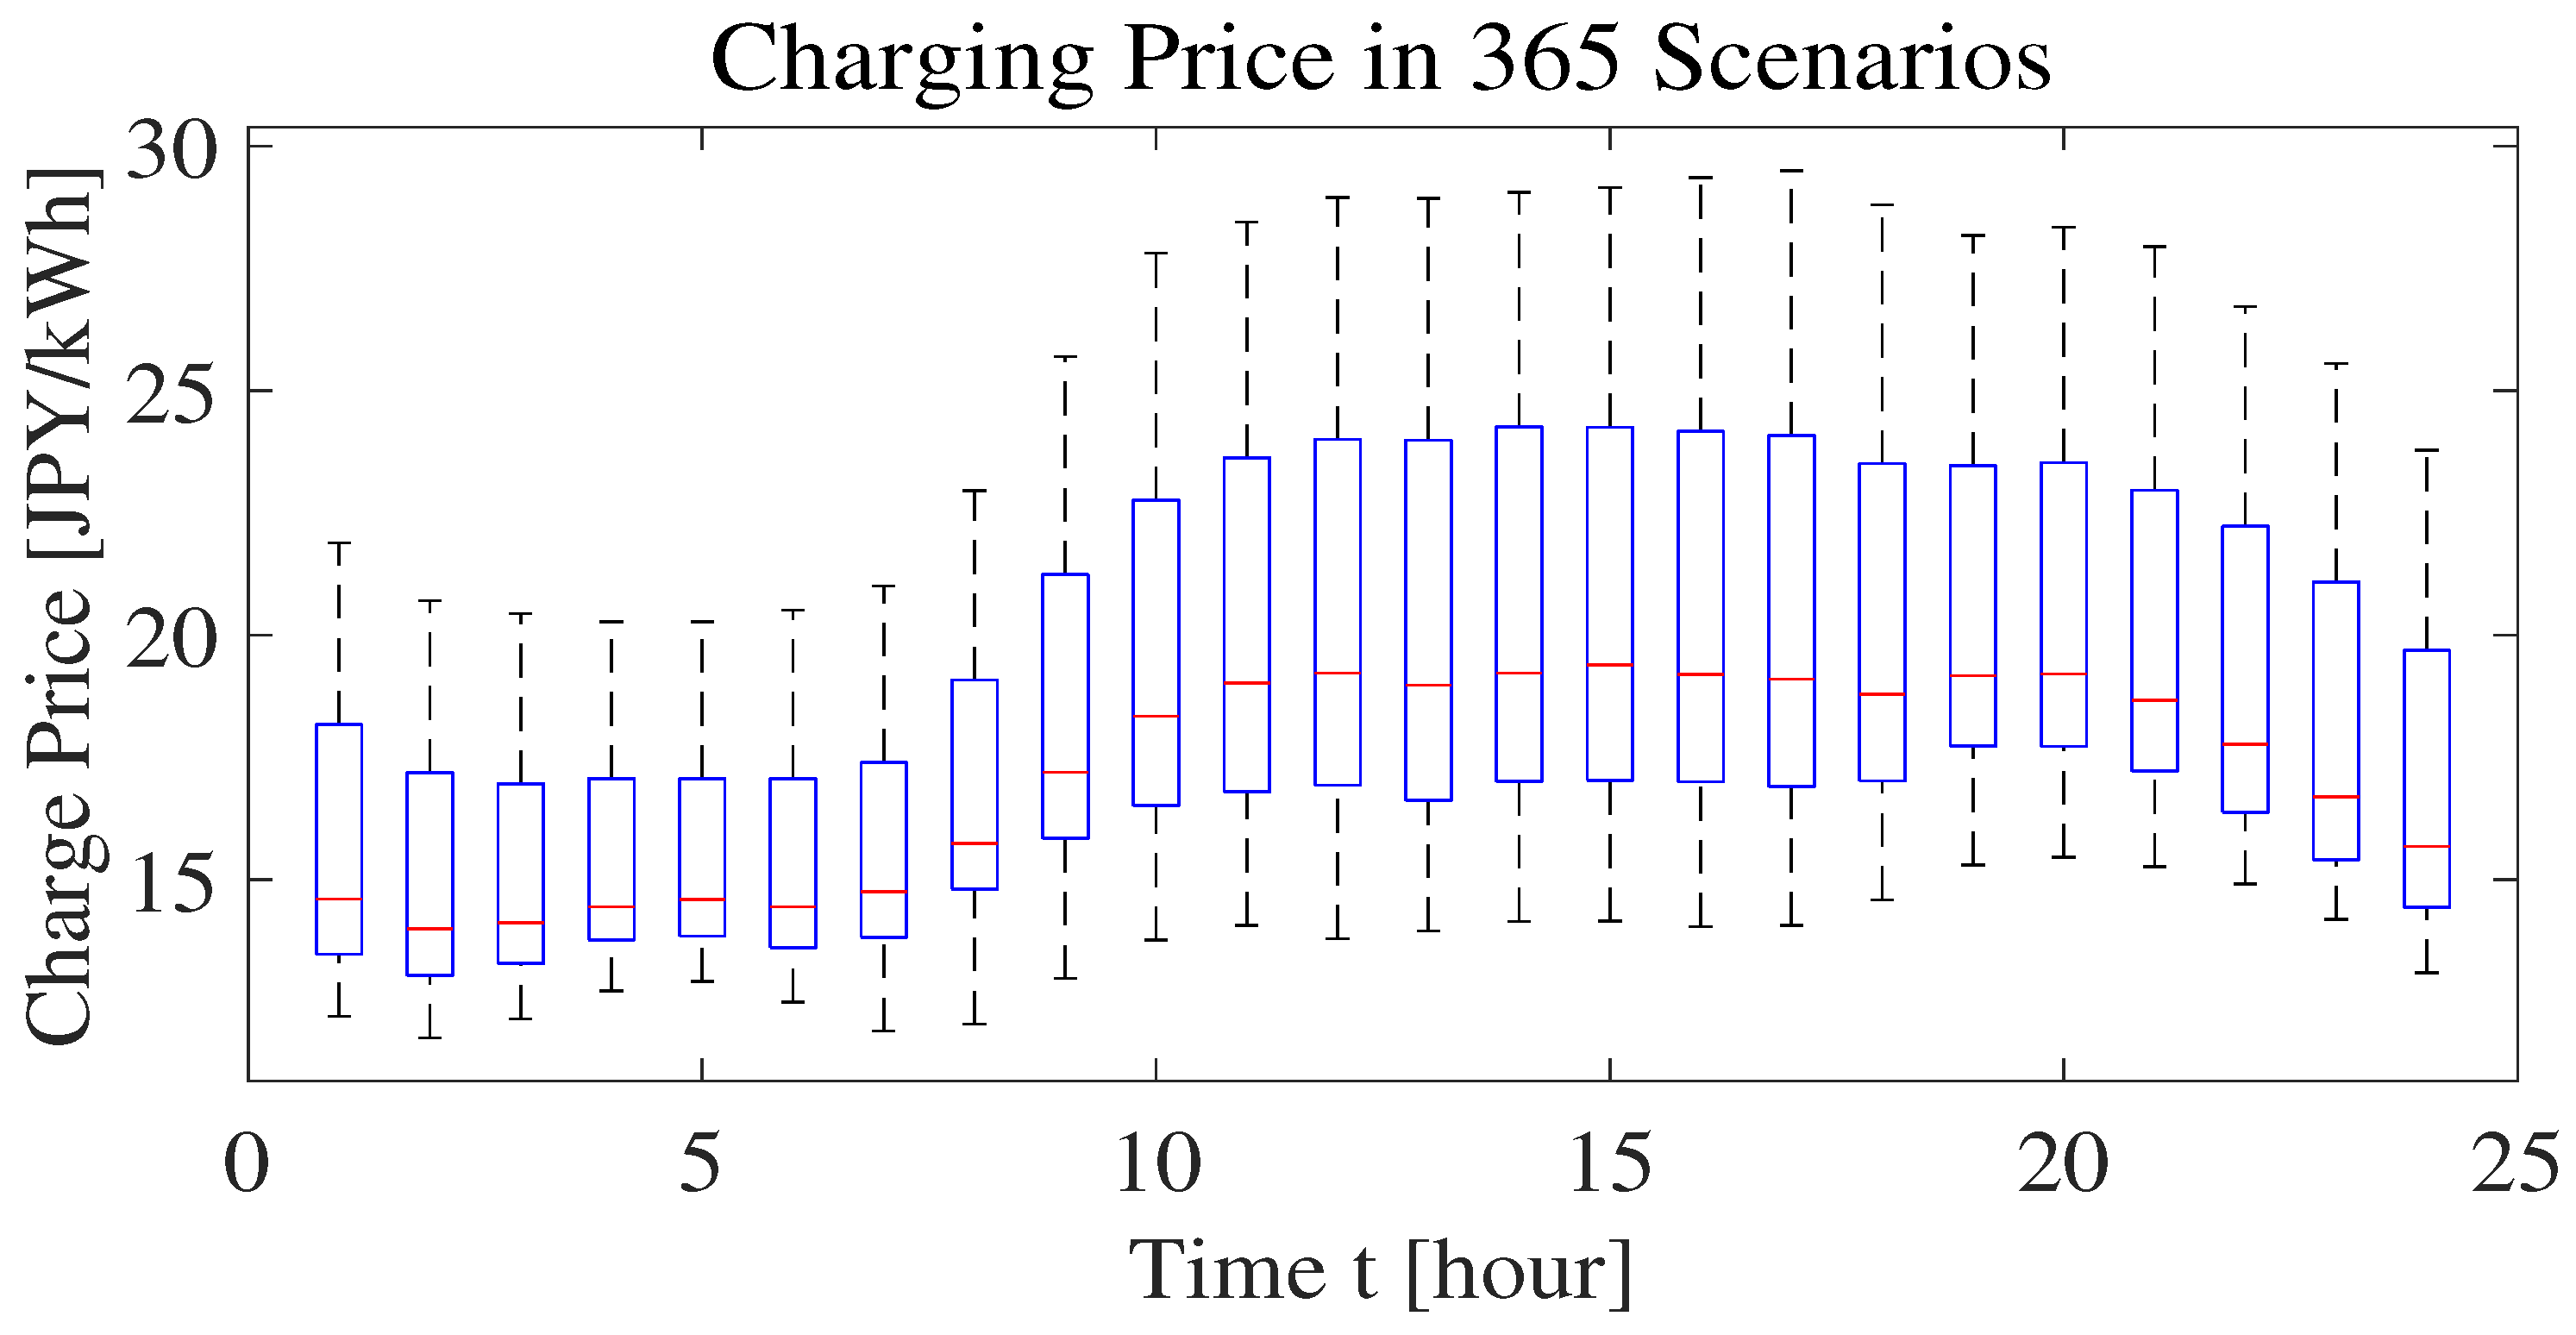
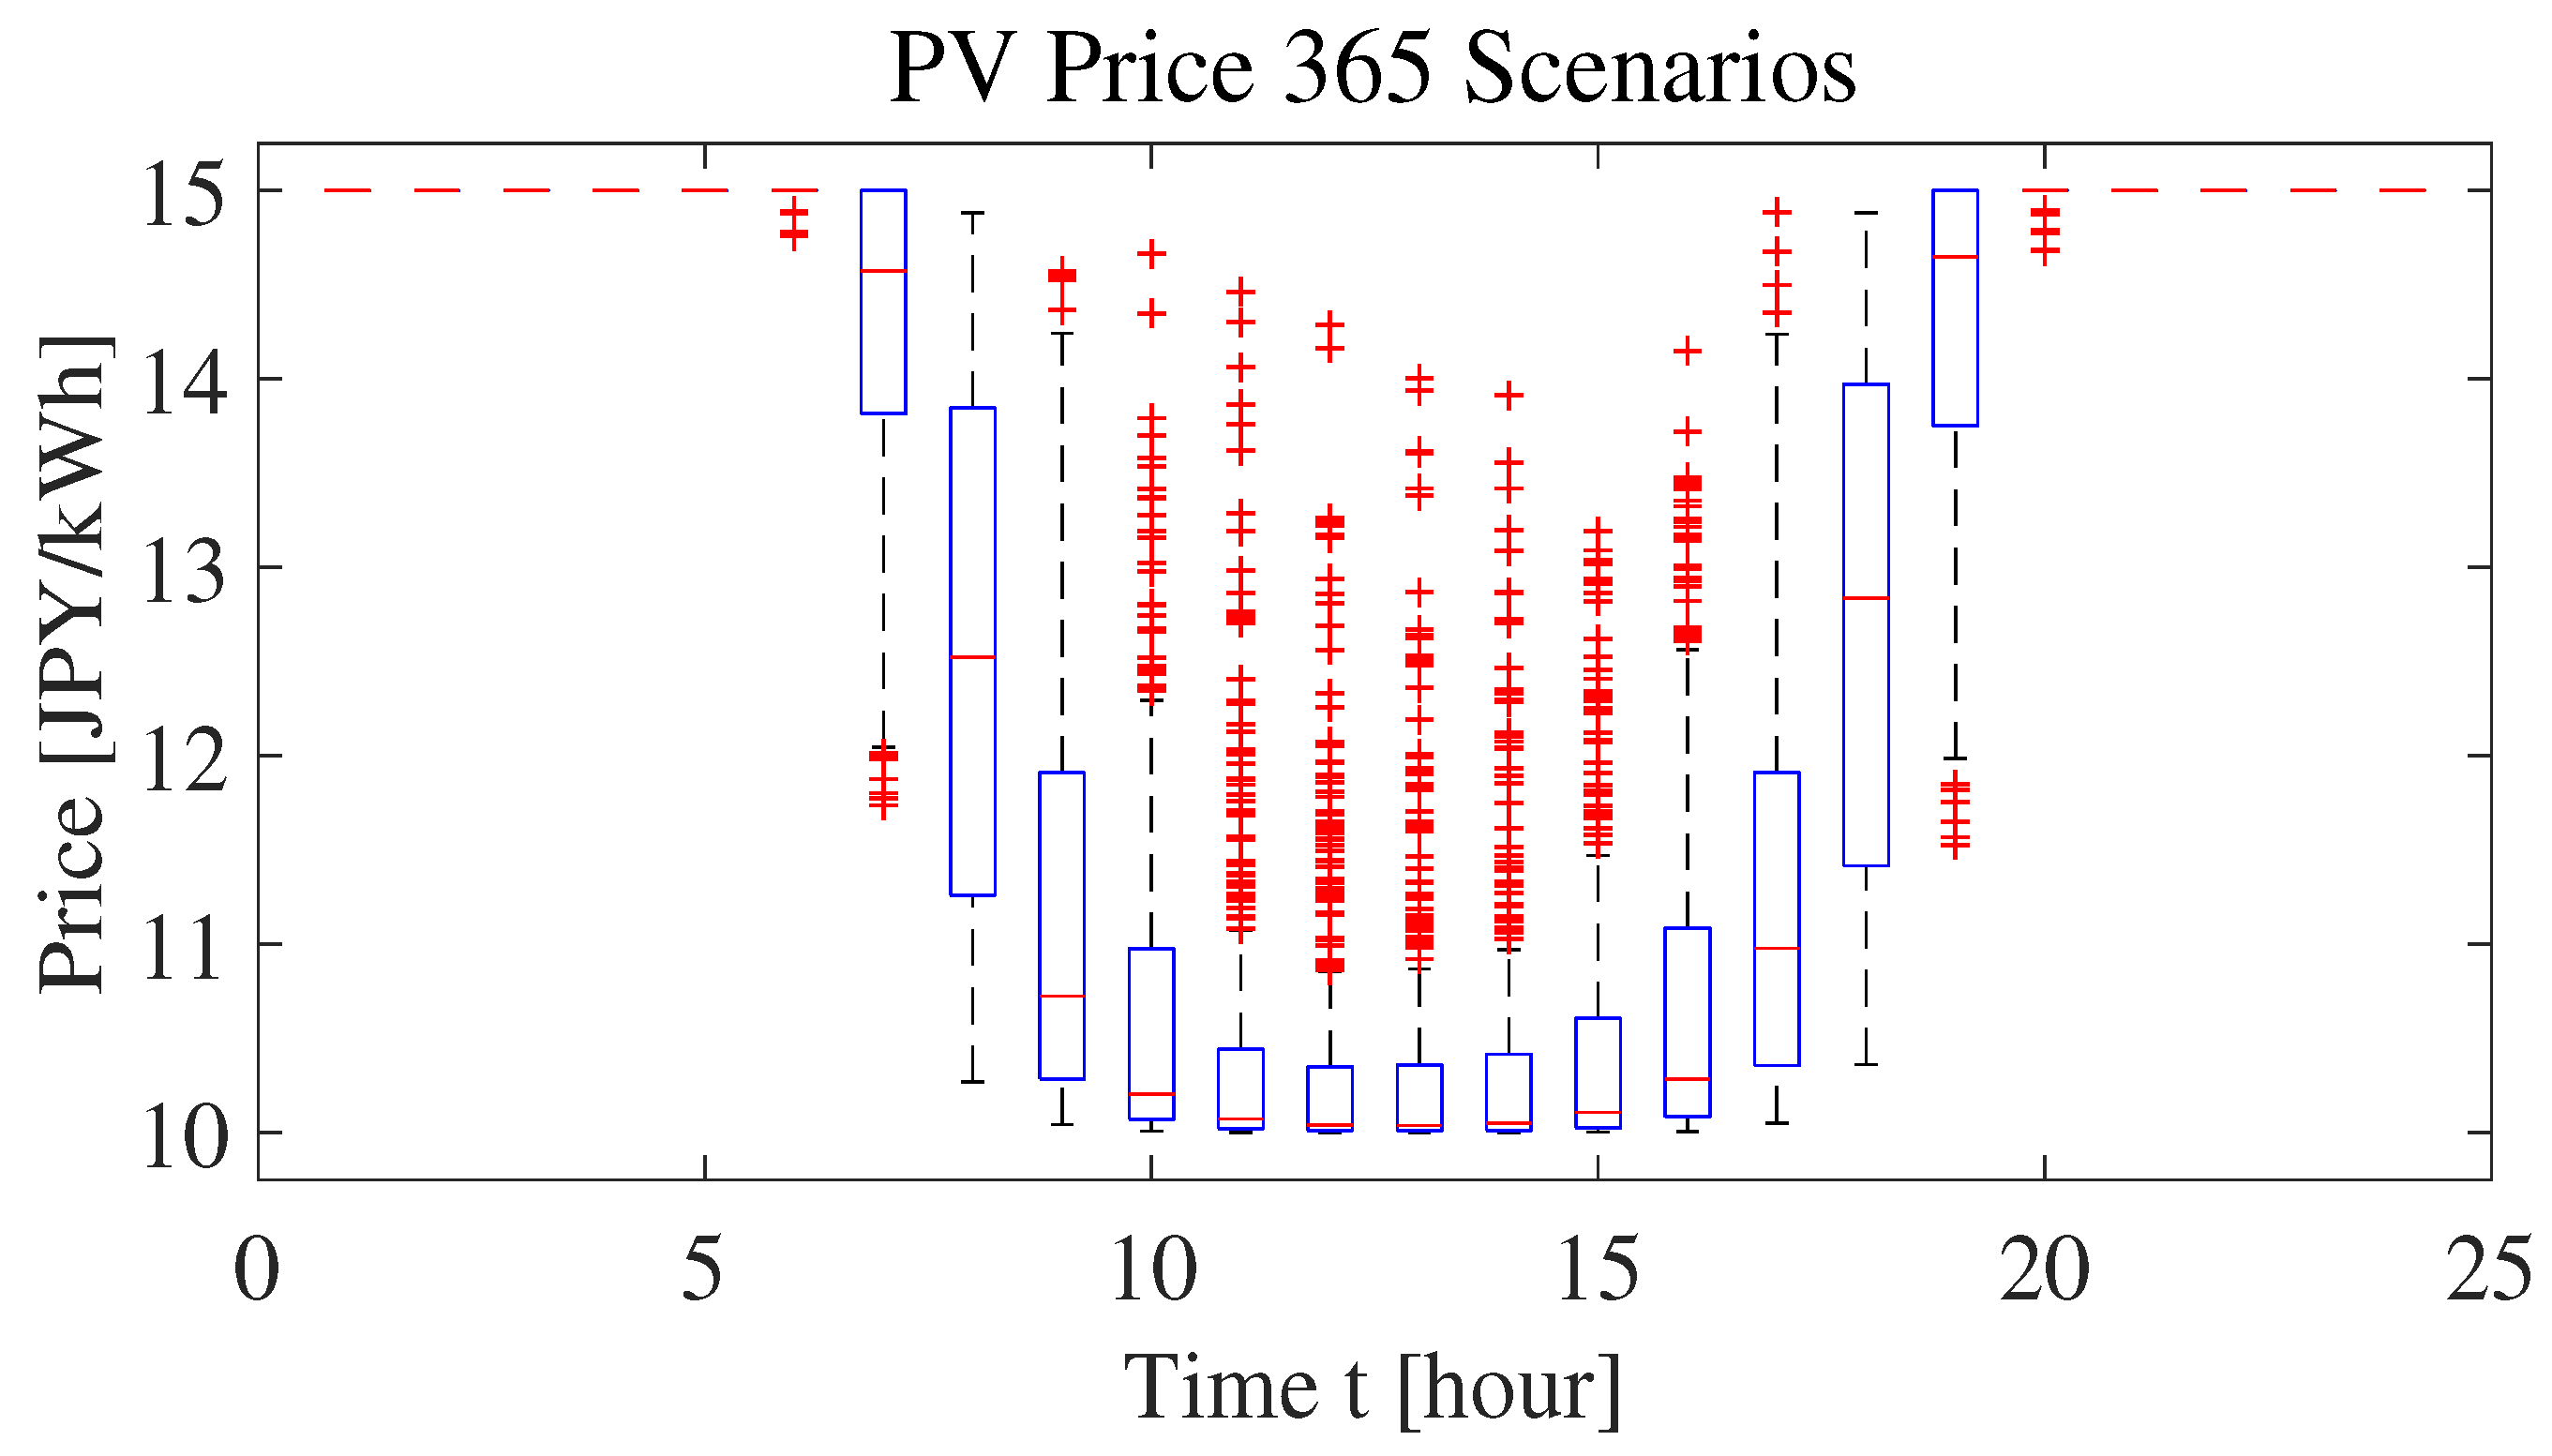
3.3. Real-Time Price of Electricity Demand
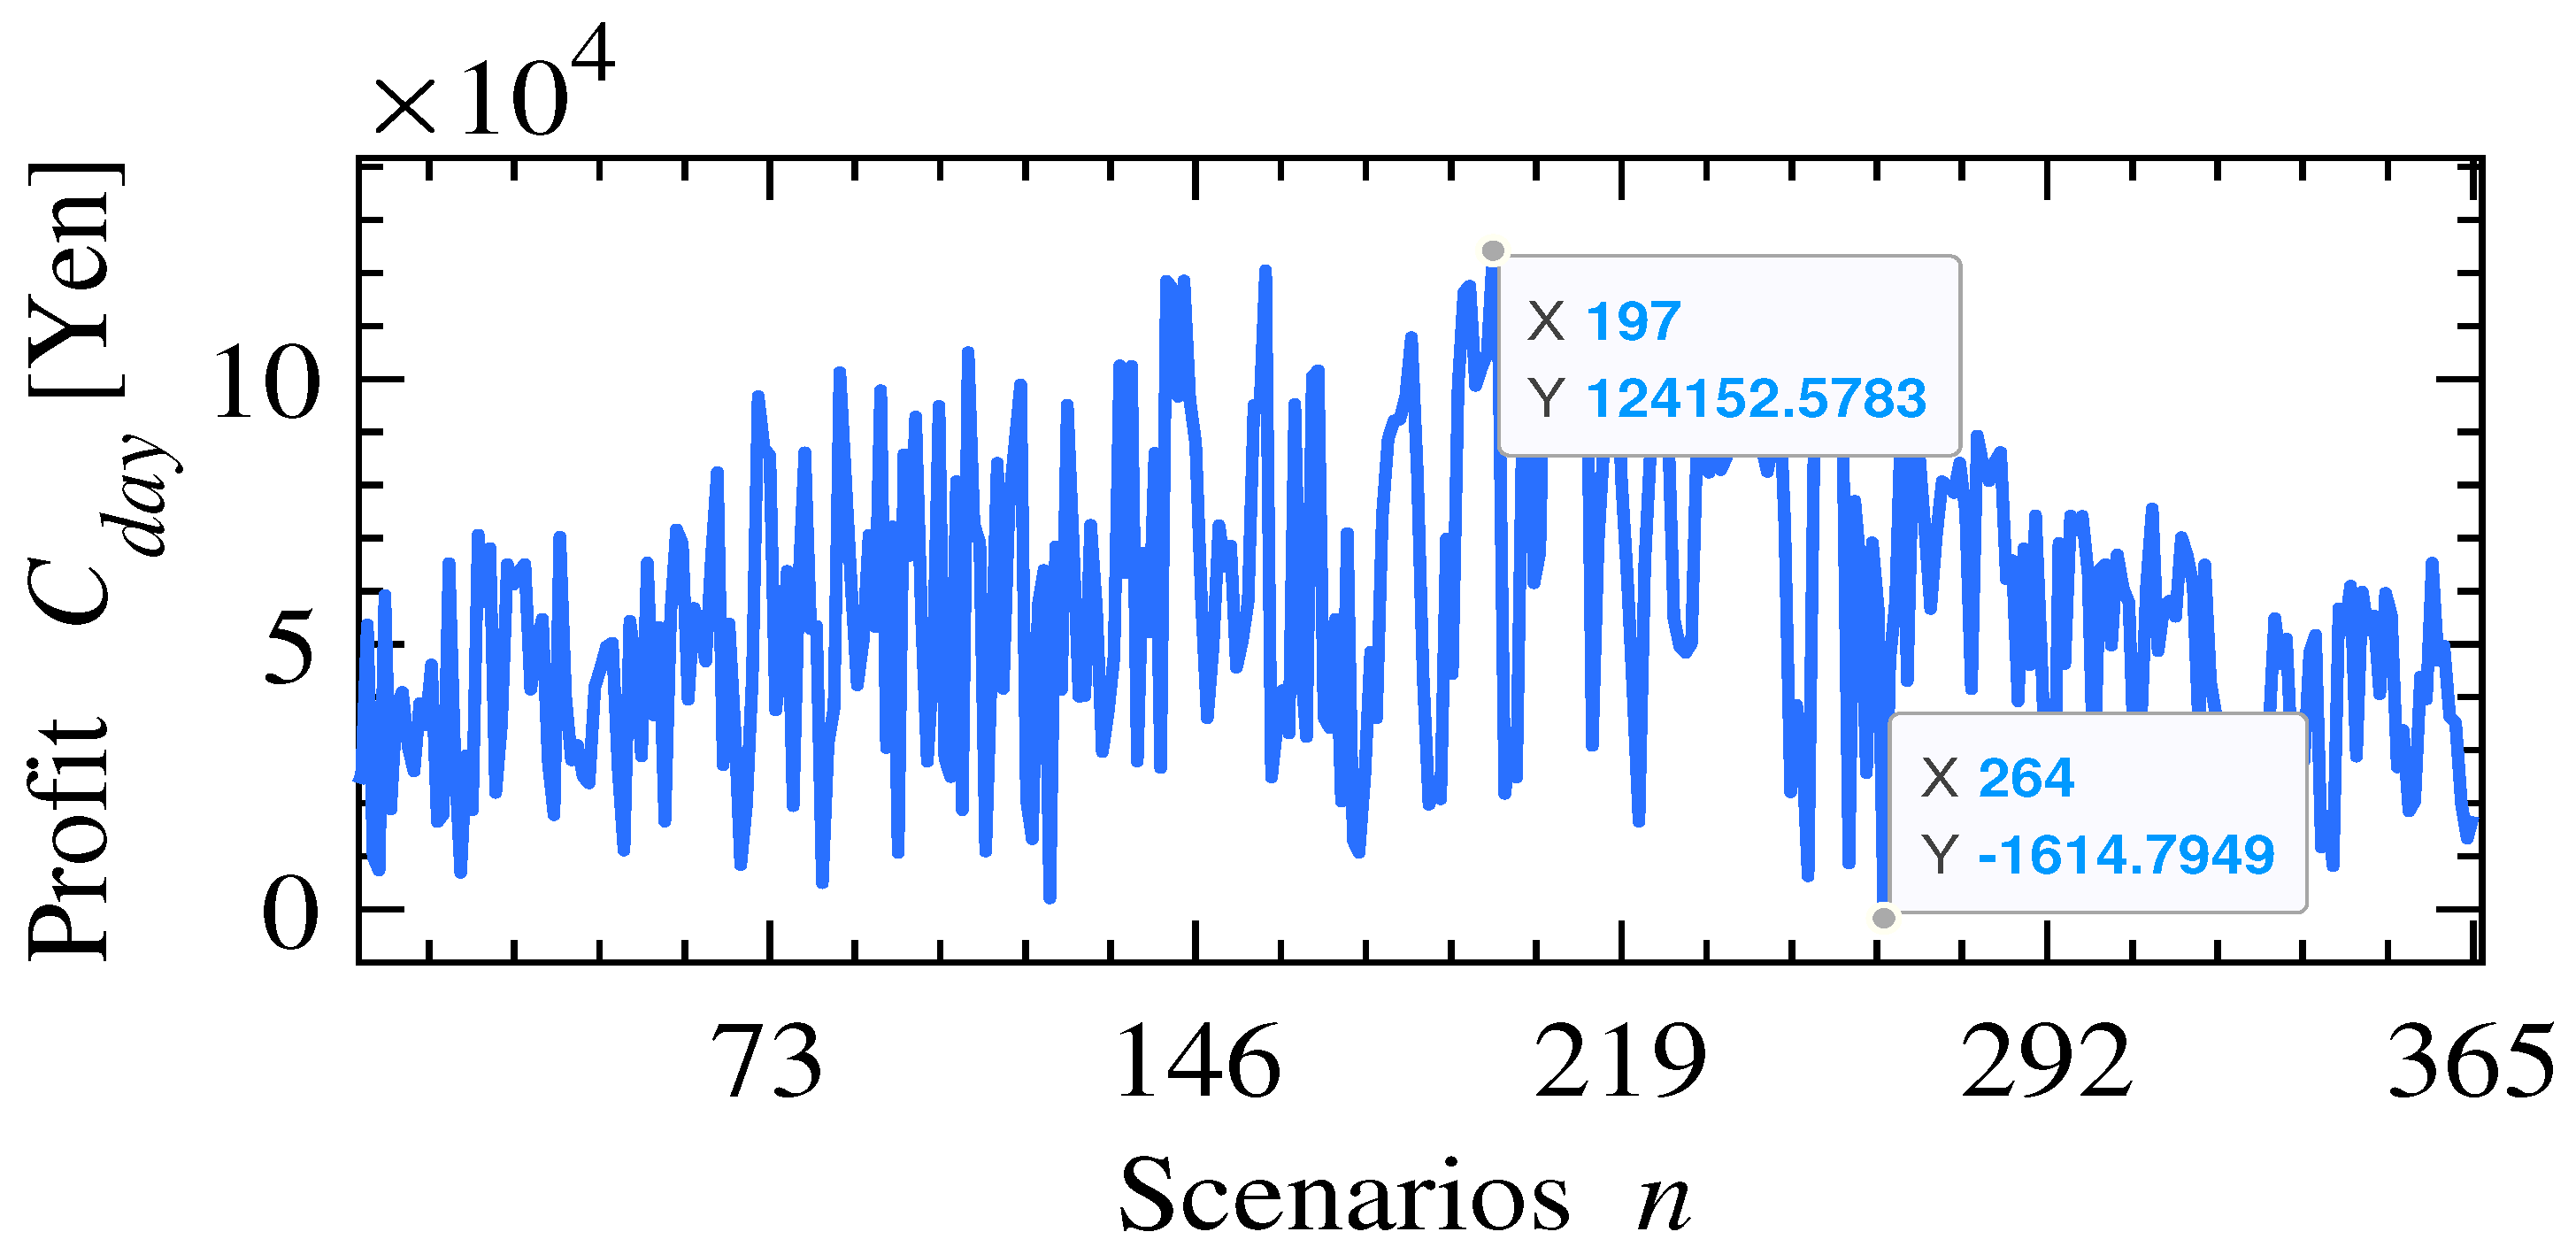
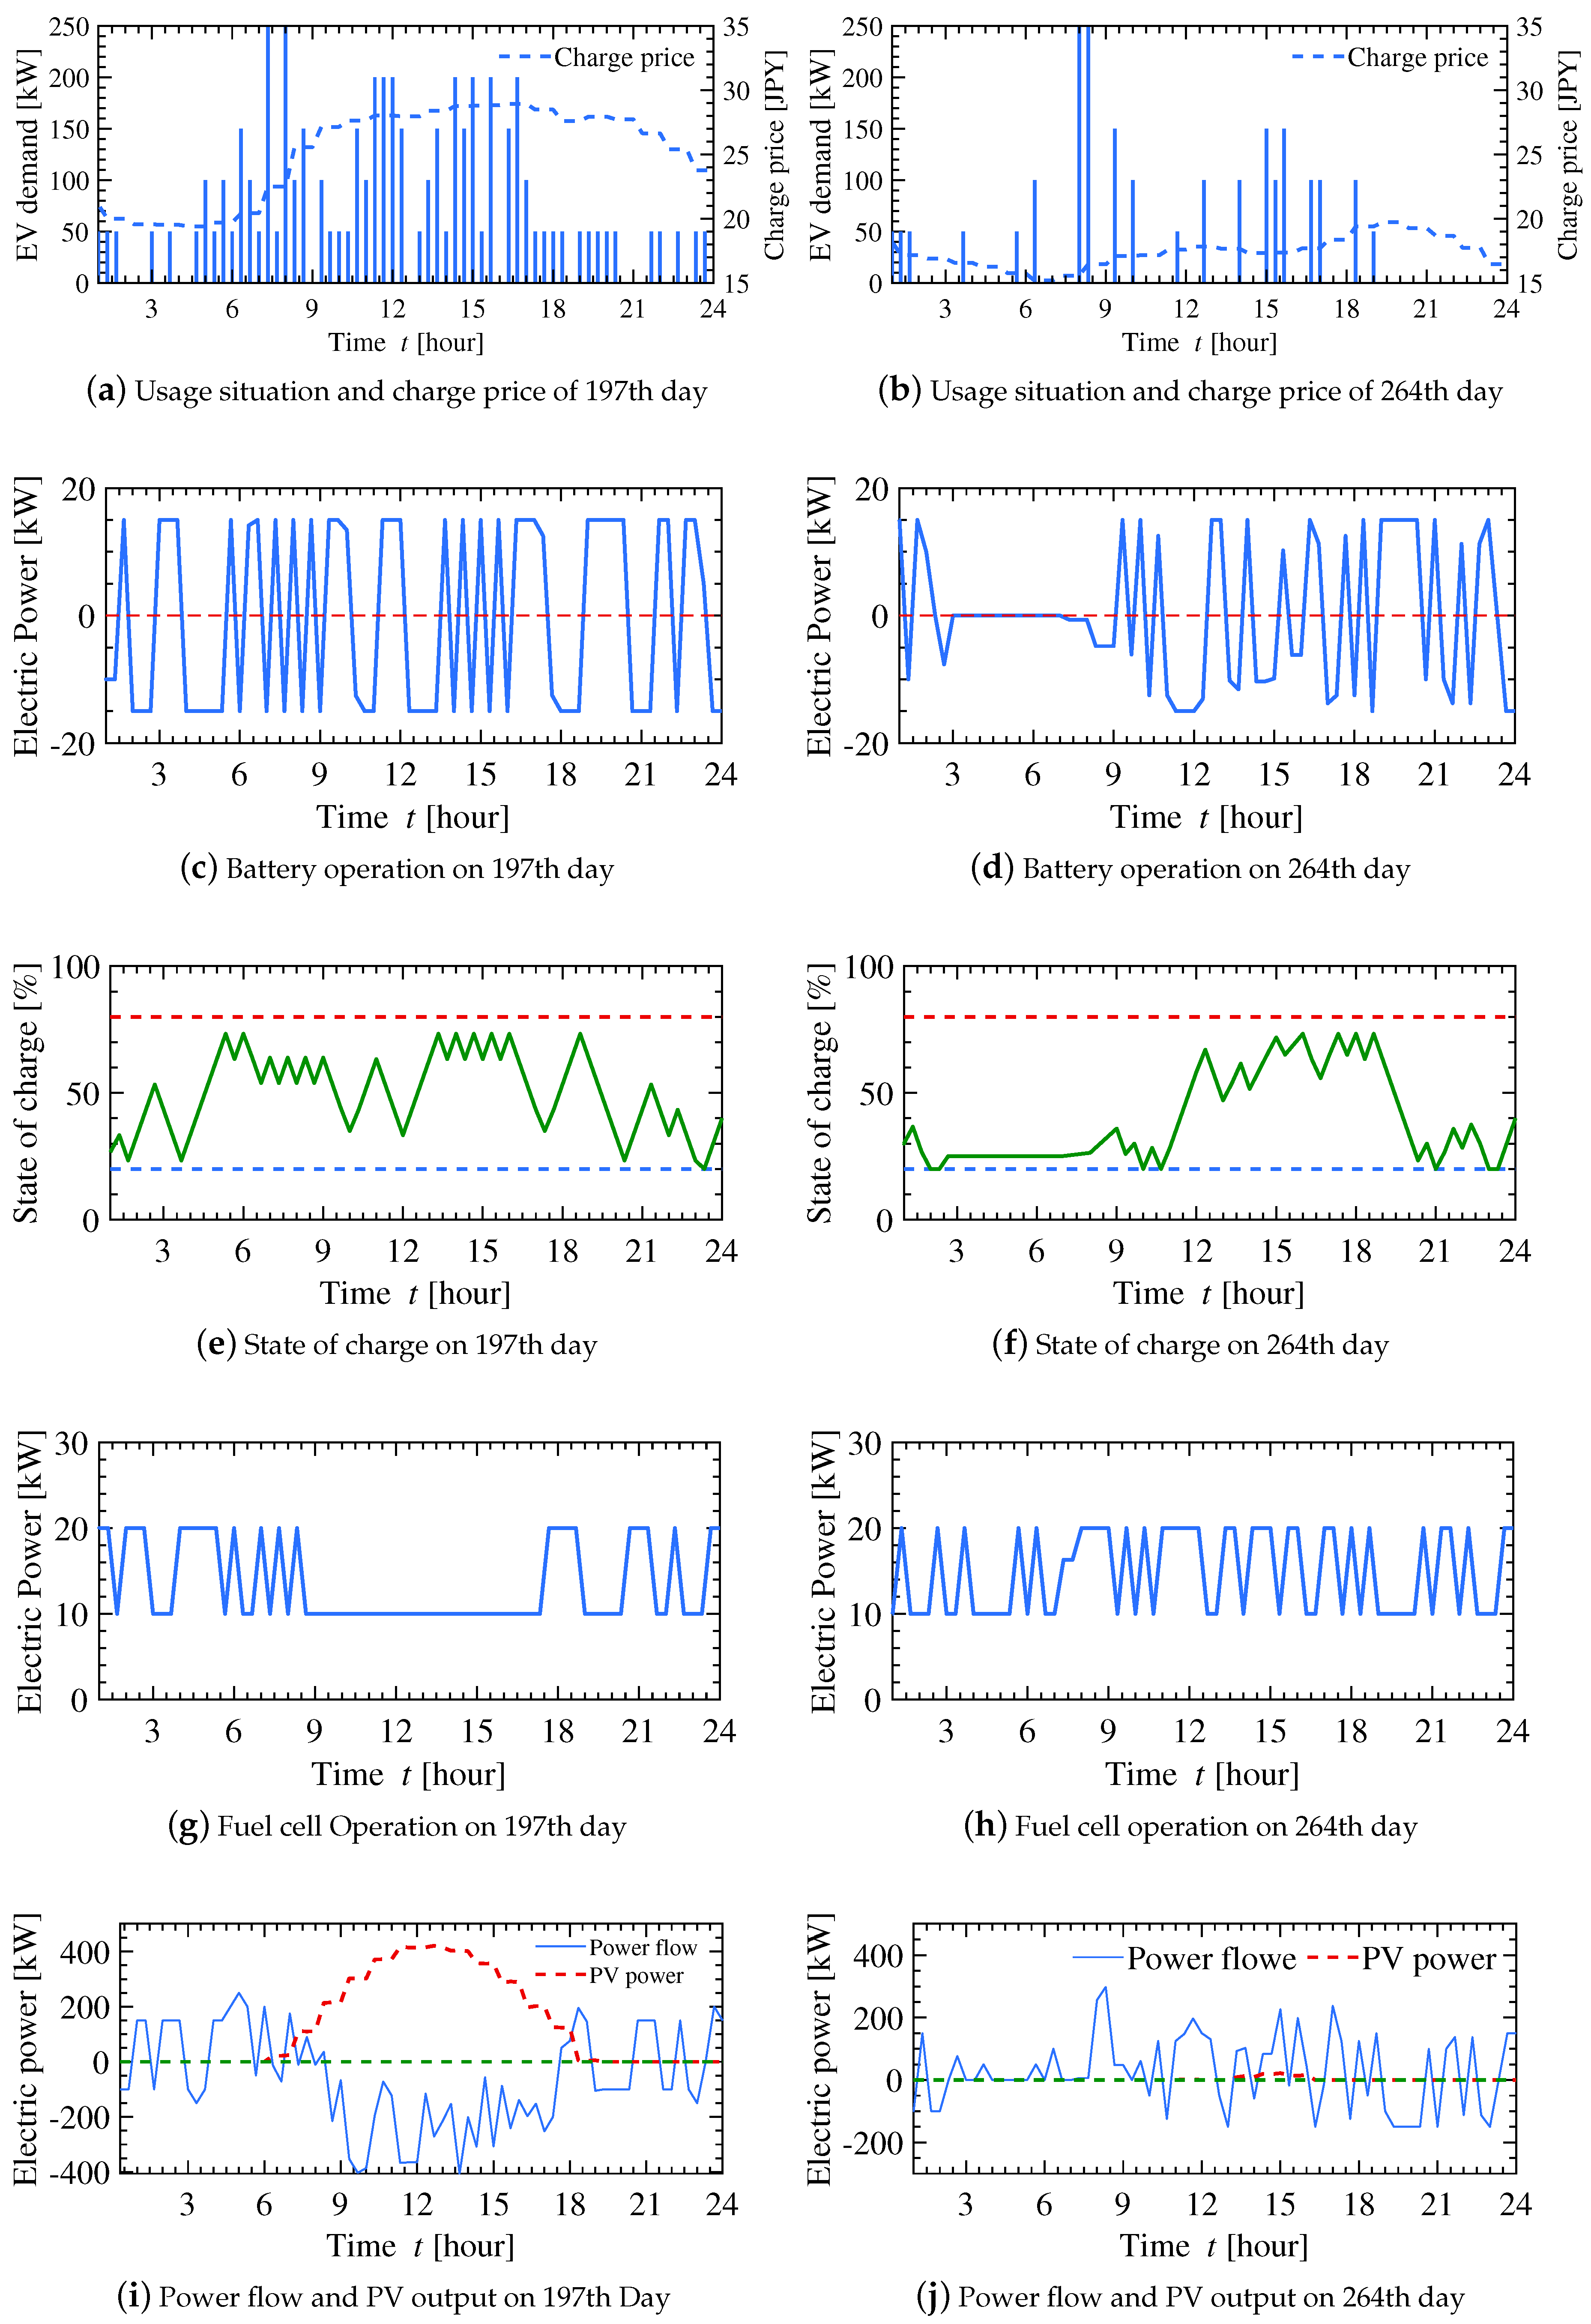
4. Simulation Results Discussion
5. Conclusions and Outlook
Author Contributions
Funding
Institutional Review Board Statement
Informed Consent Statement
Data Availability Statement
Acknowledgments
Conflicts of Interest
Abbreviations
| MILP | Mised Integer Liner Programming |
| IPCC | Intergovernmental Panel on Climate Change |
| EVs | Electric Vehicles |
| HESS | Hybrid Energy Storage Systems |
| FiT | Feed-in Tariff |
| CEMS | Community Energy Management System |
| JPY | Japanese Yen |
Appendix A

| Time [h] | Toilet [W] | Standby [W] | Lighting [W] | TV [W] | Fridge [W] | AC [W] | Other [W] | Total [W] |
|---|---|---|---|---|---|---|---|---|
| 0 | 10 | 30 | 60 | 10 | 20 | 200 | 40 | 370 |
| 1 | 10 | 30 | 40 | 10 | 20 | 150 | 30 | 290 |
| 2 | 0 | 40 | 30 | 0 | 20 | 150 | 20 | 260 |
| 3 | 0 | 30 | 20 | 0 | 20 | 50 | 30 | 150 |
| 4 | 10 | 40 | 30 | 0 | 20 | 50 | 30 | 180 |
| 5 | 10 | 30 | 20 | 10 | 20 | 50 | 40 | 180 |
| 6 | 10 | 40 | 30 | 30 | 20 | 100 | 60 | 290 |
| 7 | 10 | 30 | 40 | 60 | 20 | 200 | 110 | 470 |
| 8 | 10 | 30 | 40 | 60/100 | 20/40 | 100 | 160 | 420/480 |
| 9 | 10 | 30 | 40 | 70/100 | 20/40 | 50/100 | 170 | 390/590 |
| 10 | 10 | 30 | 40 | 60/100 | 20 | 0/100 | 140 | 300/440 |
| 11 | 10 | 30 | 40 | 60/100 | 30 | 0/100 | 120 | 290/430 |
| 12 | 10 | 30 | 70 | 80/100 | 30 | 0/100 | 90 | 310/430 |
| 13 | 10 | 30 | 70 | 70/100 | 20 | 0/100 | 100 | 300/430 |
| 14 | 10 | 30 | 70 | 70/100 | 20 | 0/100 | 80 | 280/410 |
| 15 | 10 | 40 | 70 | 70/100 | 20/40 | 0/100 | 70 | 280/430 |
| 16 | 10 | 30 | 70 | 70/100 | 20/40 | 50/100 | 70 | 320/420 |
| 17 | 10 | 30 | 80 | 70/100 | 20 | 50/100 | 80 | 340/420 |
| 18 | 10 | 30 | 100 | 90/100 | 30 | 150 | 100 | 510/520 |
| 19 | 10 | 40 | 180 | 110 | 30 | 200 | 140 | 710 |
| 20 | 10 | 40 | 180 | 130 | 20 | 250 | 130 | 760 |
| 21 | 10 | 40 | 180 | 120 | 20 | 230 | 110 | 710 |
| 22 | 10 | 40 | 150 | 90 | 20 | 200 | 100 | 610 |
| 23 | 10 | 40 | 120 | 40 | 20 | 200 | 70 | 500 |
References
- Parker, A.; Geden, O. No fudging on geoengineering. Nat. Geosci. 2016, 9, 859–860. [Google Scholar] [CrossRef]
- Hulme, M. 1.5 °C and climate research after the Paris Agreement. Nat. Clim. Chang. 2016, 6, 222–224. [Google Scholar] [CrossRef]
- Change, P.C. Global Warming of 1.5 °C; World Meteorological Organization: Geneva, Switzerland, 2018. [Google Scholar]
- Kroposki, B. Integrating high levels of variable renewable energy into electric power systems. J. Mod. Power Syst. Clean Energy 2017, 5, 831–837. [Google Scholar] [CrossRef]
- Capros, P.; Kannavou, M.; Evangelopoulou, S.; Petropoulos, A.; Siskos, P.; Tasios, N.; Zazias, G.; DeVita, A. Outlook of the EU energy system up to 2050: The case of scenarios prepared for European Commission’s “clean energy for all Europeans” package using the PRIMES model. Energy Strategy Rev. 2018, 22, 255–263. [Google Scholar] [CrossRef]
- Reşitoğlu, İ.A.; Altinişik, K.; Keskin, A. The pollutant emissions from diesel-engine vehicles and exhaust aftertreatment systems. Clean Technol. Environ. Policy 2015, 17, 15–27. [Google Scholar] [CrossRef]
- Brown, S.; Pyke, D.; Steenhof, P. Electric vehicles: The role and importance of standards in an emerging market. Energy Policy 2010, 38, 3797–3806. [Google Scholar] [CrossRef]
- Kittner, N.; Lill, F.; Kammen, D.M. Energy storage deployment and innovation for the clean energy transition. Nat. Energy 2017, 2, 17125. [Google Scholar] [CrossRef]
- Liu, Y.; Zhu, Y.; Cui, Y. Challenges and opportunities towards fast-charging battery materials. Nat. Energy 2019, 4, 540–550. [Google Scholar] [CrossRef]
- Xie, F.; Liu, C.; Li, S.; Lin, Z.; Huang, Y. Long-term strategic planning of inter-city fast charging infrastructure for battery electric vehicles. Transp. Res. Part E Logist. Transp. Rev. 2018, 109, 261–276. [Google Scholar] [CrossRef]
- Bunker, K.; Doig, S.; Hawley, K.; Morris, J. Renewable Microgrids: Profiles from Islands and Remote Communities across the Globe; Rocky Mountain Institute: Boulder, CO, USA, 2015. [Google Scholar]
- Akram, U.; Khalid, M.; Shafiq, S. An innovative hybrid wind-solar and battery-supercapacitor microgrid system—Development and optimization. IEEE Access 2017, 5, 25897–25912. [Google Scholar] [CrossRef]
- Guo, D.; Zhou, C. Potential performance analysis and future trend prediction of electric vehicle with V2G/V2H/V2B capability. AIMS Energy 2016, 4, 331–346. [Google Scholar] [CrossRef]
- Liu, C.; Chau, K.; Wu, D.; Gao, S. Opportunities and challenges of vehicle-to-home, vehicle-to-vehicle, and vehicle-to-grid technologies. Proc. IEEE 2013, 101, 2409–2427. [Google Scholar] [CrossRef]
- Zeng, L.; Li, C.; Li, Z.; Shahidehpour, M.; Zhou, B.; Zhou, Q. Hierarchical Bipartite Graph Matching Method for Transactive V2V Power Exchange in Distribution Power System. IEEE Trans. Smart Grid 2020, 12, 301–311. [Google Scholar] [CrossRef]
- Mao, T.; Zhang, X.; Zhou, B. Modeling and solving method for supporting ‘vehicle-to-anything’EV charging mode. Appl. Sci. 2018, 8, 1048. [Google Scholar] [CrossRef]
- Su, S.; Li, H.; Gao, D.W. Optimal planning of charging for plug-in electric vehicles focusing on users’ benefits. Energies 2017, 10, 952. [Google Scholar] [CrossRef]
- Muratori, M. Impact of uncoordinated plug-in electric vehicle charging on residential power demand. Nat. Energy 2018, 3, 193–201. [Google Scholar] [CrossRef]
- Mehrjerdi, H.; Hemmati, R. Stochastic model for electric vehicle charging station integrated with wind energy. Sustain. Energy Technol. Assess. 2020, 37, 100577. [Google Scholar] [CrossRef]
- Luo, L.; Gu, W.; Zhou, S.; Huang, H.; Gao, S.; Han, J.; Wu, Z.; Dou, X. Optimal planning of electric vehicle charging stations comprising multi-types of charging facilities. Appl. Energy 2018, 226, 1087–1099. [Google Scholar] [CrossRef]
- Knirsch, F.; Unterweger, A.; Engel, D. Privacy-preserving blockchain-based electric vehicle charging with dynamic tariff decisions. Comput. Sci. Res. Dev. 2018, 33, 71–79. [Google Scholar] [CrossRef]
- Tanaka, K.; Yoza, A.; Ogimi, K.; Yona, A.; Senjyu, T.; Funabashi, T.; Kim, C.H. Optimal operation of DC smart house system by controllable loads based on smart grid topology. Renew. Energy 2012, 39, 132–139. [Google Scholar] [CrossRef]
- Yoza, A.; Uchida, K.; Yona, A.; Senjyu, T. Optimal operation of controllable loads in dc smart house with EV. In Proceedings of the 2012 International Conference on Renewable Energy Research and Applications (Icrera), Nagasaki, Japan, 11–14 November 2012; pp. 1–6. [Google Scholar]
- Howlader, H.O.R.; Matayoshi, H.; Senjyu, T. Distributed generation incorporated with the thermal generation for optimum operation of a smart grid considering forecast error. Energy Convers. Manag. 2015, 96, 303–314. [Google Scholar] [CrossRef]
- Makarov, Y.V.; Etingov, P.V.; Ma, J.; Huang, Z.; Subbarao, K. Incorporating uncertainty of wind power generation forecast into power system operation, dispatch, and unit commitment procedures. IEEE Trans. Sustain. Energy 2011, 2, 433–442. [Google Scholar] [CrossRef]
- Vrettos, E.I.; Papathanassiou, S.A. Operating policy and optimal sizing of a high penetration RES-BESS system for small isolated grids. IEEE Trans. Energy Convers. 2011, 26, 744–756. [Google Scholar] [CrossRef]
- Mabee, W.E.; Mannion, J.; Carpenter, T. Comparing the feed-in tariff incentives for renewable electricity in Ontario and Germany. Energy Policy 2012, 40, 480–489. [Google Scholar] [CrossRef]
- Wand, R.; Leuthold, F. Feed-in tariffs for photovoltaics: Learning by doing in Germany? Appl. Energy 2011, 88, 4387–4399. [Google Scholar] [CrossRef]
- Sanders-Jackson, A.; Parikh, N.M.; Schleicher, N.C.; Fortmann, S.P.; Henriksen, L. Convenience store visits by US adolescents: Rationale for healthier retail environments. Health Place 2015, 34, 63–66. [Google Scholar] [CrossRef]
- Zhang, T.; Chen, X.; Yu, Z.; Zhu, X.; Shi, D. A Monte Carlo simulation approach to evaluate service capacities of EV charging and battery swapping stations. IEEE Trans. Ind. Inform. 2018, 14, 3914–3923. [Google Scholar] [CrossRef]
- Santos, A.; McGuckin, N.; Nakamoto, H.Y.; Gray, D.; Liss, S. Summary of Travel Trends: 2009 National Household Travel Survey; Technical Report; Federal Highway Administration: Washington, DC, USA, 2011. [Google Scholar]
- Daily Power Consumption of Ordinary Households (Google Translate). Available online: http://standard-project.net/energy/statistics/energy-consumption-day (accessed on 1 February 2021).
- Past Power Usage Record (Google Translate). Available online: https://www.okiden.co.jp/denki2/dl/ (accessed on 19 February 2021).
- Panchal, C.; Stegen, S.; Lu, J. Review of static and dynamic wireless electric vehicle charging system. Eng. Sci. Technol. Int. J. 2018, 21, 922–937. [Google Scholar] [CrossRef]
- Howlader, H.O.R.; Sediqi, M.M.; Ibrahimi, A.M.; Senjyu, T. Optimal thermal unit commitment for solving duck curve problem by introducing CSP, PSH and demand response. IEEE Access 2018, 6, 4834–4844. [Google Scholar] [CrossRef]
- Wang, Q.; Chang, P.; Bai, R.; Liu, W.; Dai, J.; Tang, Y. Mitigation Strategy for Duck Curve in High Photovoltaic Penetration Power System Using Concentrating Solar Power Station. Energies 2019, 12, 3521. [Google Scholar] [CrossRef]
- Sheha, M.; Mohammadi, K.; Powell, K. Solving the duck curve in a smart grid environment using a non-cooperative game theory and dynamic pricing profiles. Energy Convers. Manag. 2020, 220, 113102. [Google Scholar] [CrossRef]
- Kulkarni, B.; Patil, D.; Suryavanshi, R.G. IOT based PV assisted EV charging station for confronting duck curve. In Proceedings of the 2018 International Conference on Computational Techniques, Electronics and Mechanical Systems (CTEMS), Belgaum, India, 21–22 December 2018; pp. 36–39. [Google Scholar]


| Item | Battery | Fuel Cell |
|---|---|---|
| Capacity [kWh] | 20 | 20 |
| Number | 15 | 1 |
| Rated Charging Power [kWh] | 10 | 20 |
| Charging Efficiency | 90% | 40% |
| Price [JPY] | 1.2 × | 2 × |
| Lifetime [Year] | 15 | 20 |
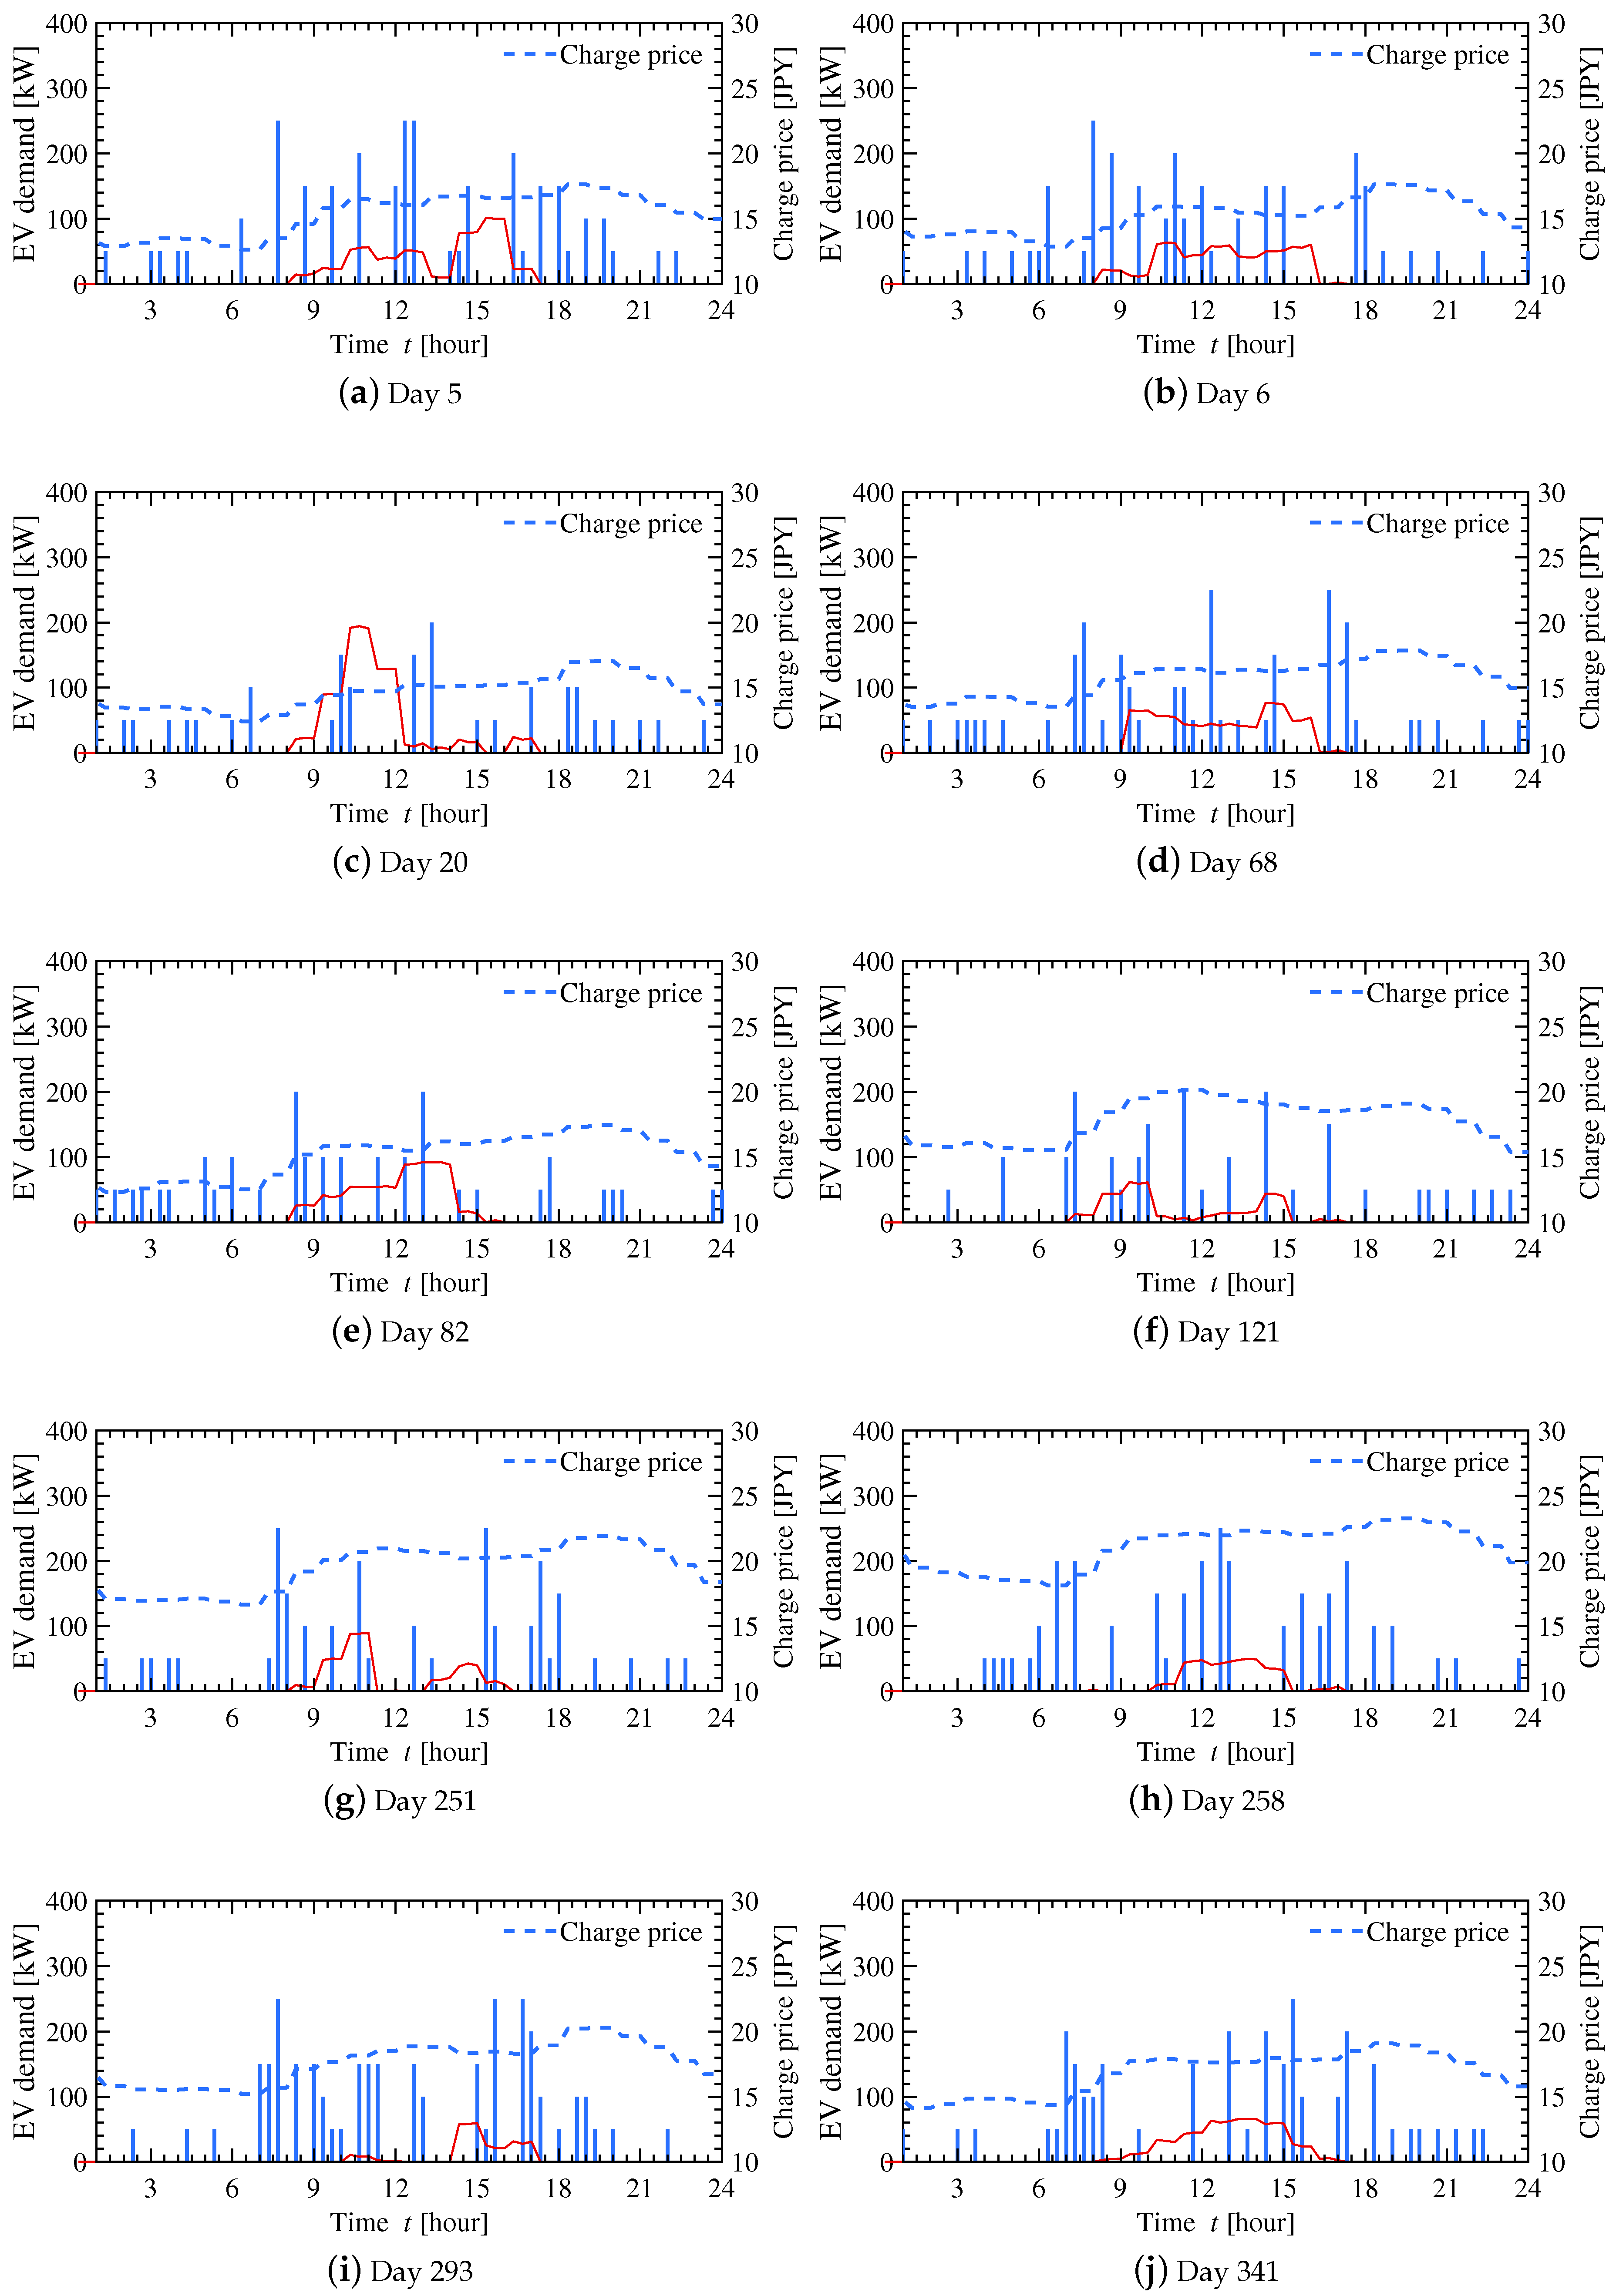
| Days | 5 | 6 | 20 | 68 | 82 | 121 | 251 | 258 | 293 | 341 |
| Profit [JPY] | 9963 | 7392 | 6956 | 8384 | 4990 | 2135 | 6301 | 8686 | 5301 | 8211 |
| Week | Saturday | Sunday | Sunday | Saturday | Saturday | Thursday | Sunday | Sunday | Sunday | Saturday |
| Date | 5 January | 6 January | 20 January | 9 March | 23 March | 1 May | 8 September | 15 September | 20 October | 7 December |
| Weather | Rainy | Rainy | Rainy | Rainy | Rainy | Rainy | Rainy | Rainy | Rainy | Rainy |
Publisher’s Note: MDPI stays neutral with regard to jurisdictional claims in published maps and institutional affiliations. |
© 2021 by the authors. Licensee MDPI, Basel, Switzerland. This article is an open access article distributed under the terms and conditions of the Creative Commons Attribution (CC BY) license (https://creativecommons.org/licenses/by/4.0/).
Share and Cite
Huang, Y.; Yona, A.; Takahashi, H.; Hemeida, A.M.; Mandal, P.; Mikhaylov, A.; Senjyu, T.; Lotfy, M.E. Energy Management System Optimization of Drug Store Electric Vehicles Charging Station Operation. Sustainability 2021, 13, 6163. https://doi.org/10.3390/su13116163
Huang Y, Yona A, Takahashi H, Hemeida AM, Mandal P, Mikhaylov A, Senjyu T, Lotfy ME. Energy Management System Optimization of Drug Store Electric Vehicles Charging Station Operation. Sustainability. 2021; 13(11):6163. https://doi.org/10.3390/su13116163
Chicago/Turabian StyleHuang, Yongyi, Atsushi Yona, Hiroshi Takahashi, Ashraf Mohamed Hemeida, Paras Mandal, Alexey Mikhaylov, Tomonobu Senjyu, and Mohammed Elsayed Lotfy. 2021. "Energy Management System Optimization of Drug Store Electric Vehicles Charging Station Operation" Sustainability 13, no. 11: 6163. https://doi.org/10.3390/su13116163
APA StyleHuang, Y., Yona, A., Takahashi, H., Hemeida, A. M., Mandal, P., Mikhaylov, A., Senjyu, T., & Lotfy, M. E. (2021). Energy Management System Optimization of Drug Store Electric Vehicles Charging Station Operation. Sustainability, 13(11), 6163. https://doi.org/10.3390/su13116163