Article

Effects of High-Speed Railway Construction and Operation on Related Industries in China

1
Key Laboratory of Road and Traffic Engineering of the State Ministry of Education, Shanghai Key Laboratory of Rail Infrastructure Durability and System Safety, College of Transportation Engineering, Tongji University, 4800 Caoan Highway, Shanghai 201804, China
2
Department of Management Science and Engineering, School of Business, Qingdao University, 62 Keda Branch Road, Laoshan District, Qingdao 266000, China
*
Authors to whom correspondence should be addressed.
Sustainability 2021, 13(11), 6119; https://doi.org/10.3390/su13116119
Submission received: 26 April 2021 / Revised: 25 May 2021 / Accepted: 26 May 2021 / Published: 28 May 2021

Abstract

:
Incorporated as a highly integrated system of science and technology that has been assimilated in the field of transportation, high-speed railways not only meet the green travel needs of people but also promote the development of correlated industries. Considering the differences in each stage, primarily based on the input-output table for 149 sectors from the Chinese economy taken from the year 2017, an input-output model has been developed and applied in order to measure the economic pull of high-speed railway construction investment for various industries. Moreover, the shift-share spatial structure model has also been taken into account to quantitatively analyze the effect of the high-speed railway operation on related industries, and the three high-speed railway hub cities of Zhengzhou, Xi’an, and Wuhan in China have been taken as the specimens for the application of this model. The results show that the construction and operation of a high-speed railway has an optimization effect on the development of related industries, which provides a basis for industrial layout and structural optimization. This research provides a reference for the formulation of high-speed rail industry policy, is of great significance for the maintenance of sustainable economic development, and thus, promotes the sustainable development of transportation systems, cities and society as a whole.

1. Introduction

High-speed railways are an environmentally friendly, and sustainable mode of transportation. As one of the most advanced passenger transportation technologies in the world, they are an important lever used to promote the transformation of China’s development mode, and subsequently, the development of the industrial economy. The planning, construction, and formal operation of high-speed railways can all affect the circulation of elements and resource allocation, industrial structure and spatial layout, development scales and market competitiveness, industrialization, and the urbanization processes in the areas along the railway lines [1,2]. While meeting the travel needs of its passengers, the high-speed railway has the capability to save energy, and promote the sustainable development of transportation systems, cities and society as a whole.
The social utility of a high-speed railway, especially during the construction phase and operation process, plays an important role in the development of the regional industrial economy [3]. This includes strong service utility, strong accessibility utility, low-cost transportation utility, external spillover utility, high-speed railway network utility, and so on. Eventually, as a result, these social spillover effects have a considerable impact on the industries that are related to a high-speed railway [4].
The examination of the impact of a high-speed railway on the upstream industrial chain shows that China’s high-speed railway investment is significant, and the industrial chain is long. This can potentially increase the effective demand for steel, cement and other building materials, and plays an important role in expanding employment opportunities, increasing the income of low- and middle-income earners, and promoting the growth of consumption [5]. According to statistics from the Economic Planning Department [6], for every 100 million yuan of investment in the high-speed railway, an average of 33,300 tons of steel, 20,000 tons of cement, 31,100 tons of sand, 51,600 cubic meters of stone, and 88.5 million yuan of equipment are consumed, and 228,600 man-hours are spent in terms of the required labor for this initiative. The demand for investment, caused by the construction of a high-speed railway, can directly promote the consumption of construction materials, such as steel and cement, and also increase the benefits extracted from local construction, metal products, electrical machinery and equipment manufacturing, and high-end manufacturing that is capital-intensive in nature.
The analysis of the impact of a high-speed railway on the downstream industrial chain shows that the operation of a high-speed railway has a transport effect. This primarily improves the accessibility of transportation between regions, accelerates the rapid flow of production factors, such as information and technology, and drives the development of tertiary industries such as real estate, catering, leasing and business services, transportation and logistics, along the railway line [7]. At the same time, China’s self-developed high-speed railway technology can also promote innovation and a revolution in the technical field. Therefore, the high-speed railway is capable of leaving an impact on both the upstream and downstream enterprises, and also promotes the improvement of the corporate efficiency.
The rapid construction and operation of high-speed railways not only directly consumes the production capacity of related industries, but also strengthens the economic exchanges and industrial connections that have the potential to flourish between various regions. One can claim that it is considered to be an industrial breakthrough in the contemporary economic context, and an important opportunity for the implementation of the “Belt and Road” national strategy [8]. The analysis of the impact of a high-speed railway can provide a reference for the adjustment of industrial structure and the formulation of industrial policies, promoting the sustainable development of transportation and the economy. Therefore, studying the impact of the high-speed railway on industry has important theoretical and practical significance.
Many intellectuals have studied the impact mechanism of a high-speed railway on related industries. However, most of them ignore the difference of the impact in different stages of high-speed railway, and tend to concentrate on the theoretical system and the internal formation mechanism [9], including the factor analysis, industrial relevance, and impact effects. This paper uses the input-output method, and the shift-share space structure model, in order to calculate the impact of the related industries from two main aspects: high-speed railway construction and the opening operation. Additionally, this paper also provides quantitative support for the development of industries along the high-speed railway line.
The rest of this paper is organized as follows. The next section looks into the extant literature that is based on this discipline of study. The research is based on the industry association theory, and the input-output method is used to analyze the impact mechanism of high-speed railway construction on the related industries. Based on the theory of industrial ripple effects, we have taken into account the areas pertaining to Zhengzhou, Xi’an and Wuhan as the research objects, and used the shift-share spatial structure model, in order to empirically analyze the impact mechanism of high-speed railway operations on the related industries.

2. Literature Review

As a colossal industrial chain dominated by innovation-driven technology, a high-speed railway is bound to bring considerable industrial forward and backward linkage effects. This happens to be of great significance when considering the acceleration of China’s industrial structure adjustment and promoting industrial structure optimization and upgrading. Academics have mostly focused on high-speed railways for tourism, manufacturing, productive services and other industries. They have found that high-speed railways can, in fact, also promote knowledge creation and business exchanges, encourage the knowledge economy, help develop productive services, and aid in the transformation of the industrial structure [10]. The available research on the impact of high-speed railways on industrial development mainly focuses on the theoretical overviews, or specific case-by-case analysis.
From the aspect of theoretical foundations, the extant research focuses on the theoretical systems and the internal formation mechanisms, including the factor analysis [11], industrial relevance [12], and impact effects [13]. Researchers believe that the operation of a high-speed railway promotes the convergence of cities and industries [14], produces co-city effects [15], integration effects [16], and agglomeration effects [17], which further leave an important impact on the industrial structure and sustainable economic and social development of the regions along the line. However, most of the researches are qualitative researches, and concentrated on the aspects of the industrial structure [18,19], regional accessibility [20,21], factor flow [22,23] and regional spatial structure that might be impacted and altered due to this initiative [24,25]. It has led to a dearth in the systematic analysis of the effective mechanisms and logical pathways, which pave the way for the high-speed railway’s impact on related industries and, therefore, the analysis is relatively one-sided.
From the aspect of empirical studies, the extant research has mostly been carried out from the perspective of the impact coefficient, using the empirical analysis, using the with and without method [26,27], the multi-factor comprehensive evaluation method [28], geographic information system (GIS) analysis method [29,30], elastic analysis method [31], gray measurement model [32,33], regression analysis model [34], differences-in-differences method [35,36] and the panel structural equation model [37]. By measuring the data available, in order to verify the impact of high-speed railway on related industries, it is evident through the results that high-speed railway has a critical influence and impact on the industrial structure of the regions that lie along the line. The construction of high-speed railway has altered, and modified the regional industrial structure, made the industrial structure more reasonable, transformed and upgraded as well. This, most definitely, has important implications for the national industrial layout. However, prior studies lack acknowledgement of the two aspects of construction and operation, and also fail to highlight the differences between the construction and operation stages of high-speed railway. Moreover, the extant literature is also unsuccessful in reflecting the impact of the benefits brought by the construction and operation of high-speed railways.
Therefore, this paper combines the changes that take place in the related industries, as well as the impact of the benefits of the development of high-speed railways. Moreover, it also stipulates and categorizes the impact of the development of high-speed railway related industries, from the consideration of the two main variables that are taken into account, i.e., the high-speed railway construction and operation, which helps us to understand the development status of high-speed rail and its role in the city, economy and society, and provides guidance for the government and high-speed railway related enterprises to make decisions and formulate development strategies.

3. Effects of High-Speed Railway Construction Investment on Related Industries

3.1. Industry Association Theory

Industrial relevance theory [38], in actuality, describes the quantitative relationship of the input and output between industries. In this regard, it also reflects the intermediate input and demand of each industry, and intuitively quantifies the characteristics of the input and output between industries. Its essence lies in the technical and economic connections that are established between the final industry and the intermediate industry it decides to invest in. The industrial relevance analysis and input-output analysis method was initially coined in by the American economist, Wassily Leontief. He not only combined together the classical economic theory, Marx’s reproduction theory and Walras’ equilibrium theory, but also regarded production, circulation and consumption as a whole, and ultimately described the economic activities that take place in various industrial sectors. With the continuous development and modification of this theory, countries around the world have also used the basic principles of the input-output method in order to study issues such as energy [39], finance [40], population [41], education [42], and the environment [43]. This can describe the internal relationship between the various departments of the national economy, which not only reflect the strength of the industrial agglomeration effect, but also reflect the specific benefits. Therefore, it is convenient to study the relationship between different departments of a complex economic entity quantitatively and systematically. It is noteworthy that this theory provides an effective method of analysis for the development and establishment of the high-speed railway industry.

3.2. Input-Output Model

The input-output model is divided into two categories [44]. These categories entail a physical input-output model, and a value input-output model. The comparison between the two is shown in Table 1.
Through the comparative analysis of the physical input-output model, and the value input-output model, as seen in Table 1, it can be observed that the value input-output model has a wider scope of application. Therefore, the value input-output model has been selected in order to study the pulling effect of high-speed railway in terms of the derivative industries. Additionally, the value input-output model is shown in Table 2.
From the perspective of the input-output table, the balance between the output of intermediate products, the output of total products, and the output of the final products in each production department, can be expressed as follows:
{ x 11 + x 12 + + x 1 n + y 1 = x 1 x 21 + x 22 + + x 2 n + y 2 = x 2 x n 1 + x n 2 + + x n n + y n = x n
The system of equations can be simplified to Equation (2), which is shown as:
j = 1 n x i j + y i = x i ( i = 1 , 2 , , n )
From the column orientation of the table, the input-output table describes the balance between the input volume of intermediate products, the newly created value, and the total input of each industry. Thus, the newly created value can be expressed as follows:
{ x 11 + x 21 + + x n 1 + z 1 = x 1 x 12 + x 22 + + x n 2 + z 2 = x 2 x 1 n + x 2 n + + x n n + z n = x n
where, z j = v j + m j + r j ( j = 1 , 2 , n ) , which represents the newly created value.
Therefore, the system of equations can be simplified to Equation (4):
i = 1 n x i j + z j = x j ( j = 1 , 2 , , n )
The total input in the final row, and the total output in the final column are quantitatively balanced, which can be expressed as follows:
i = 1 n x i = j = 1 n x j ( i = 1 , 2 n ; j = 1 , 2 n )
The final product, and newly created value are also balanced in terms of the quantity, which can be expressed as follows:
j = 1 n z j = i = 1 n y i ( i = 1 , 2 n ; j = 1 , 2 n )
According to the principles of the input-output analysis model, in order to calculate the newly created value of the high-speed railway, in the context of the related industries, it is necessary to obtain specific index values according to the calculation formulas of the row model and the column model:
1. The relationship between the total product and the final product in the line model.
The direct consumption coefficient often appears as an input coefficient or an intermediate input coefficient. In this regard, if a i j represents the direct consumption coefficient, then a i j essentially refers to the number of i products consumed, per product unit j product, of the j industry.
a i j = x i j x j ( i , j = 1 , 2 , n )
Moving further, In Equation (7), x i j refers to the number of i products, consumed by j industry, where x j refers to j industry’s total intermediate input.
Moreover, a i j reflects the strength of the connection between the two industries i and j . In interpretation of the equation, the larger the value, the closer the connection between the two industries. Incorporating the direct consumption coefficient formula into Formula (2), the relationship between the total product and the final product is shown in Equation (8).
j = 1 n a i j x j + y i = x i ( i = 1 , 2 , , n )
In Equation (8), x i refers to the total product, and y i refers to the final product. The deformation of Formula (8) can be obtained as: (I is the identity matrix).
A · X 1 + Y = X 1
which can be expressed as follows:
X 1 = ( I A ) 1 · Y
where, X 1 = [ x 1 , x 2 , x n ] T ,which is the total product matrix; Y = [ y 1 , y 2 , y n ] T , which is the final product matrix; and A = [ a 11 a 1 n a n 1 a n n ] , which is the direct consumption coefficient matrix.
2. The relationship between the incremental output value created by each industry sector, and the total input in the column model.
Substituting the direct consumption coefficient formula into Formula (4), the product distribution equation relationship between the total incremental input and output value, created by each industrial sector, is shown in Equation (10):
i = 1 n a i j x j + z j = x j ( j = 1 , 2 , , n )
In this regard, the above Equation (10) can be transformed into Equation (11):
( I C ) · X 2 = Z
which can further be expressed as follows:
X 2 = ( I C ) 1 · Z
where, X 2 = [ x 1 , x 2 , x n ] T which is the total input matrix; Z = [ z 1 , z 2 , z n ] T ,which is the value increment matrix created by various industrial sectors; and C = { i = 1 n a i 1 0 0 0 i = 1 n a i 2 0 0 0 i = 1 n a 1 n } , which is the consumption coefficient matrix of each substance.
According to the principles of the input-output balance, the total output and total input are numerically equal:
X 1 = X 2
Therefore, the above formulas are combined into Equation (14):
( I C ) 1 · Z = ( I A ) 1 · Y
which can also be expressed as follows:
Z = ( I C ) · ( I A ) 1 · Y
Thus, we can observe that in order to calculate the incremental increase in the output value that is created by the investment driven demand of a high-speed railway, in various industrial sectors, we only need to take into account the final products produced by various sectors of the national economic system, and the consumption coefficient matrix (the formula derivation above refers to References [38,44]).

3.3. Quantitative Analysis

The input-output table is compiled once every five years. Moreover, the input-output coefficient related data referred to in this study has been extracted from China’s input-output table, based on 149 departments, specifically pertaining to the year 2017. In this table, the railway passenger transportation industry, railway freight transportation and transportation auxiliary activities industry, and railway transportation equipment manufacturing industry, are categorized as independent industries. Moreover, the high-speed railway investment data comes from China’s Railway Yearbook 2018.

3.3.1. Connections and Linkages between High-Speed Railway and Related Industries

Table 3 shows the top 15 industries in the input-output table that are related to the complete consumption coefficient of high-speed railway-related industries. that is to say, the most important supply sectors related to the high-speed railway, ordered in terms of their critical factor, include: monetary finance and other financial services, electricity, heat production and supply, electronic components et al., and the three least important supply sectors in the table are road goods transportation and auxiliary transportation activities, real estate and, finally, coal mining and washing products. From the perspective of the complete consumption coefficient, the high-speed railway industry carries the largest sum of direct and indirect consumption in the following 15 sectors, and is the most closely related to them. That is to say, the increase in high-speed railway investment has a significant amount of direct and indirect consumption in the related industries that are mentioned in Table 3, and thus, this puts this initiative in a sturdy leading role as well.

3.3.2. High-Speed Railway’s Contribution to the Total Output of Various Industries

According to the complete consumption coefficient presented in the input-output table, the simple output multiplier value of the high-speed railway initiative is 4.39. The complete consumption coefficient table shows that, for every unit of investment provided by high-speed railway, it can generate a total demand of 4.39 units, for each related industry. In 2017, the total investment scale of China’s railway’s fixed assets was 823.08 billion Yuan. After the year 2012, the growth rate of high-speed railway investment has stabilized, and has also been connected to the inland sector. According to the China Railway Corporation’s “Completion of National Railway Major Indicators” statistics, after the year 2011 most of China’s investment pertaining to railway capital construction was dedicated to high-speed railway construction. Therefore, the total investment of China’s railway’s fixed assets, in the year 2017, can be deliberated as exclusively high-speed railway investment. According to formula 15, the pulling effect of high-speed railway investment on the output of various industries can thus be calculated accordingly.
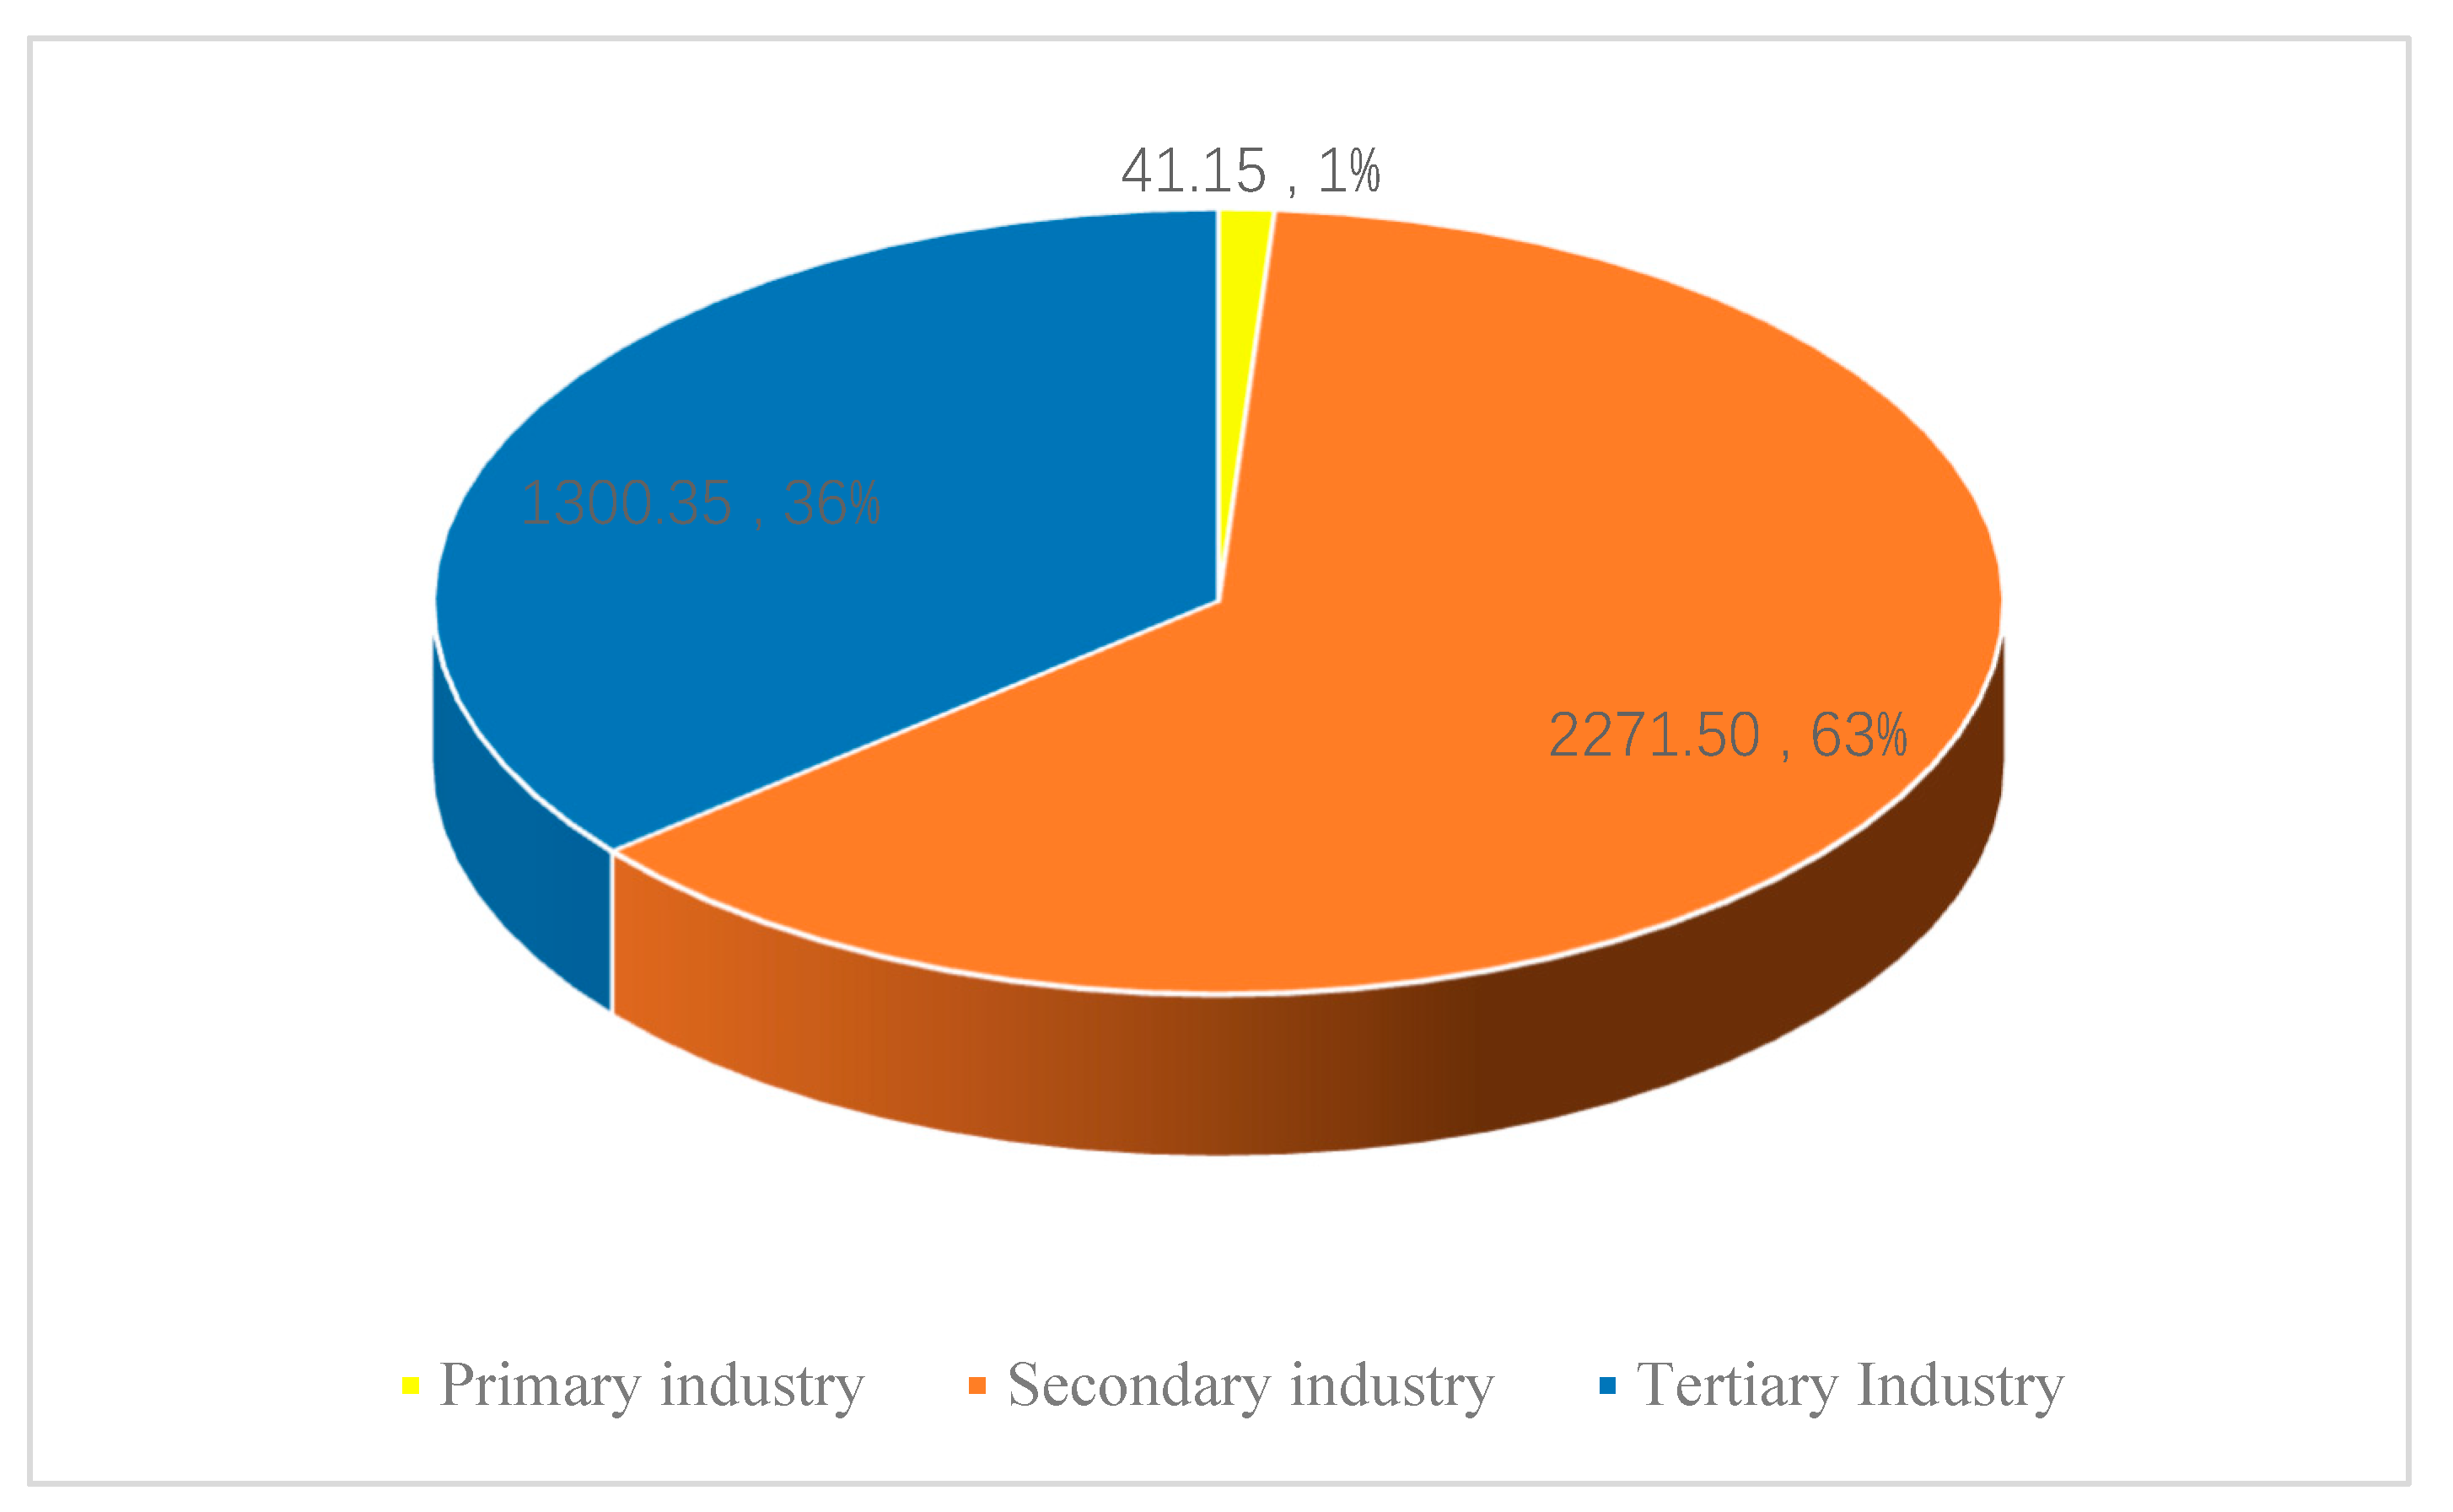
In 2017, the investment that went into high-speed railway was 823.08 billion Yuan, and the total output change of the 149 industries that have been taken into account was 3613 billion Yuan. Among these industries, the top 15 with the largest increase in total output altogether produced 1950.53 billion-Yuan. This accounted for 54% of the total output of the entire industry. It can be concluded that the input of high-speed railway has had a colossal impact on the total output of secondary industry. As shown in Figure 1, the total output changes of secondary industry totaled 2271.5 billion-Yuan, accounting for 63% of the total output changes. Also, the total output of the tertiary industry was stipulated to be 1300.35 billion-Yuan, accounting for 36% of the total output change. Thus we can observe that this particular sector has had little effect on primary industry.
It can be grasped that the investment in the construction of high-speed railways has a significant and complete economic pulling effect on the surrounding industries, such as non-metallic mining and dressing, non-metallic mineral products, metal mining and dressing, and metal smelting and rolling processing industries. Industries, transportation equipment manufacturing, general purpose equipment manufacturing, and other industries also have a greater direct economic pull effect.
High-speed railway construction investment has led to a boost in the economic scale of industries, such as railway construction, railway transportation equipment manufacturing, and communication signal manufacturing. It has also promoted and upgraded the industrial technology innovation processes. The spillover effects of China’s high-speed railway technology economy are thus showing their impact in a positive manner.

4. Impacts of High-Speed Railway Operation on Related Industries

4.1. Industry Spread Effect Theory

The theory of the industrial ripple effect revolves around the idea that describes the effect of the changes in one industry, on the strength of other industries, which is primarily reflected in two distinct aspects. On the one hand, it reflects the impact on the regional economic system, caused by changes in the final demand of the products and services offered by other industries. While on the other hand, it shows the impact on the regional economic system, caused by the changes in the value addition in the other industries. The shift-share analysis method was first proposed by an American economist, Creamer, which is an effective method to study the industrial spread effect and analyze the change of industry structure. It was summarized and improved by Dunn [45], and other scholars, and gradually took the form that is widely used now. In recent years, it has been widely applied in the field of regional economics and urban economics [46,47]. At the same time, its analytical model has been constantly improved and expanded [48,49]. Compared with other methods, it has become more comprehensive and dynamic.

4.2. Shift-Share Model

4.2.1. Traditional Shift-Share Model

The shift-share model [50] decomposes the growth of an industry, in a specific region, into three components. These include the share component W i j , industrial structure component S i j , and the competitiveness component C i j . Among them, the share component W i j refers to the incremental effect that is generated by the development of the average growth rate of various industries in the country. The industrial structure component S i j refers to the incremental effect produced by the difference between the average growth rate of the j industry in the i region, and the average growth rate of all the industries in the country. This reflects the growth rate of the j industry, as compared to the national average growth rate. Moreover, the component of competitiveness C i j refers to the increase in the difference between the growth rate of the j industry in the i region, and the average growth rate of the national j industry, reflecting the average growth level of the industry in the region, as compared to the national industry. It is widely applied to evaluate the regional economic structure and the self-competitiveness, thereby promoting the adjustment of industrial structure.
The share component W i j , the industrial structure component S i j , and the competitiveness component C i j can be expressed as Equation (16):
W i j = X i j 0 · l S i j = X i j 0 · ( l j l ) C i j = X i j 0 · ( l i j l j )
where X i j 0 ( i = 1 , 2 , , m ; j = 1 , 2 n ) is the initial economic volume of j industry in i region; l is the standard growth rate; l j is the growth rate of the structural effect of j industry and l i j is the real growth rate of j industry in i region.
Moving further, the economic increment z i j in period t is translated into Equation (17):
z i j = W i j + S i j + C i j
where X i j t is the economic volume of j industry in i region, at the end of period t .
Among them:
l = i = 1 m j = 1 n ( X i j t X i j 0 ) / i = 1 m j = 1 n X i j 0 l j = i = 1 m ( X i j t X i j 0 ) / i = 1 m X i j 0 l i j = ( X i j t X i j 0 ) / X i j 0
Therefore,
z i j = X i j t X i j 0 = X i j 0 · l + X i j 0 l j l + X i j 0 l i j l j

4.2.2. Improved Shift-Share Model

The shift-share spatial structure model is a modified version of the traditional shift-share model, but after introducing the spatial weight matrix, and taking into account the factors of spatial growth. This modified model can make full use of the data information, in order to analyze the dynamic structural changes pertaining to the industrial sector’s impact, on the regional economic development. The spatial weight matrix N reflects the strength of interconnectedness between the regions. Moreover, the strength of the interconnectedness between region i and k is represented by the element n i k . In this regard, the larger the value, the stronger the connection between the regions.
N = [ 0 n 12 n 1 k n 21 0 n 2 k 0 n k 1 n k 2 0 ]
Among them,
n i k = 1 | X i X k | 1 / | X i X k | , ( i k )
where X i ,     X k are the economic variables such as gross domestic product (GDP) per capita, and the ratio of industrial employees.
We can observe that the increase in the passenger traffic which is a result of the operation of a high-speed railway will continue to strengthen the interconnection between different regions f and k . Also, the economic activities of passengers in different regions will also increase the output value of the tertiary industries in different regions. Therefore, the output value of the tertiary industry, produced by the introduction of the variable unit passenger volume, reflects the strength of inter-regional interconnection, which is represented by n i k . The greater the output value of the tertiary industry per unit passenger volume, the stronger the inter-regional interconnection is, and vice versa. Therefore, the growth rate of industrial structure can be expressed as Equation (22):
L j = k v n i k · X j k t k v n i k · X j k k v n i k · X j k
where L j is the growth rate of the industrial structure of industry j ; n i k is the output value of the tertiary industry produced per unit of passenger traffic; X j k denotes economic variables of j industry in k region; and X j k t represents the economic variable of the j industry in the k region during period t .
Thus, the industrial structure component, and component of competitiveness can be reformed to Equation (23):
S i j t = X i j L j l C i j t = X i j ( l i j L j )
By analyzing the formulas of the share component and competitiveness component, and taking the opening year of the high-speed railway as the node, the economic increment in period t after the introduction of the high-speed railway is calculated. This calculation demonstrates the benefits of initiating the high-speed railway on the diffusion effect of the j industry in i region, during the period t .
Z i j t = W i j + S i j t + C i j t

4.2.3. Model Assumption

1. Due to the characteristics of speed, comfort and safety, a high-speed railway greatly saves on the travel time of passengers and provides a high-quality service, which induces large passenger flow, improves the travel willingness of passengers and, finally, promotes the development of the tourism industry. The high accessibility of high-speed railway can reduce the travel time and promote the development of transportation, warehousing and post industry. By compressing the space distance between cities, the development of the real estate industry in the area where stations located is promoted. Therefore, in this case, the research object in this study is the real estate industry, tourism industry, transportation, warehousing and post industry within the tertiary industries, which are closely connected to high-speed railway operation. The three high-speed railway hub cities, Zhengzhou, Xi’an and Wuhan, have been taken into consideration, in the context of the operation of a high-speed railway, for research purposes.
2. Moreover, another assumption is that this model explains the rationale of the calculation of the spatial weight matrix, using the tertiary industry output value that has been generated per unit of passenger traffic as the primary base. Considering that the tertiary industry output value, created by Zhengzhou, Xi’an and Wuhan, is related to the urban passenger volume and city size, the high-speed railway’s operation is a major factor to be considered when taking into account the impact on the tertiary industry, however, it is not the only one. Therefore, under the influence of other external factors, the successful operation of a high-speed railway is considered one of the factors which leads to growth in the industries that fall along the routes where the railway lines pass through. Thus, the output value is used as a base to reflect changes in the transportation, storage, real estate, tourism industries in tertiary industry. Furthermore, the industrial structure is analyzed by comparing the time period before and after the operation of the high-speed railway, and the calculation formula is included in the weight matrix.
3. The changes of the weight matrix elements, during their respective research periods, are ignored.

4.2.4. Calculation of Spatial Weight Matrix

According to the statistical yearbooks of the provinces, the output value of the tertiary industry, created by the per capita change in the volume of passenger traffic in major cities along the high-speed railway, is calculated as shown in Table 4.
By plugging in the data in Table 4 into formula 21, we are able to calculate the weight matrix in 2009 (before high-speed railway was initiated), and 2017 (after high-speed railway was initiated), as shown in Table 5 and Table 6.
By making a comparison of the changes in the spatial weight matrix of the main hub cities which host the high-speed railway, before and after its operation, the changes are expressed in the form of Table 7, where the rows represent the cities and the columns represent the impact on the tertiary industry’s spread. The “+” symbol means that the spread of the tertiary industry along the different cities has been enhanced, whereas, the symbol “-” means that the spread of the tertiary industry along the different cities has been weakened, and “0” means that the tertiary industry has had no influence among the cities that have been taken into consideration.
It can be seen from Table 7 that Zhengzhou’s volatility effect on Xi’an has weakened, whereas, its volatility effect on Wuhan has gained strength. This shows that after the operation of the high-speed railway, the strength of Zhengzhou’s tertiary industry’s economic ties with Xi’an has weakened, whereas the same has strengthened in the case of Wuhan. Similarly, the growth in Xi’an’s tertiary industry has strengthened its economic ties with Wuhan, and weakened its economic ties with Zhengzhou. Moreover, the strength of Wuhan’s tertiary industry’s economic ties with Zhengzhou and Xi’an has been strengthened. It is noteworthy that Wuhan’s geographical position is in the central region of my country, and its high-speed railway network is relatively well developed. Therefore, the high-speed railway in Wuhan tends to have the greatest impact on Wuhan’s tertiary industry.

4.3. Case Study

The added value of real estate, tourism, transportation, warehousing and postal industries in the main hub cities of the high-speed railway are shown in Table 8. Also, the shift-share spatial structure model is used for running the relevant calculations. First, the standard growth rate, the structural effect growth rate of the j industry, and the actual growth rate of the j industry in the i region have been calculated.
Through the calculation, we can concur that:
  • Standard growth rate: l = 139.48%.
  • The growth rate of the industrial structure is shown in Table 9.
The actual growth rate is shown in Table 10.
For the purpose of this study, we have used the formula to calculate the share component W i j , the industrial structure component S i j , and the competitiveness component C i j , after the high-speed railway was made operational in 2010–2017, as shown in Table 11.
1. Spatial deviation—conclusive analysis of each component in the improved shift-share model.
Among the three hub cities, Wuhan’s transportation, warehousing, postal industry, tourism, and real estate have the largest share of weightage as shown in Table 12. This indicates that these industries have the largest growth in Wuhan. Wuhan’s competitiveness in transportation, warehousing, post services, and tourism has been negative, indicating that external factors such as the introduction and operation of Wuhan’s high-speed railway have little dependence on transportation, warehousing, and tourism, and are also less competitive in nature. The competitiveness component of the real estate industry in Xi’an and Wuhan is observed to be negative, indicating that the external factors such as the introduction and operation of the high-speed railway have had the weakest impact on the competitiveness of the real estate industry in Xi’an and Wuhan.
2. Horizontal comparative analysis of the same industry in different regions.
It can be observed from Table 5, Table 6, Table 7, Table 8, Table 9, Table 10 and Table 11 that the degree of contribution of the real estate industry exceeds 50% in both Zhengzhou and Wuhan regions. This indicates that the high-speed railway will have a significant impact on Wuhan and Zhengzhou after its successful operation. When considering the transportation, warehousing and postal industries, Xi’an’s transportation, warehousing and post industries are observed to be the most significantly affected by the successful operation of high-speed railway. In the three cities, high-speed railway operation tends to have a significant effect on the tourism industry. The operation of the high-speed railway has a transportation effect, which leads to the increase of industry benefits.
3. Longitudinal comparative analysis of different industries in the same region.
In the three hub cities that have been taken into account, the growth and changes in the contribution of the transportation warehousing and postal industries, real estate industry, and tourism industry’s diffusion effect in the actual industry have increased, as shown in Figure 2.
It can be seen from Figure 2 that the efficiency contribution rate of the diffusion effect of the tourism industry is significantly higher than that of the other two industries, which shows that the operation of the high-speed railway has the strongest pull effect on the tourism industry, and the least pull effect on the transportation, warehousing and postal industries. Therefore, Zhengzhou, Xi’an and Wuhan should give full play to the advantages of high-speed rail operation, select and develop industries with advantages so as to improve regional economic benefits, which can drive the adjustment and optimization of their industrial structure, and promote sustainable economic development.

5. Conclusions

Considering the differences of effects in each stage, this paper analyzes the effects of high-speed railways on related industries from two aspects. Firstly, it uses the industrial correlation theory that is commonly applied in industrial economics. This theory is based on the input-output analysis method and, specifically, the input-output tables pertaining to 149 departments of the Chinese economy, in the year 2017. The purpose of this consideration was to quantitatively evaluate the impact of high-speed railway construction on the related industries. The results show that a high-speed railway is capable of directly promoting the development of related industries. The spillover effect of China’s high-speed railway technology is positive in nature, and hence the economy is emerging and surging forward. Then, making use of the theory of industrial spreading in the industrial economy, the three cities that have mainly experienced development due to the establishment of high-speed railway include Zhengzhou, Xi’an, and Wuhan. These have been used as the research objects for the purpose of this study. Moreover, this study also uses the shift-share spatial structure model in order to calculate and analyze the added value of the real estate industry, tourism industry, transportation, warehousing and postal industries. Furthermore, this research analyzes the impact of benefits according to the horizontal comparison of the same industries in different regions, and the vertical comparison of different industries in the same region. It also analyzes the economic significance of each component in the shift-share model, which provides for the structural optimization of tertiary industry with reasonable suggestions, promoting sustainable economic development.
As a green transport mode, high-speed railways not only contribute to the establishment of resource-saving transport system in China, but also play an important role in regional economic development. In the future domestic high-speed railway construction and operation, more attention should be paid to scientific demonstration and reasonable planning. It is also important to concentrate on the reform of the division of government and enterprises, and achieve the balance of economic and social benefits. According to the different impacts brought by a high-speed railway, each region can formulate the correct development direction and focus on the development of advantageous industries, which can drive the adjustment and optimization of industrial structure, and promote sustainable economic development.
In the construction and operation of high-speed railways, in addition to positive effects on related industries, there have also been some negative effects. For example, changes in accessibility have tended to cause some industries to experience a decline. However, this article does not aim to analyze the negative effects of high-speed railways. In future research, this aspect pertaining to the negative spillover effects can be included, in order to provide a more comprehensive basis for the impact of high-speed railways on the related industries. At the same time, this paper selects the representative industries for analysis. In future research, the primary industry, secondary industry, and tertiary industry can be used as a complete system so as to study the impact of high-speed railways on related industries.

Author Contributions

Conceptualization, X.Z.; Data curation, X.L.; Formal analysis, X.L.; Funding acquisition, X.Z.; Investigation, X.Z.; Methodology, X.L.; Project administration, X.Z.; Resources, X.Z.; Software, X.L. and J.L.; Supervision, X.J.; Validation, X.J.; Writing—original draft, X.Z. and X.L.; Writing—review and editing, X.J. and J.L. All authors have read and agreed to the published version of the manuscript.

Funding

This research was funded by Natural Science Foundation of China (No.61873190).

Institutional Review Board Statement

Not applicable.

Informed Consent Statement

Not applicable.

Data Availability Statement

The data presented in this study are available on request from the corresponding author.

Acknowledgments

This research of the first author Xuemei Zhou was supported by the Natural Science Foundation of China (No. 61873190), National Railway Administration of the People’s Republic of China, grant number KF2019-007-B and KF2019-002-B, and the third author Xiangfeng Ji was supported by the Natural Science Foundation of China (No. 71801138) and the project was funded by China Postdoctoral Science Foundation (2018M630744).

Conflicts of Interest

The authors declare no conflict of interest. The funders had no role in the design of the study; in the collection, analyses, or interpretation of data; in the writing of the manuscript; or in the decision to publish the results.

References

  1. Vickerman, R. High-speed rail and regional development: The case of intermediate stations. J. Transp. Geogr. 2015, 42. [Google Scholar] [CrossRef]
  2. Naranjo Gomez, M.J. Impacts on the social cohesion of mainland Spain’s future motorway and high-speed rail network. Sustainability 2016, 8, 624. [Google Scholar] [CrossRef] [Green Version]
  3. Wei, W.G. Analysis of the Social Effects of High-Speed Railways on the Regions along the Line. Master’s Thesis, Southwest Jiaotong University, Chengdu, China, 2014. [Google Scholar] [CrossRef]
  4. Zhang, X.J. Analysis of the Impact of High-Speed Rail on the Agglomeration and Diffusion of Industries along the Line. Master’s Thesis, Southwest Jiaotong University, Chengdu, China, 2016. [Google Scholar]
  5. Feng, B.; Zheng, L.L.; Zhou, Y.R. Analysis of the impact of high-speed railway on the development of regional industry—Taking Hubei as an example. Hubei Soc. Sci. 2014, 5, 62–66. [Google Scholar] [CrossRef]
  6. Zhao, G.Q. Quantitative analysis of the impact of high-speed rail investment on national economic development. Guangxi Soc. Sci. 2013, 5, 70–74. [Google Scholar] [CrossRef]
  7. Zhou, X.F.; Qiao, X.L. Research on the impact of the opening of high-speed rail on the economy: A review and prospects. Finance Account. Mon. 2020, 7, 154–160. [Google Scholar] [CrossRef]
  8. Luan, S.Z. Opportunities and challenges of the “Go globally” strategy of Chinese high-speed rail industry under the background of the Belt and Road initiative. J. Zhengzhou Inst. Aeronaut. Ind. Manag. 2017, 35, 31–38. [Google Scholar] [CrossRef]
  9. Xiong, J.; Zhang, W.W. A review on the study of the influence between labor mobility and industrial agglomeration and diffusion. J. Jiangsu Vocat. Tech. Coll. Econ. Trade 2012, 4, 1–4. [Google Scholar] [CrossRef]
  10. Chen, C.L.; Hall, P. The impacts of high-speed trains on British economic geography: A study of the UK’s InterCity 125/225 and its effects. J. Transp. Geogr. 2011, 19, 689–704. [Google Scholar] [CrossRef]
  11. Zhang, L.; He, K.; Zhu, L.L. Analysis of the factors and mechanism of high-speed railway influencing regional economic development. Railw. Transp. Econ. 2012, 34, 6469. [Google Scholar] [CrossRef]
  12. Xue, F.; Yu, X. High-speed railway industry association analysis based on entropy-grey theory: Taking Sichuan province as an example. Integr. Transp. 2018, 40, 1–6. [Google Scholar]
  13. Fang, H.; Zhou, T. Advancing development of the west triangle economic circle by the passenger-dedicated line. J. Lanzhou Jiaotong Univ. 2010, 29, 77–79. [Google Scholar] [CrossRef]
  14. Wang, L.X. The influence of high-speed railway construction in northern Jiangsu on Jiangsu regional economy. Manag. Technol. SME 2021, 4, 44–45. [Google Scholar]
  15. Wang, S.H. The development of China’s high-speed railway and its economic influence. J. Southwest Jiaotong Univ. Soc. Sci. 2010, 11, 65–69. [Google Scholar] [CrossRef]
  16. Zhang, X.L.; Nie, Q.K. High-speed rail construction and the regional economic integration in China. Mod. Urban Res. 2010, 25, 7–10. [Google Scholar] [CrossRef]
  17. Willigers, J.; Wee, B.V. High-speed rail and office location choices. A stated choice experiment for the Netherlands. J. Transp. Geogr. 2010, 19, 745–754. [Google Scholar] [CrossRef]
  18. Yin, P. High-speed railway and establishment of new pattern of regional tourism: A case study of the high-speed railway between Zhengzhou and Xi’an. Tour. Trib. 2012, 27, 47–53. [Google Scholar] [CrossRef]
  19. Wu, X.Y. On the high-speed rail development, industrial structuring adjustment and tourism industrial upgrade. J. Jiangxi Sci. Technol. Norm. Univ. 2014, 1, 99–102. [Google Scholar] [CrossRef]
  20. Chandra, S.; Vadali, S. Evaluating accessibility impacts of the proposed America 2050 high-speed rail corridor for the Appalachian region. J. Transp. Geogr. 2014, 37, 28–46. [Google Scholar] [CrossRef]
  21. Wang, D.G.; Zhang, Y. The influence of high-speed railways on accessibility of Yangtze river delta region’s metropolitans. Econ. Geogr. 2015, 35, 54–61. [Google Scholar] [CrossRef]
  22. Yang, W.F. Analysis of Beijing-Shanghai high-speed railway’s impact on regional spatial structure of China. Soc. Sci. Beijing 2010, 6, 38–43. [Google Scholar] [CrossRef]
  23. Bian, Y.C.; Wu, L.H.; Bai, J.H. High-speed rail, factor flow and regional economic disparities. Financ. Trade Econ. 2018, 39, 147–161. [Google Scholar] [CrossRef]
  24. Fang, D.C.; Yang, Y.W. Study on transportation spatial structure fractal characteristics of Yangtze river delta city group in high-speed rail era. Areal Res. Dev. 2013, 32, 52–56. [Google Scholar] [CrossRef]
  25. Chen, J.J.; Zheng, G.J. High-speed railway and urban development from the perspective of agglomeration. Jianghuai Trib. 2014, 2, 37–44. [Google Scholar] [CrossRef]
  26. Zhao, J.; Lin, X.Y. Evaluation of influence of Beijng-Tianjin intercity railway on regional economy. Railw. Transp. Econ. 2010, 32, 11–15. [Google Scholar] [CrossRef]
  27. Luo, S.; Lin, X.Y. An empirical study on the evaluation of the impact of high-speed rail on my country’s economy. Inq. Econ. Issues 2013, 11, 74–78. [Google Scholar] [CrossRef]
  28. Zhao, D.D. The Impact of the Beijing-Shanghai High-Speed Railway Construction on the Spatial Layout of Industries along the Line. Master’s Thesis, Southwest Jiaotong University, Chengdu, China, 2011. [Google Scholar] [CrossRef]
  29. Jiang, B.; Chu, N.C.; Wang, Y.; Yu, X.L.; Zhao, Y.H.; Xue, R. High-speed railway impact on the measure of urban accessibility and its spatial pattern simulation analysis: A case of Harbin-Dalian high-speed rail. Econ. Geogr. 2014, 34, 58–62+68. [Google Scholar] [CrossRef]
  30. Wang, J.E.; Jiao, J.J.; Jin, F.J. Spatial effects of high-speed rails on interurban economic linkages in China. Acta Geogr. Sin. 2014, 69, 1833–1846. [Google Scholar] [CrossRef]
  31. Vehmas, J.; Kaivo-oja, J.; Luukkanen, J. Global trends of linking environmental stress and economic growth. Turku Finl. Futures Res. Cent. 2003, 6, 1–24. [Google Scholar]
  32. Zhang, L.; Wu, X.T. An empirical analysis of the effect of high-speed rail on urban economic growth. Stat. Decis. 2017, 17, 152–154. [Google Scholar] [CrossRef]
  33. Zhang, Q.B.; Li, W.D. Empirical analysis of the impact of high-speed railway on industrial structure. CO-Oper. Econ. Sci. 2019, 10, 4–7. [Google Scholar] [CrossRef]
  34. Lin, X.Y.; Chen, X.J.; Bai, Y.F.; Han, X.M. Influence on Beijing-Tianjin intercity high-speed railway to regional economic by quantitative analysis. Railw. Econ. Res. 2010, 5, 5–11. [Google Scholar] [CrossRef]
  35. Qing, G.X. The influence of Shanghai-Kunming high-speed railway on the regional economic development along the line. Trade Fair Econ. 2021, 9, 23–26. [Google Scholar] [CrossRef]
  36. Liu, P. Impact evaluation of high-speed railway on the economic development of regional non-central cities based on DID model. Finance Account. Commun. 2021, 3, 62–67. [Google Scholar]
  37. Chen, G.; Silva, J.D.A.E. Estimating the provincial economic impacts of high-speed rail in Spain: An application of structural equation modeling. Procedia Soc. Behav. Sci. 2014, 111, 157–165. [Google Scholar] [CrossRef] [Green Version]
  38. He, D.W.; Hu, X.P. A study of correlation effect and ripple effect of real estate industry—Based on the positive analysis of input-output tables in China. Modern Ind. Econ. 2015, 2, 17–27. [Google Scholar] [CrossRef]
  39. Tabatabaie, S.M.H.; Murthy, G.S. Development of an input-output model for food-energy-water nexus in the pacific northwest, USA. Resour. Conserv. Recycl. 2021, 168, 105267. [Google Scholar] [CrossRef]
  40. Thongvanh, C. An Intelligent Investment Efficiency Analysis Method Using the Input Output Model. In Proceedings of the 2016 International Conference on Robots & Intelligent System (ICRIS), Zhangjiajie, China, 27–28 August 2016. [Google Scholar] [CrossRef]
  41. Costello, C.; Griffin, W.M.; Matthews, H.S.; Weber, C.L. Inventory development and input-output model of US land use: Relating land in production to consumption. Environ. Sci. Technol. 2011, 45, 4937–4943. [Google Scholar] [CrossRef] [PubMed]
  42. Gama, J.A.P.; Caro, R.; Hernan, C.; Gomez, C.L.C.; Gomez, G.H.; Mena, A.M. Using Input Output Leontief Model in Higher Education Based on Knowledge Engineering and Fuzzy Logic. In Proceedings of the 2016 IEEE Global Engineering Education Conference (EDUCON), Abu Dhabi, United Arab Emirates, 10–13 April 2016. [Google Scholar] [CrossRef]
  43. Fan, Y.; Wu, S.; Lu, Y.; Wang, Y.; Zhao, Y.; Xu, S.; Feng, Y. An approach of measuring environmental protection in Chinese industries: A study using input-output model analysis. J. Clean. Prod. 2016, 137, 1479–1490. [Google Scholar] [CrossRef]
  44. Meng, Y.J. A Study on Expansion of Input-Output Model. Master’s Thesis, Southwestern University of Finance and Economics, Chengdu, China, 2009. [Google Scholar]
  45. Dunn, J.E.S. A statistical and analytical technique for regional analysis. Pap. Reg. Sci. 1960, 6, 97–112. [Google Scholar] [CrossRef]
  46. Cui, L.G.; Tao, Y.Q.; Zhu, K.K.; Liu, X.L. Comparative advantage analysis of regional economy based on shift-share analysis. Econ. Trade Update 2020, 22, 53–55. [Google Scholar] [CrossRef]
  47. Chen, Q.Q. Research on Nantong industrial development orientation under the Yangtze river delta integration strategy: Based on Shift-share analysis. J. Shanxi Inst. Econ. Manag. 2020, 28, 61–68. [Google Scholar]
  48. Esteban-Marquillas, J.M. A reinterpretation of shift-share analysis. Reg. Urban Econ. 1972, 2, 249–255. [Google Scholar] [CrossRef]
  49. Nazara, S.; Hewings, G.J. Spatial structure and taxonomy of decomposition in shift-share analysis. Growth Chang. 2004, 35, 476–490. [Google Scholar] [CrossRef]
  50. Zhuge, Q.Y.; An, H.Z.; Chen, J.M. Comparison of industrial structures in Jiangsu, Zhenjiang and Shanghai based on Shift-Share Model. Resour. Ind. 2015, 17, 124–128. [Google Scholar] [CrossRef]
Figure 1. The pulling effect of high-speed railway investment construction on three industries.
Sustainability 13 06119 g001
Figure 2. The efficiency contribution rate of the diffusion effect of each industry from 2010 to 2017.
Sustainability 13 06119 g002
Table 1. Comparison of input-output models.
ModelContentScope of Application
Physical input-output modelTaking the various products as the object and compiling the content according to different physical measurement unitsThe scope of application is narrow and only reflects the physical flow process of various industries
Value input-output modelThe national economic system is divided into several subsystems-industrial categories, and the specific data is calculated in the form of currencyThe scope of application is wider, which reflects the physical flow and value flow processes of various industries, at the same time.
Table 2. Value-based input-output table.
Sector 1 Intermediate OutputSector 2 Intermediate OutputSector n Intermediate OutputFinal OutputTotal Output
Department 1 Intermediate Input x 11 x 12 x 1 n y 1 x 1
Department 2 Intermediate Input x 21 x 12 x 1 n y 1 x 2
Department n Intermediate Input x n 1 x n 2 x 11 y n x n
Intermediate input (Civil construction cost) v 1 v 2 v n
Workers’ compensation m 1 m 2 m n
Production tax, operating surplus and depreciation of fixed assets r 1 r 2 r n
Total z 1 z 1 z n
Total revenue x 1 x 2 x n
Table 3. Total consumption coefficients of railway-related industries in 2017.
Output
Invest
Railway Transportation Equipment ManufacturingRailway Passenger TransportRailway Freight Transportation and Transportation Auxiliary ActivitiesTotalIndustry Type
Monetary finance and other financial services0.0663960.1805860.1846930.431675Tertiary Industry
Electricity, heat production and supply0.0994330.1272620.1037950.33049Secondary industry
Electronic Components0.1326470.0286810.022930.184258Secondary industry
Business services0.0764220.0441560.043180.163758Tertiary Industry
Non-ferrous metals and their alloys0.1301760.0165150.0154180.162108Secondary industry
Wholesale0.0967590.0238680.023030.143656Tertiary Industry
Rolled steel products0.1054570.0109330.0167920.133183Secondary industry
Rolled non-ferrous metal products0.1020450.0116580.0110510.124754Secondary industry
Transmission, distribution and control equipment0.0904260.0152840.0134880.119198Secondary industry
Metal products0.0852270.0129110.0148320.11297Secondary industry
Refined petroleum and nuclear fuel processed products0.038220.0245130.0393330.102066Secondary industry
Other general equipment0.078170.0090560.0139670.101193Secondary industry
Road goods transportation and auxiliary transportation activities0.0536990.0159970.0196030.0893Tertiary Industry
Real estate0.0255310.0310530.0306670.08725Tertiary Industry
Coal mining and washing products0.0361970.0253170.023030.084544Secondary industry
Table 4. Tertiary industry output value per capita created by the high-speed railway hub cities (yuan/person).
Years200620072008200920102011201220132014201520162017
Area
Zhengzhou388348014822531858256755728874417602817885359153
Xi’an3983416946015683627673878283887687828676917010209
Wuhan151116862061237028223290418835683511368938403951
The data comes from the statistical yearbooks of corresponding year of Zhengzhou, Wuhan and Xi’an.
Table 5. Weight matrix in 2009.
ZhengzhouXi’anWuhan
Zhengzhou0.0000.8900.110
Xi’an0.9010.0000.099
Wuhan0.0000.0000.000
Table 6. Weight matrix in 2017.
ZhengzhouXi’anWuhan
Zhengzhou0.0000.8310.169
Xi’an0.8560.0000.144
Wuhan0.5460.4540.000
Table 7. Changes due to the impact of high-speed railway on the tertiary industry, in hub cities.
ZhengzhouXi’anWuhan
Zhengzhou0+
Xi’an0+
Wuhan++0
Table 8. Value added of real estate, tourism, transportation, warehousing and post industry (Unit: 100 million yuan).
Area2010–2017
Transportation, Warehousing and PostReal EstateTourism
Zhengzhou260423243
Xi’an198224185
Wuhan231881218
Table 9. Growth rate of industrial structure.
Transportation, Warehousing and Post Real EstateTourism
L j 98.38%169.42%158.20%
Table 10. Real growth rate.
Real Growth Rate ( L i j ) Transportation, Warehousing and PostReal EstateTourism
Zhengzhou99.52%225.07%207.44%
Xi’an146.15%120.29%180.33%
Wuhan76.06%165.50%115.57%
Table 11. Regional share, industrial structure, and competitiveness.
AreaTransportation, Warehousing and PostReal EstateTourism
W i j S i j C i j W i j S i j C i j W i j S i j C i j
Zhengzhou365−1073262561051632258
Xi’an189−566526056−921431923
Wuhan423−125−6846399−1326335−80
Table 12. Benefits and degree of contribution of the industrial diffusion effects in major cities along the high-speed railway.
AreaTransportation, Warehousing and PostReal EstateTourism
BenefitContribution RateBenefitContribution RateBenefitContribution Rate
Zhengzhou26049.88%42369.24%24367.47%
Xi’an19859.37%22440.75%18564.33%
Wuhan23143.20%54962.33%21853.61%
Publisher’s Note: MDPI stays neutral with regard to jurisdictional claims in published maps and institutional affiliations.

