Article

Research on Supplier Selection of Prefabricated Building Elements from the Perspective of Sustainable Development

School of Civil Engineering and Architecture, Wuhan University of Technology, Wuhan 430070, China
*
Author to whom correspondence should be addressed.
Sustainability 2021, 13(11), 6080; https://doi.org/10.3390/su13116080
Submission received: 25 April 2021 / Revised: 24 May 2021 / Accepted: 26 May 2021 / Published: 28 May 2021
(This article belongs to the Special Issue Sustainable Operations and Logistics)

Abstract

:
Prefabricated building is an efficient building mode. Compared with the traditional building mode, the prefabricated building has advantages of less pollution, high construction efficiency, being more labor-saving, and economy, which is in line with China’s sustainable development strategy. This paper proposes a supplier selection evaluation model based on the mechanism equation model (SEM) and intuitionistic fuzzy analytic hierarchy process (IFAHP). Based on a detailed literature review, 300 structured questionnaires were distributed to the relevant enterprises, and an evaluation index system of prefabricated building element suppliers was built. With the fitting and modification process using a structural equation model, and assist of a path factor, an evaluation index system for evaluating the prefabricated building element suppliers was finally obtained. Finally, the intuitionistic fuzzy analytic hierarchy process was used to establish a selection model of prefabricated element suppliers, and the prefabricated element suppliers of Shuangyashan prefabricated construction projects were analyzed as a case study. The results show that the following factors have the most significant impact on supplier selection (from high to low): quality, economy, long-term cooperation, after-sales, and transportation. This study had a comprehensive consideration of the influencing factors existing in the whole selection process and should provide a valuable reference for the sustainable development of prefabricated construction engineering.

1. Introduction

Prefabricated buildings can be traced back to 1940, which refers to buildings built with elements produced in the component production factory and then delivered and assembled at the construction site [1]. Prefabricated buildings have advantages of high construction efficiency, being cost-saving, and environmentally friendly. Owing to the sustainable development strategy, the Chinese government has issued relevant policies to promote the reform of the construction industry, and local governments at all levels have shown active support. As a result, a large number of prefabricated building element suppliers have come into the market accordingly. Nowadays, making an optimal choice among the numerous suppliers to maintain a safe and stable construction, to save the cost to the greatest extent, and to cooperate with future construction projects for a long time has become an urgent issue in China’s construction industry.
Construction with prefabricated components is considered an efficient method to improve productivity and construction efficiency [2]. However, without proper management and planning from the beginning of the construction element supplier selection, the investment risks are likely to occur, which is not conducive to the sustainable development of construction enterprises [3]. The current research on the selection of prefabricated construction suppliers is still at an early stage [4]. By investigating the relevant literature in recent years, most of the research on supplier selection focuses on manufacturing, logistics, and agricultural economy. The selection of building components suppliers is relatively rare [5].
The comprehensive evaluation of assembly building suppliers can be analyzed jointly from the method and multi-dimensional factors. The use of multi-dimensional system indicators in the analysis method will make the results more scientific. There are many methods for the use of establishing a comprehensive evaluation system, including the sensitivity analysis method of grey system theory [6], cluster analysis method [7], analytic hierarchy process [8,9], fuzzy comprehensive evaluation method [10], rough set analytic hierarchy process [11], and factor analysis method [
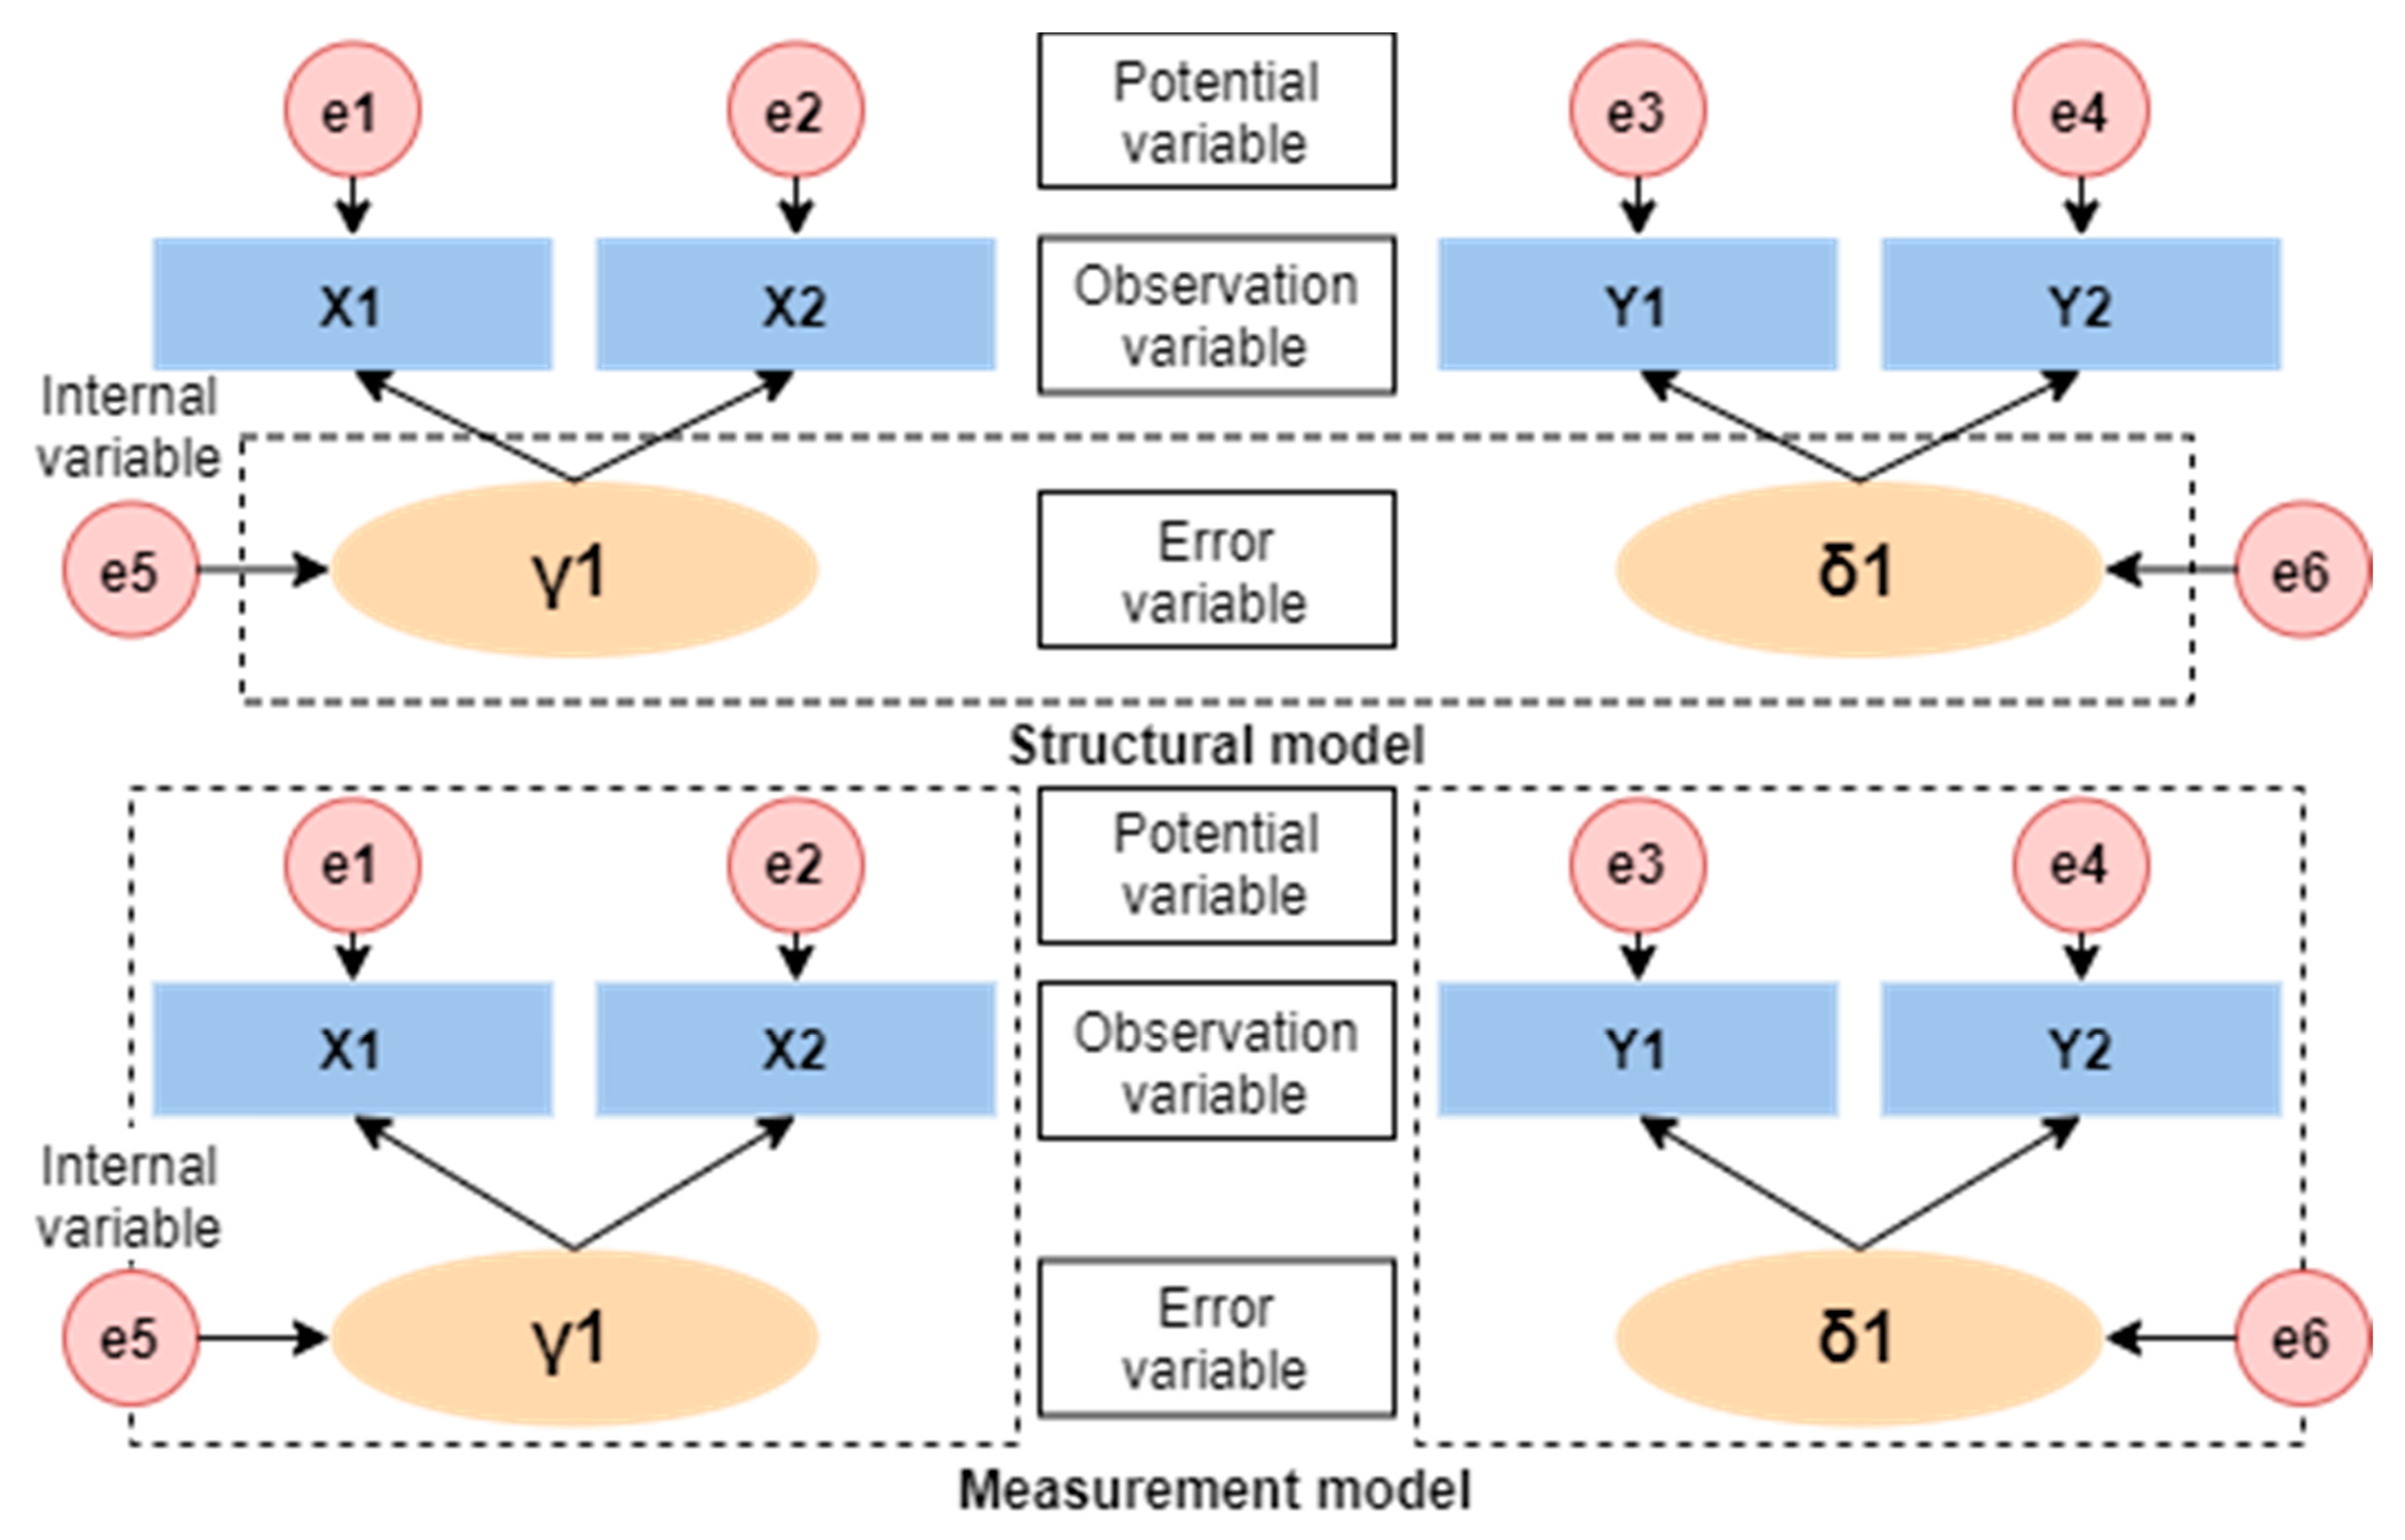
12], etc. Although the above methods introduce the uncertainty of factors in the analysis, there is no random and objective evaluation of the influencing factors of supplier selection. To overcome the shortcomings, the structural equation model was used in this paper. The advantage of the structural equation model is that it combines the statistical results with the hypothetical relationship to verify and estimate the logical relationship between factors, which overcomes the shortcomings of the above methods. Chang [13] used an SEM model to analyze the safety risk mechanism of prefabricated building construction, conducted analyses from the aspects of personnel, management, and mechanical technology, and quantified the index system to determine the biggest risk factor in a project. Li [14] used SEM to quantitatively evaluate the impact of investment risk of prefabricated buildings and made suggestions on avoiding the most influential factors. Hong et al. [15] have characterized and quantified the factors of construction equipment shutdown based on SEM and strengthened the management of key risks. Wei [16] studied the management mode and supply chain of congregate apartments, analyzed the problems existing in the development of the supply chain ecosystem, and provided corresponding suggestions. Huang [17] established a performance evaluation model in the supplier research of prefabricated building elements, which provided ideas for the sustainable development strategy of prefabricated buildings. Cheng studied the difference of concrete rates for prefabricated elements and reduced the subsequent cost of construction projects in terms of the economy [18]. Zhao took the fabricated buildings constructed with the regular mode in Hefei as an example, analyzed the strategic objectives of traditional cast-in-place buildings, and found it has a serious pollution problem, which makes them unsuitable for sustainable development. In contrast, he expounded the comprehensive economic benefits of the prefabricated buildings and put forward a comprehensive benefit evaluation model, which theoretically supported the sustainability of prefabricated buildings [19]. According to the review of previous investigations, it is found that the research on the development of prefabricated buildings is mostly based on the existing political factors, economic factors, management factors, etc., and therefore can only take care of the existing problems. Different from previous studies, this work regards time as a factor of sustainable development and takes care of the problems in the follow-up long-term cooperation and building operation stage. On the analysis of selecting the prefabricated building element suppliers, the affecting factors covered the aspects from quality, technology, economy, and management to long-term cooperation.
In summary, when selecting a prefabricated building element supplier, various aspects need to be taken into consideration. First, a risk assessment (RIA) is needed, which helps to analyze the source of fabrication risks and economic risks in the construction process of prefabricated buildings, as well as the common mistakes in the long-term follow-up cooperation [20]. Zhang et al. effectively combined the risk problem with the mathematical model [
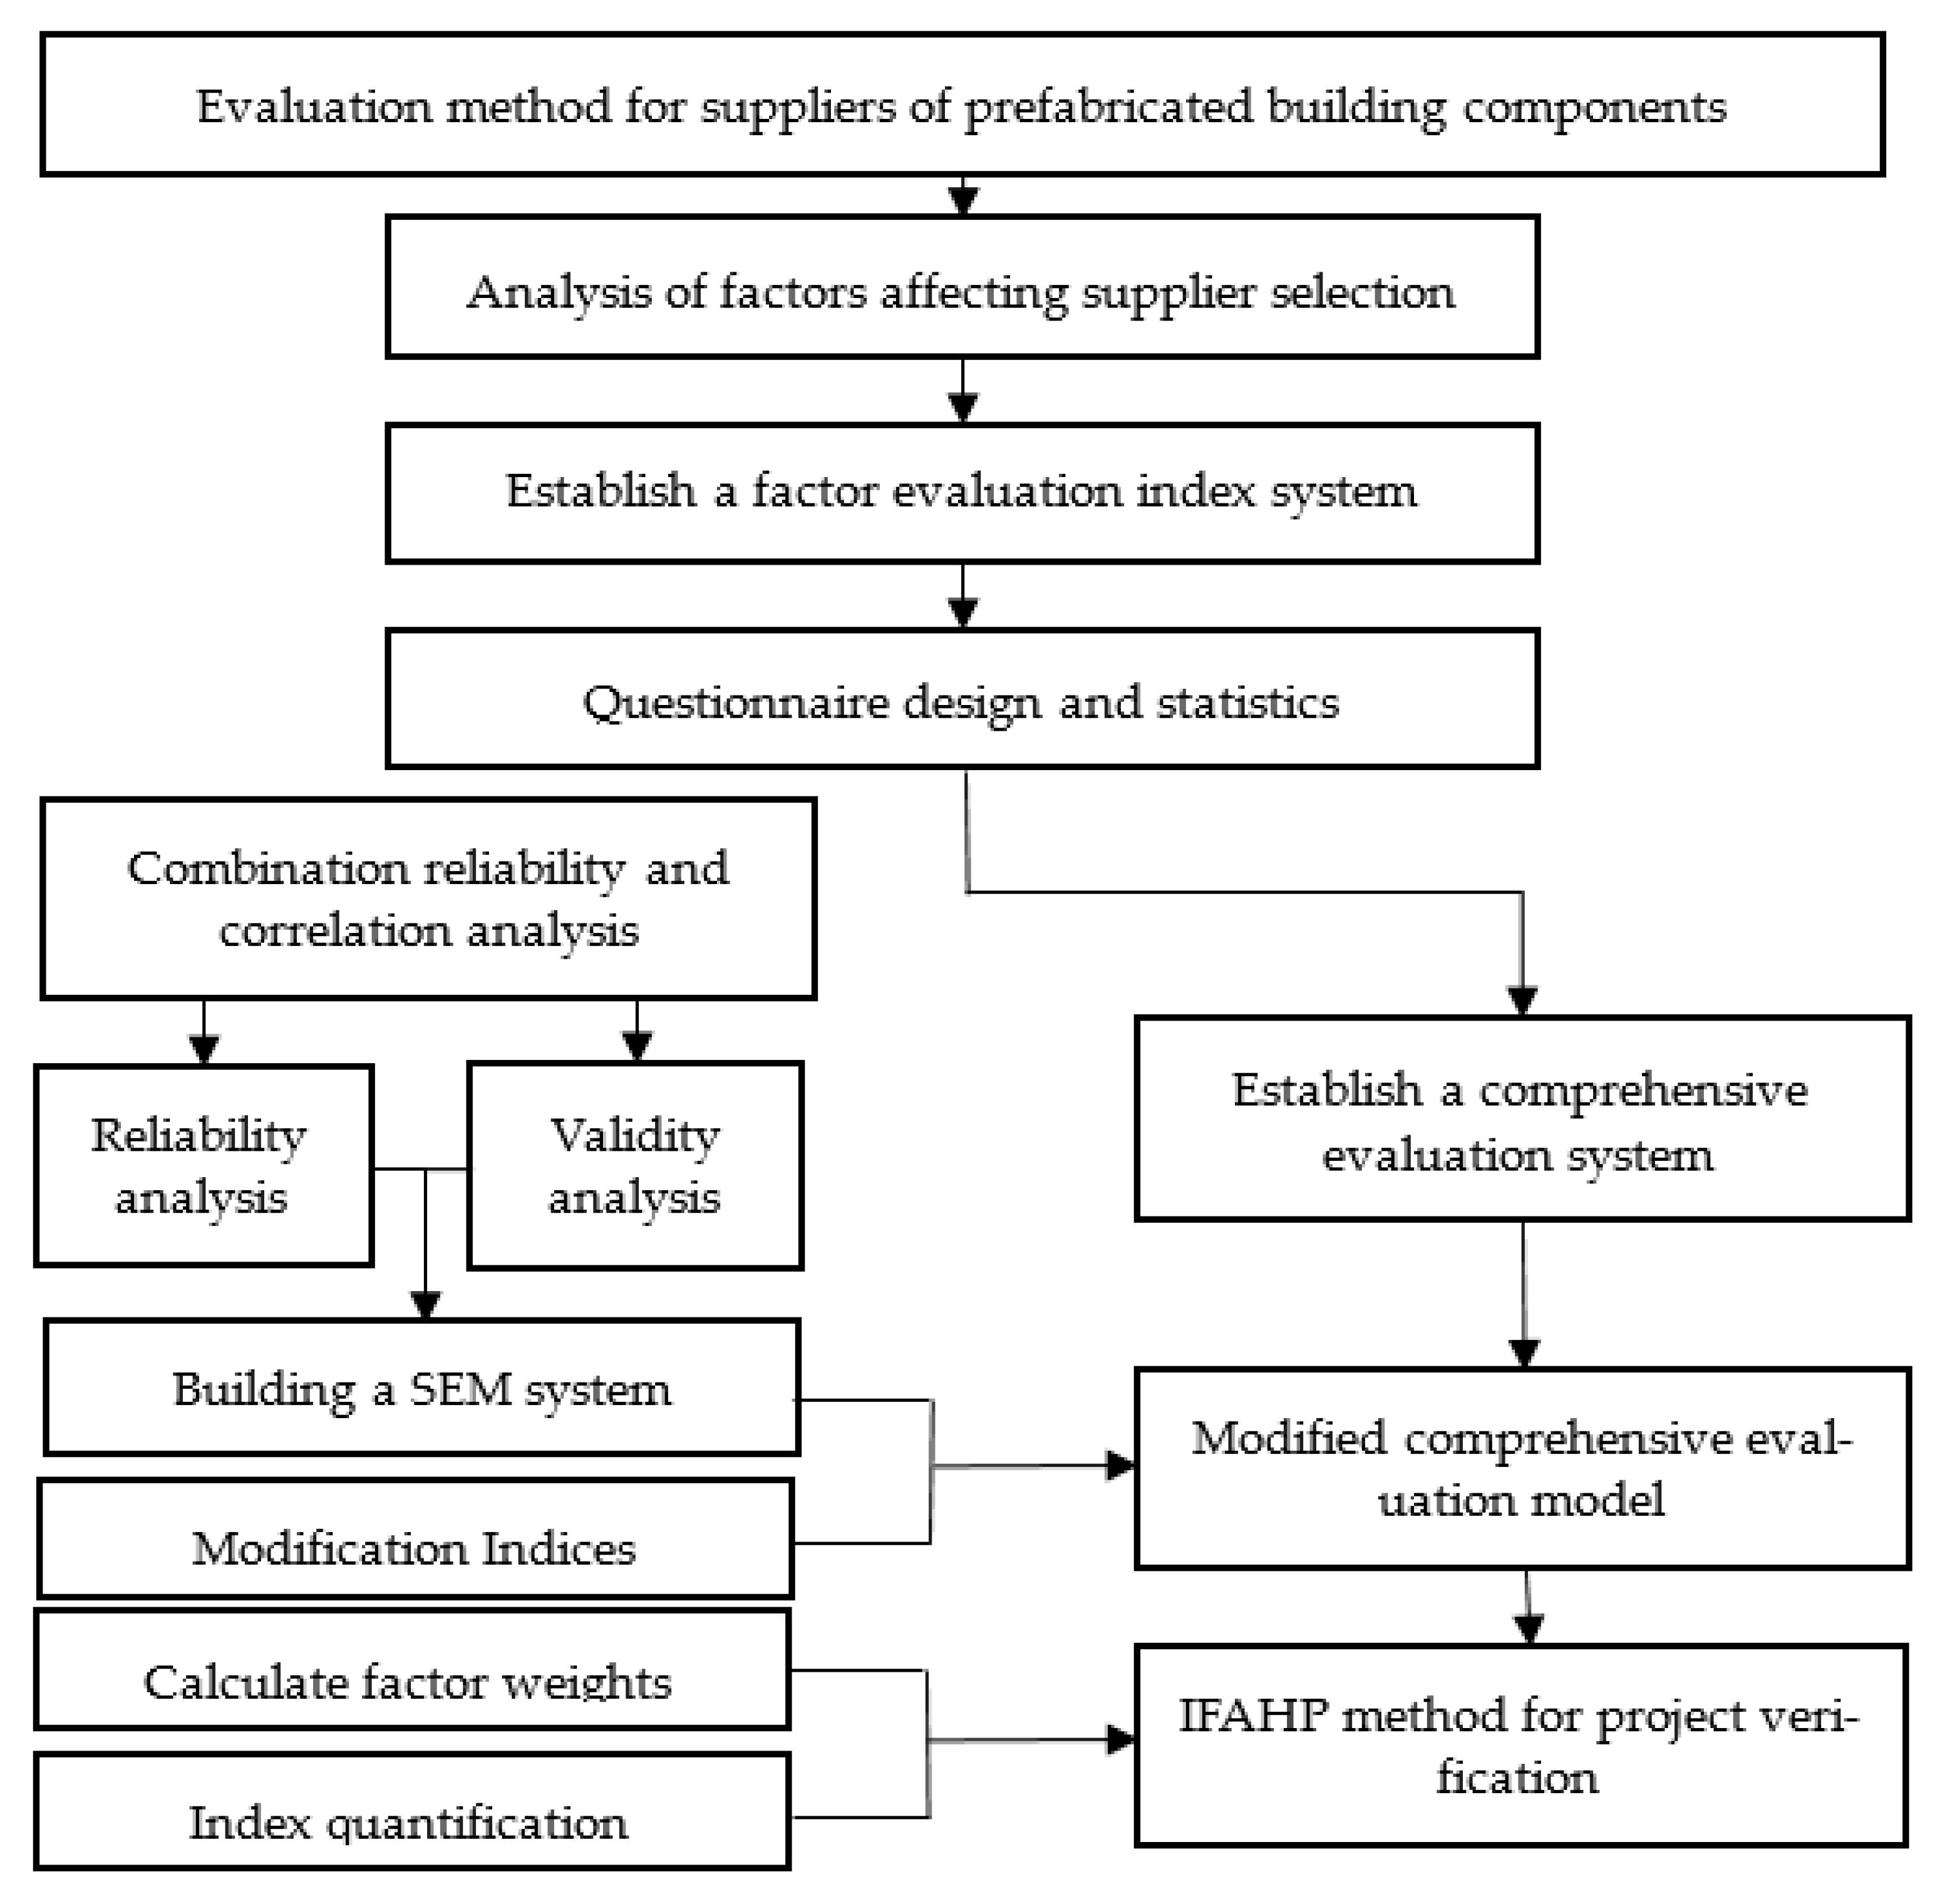
21]. Nevertheless, many investigations focusing on supplier selection management are mainly based on decision theory combined with actual engineering experience and only give decision evaluations for the short term, which makes it hard for construction enterprises to find long-term cooperative suppliers. Therefore, for the selection of element suppliers, the key is to highlight the risk source for the whole process, starting from production and installation to the later operation stage, and establish a comprehensive evaluation index system for construction enterprises to comprehensively evaluate the suppliers. In the process of production, construction, and long-term operation of the prefabricated elements, this study explores the potential relationship between various indexes in the evaluation system of element supplier selection, establishes the relevance model, and constantly modifies it in the process of verification. The relevance degrees between different factors were highlighted, which fed back the evaluation system. In response to the problems found in the research process, this research will further discuss and put forward guiding suggestions.
The purposes of this study are as follows:
(1) To establish a comprehensive selection index system for sustainable cooperation between the construction company and prefabricated element supplier.
(2) To clarify the hidden correlations between latent variables and optimize the structural equation model.
(3) Use the SEM-IFAHP method to select sustainable prefabricated building element suppliers for Shuangyashan prefabricated construction companies to achieve maximum economic benefits.

2. Materials and Methodology

By summarizing the research of previous scholars, to achieve the research purpose of this article, this research has designed a set of research plans for the selection of prefabricated construction suppliers.The flow chart of the method for selecting suppliers of prefabricated building components is shown in Figure 1.

2.1. Analysis of Factors Affecting Supplier Selection and Hypotheses

2.1.1. Economic System Factors

When selecting suppliers of prefabricated building elements, the main sources affecting the economic system are fabrication, transportation, storage, and developments over time [22]. In the fabrication process, different manufacturers have different material sources and labor costs, which can lead to differences in the costs of fabrication and transportation. On the other hand, after booking the building elements, a slight delay in the construction project will increase its storage cost [23], which also needs to be taken into account in the economic system. Besides the economic factors inherent in the target project, the price that suppliers can offer may fluctuate with the development of time [24], technological innovation, and long-term cooperation, and this is another factor requiring analysis. In terms of the economic system factors, this study puts forward five hypotheses to test and verify the corresponding relationships:
Hypothesis 1a (H1a).
The economic system has a great impact on the selection of prefabricated element suppliers.
Hypothesis 1b (H1b).
Freight cost has a relatively great impact on the selection of prefabricated element suppliers.
Hypothesis 1c (H1c).
Price fluctuation has a relatively great impact on the selection of prefabricated element suppliers.
Hypothesis 1d (H1d).
Element fabrication cost has a relatively great impact on the selection of prefabricated element suppliers.
Hypothesis 1e (H1e).
Storage loss has a relatively great impact on the selection of prefabricated element suppliers.

2.1.2. Quality System Factors

In the quality system, the selection of suppliers is mainly concerned with the quality of products. In addition to controlling the qualified rate, the manufacturing process and inspection stage should also be considered [25]. In the investigation of suppliers, factors regarding the products return should also be analyzed [26]. The quality management of suppliers in the production process can affect the qualified rate of products, so the interaction between them should be considered when establishing the evaluation system. In previous studies, the quality inspection of prefabricated building elements is generally conducted only on the selected samples before they leave the factory, and all the problems in the construction stage will be considered as the result of improper operation of construction enterprises [27]. To eliminate such deficiency, this work will discuss and analyze the quality problems during the construction stage and include them into the quality system factor analysis. In terms of the quality system factors, this study puts forward six hypotheses to test and verify the corresponding relationships:
Hypothesis 2a (H2a).
The quality system has a great impact on the selection of prefabricated element suppliers.
Hypothesis 2b (H2b).
Quality management has a relatively great impact on the selection of prefabricated element suppliers.
Hypothesis 2c (H2c).
Product return rate has a relatively great impact on the selection of prefabricated element suppliers.
Hypothesis 2d (H2d).
Manufacturing standardization has a relatively great impact on the selection of prefabricated element suppliers.
Hypothesis 2e (H2e).
Construction qualification rate has a relatively great impact on the selection of prefabricated element suppliers.
Hypothesis 2f (H2f).
Probability of quality problem occurrence during construction has a relatively great impact on the selection of prefabricated element suppliers.

2.1.3. Transportation System Factors

Process analysis is often used in the study of transportation problems [28]. Setting buffer intervals in transportation strategy can increase the flexibility of scheduling [29]. According to the previous studies, enterprises with flexible supply schemes in the transportation system have more advantages in efficiency and can greatly avoid the engineering economic risk caused by the delay of the construction period due to insufficient supply [30]. As the transportation process may be restricted by traffic regulations, traffic violations can also lead to the delay of the construction project schedule [31]. At the same time, the transportation process should be carried out strictly in accordance with the transportation specifications to guarantee the building elements’ quality. In terms of the transportation system factors, this study puts forward five hypotheses to test and verify the corresponding relationships:
Hypothesis 3a (H3a).
The transportation system has a great impact on the selection of prefabricated element suppliers.
Hypothesis 3b (H3b).
Transportation standardization has a relatively great impact on the selection of prefabricated element suppliers.
Hypothesis 3c (H3c).
Flexible supply scheduling has a relatively great impact on the selection of prefabricated element suppliers.
Hypothesis 3d (H3d).
On-time delivery rate has a relatively great impact on the selection of prefabricated element suppliers.
Hypothesis 3e (H3e).
Traffic violation rate has a relatively great impact on the selection of prefabricated element suppliers.

2.1.4. Long-Term Cooperation System Factors

When selecting element suppliers for construction enterprises, it can be very troublesome if the whole selection process must be carried out repeatedly for every new project in the same city, which is unfavorable to the management and makes it difficult to reuse some old documents. In order to make the operation of construction enterprises more efficient, long-term sustainability cooperation between construction enterprises and suppliers is therefore advocated [32]. Long-term sustainable cooperation can not only meet the national policy incentives but also improve the engineering economy. The reason is that long-term cooperation with a supplier can reduce not only the cost but also the labor work [33]. Based on the above considerations, this study introduces the study on the enterprise management direction, evaluates the enterprise information of suppliers, and integrates them into the comprehensive information evaluation system of suppliers. In terms of the long-term cooperation system factors, this study puts forward seven hypotheses to test and verify the corresponding relationships:
Hypothesis 4a (H4a).
The long-term cooperation system has a great impact on the selection of prefabricated element suppliers.
Hypothesis 4b (H4b).
Enterprise financial condition has a relatively great impact on the selection of prefabricated element suppliers.
Hypothesis 4c (H4c).
Enterprise production equipment has a relatively great impact on the selection of prefabricated element suppliers.
Hypothesis 4d (H4d).
Enterprise innovation has a relatively great impact on the selection of prefabricated element suppliers.
Hypothesis 4e (H4e).
Enterprise management capacity has a relatively great impact on the selection of prefabricated element suppliers.
Hypothesis 4f (H4f).
Production qualification has a relatively great impact on the selection of prefabricated element suppliers.
Hypothesis 4g (H4g).
Technological development has a relatively great impact on the selection of prefabricated element suppliers.

2.1.5. Customer Service System Factors

Manufacturing companies are shifting from being pure manufacturers to offering solutions and services, often delivered through their products or in association with them [34]. One perspective which has been popularized over the years is that services are “intangible products.” In fact, no services are purely intangible [35]. Suppliers who are willing to provide technical supports actively are generally welcomed by construction enterprises because the problems encountered in the construction process are not necessarily caused by construction enterprises [36]. Suppliers participating in the problem-solving at this stage can promote the progress of construction projects. In terms of the customer service system factors, this study puts forward five hypotheses to test and verify the corresponding relationships:
Hypothesis 5a (H5a).
The after-sales system has a great impact on the selection of prefabricated element suppliers.
Hypothesis 5b (H5b).
Customer service capability has a relatively great impact on the selection of prefabricated element suppliers.
Hypothesis 5c (H5c).
Technical support has a relatively great impact on the selection of prefabricated element suppliers.
Hypothesis 5d (H5d).
Customer service track has a relatively great impact on the selection of prefabricated element suppliers.
Hypothesis 5e (H5e).
Problem-solving efficiency has a relatively great impact on the selection of prefabricated element suppliers.

2.2. Establish a Factor Evaluation Index System

2.2.1. Model Index Establishment

Through the above factor analysis and discussion, we divided the strategy of selecting prefabricated building element suppliers into five aspects, which correspond to five potential variables: cost system, quality system, transportation system, long-term cooperation system, and after-sales system. The relationship between the structure and the mediating effect is shown in Figure 2.
Based on expert visits, field investigation, and detailed literature review, the authors found that the above five factors are interrelated. We, therefore, can use them to determine the path relationships among them and define the model assumptions and measurement variables.

2.2.2. Model Identification Verification

According to the logical relationships, this paper established the correlated uniqueness model. However, it was difficult to estimate the CTCM model (Correlated Train/Correlated Method). Thus, in 2013, Laura Castro-Schilo [37] proposed a model test method using t-rule, which was used to solve the valuation problem of CTCM model. The symbol t is the number of free estimates of parameters, and the principle that should be followed is shown in Formula (1):
t p ( p + 1 ) + p  
According to the structure chart, the literature review, the author’s analysis, and hypotheses, the structure model of this paper contains five primary indexes, namely economic system, quality system, transportation system, long-term cooperation, and after-sales system. Among them, the economic system includes four secondary indexes, namely freight cost, price fluctuation, element fabrication cost, and storage loss. The quality system consists of five secondary indexes, which are quality management, product return rate, manufacturing standardization, construction qualification rate, and probability of quality problem occurrence during construction. The transportation system mainly concerns four aspects, which are transportation standardization, flexible supply scheduling, on-time delivery rate, and traffic violation rate. The secondary indexes for the long-term cooperation system are the enterprise financial condition, production equipment, innovation, management capacity, production qualification, and technological development. Those for the after-sales system are the customer service capability, technical support, and customer service tracking problem-solving efficiency.

2.3. Questionnaire Design and Data Survey

According to the literature investigation and the author’s hypothesis in chapter 2.1, this study adopted the Likert 5 scale and established five evaluation dimensions for each evaluation index [14]. At the same time, the research also designed a questionnaire and distributed it to scholars in related fields. In the evaluation system, “1 point” means no impact basically; “2 point” means a relatively light impact; “3 point” is a general impact degree; “4 point” represents a relatively great impact; and “5 point” denotes a great impact. The evaluation system is shown in Table 1.
The questionnaire analysis method and structure model established in this study are based on SPSS and Amos software. According to the optimal sample size interval designed by the software, a total of 300 questionnaires were distributed, of which 269 (89.7%) were returned as effective. Among the 31 excluded questionnaires, the results varied significantly and, therefore, were considered as too subjective, which is not statistically significant. The age and workplace distribution of the interviewed experts and students are shown in Figure 3.

2.4. Combination Reliability and Correlation Analysis

After the questionnaire was administered, the questionnaire information data is statistically aggregated to SPSS software, with standardized data transformation. The transformed data can derive the construct reliability, and average variance extracted values for the survey data using Equations (2) and (3). When both CR and AVE pass the test, the batch of data can be said to have passed the reliability and validity test. The reliability of the data can then be tested. The reliability test is passed when the KMO and Bartlett sphere accord with the standard values:
C R = ( λ 2 ) / ( ( λ 2 ) + δ )
A V E = ( λ 2 ) / n

2.5. Introduction of the Structural Equation Model

Structural equation modeling (SEM) is a statistical method used to analyze the relationship between variables based on the covariance matrix of variables [38], which is an important tool for multivariate data analysis. SEM is essentially a comprehensive verification analysis method, which is widely used in psychology, pedagogy, sociology, and other fields. A common point in establishing an evaluation index system in these fields is that each index in these index systems cannot be measured intuitively and accurately. These qualitative indexes are called latent variables, such as personnel intelligence, work motivation, social environment impact, and so on. Generally, the measurement of these potential variables needs to be carried out by means of a method called observable indexes. Observable indexes can predict potential variables, complex independent variables, or dependent variables by analyzing the relationship between various factors. The traditional linear regression analysis allows the dependent variable to have measurement error, but the premise is that the independent variable itself has no error. The structural equation model can be divided into a measurement model and a structural model. The measurement model refers to the relationship between indexes and latent variables [39], while the structural model refers to the relationship between the latent variables after standardized correction.
Independent variables and dependent variables can be measured by observation variables, and the relationship between them can be represented by measurement matrix. Independent variables and dependent variables can be expressed with Equations (4) and (5):
X = Γ X γ + ε
Y = Γ Y δ + ζ
In the structural model, the relationship between independent variables and dependent variables is given in Equation (6):
η = α γ + β δ + θ
In the SEM structure diagram, latent variables are unpredictable, which are usually represented by ellipses. Measurement variables can be obtained by direct measurement, which are usually represented by rectangles [40]. The relationship between the measurement model and the structural model is shown in Figure 4.

2.6. Intuitionistic Fuzzy Analytic Hierarchy Process Model

2.6.1. Introduction of the Intuitionistic Fuzzy Analytic Hierarchy Process

Compared with the traditional building mode, when choosing suppliers for prefabricated buildings, we need to consider not only cost and quality, but also the transportation, long-term cooperation, and after-sales service, which makes it more complex. In the following chapters, we will apply an intuitionistic fuzzy analytic hierarchy to establish a selection and evaluation model for the use of selecting the prefabricated building element suppliers.
Zadeh [41] put forward the traditional fuzzy set theory in 1965, and Atanassov [42] put forward the intuitionistic fuzzy set theory based on the traditional fuzzy set theory in 1983. The traditional fuzzy set only considers membership, while the intuitionistic fuzzy set considers membership grade, non-membership grade, and hesitation at the same time, so it has more advantages than the fuzzy set theory in dealing with fuzziness and uncertainty. Xu and Liao [43] combined intuitionistic fuzzy sets with an analytic hierarchy process and developed a comprehensive fuzzy analytic hierarchy process. The basic steps of using IFAHP to calculate the weight of the evaluation index for component supplier selection are as follows.

2.6.2. Establishment of Intuitionistic Fuzzy Matrix

The intuitionistic fuzzy judgement matrix can be used to describe objective information, and the intuitionistic fuzzy judgement matrix establishment is shown in Formula (7):
A = ( A i j ) n × n A i j = ( μ i j , ν i j ) ,   i , j = 1 , 2 , n
where A i j is the comparison result between the i t h factor index and the j t h factor index of the evaluation system; u i j represents the degree of membership, which refers to the importance of index i relative to index j, and v i j is the degree of hesitation. With u i j and v i j , one can use the following equation to quantify the importance of the indexes. Table 2 is the corresponding evaluation scale as defined herein.
π i j = 1 μ i j ν i j

2.6.3. Consistency Test

In the intuitionistic fuzzy analytic hierarchy process, it is necessary to perform a consistency check on the intuitive decision matrix, which is as follows [44], to avoid errors in the final results or unreliable calculated data:
A ¯ = ( z ¯ i j ) n × n When   j > i + 1 ,   z ¯ i j = ( μ ¯ i j , v ¯ i j )
μ ¯ i j = t = i + 1 j 1 μ i t μ t j j i 1 t = i + 1 j 1 μ i t μ t j j i 1 t = i + 1 j 1 ( 1 μ i t ) ( 1 μ t j ) j i 1
v ¯ i j = t = i + 1 j 1 v i t v t j j i 1 t = i + 1 j 1 v i t v t j j i 1 t = i + 1 j 1 ( 1 v i t ) ( 1 v t j ) j i 1 When   j = i + 1   or   j = i ,   z ¯ i j = z i j .   When   j < i ,     z ¯ i j = ( v ¯ j i , v ¯ j i ) .
A parameter d was introduced to represent the test distance between A and A ¯ . If d ( A , A ¯ ) < τ , the intuitionistic fuzzy set satisfies the consistency. In this study, τ was set to 0.1, which represented the consistency index threshold:
d ( A ¯ , A ) = 1 2 ( n 1 ) ( n 2 ) i = 1 n j = 1 n ( | μ ¯ i j μ i j | + | v ¯ i j v i j | + | π ¯ i j π i j | )
when d ( A ¯ , A ) τ indicates that the consistency was not satisfied. To make these cases pass the consistency verification, we introduced the iteration parameter σ and performed equidistant traversal. The iteration parameters were limited in the range of σ ∈ [0,1]. The iteration started from 1, and the number of reverse steps distance was −0.01. The detailed steps are as shown in Formulas (13)–(15) [45]:
μ ˜ i j = ( μ i j ) 1 σ ( μ ¯ i j ) σ ( μ i j ) 1 σ ( μ ¯ i j ) σ + ( 1 μ i j ) 1 σ ( 1 μ ¯ i j ) σ ,
v ˜ i j = ( v i j ) 1 σ ( v ¯ i j ) σ ( v i j ) 1 σ ( v ¯ i j ) σ + ( 1 v i j ) 1 σ ( 1 v ¯ i j ) σ ,
d ( A ˜ , A ) = 1 2 ( n 1 ) ( n 2 ) i = 1 n j = 1 n ( | μ ˜ i j μ i j | + | v ˜ i j v i j | + | π ˜ i j π i j | )

2.6.4. Weight and Score Calculation

After passing the consistency test, the intuitionistic decision matrix was simplified by Formula (16):
ω i = ( j = 1 n μ ¯ i j i = 1 n j = 1 n ( 1 v ¯ i j ) , 1 j = 1 n ( 1 v ¯ i j ) i = 1 n j = 1 n μ ¯ i j )
Formulas (17) and (18) were used to calculate the score and weight value of the evaluation index, respectively:
H ( ω i ) = 1 v i 1 + π i
σ i = H ( ω i ) j = 1 n H ( ω i )
By comparing the advantages and disadvantages of the same index of different suppliers, the judgment matrix can be obtained, and the score matrix can be constructed by substituting the judgment matrix into Formula (19). The prefabricated building element supplier with the highest score is the optimal choice. G is the score value obtained by multiplying the weight vector and the score matrix. By arranging the values, it is convenient for us to select the most suitable component supplier:
G = W F T 100
where W is the weight vector of H ( ω i )   intuitionistic fuzzy, and F T is the score matrix of each supplier’s secondary indexes.

3. Case Study Results

The project of Shuangyashan Chengxiang construction and installation company is located in Shuangyashan City, Heilongjiang Province, with a total construction area of 216,943 square meters, two underground floors, and 15 above-ground floors. The project adopts prefabricated concrete frame shear wall structures. After a preliminary screening, there are four suppliers (S1, S2, S3, S4) around Shuangyashan City to choose from.

3.1. Data Analysis

After excluding the 31 invalid questionnaires, the valid scores were summarized. The reliability and validity of the data were tested by the SPSS software. When testing the validity, the CR value of each index should be greater than 0.8, and the AVE value of the data in this paper is greater than 0.5 [46], which proves the validity of the scoring data. The results presented in Table 3 indicate that all the latent variables are statistically valid.
When testing the reliability, the Cronbach’s α value of each index should be greater than 0.7 [47]. The Cronbanch’s α value of the data in this paper is greater than 0.8, which proves the reliability of the scoring data. Only when the reliability test was passed can the effective reliability test be continued. According to the measurement standard given by Kaiser [48], when KMO and Bartlett are used for testing, the KMO value should be greater than 0.8, and Bartlett sphere test value should be significant on p = 0 [46]. When both are achieved, a strong correlation between the data of the questionnaire survey can be proved, and the data can be used as analysis factors to pass the validity test. Table 4 is a summary of the initial and standardized Cronbanch’s α values along with the KMO values and the Bartlett sphere test results.

3.2. Establishment and Modification of Structural Equation Model

3.2.1. Establishment of SEM

According to the principle of complex systems science [49], we summarized the relationships among the latent variable. The conclusion is as follows: first, the fabrication cost affects the quality of the prefabricated elements, the freight mode, and the transportation efficiency. While the quality problem of the elements can influence its supply ability and serviceability, as well as long-term cooperation and follow-up quality tracking, the transport capacity affects the quality of the element during transportation, as well as the economic problems associated with storage, and at the same time, affects the subsequent cooperation. On the other hand, the long-term cooperation standard of the suppliers affects their economic condition, product quality, product transportation, and customer service capabilities. A summary of the relationship between the above, latent variables is shown in Figure 5.

3.2.2. Modification of SEM

The rationality and relevance of the index system proposed in this study can be verified by the fitting degree of each index in the structural equation model with Amos software [50]. The modification indexes (MI) index and part change (PC) index of the initial structural model [51] can be used to modify its association. For the observation variables with large indexes in the model, the mediating effect can be used to assess their association degree. Based on the first-order modeling, a factor association path was added through mediating effect to achieve the standard of model index adaptation [52]. The modified model is shown in Figure 6. The values of CMIN/df,RMR,RMSEA,GFI,AGFI,NFI,IFI,CFI are shown in Table 5. According to the results in Table 5, the modified model based on MI and PC index is feasible. Below are the three hypotheses adopted by Amos in the analysis of structural equations:
(1) The latent variables of SEM have a linear relationship.
(2) The normality of the observed variables is in accordance with the normal distribution.
(3) The values of the observed variables are independent, and the samples are random.
The normality evaluation of the modified SEM model is shown in Table 6. According to the results, the skewness coefficient of the 23 observation variables is less than 3 [53], and the kurtosis coefficient is less than 8 [44]. At the same time, the distribution of the data conforms to the normal distribution, which proves that the above three hypotheses are true, so the model is correct. The non-standardized errors, standard errors, critical ratios, significance levels, and standardized values are shown in Table 7.
From Table 7, we can conclude that the standardized variable path coefficient can be used to reflect the influence of each observed variable on potential variables. In the economic system, the path coefficients of the element fabrication cost and price fluctuation reach 0.771 and 0.729, respectively, which indicates that the impacts of these two are significant in the latent variables of the economic system. Thus, attention should be paid when selecting element suppliers so as to ensure the element quality and meet the optimal price as much as possible. In the quality system, the element qualification rate has the largest path coefficient, which is 0.882. This shows that, in the quality system, the element qualification rate is the most important factor, and it is followed by the manufacturing standardization and return rate. Their path coefficients are 0.879 and 0.817, respectively. In the transportation system, the most influential factor is the on-time delivery rate, whose coefficient is 0.892. For construction companies, the timely arrival of components can greatly affect the project economy. Only by ensuring the timely arrival of goods, the whole project can be carried out in an orderly manner. Secondly, we need to focus on flexible supply scheduling, which is conducive to saving a lot of time when there are order changes. In the long-term cooperation system, the path coefficients of technological innovation, enterprise financial conditions, and enterprise management ability are relatively high, which are 0.874, 0.870, and 0.833, respectively. Thus, they are the key points when considering the long-term cooperation with the element suppliers. In the after-sales system, the construction party pays the most attention to the efficiency of problem-solving because its path coefficient is 0.873.

3.3. Results

3.3.1. Establishment of Intuitionistic Fuzzy Complementary Judgment Matrix

According to the previous analysis in this work, there are five primary indexes, which are economic index A1, quality index A2, transportation index A3, cooperation index A4, and after-sales index A5. We invited two expert groups with more than 20 years’ working experience to adopt the pairwise comparisons, and then we got the intuitionistic fuzzy judgment matrix.
After comparing the judgment matrix given by expert group 1 with that of expert group 2, we got the importance of evaluation indexes, see Table 8.
When verifying the consistency of the results in Table 7, it was found that d = ( A ¯ , A ) = 0.173 ≥ 0.1, which indicated the consistency verification failed, and the intuitionistic decision matrix ( A ¯ , A ) did not meet the requirements of matrix A. Thus, the iteration process was needed, and the consistency was achieved when σ = 0.67, with which d ( A ˜ , A ) = 0.0987 < 0.1 .

3.3.2. Score of Each Supplier

Through the consistency detection and modification of the intuitionistic fuzzy decision matrix mentioned above, the revised index weights and importance are listed in Table 9.
According to Table 9, the quality index has the largest weight, which is 0.253. Hence, in the whole evaluation system, the quality factor is the most important aspect. It is followed by the economic and long-term cooperation indexes, and their weight values are 0.245 and 0.218, respectively.
Similar methods can be used to calculate the secondary indexes. The summary of the primary index weights, the secondary index weights, and the total weights are listed in Table 10.
The two expert groups scored the secondary indexes of the four suppliers (S1, S2, S3, S4) involved in the project, and the values are shown in Table 11.
Combining Table 11 and Equation (19), the score vector was obtained as follows:
G = W F T 100 = ( 153.74 , 150.85 , 155.46 , 154.69 )
Therefore, S3 is the most suitable supplier.

4. Discussion

The purpose of this study is to find and verify the potential influencing factors of supplier selection of prefabricated building elements. The results show that there are relative independence and causality among the influencing factors. In order to make the research results more practical, here we do the following discussion
The factors that affect the economy of the prefabricated construction project come from the whole process of elements from production to operation and maintenance. Therefore, the best supplier should have the ability to properly handle any problems arising from the process.
When comparing the standardized values of the first level indicators, the maximum value is 0.892, the minimum value is 0.552, and the value of the standard distance is less than 0.5. Considering the relationship between SEM mediating effect and hypothesis in this study, we can conclude that economy, quality, transportation, after-sales service, long-term cooperation, and other factors are independent in the whole supplier selection process. This finding is consistent with the research of Yang (2001) [20]. In the study of supplier selection, risk identification should be carried out for the whole life cycle of components.
In the calculation results of the first level indicators, it is found that the weight value of the quality system is the largest.
Therefore, in the process of supplier investigation, more attention should be paid to the quality of prefabricated elements. After calculating the weight of secondary indicators, it is found that the weight values of qualified rate and return rate are almost the same. In addition, 67.2% of the employees working in construction enterprises think that the impact of return rate is higher than that of qualified rate on the quality system. Based on the investigation and analysis of this special phenomenon, it is found that, under the policy requirements of the Chinese government, some suppliers may temporarily improve the production quality during quality inspections, but choose to save the material cost in daily production, thus reducing the quality. This causes some suppliers with the highest qualification rate to face return events in actual projects.
The recovery rate determines whether the project schedule is delayed, whether the transportation cost is wasted, and whether there will be disputes in the future contract documents.
Therefore, in the investigation and evaluation of supplier quality system, we should comprehensively consider the product qualification rate, return rate, quality management level, and other indicators [25]. In case of any abnormality in the sample data, the supervision and analysis of the product delivery should be carried out.
In the second cost system, cost is the only principle throughout the supplier selection strategy, which is affected by various factors. The weights of the secondary indicators of the economic system are 0.068, 0.063, 0.079, and 0.062, respectively, and the average difference is not more than 0.01. Therefore, in the stage of cost control, the superimposed cost caused by other factors should be considered, which is also consistent with the research of Ilqbla [22]. One proposed suggestion is to count the price fluctuation of suppliers’ products in recent years to avoid economic disputes during cooperation.
In the studied case of this paper, the weight of the relationship between enterprises and suppliers is relatively high. In the second level indicators of long-term cooperation system, the weight value of supplier enterprise management factor reaches 0.064, which is twice the weight value of enterprise financial level factor. When evaluating the long-term cooperation of suppliers, the management level of enterprises should be considered. A good enterprise organizational structure can ensure that suppliers can develop better even in the face of financial crisis [54].
Supplier’s customer service can play an important role, but it is often ignored. Most companies only consider the cost and quality of products when choosing suppliers. Once there are various levels of risks, without the follow-up technical support from suppliers [16], the construction is likely to be delayed. This study analyzes the after-sales service of suppliers and introduces relevant factors into the index system to reduce the possibility of conflict between construction enterprises and suppliers in terms of legal and economic risks. The weight values of secondary indicators in the after-sales service system are evenly distributed, and the average difference is not more than 0.01. The results show that, when the supplier has advantages in any aspect of the after-sales service system, the service quality of the other aspects will also be higher. In the investigation of after-sales service system of suppliers, a unified decision can be made (Russell, a, F, 2003) [33].
In addition, according to the mediating effect found in this paper, transportation risk can also significantly induce project economic risk. According to the path coefficient of the SEM model, it can be found that the path coefficient of traffic violation rate and delivery reliability is 0.15, showing a positive correlation trend. When it comes to legal issues, transportation problems will not only lead to construction delay, but also face high government fines (Liao, Shu Hsien, 2021) [55]. In addition, that delay depends on the efficiency of the local government. Therefore, when selecting a supplier, in terms of transportation, it is necessary to verify the violation rate of drivers in recent years. If there is transportation risk, the supplier should be able to quickly deliver another batch of goods. In the process of supplier selection, we should strengthen the review of supplier’s route planning and product flexible scheduling ability, so as to minimize the risk of construction delay.

5. Conclusions

5.1. Theoretical and Practical Contributions

Compared with the traditional building mode, the fabricated building mode has the advantages of less pollution, faster construction speed, saving labor work and being economical, and is consistent with China’s sustainable development strategy. The findings of this study have theoretical and practical contributions to academic research and engineering practice.
Theoretically speaking, this study introduces the concept of the whole life cycle of prefabricated elements, that is, from the production stage to the operation stage, all aspects of the possible risks of prefabricated elements in the whole life cycle are considered. As the main theoretical contribution, this study first identified five potential variables and 23 observed variables, which have a significant impact on the selection of component suppliers. Secondly, a comprehensive evaluation factor system suitable for Chinese construction enterprises to choose prefabricated building element suppliers is established, and the SEM model of prefabricated element supplier selection is constructed. Thirdly, through the analysis of the MI value and PC value, the SEM model of supplier selection is modified, and the capability of suppliers in all aspects is evaluated with IFAHP method. The evaluation rules are taken from the supplier evaluation index system of this study, which provides the optimal options and suggestions for the Shuangyashan prefabricated construction project to select the appropriate element suppliers. The research results also provide guidance for the selection of suppliers for similar projects in the future.
From the practical point of view, according to the calculation results of SEM and IFAHP, the research provides important practical significance. First, there are potential links between the factors in the index system, especially the quality system and the transportation system. For example, it is suggested that construction enterprises should not only pay attention to the qualified rate when investigating the quality of suppliers’ products, but also the return rate, so as to prevent some enterprises from using special methods to improve the qualified rate of their products. Second, problems in the transportation system can also affect the supplier’s economic system. When reviewing the supplier’s information, we should pay attention to the intermediary effect between factors and pay attention to the supplier’s financial report.
Finally, this study avoids the problem in which the overall decision-making results are easily affected by individuals and considers the economic problems of subsequent projects of the same enterprise, which will greatly save on the future economic and labor costs.

5.2. Limitations and Further Suggestions

Although the purpose of this study has been achieved, there are still some limitations.
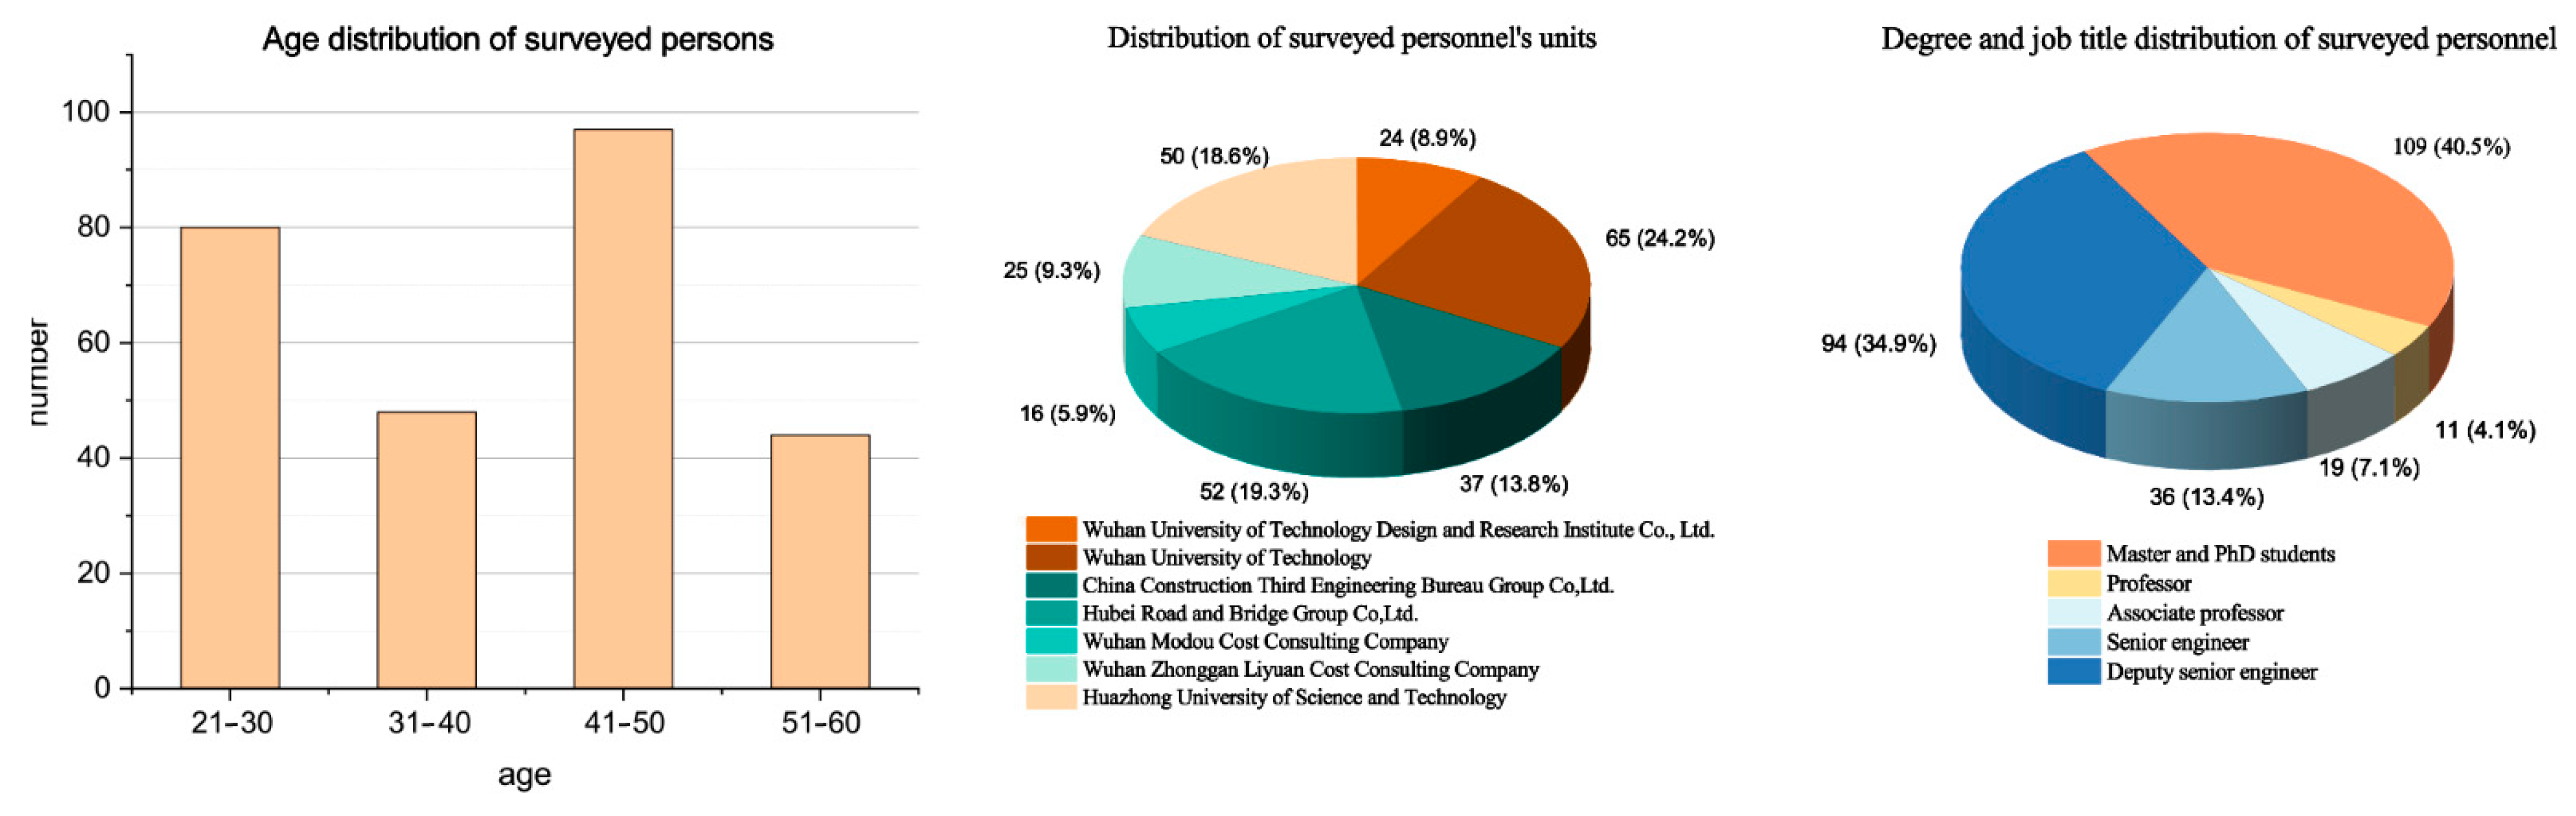
(1) In the questionnaire survey, although the respondents are widely distributed, most of them are in Wuhan area, and their evaluations of enterprises in other areas may be too subjective.
(2) The Chinese government has incentives for prefabricated construction projects, making some results unsuitable for other countries.
Although there are the problems above, the combination method between SEM and IFAHP is proved to be scientific and reasonable through the case study, so the research in this paper is still valuable.
In order to make this research more practical and sustainable, it is necessary to classify policies and regulations in different regions so as to make the evaluation system more comprehensive and make the application of SEM-IFAHP wider.

Author Contributions

Conceptualization, Y.S. and J.W.; Data curation, Y.S. and S.L.; Formal analysis, Y.S.; Funding acquisition, J.W.; Investigation, Y.S. and J.L.; Methodology, Y.S., F.G. and S.L.; Software, F.G.; Supervision, J.W.; Validation, Y.S. and F.G.; Visualization, Y.S.; Writing—original draft, Y.S.; Writing—review and editing, F.G. and J.L. All authors have read and agreed to the published version of the manuscript.

Funding

This study was supported by the Science and Technology Project of Wuhan Urban and Rural Construction Bureau, China (201943).

Institutional Review Board Statement

Not applicable.

Informed Consent Statement

Informed consent was obtained from all subjects involved in the study.

Data Availability Statement

The case analysis data used to support the findings of this study are available from the corresponding author upon request.

Conflicts of Interest

The authors declare no conflict of interest.

Abbreviations

RIARisk Assessment
SEMStructural Equation Model
CITCCorrected Item Total Correlation
IFAHPIntuitionistic Fuzzy Analytic Hierarchy Process
CMIN/dfChi-Square Value
RMRStandardized Root Mean Square Residual
RMSEARoot Mean Square Error Approximation
GFIGoodness-offit
AGFIAdjusted Goodness-offit
TLITucker–Lewis Index Tucker–Lewis
IFIIncremental Fit Index
CFIComparative Fit Index
AVEAverage Variance Extracted
CRConstruct Reliability, CR

References

  1. Nistico, N.; Gkagka, E.E.; Gantes, C.J. Roof Isolation with Tuned Mass-based Systems and Application to a Prefabricated Building. Arab. J. Sci. Eng. 2015, 40, 431–442. [Google Scholar]
  2. Ng, A.; Loosemore, M. Risk allocation in the private provision of public infrastructure. Int. J. Proj. Manag. 2007, 25, 66–76. [Google Scholar] [CrossRef]
  3. Kaliszewski, J. The Project of Building a Concrete Prefabrication Plant Using the Innovative Production Technologies. Ph.D. Thesis, Warsaw University of Technology, Warsaw, Poland, 2019. Available online: https://repo.pw.edu.pl/info/master/WUT3ac3ecc92bf54ef0a55f6bf6ee9f4acc/ (accessed on 13 January 2021).
  4. Qi, B.K.; Zhu, Y.; Fan, W.Y. Life cycle risk identification method for assembled building. J. Shenyang Constr. Univ. Soc. Sci. Ed. 2016, 3, 7. [Google Scholar]
  5. Bai, C.; Sarkis, J. Integrating sustainability into supplier selection with grey system and rough set methodologies. Int. J. Prod. Econ. 2010, 124, 252–264. [Google Scholar] [CrossRef]
  6. Govindan, K.; Aditi; Darbari, J.D.; Kaul, A.; Jha, P.C. Structural model for analysis of key performance indicators for sus-tainable manufacturer-supplier collaboration: A grey-decision-making trial and evaluation laboratory-based approach. Bus. Strateg. Environ. 2021, 30, 1702–1722. [Google Scholar] [CrossRef]
  7. Fischinger, M.; Kramar, M.; Isakovic, T. Seismic safety of prefabricated reinforced-concrete halls-analytical study. Građevinar 2009, 61, 1039–1045. Available online: https://hrcak.srce.hr/43827 (accessed on 17 January 2021).
  8. Huang, Z.; Zhao, W.; Zhang, Y.; Yao, X.; Jia, Q.; Wang, H.; Le, T.; Song, D.; Gao, Y. Comprehensive Safety Evaluation of Emergency Training for Building Ruins Scenario Based on Analytic Hierarchy Process-Grey Fuzzy Evaluation. IEEE Access 2020, 8, 147776–147789. [Google Scholar] [CrossRef]
  9. Seo, H.; Myeong, S. The Priority of Factors of Building Government as a Platform with Analytic Hierarchy Process Analysis. Sustainability 2020, 12, 5615. [Google Scholar] [CrossRef]
  10. Pinto, A. QRAM a Qualitative Occupational Safety Risk Assessment Model for the construction industry that incorporate uncertainties by the use of fuzzy sets. Saf. Sci. 2014, 63, 57–76. [Google Scholar] [CrossRef]
  11. Deng, W.B.; Wang, H.J.; Yuan, Y. Research on Evaluation of Prefabricated Building Component Suppliers Based on Domi-nance-Based Rough Set Approach. In Proceedings of the 6th International Symposium on Project Management (ISPM), Chongqing, China, 21–23 July 2018; Huang, D., Yu, H., Xu, H., Zhang, H., Eds.; Curran Associates, Inc.: Red Hook, NY, USA, 2018; pp. 131–136. [Google Scholar]
  12. Bai, S.Z.; Wang, D.H.; Zhang, S.T. Dynamic Selection of Supplier in Chain Catering Industry. In Proceedings of the 2010 International Conference on Logistics Systems and Intelligent Management (ICLSIM), Harbin, China, 9–10 January 2010. [Google Scholar] [CrossRef]
  13. Chang, C.G.; Zhao, T. GT-SEM-Based Safety Risk Mechanism of Prefabricated Construction. In Proceedings of the 2020 12th International Conference on Communication Software and Networks (ICCSN), Chongqing, China, 12–15 June 2020; pp. 280–284. [Google Scholar] [CrossRef]
  14. Li, X.J. Research on investment risk influence factors of prefabricated building projects. J. Civ. Eng. Manag. 2020, 26, 599–613. [Google Scholar] [CrossRef]
  15. Hong, J.K.; Shen, G.Q.P.; Li, Z.D.; Zhang, B.Y.; Zhang, W.Q. Barriers to promoting prefabricated construction in China: A cost-benefit analysis. J. Clean Prod. 2018, 172, 649–660. [Google Scholar] [CrossRef]
  16. Wei, L.; Xin, L. Analysis on the Countermeasures of Residence Industrialization with Supply Chain Theory. In Proceedings of the 2017 International Conference on Smart Grid and Electrical Automation (ICSGEA), Changsha, China, 27–28 May 2017; pp. 645–647. [Google Scholar] [CrossRef]
  17. Wang, Y.W.; Wang, Y.Q.; Shen, Q.P. A Performance Assessment Model for Green Residential Supply Chain Based on Life Cycle Theory. In Proceedings of the 2009 International Conference on Construction and Real Estate Management, Beijing, China, 5–6 November 2009; China Architecture&Building Press: Beijing, China, 2009. [Google Scholar]
  18. Cheng, Q.Z. Investment control of prefabricated building. Urban. Archit. 2017, 5, 210–211. [Google Scholar] [CrossRef]
  19. Weishu, Z.; Beibei, Z.; Yang, Y. Empirical study of comprehensive benefits for prefabricated buildings: A case study of Hefei city. Int. J. Electr. Eng. Educ. 2020, 0020720920928465. [Google Scholar] [CrossRef]
  20. Yang, S.H.; Yashiro, T.; Nishimoto, K. Industrial ecology in off-site building component industry: Case study on bathroom units sectors. In Proceedings of the Second International Symposium on Environmentally Conscious Design and Inverse Manufacturing, Tokyo, Japan, 11–15 December 2001; Institute of Electrical and Electronics Engineers: New York, NY, USA, 2002; pp. 886–891. [Google Scholar] [CrossRef]
  21. Zhang, Y.G.; Tang, J.; Liao, R.P.; Zhang, M.F.; Zhang, Y.; Wang, X.M.; Su, Z.Y. Application of an enhanced BP neural network model with water cycle algorithm on landslide prediction. Stoch. Environ. Res. Risk Assess. 2020, 1–19. [Google Scholar] [CrossRef]
  22. IIqbal, S.; Choudhry, R.M.; Holschemacher, K.; Ali, A.; Tamošaitienė, J. Risk management in construction projects. Technol. Econ. Dev. Econ. 2015, 21, 65–78. [Google Scholar] [CrossRef]
  23. Alnuaimi, A.S.; Taha, R.A.; Al Mohsin, M.; Al-Harthi, A.S. Causes, effects, benefits, and remedies of change orders on public construction projects in Oman. J. Constr. Eng. Manag. 2010, 136, 615–622. [Google Scholar] [CrossRef]
  24. Feng, Q.; Shi, R. Sourcing from multiple suppliers for price-dependent demands. Prod. Oper. Manag. 2012, 21, 547–563. [Google Scholar] [CrossRef]
  25. Lehmann, S. Sustainable Construction for Urban Infill Development Using Engineered Massive Wood Panel Systems. Sustainability 2012, 4, 2707–2742. [Google Scholar] [CrossRef] [Green Version]
  26. Mukhopadhyay, S.K.; Setoputro, R. Optimal return policy and modular design for build-to-order products. J. Oper. Manag. 2005, 23, 496–506. [Google Scholar] [CrossRef]
  27. Tong, X.; Wang, Z.; Xie, H.; Liang, D.; Jiang, Z.; Li, J.; Li, J. Designing a two-rank acceptance sampling plan for quality inspection of geospatial data products. Comput. Geosci. 2011, 37, 1570–1583. [Google Scholar] [CrossRef]
  28. Lei, H.; Tan, Y.T.; Luo, W.K.; Xu, S.; Mao, C.; Moon, S. Towards a more extensive application of off-site construction: A technological review. Int. J. Proj. Manag. 2020, 1–12. [Google Scholar] [CrossRef]
  29. Kumar, P.R.; Seidman, T.I. Dynamic instabilities and stabilization methods in distributed real-time scheduling of manufacturing systems. In Proceedings of the 28th IEEE Conference on Decision and Control, Tampa, FL, USA, 13–15 December 1989; Institute of Electrical and Electronics Engineers: New York, NY, USA, 2002; Volume 3, pp. 2028–2031. [Google Scholar] [CrossRef]
  30. Sheffi, Y.; Rice, J.B., Jr. A supply chain view of the resilient enterprise. MIT Sloan Manag. Rev. 2005, 47, 41–48. [Google Scholar]
  31. Aloini, D.; Dulmin, R.; Mininno, V.; Ponticelli, S. Key antecedents and practices for Supply Chain Management adoption in project contexts. Int. J. Proj. Manag. 2015, 33, 1301–1316. [Google Scholar] [CrossRef]
  32. Cannon, J.P.; Doney, P.M.; Mullen, M.R.; Petersen, K.J. Building long-term orientation in buyer–supplier relationships: The moderating role of culture. J. Oper. Manag. 2010, 28, 506–521. [Google Scholar] [CrossRef]
  33. Russell, A.F.; Sharpe, L.L.; Brotherton, P.N.M.; Clutton-Brock, T.H. Cost minimization by helpers in cooperative vertebrates. Proc. Natl. Acad. Sci. USA 2003, 100, 3333–3338. [Google Scholar] [CrossRef] [PubMed] [Green Version]
  34. Neely, A. Exploring the financial consequences of the servitization of manufacturing. Oper. Manag. Res. 2008, 1, 103–118. [Google Scholar] [CrossRef] [Green Version]
  35. Sampson, S.E. Customer-supplier duality and bidirectional supply chains in service organizations. Int. J. Serv. Ind. Manag. 2000, 11, 348–365. [Google Scholar] [CrossRef]
  36. Tchidi, M.F.; He, Z.; Li, Y.B. Process and quality improvement using six sigma in construction industry/Proceso tobulinimas ir kokybės gerinimas statybų sektoriuje taikant šešių sigma metodą. J. Civ. Eng. Manag. 2012, 18, 158–172. [Google Scholar] [CrossRef]
  37. Castro-Schilo, L.; Grimm, K.J.; Widaman, K.F. Abstract: Uncrossing the Correlated Trait-Correlated Method Model for Multitrait-Multimethod Data. Appl. Ecol. Environ. Res. 2013, 48, 152. [Google Scholar] [CrossRef]
  38. Liu, K.; Zhao, P.; Wang, H. Application of SEM based prefabricated concrete structure. J. Civ. Eng. Manag. 2017, 34, 106–112. [Google Scholar]
  39. Zheng, S.Q.; Wang, D.F.; Zuo, Q.L.; He, Q. Research on Influencing Factors of prefabricated building cost based on SEM. Proj. Manag. Technol. 2016, 14, 45–49. [Google Scholar]
  40. Kamal, A.; Azfar, R.W.; Salah, B.; Saleem, W.; Pruncu, C.I. Quantitative Analysis of Sustainable Use of Construction Materials for Supply Chain Integration and Construction Industry Performance through Structural Equation Modeling (SEM). Sustainability 2021, 13, 522. [Google Scholar] [CrossRef]
  41. Zadeh, L.A. Fuzzy sets. Inf. Control. 1965, 8, 338–356. [Google Scholar] [CrossRef] [Green Version]
  42. Atanassov, K.T. Intuitionistic fuzzy sets. Int. J. Bioautom. 2016, 20, 1–6. [Google Scholar]
  43. Xu, Z.S.; Liao, H.C. Intuitionistic fuzzy analytic hierarchy process. IEEE Trans. Fuzzy Syst. 2013, 22, 749–761. [Google Scholar] [CrossRef]
  44. Barroso, A.; Gonzalez-Lopez, O.R.; Sanguino, R.; Buenadicha-Mateos, M. Analysis and Evaluation of the Largest 500 Family Firms’ Websites through PLS-SEM Technique. Sustainability 2018, 10, 557. [Google Scholar] [CrossRef] [Green Version]
  45. Huang, Y.; Wu, W.; Yang, S. Sustainable development of green building based on intuitionistic fuzzy analytic hierarchy process. Appl. Ecol. Environ. Res. 2019, 17, 1093–1108. [Google Scholar] [CrossRef]
  46. Hair, J.F.; Hult, G.T.M.; Ringle, C.; Sarstedt, M. A Primer on Partial Least Squares Structural Equation Modeling (PLS-SEM); Sage Publications: Thousand Oaks, CA, USA, 2016; Chapter 1; ISBN 9781483377438. [Google Scholar]
  47. Nikolaou, P.; Basbas, S.; Politis, I.; Borg, G. Trip and Personal Characteristics towards the Intention to Cycle in Larnaca, Cyprus: An EFA-SEM Approach. Sustainability 2020, 12, 4250. [Google Scholar] [CrossRef]
  48. Leguina, A. A Primer on Partial Least Squares Structural Equation Modeling (PLS-SEM). Int. J. Res. Method Educ. 2015, 38, 220–221. [Google Scholar] [CrossRef]
  49. Neumüller, C.; Lasch, R.; Kellner, F. Integrating sustainability into strategic supplier portfolio selection. Manag. Decis. Econ. 2016, 54, 194–221. [Google Scholar] [CrossRef]
  50. Seo, H.C.; Lee, Y.S.; Kim, J.J.; Jee, N.Y. Analyzing safety behaviors of temporary construction workers using structural equation modeling. Saf. Sci. 2015, 77, 160–168. [Google Scholar] [CrossRef]
  51. Gunduz, M.; Birgonul, M.T.; Ozdemir, M. Development of of a safety performance index assessment tool by using a fuzzy structural equation model for construction sites. Autom. Constr. 2018, 85, 124–134. [Google Scholar] [CrossRef]
  52. Hsu, I.Y.; Su, T.S.; Kao, C.S.; Shu, Y.L.; Lin, P.R.; Tseng, J.M. Analysis of business safety performance by structural equation models. Saf. Sci. 2012, 50, 1–11. [Google Scholar] [CrossRef]
  53. Zaira, M.M.; Hadikusumo, B.H.W. Structural equation model of integrated safety intervention practices affecting the safety behaviour of workers in the construction industry. Saf. Sci. 2017, 98, 24–135. [Google Scholar] [CrossRef]
  54. Ahmed, W.; Ashraf, M.S.; Khan, S.A.; Kusi-Sarpong, S.; Arhin, F.K.; Kusi-Sarpong, H.; Najmi, A. Analyzing the impact of environmental collaboration among supply chain stakeholders on a firm’s sustainable performance. Oper. Manag. Res. 2020, 13, 4–21. [Google Scholar] [CrossRef]
  55. Liao, S.H.; Hu, D.C.; Shih, Y.S. Supply chain collaboration and innovation capability: The moderated mediating role of quality management. Total. Qual. Manag. Bus. Excell. 2021, 32, 298–316. [Google Scholar] [CrossRef]
Figure 1. Flow chart of the method for selecting suppliers of prefabricated building components.
Sustainability 13 06080 g001
Figure 2. Supplier selection index diagram.
Sustainability 13 06080 g002
Figure 3. The age, degree, job title, and location of the surveyed persons.
Sustainability 13 06080 g003
Figure 4. The relationship between structural model and measurement model.
Sustainability 13 06080 g004
Figure 5. Latent variable mediating effect model.
Sustainability 13 06080 g005
Figure 6. Prefabricated building component suppliers choose a high-order mediation effect model.
Sustainability 13 06080 g006
Table 1. Evaluation index system for supplier selection of prefabricated building components.
Latent VariableVariable SymbolObserved VariableVariable SymbolLabelPoint Range
Economic SystemESShipping feeES1e1One point to five point
Component costES2e2
Price fluctuationsES3e3
Storage lossES4e4
Quality SystemQSComponent qualification rateQS1e5
Component return rateQS2e6
Manufacturing standardizationQS3e7
Quality ManagementQS4e8
Quality problem rate of construction processQS5e9
Transportation SystemTSTraffic violation rateTS1e10
Flexible supply schedulingTS2e11
Transport standardizationTS3e12
On-time delivery rateTS4e13
Long-term CooperationLPEnterprise financial levelLP1e14
Process innovationLP2e15
Corporate management capabilitiesLP3e16
Ease of Enterprise InnovationLP4e17
Enterprise production qualificationLP5e18
Production equipment standardsLP6e19
After-sales SystemASAfter-sales abilityAS1e20
Technical SupportAS2e21
Problem-solving efficiencyAS3e22
After-sales trackingAS4e23
Table 2. The relationship between the evaluation results and the intuitionistic fuzzy number.
Evaluation ResultIntuitionistic Fuzzy NumberEvaluation ResultIntuitionistic Fuzzy Number
Extremely important(0.90, 0.10)Less important(0.40, 0.45)
Very important(0.80, 0.15)Unimportant(0.30, 0.60)
Important(0.70, 0.20)Very unimportant(0.20, 0.75)
More important(0.60, 0.25)Extremely unimportant(0.10, 0.90)
Equally important(0.50, 0.30)--
Table 3. Validation test of survey data.
VariableStandardized ValuesCRAVE
ES10.7270.86110.6085
ES20.83
ES30.807
ES40.752
QS10.8210.88630.6109
QS20.828
QS30.816
QS40.773
QS50.657
TS10.640.8020.5052
TS20.647
TS30.79
TS40.754
LP10.8720.91880.6555
LP20.873
LP30.854
LP40.773
LP50.66
LP60.805
AS10.8060.90160.6963
AS20.837
AS30.852
AS40.843
Table 4. Reliability statistics and KMO and Bartlett test.
Kronbach AlphaKronbach Alpha Based on Standardized TermsNumber of Items
0.8380.83823
KMO sampling appropria teness number0.857
Bartlett sphericity testApproximate chi-square3302.216
Degree of freedom253
Significance0
Table 5. Fitting index matching checklist.
Fitting IndexAcceptable RangeTest ResultSuitability
CMIN/DF<3.01.473yes
RMR<0.050.048yes
RMSEA<0.050.042yes
GFI>0.900.907yes
AGFI>0.900.901yes
IFI>0.900.968yes
TLI>0.900.962yes
CFI>0.900.968yes
Table 6. Evaluation of the normality of the observed variables in the modified model.
VariableMinMaxSkewc.r.Kurtosisc.r.
AS43.0005.0000.3132.094−0.615−2.054
AS31.0005.0000.3392.268−0.363−1.215
AS22.0005.0000.2271.514−0.665−2.221
AS11.0005.0000.2231.491−0.504−1.684
LP61.0005.0000.3712.478−0.470−1.572
LP52.0005.0000.4412.944−0.779−2.603
LP41.0005.0000.2911.947−0.555−1.855
LP31.0005.0000.3972.650−0.662−2.212
LP23.0005.0000.7995.3400.0090.031
LP13.0005.0000.6854.577−0.672−2.247
TS41.0005.000−0.052−0.349−0.900−2.998
TS31.0005.0000.1060.706−0.482−1.610
TS21.0005.0000.4362.916−0.441−1.473
TS12.0005.0000.2931.962−0.368−1.230
QS52.0005.0000.4412.944−0.779−2.603
QS41.0005.0000.2911.947−0.555−1.855
QS32.0005.0000.3972.650−0.662−2.212
QS23.0005.0000.7995.3400.0090.031
QS12.0005.0000.6854.577−0.672−2.247
ES41.0005.0000.0400.266−0.721−2.410
ES31.0005.0000.4482.996−0.707−2.362
ES21.0005.0000.4112.746−0.321−1.073
ES11.0005.0000.3862.578−0.341−1.138
Multivariate 10.6502.571
Table 7. Correction model path and significance test results.
RoutingEstimateS.E.C.R.PEstimate (Standardized)
ES1<---Economic system1 0.695
ES2<---Economic system1.1460.11210.213***0.771
ES3<---Economic system1.1620.1279.128***0.729
ES4<---Economic system0.9720.1138.634***0.655
QS1<---Quality system1 0.882
QS2<---Quality system0.8860.04619.37***0.879
QS3<--- Quality system0.8860.05217.087***0.817
QS4<---Quality system0.6830.05213.238***0.696
QS5<---Quality system0.5080.0529.675***0.552
TS1<--- Transportation System1 0.892
TS2<--- Transportation System0.8060.07410.936***0.725
TS3<--- Transportation System0.5870.0698.469***0.571
TS4<--- Transportation System0.670.0818.229***0.552
LP1<---Long-term Cooperation1 0.870
LP2<---Long-term Cooperation0.8940.04818.573***0.874
LP3<---Long-term Cooperation0.9160.05317.203***0.833
LP4<---Long-term Cooperation0.6980.05313.182***0.702
LP5<---Long-term Cooperation0.5220.0549.697***0.558
LP6<---Long-term Cooperation0.7610.05713.352***0.708
AS1<---After-sales System1 0.706
AS2<---After-sales System1.4560.11412.731***0.853
AS3<---After-sales System1.4220.1112.942***0.873
AS4<---After-sales System1.3280.11511.54***0.763
Notes: *** Indicating the probability of getting a critical ratio as large as C.R. value in absolute value is less than 0.001.
Table 8. Comparative results of the importance of the evaluation indicators.
IndicatorA1A2A5A3A4
A1(0.50, 0.30)(0.40, 0.45)(0.60, 0.25)(0.90, 0.10)(0.70, 0.20)
A2(0.60, 0.25)(0.50, 0.30)(0.60, 0.25)(0.90, 0.10)(0.70, 0.20)
A3(0.10, 0.90)(0.10, 0.90)(0.20, 0.75)(0.50, 0.30)(0.30, 0.60)
A4(0.40, 0.45)(0.40, 0.45)(0.50, 0.30)(0.80, 0.15)(0.60, 0.25)
A5(0.30, 0.60)(0.30, 0.60)(0.40, 0.45)(0.70, 0.20)(0.50, 0.30)
Table 9. The importance levels of the corrected evaluation indicators and weighting results.
IndicatorA1A2A3A4A5
A1(0.500, 0.300)(0.400, 0.450)(0.876, 0.079)(0.544, 0.230)(0.673, 0.158)
A2(0.517, 0.329)(0.500, 0.300)(0.875, 0.073)(0.600, 0.250)(0.696, 0.137)
A3(0.075, 0.874)(0.075, 0.874)(0.500, 0.300)(0.122, 0.767)(0.241, 0.658)
A4(0.285, 0.478)(0.311, 0.535)(0.788, 0.104)(0.500, 0.300)(0.600, 0.250)
A5(0.192, 0.628)(0.168, 0.652)(0.700, 0.200)(0.311, 0.535)(0.500, 0.300)
ωj(0.145, 0.761)(0.151, 0.752)(0.048, 0.902)(0.117, 0.787)(0.088, 0.827)
H(ωj)0.2110.2270.1910.1880.193
σj0.2450.2530.1040.2180.179
Rank21534
Table 10. Total weight of each level.
Index LayerIndex WeightSecondary Indicator LayerSecondary Index WeightTotal Weight
A10.245A110.3250.068
A120.3000.063
A130.3750.079
A140.2970.063
A20.253A210.2540.056
A220.2210.049
A230.2590.057
A240.2670.059
A250.2180.048
A30.104A310.3420.064
A320.3590.067
A330.3000.056
A340.2830.062
A40.218A410.1600.031
A420.1650.032
A430.1650.032
A440.3330.064
A450.1800.035
A460.1640.032
A50.179A510.3000.056
A520.3750.071
A530.2690.059
A540.3250.062
Table 11. Score of each secondary indicator.
Index NameS1S2S3S4
A110.2330.2440.250.263
A120.250.2420.2380.271
A130.2540.240.2380.263
A140.2310.2370.2420.203
A210.2380.2540.250.258
A220.2540.2540.2380.254
A230.2380.250.2420.271
A240.2420.2670.250.242
A250.2570.2390.2420.217
A310.2630.2460.2420.25
A320.250.2460.2380.267
A330.2380.2580.250.254
A340.2610.2310.2720.192
A410.250.2420.2460.263
A420.2540.2380.2460.258
A430.2460.2460.2460.263
A440.2540.2380.2630.246
A450.2380.2630.2420.254
A460.2160.1370.2840.216
A510.2540.2460.2550.246
A520.2540.2420.2460.259
A530.2470.2390.2550.211
A540.2330.2330.2670.267
Publisher’s Note: MDPI stays neutral with regard to jurisdictional claims in published maps and institutional affiliations.

