Abstract
Damage in reinforced concrete structures is frequently caused by reinforcement corrosion due to carbonation. Although a wide range of literature contributed to the concrete carbonation consisting of experimental investigations and numerical simulations, research work on a complete numerical model for concrete carbonation prediction with integrated climatic variables (e.g., temperature, relative humidity) is still a challenge. The present paper aims to propose an advanced numerical model to simulate the penetration of carbon dioxide and moisture, diffusion of calcium ions, heat transfer, and porosity modification in concrete material using COMSOL Multiphysics software. Three coupled mass conservation equations of calcium, water, and carbon dioxide are solved together with additional equations regarding the heat transfer, variation of porosity, and content of portlandite and other hydrates and calcites. In this study, the actual temporal variabilities of temperature and relative humidity in Toulouse, France, are used as a case study. The predicted results of portlandite profiles and carbonation depth are compared with the experimental data and discussed to identify the effect of climatic variables on the concrete carbonation.
1. Introduction
Invented in the late nineteenth century, reinforced concrete (RC) is today the most widespread building material in the world. Unfortunately, during the service life of existing structures (e.g., buildings, bridges, tunnels), the deterioration of RC elements occurs due to many factors including structural loads, quality of materials, environmental conditions, etc. [1,2]. Furthermore, the impact of climate change (e.g., global warming) on existing RC structures is considerable, since the corrosion deteriorations induce an increase in repair cost. The elevated carbon dioxide (CO2) levels related to global warming can increase the potential of carbonation-induced corrosion. Reinforcement corrosion is one of the most dominant deterioration mechanisms. It inflicts damages that lead to a decrease in the performance as well as the safety of existing structures [3]. Corrosion attacks can be classified into two sources, which are the carbonation of concrete and the penetration of chloride ions. The carbonation of concrete implies a potential risk in the durability of RC structures if the carbonation depth reaches the steel rebars [4].
Carbon dioxide in gaseous form in the atmosphere penetrates the porous network of concrete. In contact with the pore solution, the CO2 dissolves and causes a chemical reaction with hydrated cement paste. This reaction transforms the hydration products (e.g., portlandite, calcium silicate hydrates) into calcium carbonate. The carbonation kinetics depend on the concrete mix (e.g., cement type, cement content, water/cement ratio) and exposure conditions (e.g., concrete surface sheltered or not from rain, relative humidity) [5,6,7,8,9]. During carbonation, the pore solution pH of concrete should be below 9.0 for a fully carbonated zone [10]. This process can induce the destabilization of the passive film on the rebar surface. Steel corrosion can then be initiated according to the conditions of humidity and oxygen, which causes disturbances in the mechanical behavior of concrete structures and may lead to cracking [11,12].
The carbonation issue has been intensively investigated for decades, mainly in accelerated conditions (high relative pressure of carbon dioxide) due to its slowness in atmospheric conditions. Although the findings of these investigations have brought significant and valuable knowledge, some aspects of the phenomenon remain comprehensively unelucidated. The kinetics and type of hydrated compounds carbonated are drastically different with respect to the exposure conditions. The constant fluctuation of relative humidity and temperature in outdoor conditions is often reduced to an average effect. The diffusion of calcium ions in the pore solution, from the dissolution site to the reactive site, should be taken into account in the carbonation models [13]. Climate change, the impact of which on concrete structures is expected to increase over the century, ought to be more extensively investigated, in particular the thermo-activation on reactions [14,15]. The present paper addresses these aspects from the numerical viewpoint.
Numerous models have been developed to estimate the carbonation depth of concrete, which are classified by either the approach or the targeted objective. Simplified models were established [16,17,18,19,20,21,22] to provide easy-to-use tools for engineers that estimate the carbonation depth with an acceptable precision using a limited number of input parameters. In general, these models were based on the assumption that the partial pressure of carbon dioxide varies linearly from the exposed surface of the material to the carbonation front. The carbonation depth is thus a square root function of time. Meanwhile, the numerical models of concrete carbonation have been also developed by many researchers [7,9,23,24,25,26,27,28,29]. The numerical models aim to describe the phenomena involved as well as various influencing factors using a more detailed approach than the simplified models. These models are mainly based on solving the mass conservation equations and require implementation in a calculation program.
Among the numerical carbonation models developed in the recent research works, Bary et al.’s model has been the most promising regarding the aspects previously mentioned [26,27]. This model couples the transfer of carbon dioxide in the gaseous phase with the transfers of liquid water and calcium ions in an aqueous solution. The chemical model of hydrate leaching is only governed by the concentration of calcium ions. The approach used makes it possible to take into account the carbonation of all hydrated phases consisting of portlandite, C-S-H, ettringite (AFt or trisulfoaluminate), and monosulfoaluminate (AFm). The mass conservation equations in the model of Bary et al. 2004 [26] have been considered in this study. In addition, specific developments have been achieved to account more realistically for outdoor exposure conditions. The results over a long time of exposure are given through various profiles (hydrated compounds, porosity, saturation degree, calcite, etc.). Results show how the computed carbonation rate is influenced by both the boundary conditions and the usually accepted assumptions.
The present study aims to propose an advanced numerical model to simulate the penetration of carbon dioxide and moisture, diffusion of calcium ions, heat transfer, and porosity modification in conventional concrete. The predictions of portlandite profile and carbonation depth are compared with the experimental data. Then, the proposed model has been applied to two concretes having compressive strengths measured on cylindrical specimens that correspond to C25 and C45 classes according to European standard EC2. Furthermore, the actual temporal variabilities of temperature and relative humidity in Toulouse, France, are used as a case study to identify the effect of climatic variations on concrete carbonation.
2. Numerical Model of Concrete Carbonation
The model proposed by Bary and Sellier 2004 [26] assumes that a volume of concrete is composed of three phases (liquid, solid, and gas), and the chemical reactions of dissolution, solidification, vaporization, and liquefaction occur at the interface between these phases. In this model, the phenomena are considered, such as water permeability of the porous medium, diffusion of CO2 in the gas phase of the pore solution, migration of calcium ions in the liquid phase, gradual decalcification by the dissolution of hydrated cement paste, formation of calcite by reaction between calcium ions and dissolved CO2, and variation in porosity due to both decalcification and formation of calcite. The modeling approach proposed is based on the coupling of three equations of mass conservation for water, carbon dioxide, and calcium.
2.1. Mass Conservation Equations
The model is based on three equations of mass conservation that are written for the contents of water, carbon dioxide, and calcium in the concrete medium. These parameters are characterized by the degree of water saturation, the partial pressure of carbon dioxide in the interstitial gas phase, and the concentration of calcium ions in the pore liquid phase [26,27]. The mass conservation equations are shown in detail for each parameter in the next paragraphs.
2.1.1. Mass Conservation of Water
The mass variation of water (liquid phase) in a unit volume during a time interval (dt) is based on the water mass flow (devoted wl) and the amount of water released (devoted Sl) with the hydrates dissolution, as expressed in Equation (1) with Sr being the saturation degree, ρl (kg/m3) being the density of water, and ϕ being the porosity.
The water mass flow wl is given by Equation (2), with Kϕ (m2) being the intrinsic permeability of the material, η (kg/m.s) being the dynamic viscosity coefficient of water, krl being the relative permeability that depends on the saturation degree Sr of concrete [30], pcap (Pa) being the capillary pressure, and hr being the relative humidity.
The water released Sl through the hydrates dissolution is expressed in Equation (3), with ksl being the coefficient for the influence of the saturation degree on the reaction process [31] (due to the variation of the contact surface between water and hydrates), (kg/mol) is the molar mass of water, the term nw refers to the concentration of water involved in the solid phase dissolution by unit volume of material, and its value depends on the calcium concentration Ca (mol/m3) in the pore solution [6,32,33].
Finally, the equation of water mass conservation is expressed as follows:
2.1.2. Mass Conservation of Carbon Dioxide
The mass variation of carbon dioxide in a volume unit during a time interval (dt) depends on the carbon dioxide mass flow (devoted wc) through the volume and on its consumption by the chemical reaction to form calcite (devoted Sc), as expressed in Equation (5), with ρc (kg/m3) being the density of carbon dioxide and ϕ being the porosity.
The CO2 mass flow wc is expressed in Equation (6) with (m2/s) being the diffusion coefficient of CO2 in the air, being a factor of diffusion resistance, Mc (kg/mol) being the molar mass of carbon dioxide, R (m2·kg/mol·K·s2) being the ideal gas constant, T (K) being the temperature, and pc being the capillary pressure [26,34].
The CO2 mass precipitated SC from the pore solution per unit of time to form calcite is given by Equation (7), with ncal being the molar formation rate of calcite.
Thus, the equation of the mass conservation of carbon dioxide can be rewritten as follows:
2.1.3. Mass Conservation of Calcium
The variation of calcium concentration Ca in the porous solution is expressed in Equation (9) for a volume unit, with wa being the flux of calcium ions and Sa being the source term of the production of calcium ions released from the hydrates during the decalcification process [35].
The flux of calcium ions through the porous solution the calcium flux derives from the concentration gradient is determined by Equation (10), with being the effective diffusion coefficient of calcium ions in the pore solution that depends on both the saturation degree and the porosity.
The calcium ions production Sa is partially offset by calcium consumption through the formation of calcite as expressed in Equation (11), with nCaS (mol/m3) being the concentration of calcium in the solid phase in a unit volume of a porous material.
Through this mass balance equation, the concentration of calcium ions in the porous solution, as well as the concentration of calcium in the solid phase of the porous material, is calculated depending on the water flow, the calcium ions flow, and the calcite formation and hydrates dissolution rates.
2.2. Additional Equations
In order to assess detailed evolutions in the porous material, the additional equations are also used for the porosity variation, the content of portlandite, other hydrates, and calcite.
2.2.1. Equation of Porosity Variation
The porosity variation is due to a difference in molar volume between the initial products (hydrates) and final products (calcite, vaterite, aragonite) of the carbonation process. The dissolution of one mole of portlandite releases one mole of calcium that precipitates in one mole of calcite. The ratio is somehow different for other hydrates (including C-S-H, aluminates, ettringite, etc.). The difference between the molar volumes of these components induces a decrease in the material porosity. This variation is modeled by Equation (12), in which VdS (m3/mol) is the volume fraction of dissolved hydrates in a unit volume of the hydrated material, Ca (mol/m3) is the concentration of calcium ion in the aqueous phase, and (37 × 10−6 m3/mol) is the molar volume of calcite [17].
2.2.2. Equation of Hydrates Dissolution Rate
The hydrates of cement paste are dissolved during the carbonation process, and the kinetic of the solubilization depends on the dissolved carbon dioxide and the saturation degree. Different kinds of kinetics for portlandite and other hydrates have been considered here, due to the high dependency of the global carbonation kinetics on the dissolution of portlandite.
● Portlandite Dissolution Rate
The kinetics of portlandite dissolution is highly important to assess the carbonation degradation, because this hydrate is the most sensitive to any chemical disorder and is responsible for the basic pH of concrete. Therefore, carbonation depth estimation is based on the portlandite dissolution. In this study, a different kinetic is proposed for portlandite and other hydrates, as in Equation (13) proposed by Thiery 2005 [7] and Bary and Mügler 2006 [27].
where kH (mol·m−3·Pa−1) is Henry’s constant for carbon dioxide [33,35] and kCH is the kinetic coefficient for portlandite dissolution [7,27], depending on the current volume fraction of portlandite (Vp). This coefficient expresses the formation and growth of a calcite layer around spherical portlandite crystals during the carbonation process. Thus, the kinetic coefficient decreases as the calcite layer grows:
where Vp (m3/mol) is the current volume fraction of portlandite; Rp0 (m) is the equivalent radius of the initial portlandite crystals; and (m3/mol) are portlandite and calcite molar volumes; λ stands for the equivalent thickness of the calcite layer.
The degradation index kp (m) is determined following Equation (15):
where: nCH,0 and nCH (mol/m3) are the initial and remaining amount of portlandite per unit volume, respectively.
● Other Hydrates Dissolution Rate
All other hydrates are assimilated to C-S-H. The dissolution kinetic is assumed to depend linearly on the carbon dioxide pressure.
where kCSH is the kinetic coefficient of hydrates dissolution that is calculated for C-S-H, aluminates, and ettringite as Equation (17) [7,27].
where αCSH is a model’s coefficient; nCSH,0 and nCSH (mol/m3) are the initial and current amounts of other hydrates assimilated to C-S-H, respectively.
2.2.3. Equation of Calcite Formation Rate
The molar velocity of calcite formation is expressed by the rate of dissolution of molar portlandite and other hydrates (C-S-H mainly), introducing αHYD a coefficient of equivalent stoichiometry for calcium in hydrates (but portlandite) and calcite.
2.2.4. Carbonation Depth
The carbonation depth is estimated through the amount of remaining portlandite in the material. The damaged area is assimilated to the part of the material where the portlandite concentration is less than 10% of the initial amount for the accelerated carbonation [17,27] and less than 50% for the atmospheric carbonation.
3. Validation of Numerical Model
Two-dimensional simulation is performed using COMSOL Multiphysics software for modeling the carbonation process into a concrete structure of 10 cm length × 10 cm width × 1 cm height, with a regular spacing of 1.0 mm between nodes. The direction of carbonation is estimated according to the two sections 1-1 and 2-2, as shown in Figure 1. The mesh at the corner of the model is illustrated in Figure 2.
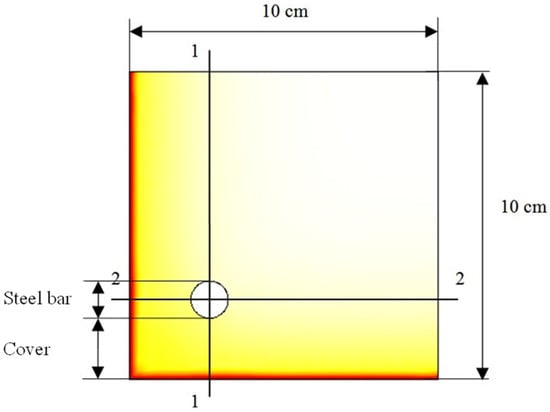
Figure 1.
Two-dimensional geometric model of reinforced concrete structure.
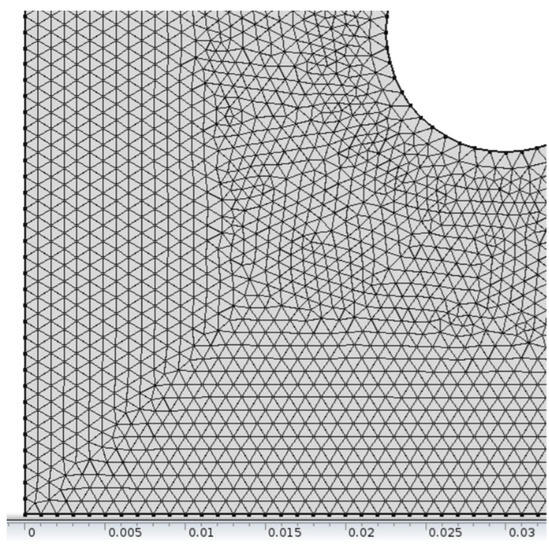
Figure 2.
Illustration of the mesh at the corner of the model.
The first case is studied for the concrete carbonation under atmospheric conditions. The material is totally saturated and then exposed on one face to the outdoor relative humidity of 65% and temperature of 20 °C. Material is broadly equivalent to the concrete that is made of cement CEM I with a water–cement ratio of 0.42. The input parameters of the model can be found in the study conducted by Bary and Mügler 2006 [27]. The predicted carbonation depth over 230 days using the proposed model is compared to that of the existing models [27,28], which are based on the same equations under constant exposure conditions. Figure 3 presents the evolution of predicted carbonation depth in time by the proposed model and two existing models. The obtained results in Figure 3 show that the carbonation depth predictions are greatly fitting between these models.
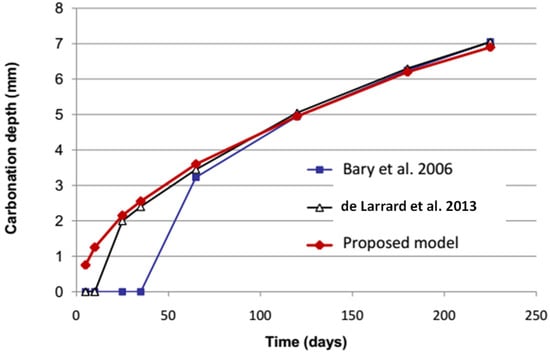
Figure 3.
Comparison of carbonation depth prediction between numerical models.
The second case is employed to study accelerated carbonation. The comparison between the predicted results and the experimental results from the study of Thiery 2005 [7] illustrated in Figure 4 does not show a good agreement for portlandite profile at 14–day exposure. Nevertheless, it must be kept in mind that predictions should be regarded in the context of possible uncertainties of many input parameters (obtained from the experimental process), which would lead to estimate a confidence interval of outputs in place of a single result. Such an approach is beyond the scope of the present paper.
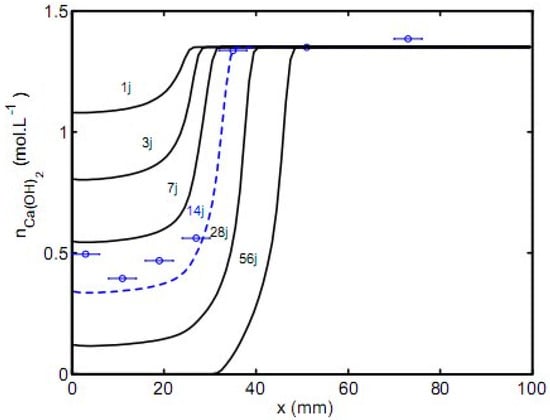
Figure 4.
Comparison of predicted portlandite profile with the experimental data by thermogravimetric analysis after 14 days for accelerated carbonation (day denoted j).
4. Modeling of Temperature Variation
4.1. Modeling the Effect of Temperature on the Kinetics
The temperature has an influence on the process of water sorption/desorption, the diffusion of ions, the flow of gaseous and liquid phases, and the chemical transformations [36]. Therefore, many parameters and variables of the model vary under temperature variations.
The diffusion coefficient for CO2 increases with temperature according to a classical Arrhenius law as follows:
where QD = 39 kJ/mol is the activation energy for the diffusion process; R is the gas constant; Tref = 298 K is a reference temperature [5,28].
The chemical stability of portlandite (as well as other hydrates) decreases when the temperature increases, which is modeled by Arrhenius law with a negative activation energy QCH to be −40 kJ/mol [31,37,38]:
The coefficient of Henry’s law describing the equilibrium between the gas and liquid phase of CO2 is altered according to temperature, with an activation energy QH to be 19.95 kJ/mol [39], as follows:
Water viscosity decreases with increasing temperature [40,41], which corresponds to a negative activation energy Qη to be −15.7 kJ/mol, as follows:
The last point is that the temperature modifies the sorption–desorption isotherms [37,41]. Therefore, we propose to correct the isotherms with an Arrhenius equation where the activation energy Qs depends on water pressure and temperature according to the functions presented in Van Balen and Van Gemert 1994 [24] and Ishida et al. 2007 [37], inspired by the study by Poyet and Charles 2009 [36] and based on the experimental results presented in Hundt and Kantelberg 1978 [42].
where: the coefficients are a1 = 427 J/mol; a2 = 646 J/mol; a3 = 1.31; a4 = −52.35 MPa; a5 = 1.46 MPa/K [14].
4.2. Modeling Heat Transfer in the Material
The environmental conditions (e.g., temperature, relative humidity) vary during the interval of a time step for the numerical simulation of the carbonation process. Due to this variation, the temperature profile in the material varies as well.
The equation of heat transfer in the material by conduction is assumed to be:
where ρconcrete = 2300 kg/m3 is the density; cconcrete = 960 J/kg·K is the specific heat; and λconcrete = 0.92 J/kg·K is the thermal conductivity of concrete.
It is noticed that only conduction has been accounted for in the heat transfer modeling. It is assumed that the concrete surface is not exposed to solar radiation. The effect of air convection in the neighborhood of the concrete surface is limited to a thin layer of concrete and is almost negligible on the long-term concrete carbonation. The effect of a constant outer temperature on concrete carbonation is illustrated in Figure 5 and Figure 6 for C45 concrete and C25 concrete (cf. Table 1), respectively. It can be seen that the difference is about half a millimeter after 50 years of exposure when the outer temperature changes from 278 to 298 K.
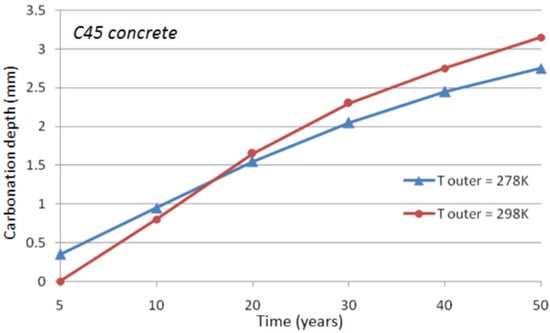
Figure 5.
Temperature effect on the depth of natural carbonation for C45 concrete.
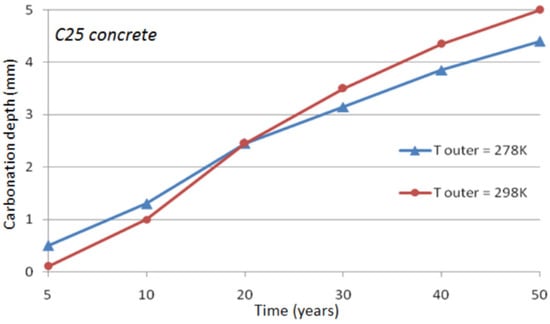
Figure 6.
Temperature effect on the depth of natural carbonation for C25 concrete.

Table 1.
Characteristics of the tested concretes.
5. Application of Proposed Numerical Model in the Case Study
A comprehensive finite element modeling of concrete carbonation has been proposed in the previous sections. It encompasses the carbon dioxide transfer in the gaseous phase; the transfer of calcium ions provided by the dissolution of the main hydrated compounds of the cement paste includes interdependent and nonlinear source and sink terms of mass conservation equations, the heat transfer, and the chemical and physical heat activation and accounts for variable boundary conditions. In the present section, its utilization will highlight some still questionable aspects of carbonation modeling.
Although some previous modeling works have integrated non-constant boundary conditions in terms of outer moisture and temperature, very few have investigated in detail the effect of the variability of these conditions on the long-term carbonation rate. Bakker 1993 [18] attempted to assess the influence of wetting–drying cycles in the framework of a simplified approach where carbonation was stopped under wetting. More recently, Thiery et al., 2012 [43] added to Bakker’s model [18], simplified modeling of moisture transfer. Nevertheless, how far accounting for realistic outdoor conditions can change the predicted carbonation rate remained has not been experienced until now.
The calcium ion concentration in the pore solution has been demonstrated to present a significant effect on the carbonation phenomenon. However, it has not been discovered whether the motion of ions plays a significant role in carbonation kinetics. The extended modeling proposed above has enabled addressing such analyses.
5.1. Concrete Material
The concrete cover of existing structures constitutes the main barrier to prevent the initiation corrosion of steel reinforcement by carbonation due to carbon dioxide penetration. The concrete structure considered herein is only the concrete cover, with 1D ingress of carbon dioxide. The amount and type of hydrated compounds of the cement paste, as well as the porosity mainly depending on the concrete mix, are essential parameters influencing the carbonation rate. In this paper, two concretes having compressive strengths corresponding to C25 and C45 classes are studied, respectively. The characteristics of the two concretes are synthesized in Table 1.
5.2. Case Study: Outdoor Environmental Variables in Toulouse, France
Hourly average values of relative humidity and temperature have been computed over the period from 1970 to 2020 using the data recorded by a meteorological station in Toulouse, Southern France, in order to identify the evolution of outdoor environmental conditions. The boundary conditions of the numerical problem that are the outside temperature and the relative humidity are simulated using average values during each time step in the numerical simulation. The shorter this time step is, the more precise the simulation is, but computation time will also increase. Figure 7 and Figure 8 illustrate the chronicle of environmental conditions (temperature, relative humidity) used in the simulation with a temporal discretization ranging from 5 to 90 days that is assumed to be repeated every year.
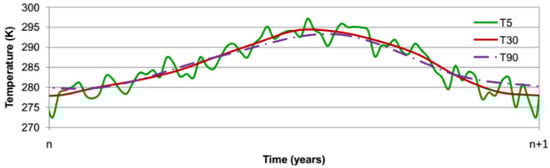
Figure 7.
Yearly evolution of temperature in Toulouse.
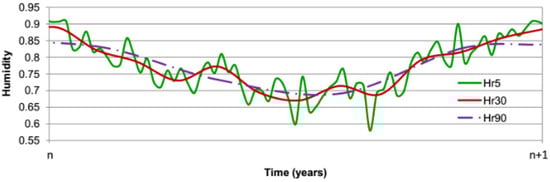
Figure 8.
Yearly evolution of relative humidity in Toulouse.
5.3. Results and Discussion
5.3.1. Effect of Time Granularity on the Carbonation Depth
The results of carbonation simulations for C45 concrete and C25 concrete under the different spatial discretization hypotheses are shown in Figure 9, respectively. These results are summarized in Table 2, in which the relative difference of the simulation results appears by taking the carbonation depth at 50 years under the lowest time step as a reference value. It is noted that the impact of an increase in the time step is relatively limited: the difference is about 10% between a time step of five days and 365 days (annual average value) after 50 years of exposure for C45 concrete and C25 concrete.
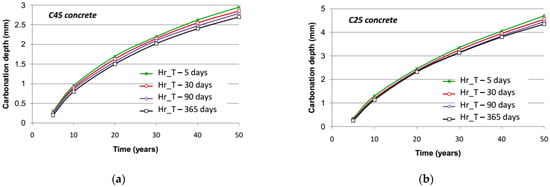
Figure 9.
Evolution of carbonation depth in time with various time steps for: (a) C45 concrete; (b) C25 concrete.
Table 2.
Prediction of carbonation depth after 50 years with different time steps.
It is worth noting that the larger the time step is, the lower the carbonation depth becomes. When increasing the time step, the variation of relative humidity taken into account with regard to its average value is reduced. If the average value is fairly elevated (higher than 75%), eliminating low values of relative humidity (slightly less than 65%) by reduction of its extent, which are favorable to carbonation compared to the average value, leads to a decrease in the long-term carbonation rate. When only annual average moisture is accounted for, the resulting carbonation depth is far smaller than that obtained with a 30-day step. Comparing computational run times with respect to the time step, it can be seen that a 30-day step constitutes a good compromise between accuracy and efficiency.
The calculation time for a numerical simulation is a direct function of the time step retained to model the external conditions and of the calculation step of the simulation itself. Table 3 and Table 4 present the lengthening of the duration of the atmospheric carbonation simulations to 50 years and accelerated carbonation to 180 days, respectively, and the estimated depth of carbonation, according to the size of the time step for the description of the climatic chronicles and the step of the numerical simulations. These results on atmospheric and accelerated carbonation show that the calculation step only affects the calculation time and not the depth of carbonation. The obtained results presented above make it possible to consider a step of calculation and discretization of the environmental chronicles of 30 days for atmospheric carbonation and three days for accelerated carbonation.
Table 3.
Calculation time of atmospheric carbonation after 50 years of C25 concrete with different time steps and calculation steps.
Table 4.
Calculation time of accelerated carbonation after 180 days of concrete C25 with different time steps and calculation steps.
Due to the fact that both warm temperature and low moisture of the material are favorable factors of concrete carbonation, a matter arises regarding the influence of the season when the concrete surface is first exposed to carbonation on the future of the phenomenon. The carbonation is more favorable in summer under high temperature and low moisture than in winter under favorable moisture. Results reported in Figure 10 and Figure 11 show that a noteworthy difference is visible at first with respect to the season at the onset of exposure and that this difference decreases after several months, yet it remains. It should be noted anyway that this difference is mainly significant for an accelerated process. It can be explained by the global decreasing kinetic of the carbonation process, which allows greater importance to the first months of the degradation. If the onset is in spring, for instance, the first six months of the degradation are under the warmest months of the year; therefore, the degradation is accelerated in comparison to an onset in autumn and six cold first months.
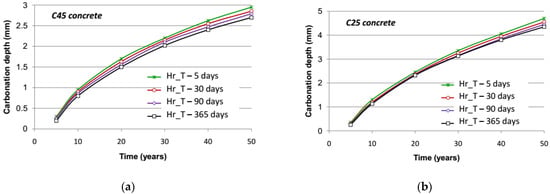
Figure 10.
Evolution of the accelerated carbonation depth with respect to the season at the onset of exposure: (a) C45 concrete; (b) C25 concrete.
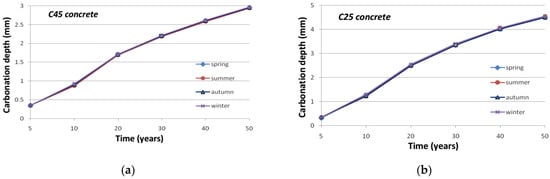
Figure 11.
Evolution of the atmospheric carbonation depth with respect to the season at the onset of exposure: (a) C45 concrete; (b) C25 concrete.
5.3.2. Effect of Heat Transfer on the Carbonation Depth
A temperature gradient always exists between surface and bulk concrete due to the fact that external temperature is not constant. Within the concrete, there is hence a variation of temperature that potentially impacts the carbonation phenomenon, therefore justifying the modeling of the heat transfer. The latter prominently depends on the concrete thermal conductivity, which may strongly vary among various concretes according to the nature of the aggregates and slightly more with respect to the moisture and temperature of the concrete.
In the present section, it is assumed that the thermal conductivity may vary by a ratio of 1 to 1000. Nonetheless, the evolution of the carbonation depth remains almost similar whatever the value of the thermal conductivity, as illustrated in Figure 12. It could then be suggested to consider that the temperature over the cover depth is constant and equal to the external one, if the time step accounted for in the modeling of outdoor conditions is stated at least at 30 days, as proposed in the former section. This conclusion derives from the kinetics of the heat transfer, which are significantly higher than those of the diffusion process.
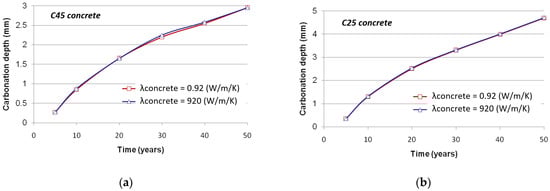
Figure 12.
Evolution of the carbonation depth with respect to the thermal conductivity: (a) C45 concrete; (b) C25 concrete.
5.3.3. Effect of Diffusion of Calcium on the Carbonation Depth
The proposed model enables the diffusion of calcium ions in the pore solution to be considered. These ions are in equilibrium with the hydrated products in a sound concrete at a concentration of 22 mol/m3. According to the decalcification process, the solubility of hydrated compounds decreases, and the concentration of calcium ions drops at a value ranging between 0 and 0.4 mol/m3 in the fully carbonated area [30]. The calcium ions are hence prone to migrating from the sound area to the carbonated one. The transfer of these ions depends on the saturation degree and porosity that both affect the diffusion coefficient for calcium. It can be seen in Figure 13 that the effect of the motion of calcium ions is very limited even for a high value of diffusion coefficient under reference conditions. This results from the fact that the gaseous diffusion kinetics of carbon dioxide remain much greater than those of calcium ions in the liquid phase for the outdoor climatic conditions retained in the study.
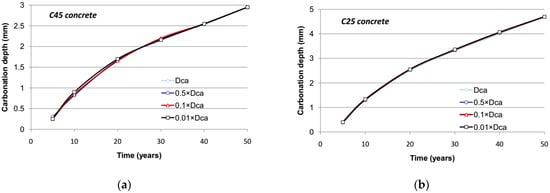
Figure 13.
Evolution of carbonation depth with respect to the diffusion coefficient of calcium ions: (a) C45 concrete; (b) C25 concrete.
However, when the concrete surface is exposed to rain for a long time, the saturated concrete extent may reach the sound concrete and subsequently connect the sound region to the carbonated one in a continuously saturated way. In this case, a more significant transfer of calcium ions is expected to occur, because the ingress of carbon dioxide is blocked by the liquid phase, and the formation of calcite is not possible anymore. Extreme situations have been simulated by the change of the yearly average relative humidity in the C25 concrete to 95% and 65% in place of 78%. A porosity of 0.18 is used to increase the transfer of calcium ions. Longer periods with almost complete saturation of concrete cover then appear. Taking into account various diffusion coefficients of calcium ions shows in Figure 14 that the faster the motion of ions, the lower the long-term carbonation rate as well. In this case, indeed, calcite is formed close to the concrete surface because calcium ions are available, even if the region is already carbonated.
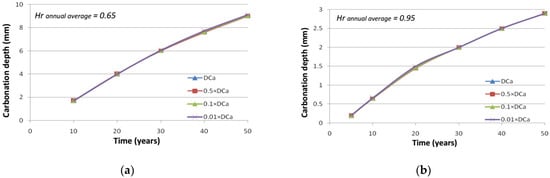
Figure 14.
Evolution of carbonation depth with respect to the diffusion coefficient of calcium ions under different humidity conditions: (a) C45 concrete; (b) C25 concrete.
6. Conclusions
This study proposed a FE model for modeling concrete carbonation by using a simplified approach that is based on simple numerical models and detailed chemo-physical processes. Each numerical model used aims to assess the initiation corrosion time in reinforced concrete structures when the carbonation front reaches the reinforcing bar. The model was used with acceptable accuracy for atmospheric and accelerated carbonation. It is noted that predictions should be related to the possibility of the uncertainty of several input parameters, which lead to a range of output values instead of a single result. Some tests have been achieved on 2D simulation for atmospheric carbonation under outdoor environmental conditions in Toulouse, France, as a case study.
It appears that for modeling the concrete carbonation process under atmospheric conditions, it is relevant to take into account the variation of the environmental conditions (e.g., temperature, relative humidity) with each time step being 30 days. It is shown that the season for the onset of the degradation has a slight influence on the kinetics of the process during the first year. It has also been discovered that, provided the time step for the numerical simulation is long enough, it is not necessary to model the heat transfer within the material, and the temperature could be considered equal to the external one.
This study also focuses on the process of calcium ion diffusion, whose kinetics are much slower than for the diffusion processes for water and carbon dioxide. Therefore, unless the material is fully saturated all along with the degradation duration, it appears that a local chemical equilibrium hypothesis for calcium can be satisfactorily formulated. Therefore, modeling the carbonation process requires two coupled mass conservation equations for water and carbon dioxide instead of three conservation equations (with calcium ions).
Author Contributions
Methodology: F.D. and V.D.N.; modeling: V.D.N.; writing—original draft preparation: V.D.N. and F.D.; writing—review and editing: N.T.N., V.D.N., and V.P.N.; project administration: N.T.V. All authors have read and agreed to the published version of the manuscript.
Funding
The research described in this paper is supported by the Ministry of Education and Training (MOET Vietnam) under Grant No. B2019-XDA-562-17. Viet-Duc NGO acknowledges the support of the 322 program of MOET Vietnam and Laboratoire Matériaux et Durabilité des Constructions (LMDC, Toulouse, France).
Institutional Review Board Statement
Not applicable.
Informed Consent Statement
Not applicable.
Data Availability Statement
Data is contained within the article.
Conflicts of Interest
The authors declare no conflict of interest. The funders had no role in the design of the study; in the collection, analyses, or interpretation of data; in the writing of the manuscript; or in the decision to publish the results.
References
- Zambon, I.; Vidovic, A.; Strauss, A.; Matos, J.; Friedl, N. Prediction of the remaining service life of existing concrete bridges in infrastructural networks based on carbonation and chloride ingress. Smart Struct. Syst. 2018, 21, 305–320. [Google Scholar] [CrossRef]
- Gao, W.; Chen, D. Prediction model of service life for tunnel structures in carbonation environments by genetic programming. Geomech. Eng. 2019, 18, 373–389. [Google Scholar] [CrossRef]
- Lim, S.; Akiyama, M.; Frangopol, D.M. Assessment of the structural performance of corrosion-affected RC members based on experimental study and probabilistic modeling. Eng. Struct. 2016, 127, 189–205. [Google Scholar] [CrossRef]
- Ruiz, C.C.; Caballero, J.L.; Martinez, J.H.; Aperador, W.A. Algorithms to measure carbonation depth in concrete structures sprayed with a phenolphthalein solution. Adv. Concr. Constr. 2020, 9, 257–265. [Google Scholar] [CrossRef]
- Saetta, A.V.; Schrefler, B.A.; Vitaliani, R.V. The carbonation of concrete and the mechanism of moisture, heat and carbon dioxide flow through porous materials. Cem. Concr. Res. 1993, 23, 761–772. [Google Scholar] [CrossRef]
- Mainguy, M.; Tognazzi, C.; Torrenti, J.M.; Adenot, F. Modeling of leaching in pure cement paste and mortar. Cem. Concr. Res. 2000, 30, 83–90. [Google Scholar] [CrossRef]
- Thiery, M. Modélisation de la carbonatation atmosphérique des matériaux cimentaires. Prise en compte des effets cinétiques et des modifications microstructurales et hydriques. Ph.D. Thesis, Ecole Nationale des Pont et Chaussées, Paris, France, 2005. (In French). [Google Scholar]
- Vu, N.T. Durabilité des bÉtons: Contribution à l’Étude De La Corrosion Par Carbonatation Du béTon Armé: Approche Expérimentale et Probabilité. Ph.D. Thesis, University of Toulouse, Toulouse, France, 2011. (In French). [Google Scholar]
- Wang, X.-Y.; Lee, H.-S. Microstructure modeling of carbonation of metakaolin blended concrete. Adv. Concr. Constr. 2009, 7, 167–174. [Google Scholar] [CrossRef]
- Pu, Q.; Yao, Y.; Wang, L.; Shi, X.; Luo, J.; Xie, Y. The investigation of pH threshold value on the corrosion of steel reinforcement in concrete. Comput. Concr. 2017, 19, 257–262. [Google Scholar] [CrossRef]
- Rimmelé, G.; Barlet-Gouédard, V.; Porcherie, O.; Goffé, B.; Brunet, F. Heterogeneous porosity distribution in Portland cement exposed to CO2-rich fluids. Cem. Concr. Res. 2008, 38, 1038–1048. [Google Scholar] [CrossRef]
- Malerba, P.G.; Sgambi, L.; Ielmini, D.; Gotti, G. Influence of corrosive phenomena on bearing capacity of RC and PC beams. Adv. Concr. Constr. 2017, 5, 117–143. [Google Scholar] [CrossRef]
- Phung, Q.T.; Maes, N.; Jacques, D.; De Schutter, G.; Ye, G.; Perko, J. Modelling the carbonation of cement pastes under a CO2 pressure gradient considering both diffusive and convective transport. Constr. Build. Mater. 2016, 114, 333–351. [Google Scholar] [CrossRef]
- De Larrard, T.; Bastidas-Arteaga, E.; Duprat, F.; Schoefs, F. Effects of climate variations and global warming on the durability of RC structures subjected to carbonation. Civ. Eng. Environ. Syst. 2014, 31, 153–164. [Google Scholar] [CrossRef]
- Wang, X.-Y.; Luan, Y. Evaluation of carbonation service life of slag blended concrete considering climate changes. Comput. Concr. 2018, 21, 419–429. [Google Scholar] [CrossRef]
- Ying-Yu, L.; Qui-Dong, W. The mechanism of carbonation of mortars and the dependence of carbonation on pore structure. ACI SP100-98 1987, 100, 1915–1944. [Google Scholar]
- Papadakis, V.G.; Vayenas, C.G.; Fardis, M.N. Physical and chemical characteristics affecting the durability of concrete. ACI Mater. J. 1991, 88, 186–196. [Google Scholar]
- Bakker, R. Model to Calculate the Rate of Carbonation in Concrete under Different Climatic Conditions; Technical Report; CMIJ bv Laboratorium: Imuiden, The Netherlands, 1993. [Google Scholar]
- CEB. New Approach to Durability Design—An Example for a Carbonation Induced Corrosion; CEB. Bulletin No. 238. 1997, p. 152. Available online: https://www.fib-international.org/publications/ceb-bulletins/new-approach-to-durability-design-detail.html (accessed on 3 May 2021).
- DuraCrete Final Technical Report—General Guidelines for Durability Design and Redesign; The European Union—Brite EuRam III. 2000, p. 144. Available online: https://lib.ugent.be/catalog/rug01:001386862 (accessed on 3 May 2021).
- Miragliotta, R. Modélisation des Processus Physico-Chimiques de La Carbonatation Des béTons préFabriqués—Prise en Compte Des Effets De Paroi. Ph.D. Thesis, University of La Rochelle, La Rochelle, France, 2000. (In French). [Google Scholar]
- Hyvert, N. Application de l’Approche Probabiliste de la Durabilité Des Produits Préfabriqués en Béton. Ph.D. Thesis, University of Toulouse III—Paul Sabatier, Toulouse, France, 2009. (In French). [Google Scholar]
- Saetta, A.V.; Schrefler, B.A.; Vitaliani, R.V. 2-D model for carbonation and moisture/heat flow in porous materials. Cem. Concr. Res. 1995, 25, 1703–1712. [Google Scholar] [CrossRef]
- Van Balen, K.; Van Gemert, D. Modeling lime mortar carbonation. Mater. Struct. 1994, 27, 393–398. [Google Scholar] [CrossRef]
- Liang, M.T.; Qu, W.; Liang, C.H. Mathematical modeling and prediction method of concrete carbonation and its applications. J. Mar. Sci. Technol. 2002, 10, 128–135. [Google Scholar]
- Bary, B.; Sellier, A. Coupled moisture-carbon dioxide-calcium transfer model for carbonation of concrete. Cem. Concr. Res. 2004, 34, 1859–1872. [Google Scholar] [CrossRef]
- Bary, B.; Mügler, C. Simplified modeling and numerical simulation of concrete carbonation in unsaturated conditions. Rev. Européenne de Génie Civil. 2006, 10, 1049–1072. [Google Scholar] [CrossRef]
- de Larrard, T.; Bary, B.; Adam, E.; Kloss, F. Influence of aggregate shapes on drying and carbonation phenomena in 3D concrete numerical samples. Comput. Mater. Sci. 2013, 72, 1–14. [Google Scholar] [CrossRef]
- Woyciechowski, P.P.; Sokolowska, J.J. Self-terminated carbonation model as an useful support for durable concrete structure designing. Struct. Eng. Mech. 2017, 63, 55–64. [Google Scholar] [CrossRef]
- Baroghel-Bouny, V.; Mainguy, M.; Lassabatère, T.; Coussy, O. Characterization and identification of equilibrium and transfer moisture properties for ordinary and high-performance cementitious materials. Cem. Concr. Res. 1999, 29, 1225–1238. [Google Scholar] [CrossRef]
- Bazant, Z.P.; Najjar, L.J. Nonlinear water diffusion in nonsaturated concrete. Mater. Struct. 1972, 5, 3–20. [Google Scholar] [CrossRef]
- Coussy, O. Mechanics of Porous Continua; Wiley: Chichester, UK, 1995. [Google Scholar]
- Faucon, P.; Adenot, F.; Jacquinot, J.F.; Petit, J.C.; Cabrillac, R.; Jorda, M. Long-term behaviour of cement pastes used for nuclear waste disposal: Review of physico–chemical mechanisms of water degradation. Cem. Concr. Res. 1998, 28, 847–857. [Google Scholar] [CrossRef]
- Mainguy, M.; Coussy, O.; Baroghel-Bouny, V. Role of air pressure in drying of weakly permeable materials. J. Eng. Mech. 2001, 127, 582–592. [Google Scholar] [CrossRef]
- Johannesson, B.F. Nonlinear transient phenomena in porous media with special regard to concrete and durability. Adv. Cem. Based Mater. 1997, 6, 71–75. [Google Scholar] [CrossRef]
- Poyet, S.; Charles, S. Temperature dependence of the sorption isotherms of cement-based materials: Heat of sorption and Clausius–Clapeyron formula. Cem. Concr. Res. 2009, 39, 1060–1067. [Google Scholar] [CrossRef]
- Ishida, T.; Maekawa, K.; Kishi, T. Enhanced modeling of moisture equilibrium and transport in cementitious materials under arbitrary temperature and relative humidity history. Cem. Concr. Res. 2007, 37, 565–578. [Google Scholar] [CrossRef]
- Park, D.C. Carbonation of concrete in relation to CO2 permeability and degradation of coatings. Constr. Build. Mater. 2008, 22, 2260–2268. [Google Scholar] [CrossRef]
- Fogg, P.; Sangster, J. Chemicals in the Atmosphere: Solubility, Sources and Reactivity; John Wiley, Sons Ltd: West Sussex, UK, 2003. [Google Scholar]
- Reinhardt, H.R.; Jooss, M. Permeability and self-healing of cracked concrete as a function of temperature and crack width. Cem. Concr. Res. 2003, 33, 981–985. [Google Scholar] [CrossRef]
- Di Luzio, G.; Cusatis, G. Hygro-thermo-chemical modeling of high performance concrete. I: Theory. Cem. Concr. Compos. 2009, 31, 301–308. [Google Scholar] [CrossRef]
- Hundt, J.; Kantelberg, H. Sorptionsuntersuchungen an zemestein, zementmörtel und beton. Dtsch. Aussch. für Stahlbeton Heft 1978, 297, 25–39. [Google Scholar]
- Thiery, M.; Orcesi, A.; Baroghel-Bouny, V. Durability design of reinforced concrete structures submitted to carbonation by using a probabilistic modeling. In Proceedings of the International Conference on Concrete Repair, Rehabilitation and Retrofitting (ICCRRR), Cape Town, South Africa, 3–5 September 2012. [Google Scholar]


Publisher’s Note: MDPI stays neutral with regard to jurisdictional claims in published maps and institutional affiliations. |
© 2021 by the authors. Licensee MDPI, Basel, Switzerland. This article is an open access article distributed under the terms and conditions of the Creative Commons Attribution (CC BY) license (https://creativecommons.org/licenses/by/4.0/).