Article

Bicycling-Related Mortality in Ecuador: A Nationwide Population-Based Analysis from 2004 to 2017

by
Simone Cordovez
1,
Esteban Ortiz-Prado
1,*,
Eduardo Vasconez
1,
Felipe Andrade
1,
Katherine Simbaña-Rivera
1,
Lenin Gómez-Barreno
1 and
Rich C McIlroy
2
1
OneHealth Research Group, Faculty of Medicine, Universidad de las Américas (UDLA), Calle de los Coli mesy Avenida De los Granados, Quito EC 170125, Ecuador
2
Transportation Research Group, University of Southampton, Southampton SO17 1BJ, UK
*
Author to whom correspondence should be addressed.
Sustainability 2021, 13(11), 5906; https://doi.org/10.3390/su13115906
Submission received: 22 April 2021 / Revised: 20 May 2021 / Accepted: 21 May 2021 / Published: 24 May 2021

Abstract: Background

Urban cycling is gaining popularity worldwide. Inadequate local and international guidelines on street cycling have contributed to a significant increase in road traffic/cycling collisions. Developing countries are the least safe for cyclists. In this sense, this is the first epidemiological study that seeks to determine the impact of street cycling-related mortality in Ecuador over the last 13 years. Methods: A descriptive ecological analysis of the epidemiology of bicycling-related mortality in Ecuador was conducted. All deaths identified as V10 to V19 according to the International Code of Diseases 10th edition (ICD-10) from 2004 to 2017 were retrieved from the National Institute of Statistics and Census in Ecuador (INEC) database. Results: From 2004 to 2017, a total of 300 deaths among street cyclists were officially reported in Ecuador. From this, 91% of the victims were men (n = 273) and 9% were women (n = 27). In relationship to other traffic accidents, bicycle-related deaths accounted for 0.68% of the overall car accident mortality. Bicycle-related deaths are more frequent in urban areas with 85% (n = 257), while rural areas accounted for 15% of the deaths (n = 43). In addition, lower educational attainment (75% did not reach secondary school) seems to be linked with higher mortality rates. Conclusions: In Ecuador, fatalities involving cyclists are an important part of the burden of disease attributed to traffic accidents. These preventable deaths are becoming a growing health problem, especially among those with poorer health determinants, such as lower educational attainment, ethnic minority status, and living in rural areas. The lack of public policy related to the prevention of this type of accident, as well as the irresponsibility of cars and transport vehicle drivers, might be associated with an increasingly high portion of the overall bicycle-related mortality in Ecuador.

1. Introduction

The use of bicycles has increased considerably during the last decade, either as a transportation alternative or as a sporting instrument [1]. More users have adopted it as a way to travel short distances, to move around towns, as a sport, as a leisure activity, or even as a work instrument [2,3]. This has prompted the restructuring of mobility patterns to which we have become accustomed within cities in order to give way to new infrastructure that integrates the cyclist into road traffic.
Cycling readily facilitates mobility inside and outside of the city, it supports wellbeing, it is an ecological mode of transport, and it supports multimodal travel, hence its acceptance by users. Despite all the benefits of cycling, including those related to sustainable mobility within cities, its status as a zero-pollution emitting vehicle, and its affordability, bicycle–vehicle collisions remain an active and growing problem worldwide [4,5].
The World Health Organization (WHO) established road traffic injuries as the eighth leading cause of death for all age groups, with 26% of data corresponding to cyclists and pedestrians [6]. Moreover, 3% of traffic collisions involve cyclists, resulting in an estimated 50,000 deaths around the world [7]. This percentage is likely to be significantly higher in low- and middle-income countries where legislation on this subject does not exist or is not applied as it should be [8].
Cycling can cause a number of involuntary lesions. These can range from minor injuries that do not require medical attention, to those where death is inevitable. A group of researchers in Mexico, led by Muro-Baez et al. (2017), found traumatic brain injury to be the most common injury (63.1%) reported after a collision between a motor vehicle and a bicycle [9]. Additionally, most of the reported victims were young people, often men between 14 and 25 years of age [10,11].
Despite all the efforts made in establishing regulations in the Americas, the rate of annual road traffic fatalities remains stable, at an average of 15.6 per 100,000 [7]. In recent years, legislation has been strengthened in Ecuador; this specifies the duties and rights of cyclists when using shared traffic lanes. One of the main requirements is the use of protective elements, the helmet being the main recommendation for everyone, though very few countries require people to wear it [12,13].
The only available data on mobility using bicycles in Ecuador comes from INEC [14]. In 2015, more than 1.8 million Ecuadorians used bicycles, while in 2016 this number rose to 2.4 million. The population group that uses bicycles the most are children between 5 to 14 years of age, and 76.8% of users were men. According to this data, only 1.9% of Ecuadorians use bicycles as a method of transportation [14]. Although it is well known that road fatalities between cyclists and automobiles are common, mortality from this cause has never before been reported in Ecuador.
This article analyzes data obtained from death certificates officially recorded within the National Statistics and Census Institute (INEC) on on-road traumatic injuries registered in Ecuador from 2004 to 2017. The idea of this investigation is to provide epidemiological input to decision makers in order to strengthen public policies around street cycling and thus reduce the negative impacts of accidents and foreseeable deaths on the public health system.

2. Materials and Methods

A descriptive ecological analysis of the epidemiology of bicycling-related mortality in Ecuador was conducted. All deaths identified as V10 to V19 according to the International Code of Diseases 10th edition (ICD-10) from 2004 to 2017 were retrieved from the National Institute of Statistics and Census in Ecuador (INEC) database [15].
The causes of death were classified according to the ICD-10. The codes from V10 to V19 are used to indicate a pedal cyclist injured in a transport incident, including the following categories: collision with an animal or pedestrian (V10), with another cyclist (V11), with a two- or three-wheel vehicle (V12), with a car or van (V13), with heavy transport or a bus (V14), with a train or rail vehicle (V15), with another vehicle without a motor (V16), with a stationary object (V17), an accident without collision (V18), and with another unspecified vehicle (V19).
This study used data obtained from a countrywide open access database at https://aplicaciones3.ecuadorencifras.gob.ec/sbi-war/ (accessed on 3 March 2020). Researchers have included all the data relevant to the study as presented, avoiding any type of selection or omission bias. All authors were responsible for ensuring that the results were not misunderstood, maintaining a transparent study and consistent with the national reality represented in the data.
The demographic variables collected for this study, such as sex, age, ethnicity, and geographic location of the incident, were analyzed using descriptive statistical methods, such as rates, absolute values, and proportions. The probability analysis was carried out by means of a univariate analysis of the population at risk according to the 2010 census (conducted by INEC) and population projections by age, sex, and national province. Statistical analyses were performed using IBM’s SPSS version 24.0. Finally, all references were retrieved and managed by the open source software Zotero version 5.0.65.

3. Results

In relation to the total number of road traffic fatalities in Ecuador, only 0.68% are related to cycling, with men involved in 0.62% and women in 0.06%. Table 1 presents the absolute numbers of transport-related fatalities according to travel mode for the period 2004–2017 and the percentages for each subgroup (Table 1).
From 2004 to 2017, there were 300 fatalities among street cyclists in Ecuador, most of them men, representing 91% (n = 273) of the overall mortality. On average, 21.4 cases were reported annually; men accounted for 4 to 55 cases annually, with an average of 19.5 cases per year. For women, only 1.93 cases per year were reported, with a range from 0 to 5 cases per year. This pattern is constant except for peaks in 2006 for women and in 2015 for men, where 5 and 55 cases were registered, respectively.

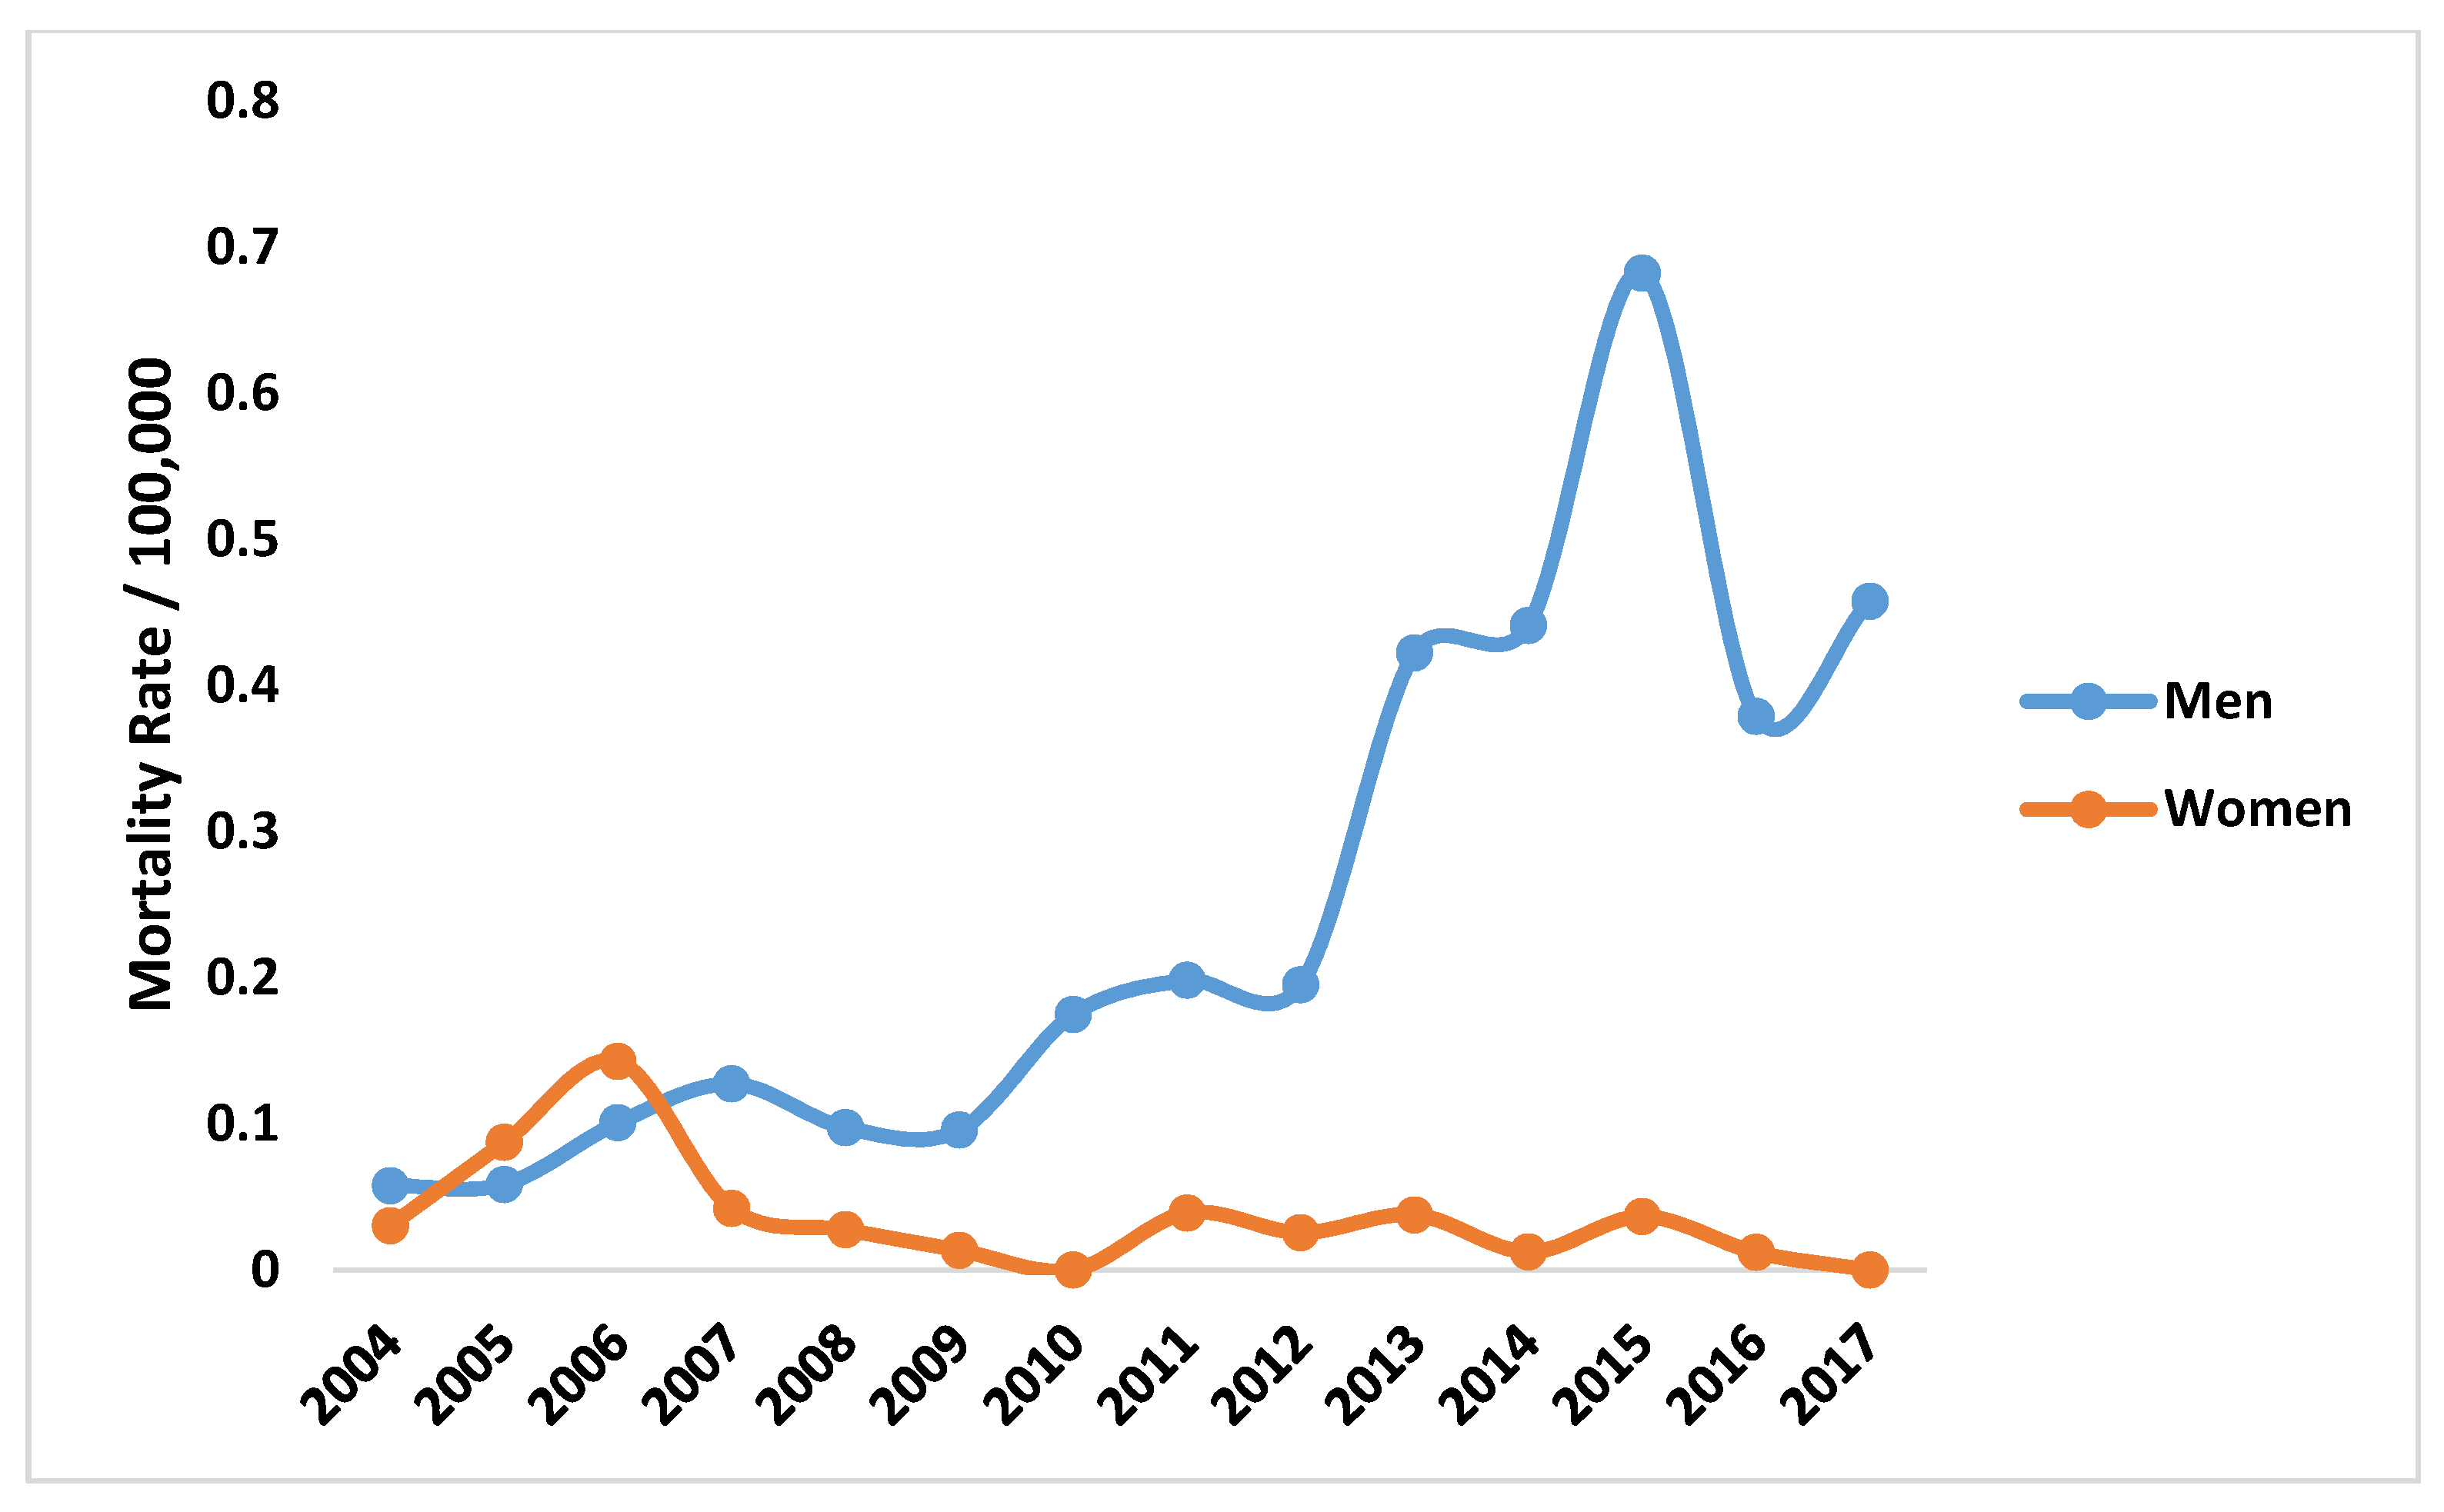
3.1. Annual Death Rates among Cyclists

The annual death rate of cyclists in Ecuador described an average of 0.14 per 100,000 inhabitants, 0.25 per 100,000 in men and 0.04 per 100,000 in women. This information is presented in Figure 1 for the years 2004 to 2017.

3.2. Age Distribution

According to the age groups, when we divide patients into 5-year age groups, we found that the overall mortality rate increases with age. For instance, children from 0 to 4 years old have a mortality rate of 0.3 per 100,000, followed by children from 5 to 9 years with 0.4 per 100,000 and children from 10 to 14 with 0.9 per 100,000. Among young adults, those from 45 to 49 years have a mortality rate of 3.5 per 100,000, followed by those from 55 to 59 years old with 4.7 per 100,000. The highest rate was found among those older than 80 years of age, with a rate of 8.6 per 100,000 deaths.
Regarding the victim’s age, the median value was 50 years old. For men, median age was 49, while for women it was 55 years old. Age group analysis of overall deaths demonstrated that 39.6% (n = 108) of men’s cases were adults; this was followed by the elderly category with a value of 23.4% (n = 64), then the young adult category at 21.6% (n = 59). In women, the elderly and adult groups each accounted for 33.3% (n = 9) of cases.
The descriptive analysis of each proportion’s differences and age-adjusted rates is displayed on Table 2.

3.3. Sociodemographic Variables

In terms of the sociodemographic characteristics of the current population, 47% of fatalities occurred among single people, followed by 21% of cases in which the victims were registered as married and 13% identified as in a consensual union, followed by 4% widowers, 3% divorced, and finally 1% separated (Table 3).

3.4. Educational Attainment

Regarding the highest level of education attained by the victim, those with up to primary education represented the 45% of cases, followed by secondary high school education at 18.3% of cases and higher undergraduate education at 3.3% of cases (Table 3).

3.5. Ethnicity

A total of 72.3% of the fatalities occurred in mestizos (i.e., of Native American and white European mixed ancestry); this was as expected, given that 75% of the country’s population belong to this race (Table 3).

3.6. Collisions According to the ICD-10

The causes of injuries in cyclists are classified according to the ICD-10 system. Of the 300 fatalities categorized as being due to a bicycle incident (V10 to V19), a total of 154 (51.3%) were registered as unspecified transport accidents (ICD V19). In other words, there are no records of the mechanism. In the next largest group, 43 (14.3%) were injured in a collision with a car, pickup truck, or van (Table 4).

3.7. Geographical Trend

The majority of bicycle-related deaths occurred in urban areas, representing 85% of the total number of deaths (n = 257); 15% of the deaths were reported as occurring in rural locations (n = 43).
With respect to the province in which the fatality occurred, the highest mortality rate was seen in Morona Santiago with 0.43 fatalities per 100,000 inhabitants, followed by Los Rios with 0.28 per 100,000 inhabitants, Galapagos with 0.26 per 100,000 inhabitants, and Guayaquil with 0.23 per 100,000 inhabitants.
Regarding gender, bicycle-related mortality rates per 100,000 inhabitants in men were found to be 1.54 in Morona Santiago, followed by nondelimited areas with 1.04 fatalities per 100,000 inhabitants. In contrast, the two highest mortality rates for women were 0.14 in Napo and 0.11 in Orellana (Table 5).

4. Discussion

In this study, we were able to show that in Ecuador, deaths among cyclists are not rare, and these events are increasing constantly. We saw that the vast majority of deaths among cyclists are not fully specified and that the etiological origin of the accident is unknown in up to 53% of the reports. What seems to be clear is that the vast majority of deaths appear to be caused by small cars, buses, and heavy trucks in both men and women, and controlling road safety issues is a must [16].
We also saw that there is a significant increase in the number of bicycle-related accident-related deaths in young, unmarried men; however, we saw that the proportion of death is consistently higher among female and male users of all ages, probably due to the fact that more people are currently biking worldwide [17,18].
Two marked increases or upturns can be seen in the epidemiological curve in Figure 1. We cannot comment on why this happened; nevertheless, in our experience, we believe that reported increases in fuel prices or higher levels of workplace instability might force more people to cycle [19,20].
The fact that the majority of those who died had a low level of education shows us that there might be a link between suffering an accident on the roads and educational attainment of the population [21,22]. There is also a social component in relation to who uses bicycles in urban and rural areas of Ecuador, since many cyclists in rural areas will use them for work or to transport their families, thus increasing the risk of accidents in comparison to other urban areas where speed limits are more restrictive than in rural areas [23].
Cyclists are a population with a high risk of collision mortality compared to motorized vehicle users. Even when using protective equipment, such as helmets or high-visibility clothing, they do not have the kind of rigid, protective structure enjoyed by car or bus users; their vulnerability therefore increases the risk of death should a traffic collision occur [24].
Those cyclists who suffer injuries at the collision location that are not immediately fatal are transported to a hospital unit where they are admitted; nevertheless, the lesion reported is often registered, and the main injuries that they present are recorded, leaving aside the etiological reason of the lesion [25,26]. In many cases, the cause of injury is not recorded as arising from bicycle use (under any of the known ICD-10 descriptions that involve the use of the bicycle (V10 to V19)), and for this reason, the total number of deaths cannot be accurately known, especially when those deaths occurring during other practices such as BMX, downhill, or cross country biking were not reported as traffic related injuries [27,28,29].
As expected (given absolute population numbers), the majority of identified cases occurred in urban areas; however, the highest mortality rates were seen in provinces with smaller populations where the road system is characterized by more rural roads. These types of roads do not have cycle tracks, hence there is greater interaction (and therefore conflict) between drivers and cyclists; this contributes to the higher probability of a collision occurring. Marco Dozza (2016) argued that injuries may be more severe on rural compared to urban roads where a vehicle’s higher speed may make overtaking maneuvers particularly dangerous [30].
It is extremely important to identify the main risk factors of cycling. This will support identifying the key points that must be addressed in order to reduce cycling injuries and death. This approach will allow us to compare the current picture in Ecuador with other countries through comparative analysis of work undertaken internationally.
There are, of course, a great many ways to increase the safety of cyclists: for example, through minimizing on-road interactions between vehicles and bicycles through separated bicycle lanes, or by implementing measures that support better visibility of the smaller, more vulnerable road user, such as high-visibility bicycle jackets [31].
In the extant literature, there is a relative abundance of studies concerning cycle helmets as a protective factor; in most cases, research addresses their effectiveness at reducing head injury, fatal injury, and fatal head injury [32,33]. Analyses of these types have allowed us to reach a consensus regarding the importance of this accessory when cycling, at least in terms of injury impact reduction when a collision occurs. Similarly, speed limits (and the extent to which they are followed) have a significant impact on injury, with a lower risk of a moderate-to-fatal injury when speed limit reduction in urban areas is applied [34]. The database from which the data used in this study was obtained does not provide information concerning the speed limit on the road on which the collision occurred. As such, analyses aimed at assessing the impact of speed on traffic fatalities in Ecuador is hampered. Likewise, it also does not include information on the equipment used by victims of traffic collisions nor on the specific type of injury sustained. Such inclusions, in an improved collision database, could provide significant benefit to traffic safety researchers and intervention designers.
The education of both drivers and cyclists about traffic risk is important if we are to raise awareness and improve the safety of driver–cyclist interactions. Divera Twisk (2014) describes a study in which five types of road safety education programs for young adolescents are compared, showing that the methodology should be practical if it is to reach sufficient quality to result in reliable outcomes [35]. Indeed, the importance of the education of drivers and cyclists as an accident prevention factor has been known for decades. In the Ecuadorian context, many drivers do not have the necessary education to know and respect other road users; at the same time, it is important to understand that most of them passed the exams to be qualified as drivers. However, we believe that the quality of road education as well as its impact on the roads has not been effective.
In addition to the more concrete factors such as education, infrastructure, and protective equipment, traffic safety culture is also important. In Germany, it was found that, of a selection of drivers intending to turn right at a T-junction, only a small proportion would represent a risk to a cyclist crossing from the right side [36]. In other words, the majority of the drivers were respectful towards and careful of other more vulnerable road users. Although work looking at cultural differences in traffic safety behavior has been conducted in Europe, with some effort put into cross-cultural comparisons of traffic safety culture in Africa and parts of Asia (e.g., Nordfjærn et al., 2014; McIlroy et al., 2020), these kinds of studies have not yet been replicated in Latin American. Such an approach could present a fruitful avenue for informing intervention design [8,37,38,39].
Cycling as a means of transport has great potential to improve people’s mobility. With greater cycling uptake, the number of circulating motor vehicles would decrease, which would lead to overall benefits for the population, in terms of better air quality, lower collision rates, and a healthier population as a whole [16,40]. However, cycling involves certain risks, particularly in countries without targeted policies on road laws for cyclists and lack of infrastructure and education; we must address these risks if we are to encourage further cycling uptake.

5. Recommendations and Future Directions

In Ecuador, there is legislation, even within the constitution, that supports safer roads for cyclists; however, in practice very few people comply with it. We recommend that local and national governments implement good communication practices for the general population to induce safer roads and safer lane sharing among cyclists and drivers. We also recommend that the use of safe bicycle paths throughout the city should be implemented as soon as possible countrywide. The use of sidewalks as an alternative to share the space between pedestrians and cyclist could be useful to reduce mortality among cyclists while keeping some of the regular planification intact. Therefore, traffic would not be affected in a country with poor planification and narrow roads.

6. Limitations

This study, like many others, has its limitations. The first is the lack of knowledge of the practices and attitudes among Ecuadorians in relation to cycling. On the other hand, the quality of the ecological data collected through the mortality records is not complete and lacks etiological information. At the same time, data in relation to cycling accidents that do not end in death but that might cause milder traumatic injuries and to nonfatal accidents unfortunately cannot be retrieved from the national database. Data regarding alcohol or drug intake of the injured riders or those causing them harm was not available either. Finally, we do not have the ability to distinguish between accidents that have occurred in sport settings or those in relation to other types of cycling activities, since we only included those accidents that are recorded in the country’s database.

7. Conclusions

Despite the fact that cycling fatalities are a public health problem that could be addressed with adjustments and modifications of policy, law, and road infrastructure, there is a dearth of research on cycling fatalities in Ecuador. Unfortunately, the knowledge that has been obtained about traffic collisions and their victims has been generalized, and the base data available rarely contain details on the mechanism of the collision. Further research on collision etiology and on road user perceptions, attitudes, knowledge, and beliefs in Ecuador, and across Latin America, would be highly valuable. Such research could inform traffic safety interventions, guide policy aimed at encouraging modal shifts towards the bicycle, and contribute to policies that protect citizens and minimize risk.

Author Contributions

S.C. and E.O.-P. were responsible for the conceptualization of the entire study. S.C. was responsible for the search and review of literature and the compilation of information. K.S.-R. and E.O.-P. obtained all the data from INEC and wrote the first draft of the project. E.O.-P., F.A., and E.V. wrote the following drafts, including the latest version. S.C. and E.O.-P. created both tables and figures. E.V., F.A., K.S.-R., and L.G.-B. contributed to the collection of the province data and the seasonality of it. K.S.-R., L.G.-B., and R.C.M. were responsible for the revision of the manuscript, the strength of the discussion, and the final approval of the manuscript. All authors have read and agreed to the published version of the manuscript.

Funding

This project was fully funded by Universidad de las Americas, UDLA and the STARS project Funded by the NHS of England.

Data Availability Statement

Secondary and fully anonymized data is freely available to the public through the following link: https://www.ecuadorencifras.gob.ec/estadisticas-de-camas-y-egresos-hospitalarios-bases-de-datos/ (accessed on 20 May 2021).

Acknowledgments

We would like to thank every person interested in sharing this information to keep the cyclist out of risk, as well as Felipe Endara, a severely injured cyclist who has inspired us to collect and publish these data. We dedicate this work to all the cyclists who have tragically lost their lives among unsafe roads worldwide.

Conflicts of Interest

The authors declare no conflict of interest.

References

  1. Rosas-Satizábal, D.; Rodriguez-Valencia, A. Factors and Policies Explaining the Emergence of the Bicycle Commuter in Bogotá. Case Stud. Transp. Policy 2019, 7, 138–149. [Google Scholar] [CrossRef]
  2. Batterbury, S. Environmental Activism and Social Networks: Campaigning for Bicycles and Alternative Transport in West London. Ann. Am. Acad. Pol. Soc. Sci. 2003, 590, 150–169. [Google Scholar] [CrossRef]
  3. Ortiz-Prado, E.; Henriquez-Trujillo, A.R.; Rivera-Olivero, I.A.; Lozada, T.; Garcia-Bereguiain, M.A. High Prevalence of SARS-CoV-2 Infection among Food Delivery Riders. A Case Study from Quito, Ecuador. Sci. Total Environ. 2021, 770, 145225. [Google Scholar] [CrossRef]
  4. Jordi, M. Estudio de Percepciones Sobre La Salud En Usuarios de La Bicicleta Como Medio de Transporte. Salud Colect. 2017, 13, 307–320. [Google Scholar] [CrossRef] [PubMed]
  5. Luna, D.; Izquierdo, M.; Perez, G.; Rodriguez, C. Incidencia de Traumas Por Accidentes de Tránsito Que Ingresan al Servicio de Urgencias Del Hospital Universitario Erasmo Meoz, La Clínica Santa Ana S.A, e IPS Unipamplona. Rev. Científica Dep. Med. 2017, 4, 34–43. [Google Scholar]
  6. World Health Organization. Global Status Report on Road Safety 2015; World Health Organization: Geneva, Switzerland, 2015. [Google Scholar]
  7. World Health Organization. Global Status Report on Road Safety 2018; World Health Organization: Geneva, Switzerland, 2018; ISBN 978-92-4-156568-4. [Google Scholar]
  8. Heydari, S.; Hickford, A.; McIlroy, R.; Turner, J.; Bachani, A.M. Road Safety in Low-Income Countries: State of Knowledge and Future Directions. Sustainability 2019, 11, 6249. [Google Scholar] [CrossRef] [Green Version]
  9. Muro-Báez, V.A.; Mendoza-García, M.E.; Vera-López, J.D.; Pérez-Núñez, R. Analysis of Road Traffic Injuries in Mexican Cyclists. Gac. Med. Mex. 2017, 153, 653–661. [Google Scholar]
  10. Hı́jar, M.; Arredondo, A.; Carrillo, C.; Solórzano, L. Road Traffic Injuries in an Urban Area in Mexico: An Epidemiological and Cost Analysis. Accid. Anal. Prev. 2004, 36, 37–42. [Google Scholar] [CrossRef]
  11. Odero, W.; Garner, P.; Zwi, A. Road Traffic Injuries in Developing Countries: A Comprehensive Review of Epidemiological Studies. Trop. Med. Int. Health 1997, 2, 445–460. [Google Scholar] [CrossRef] [PubMed]
  12. Olivier, J.; Creighton, P. Bicycle Injuries and Helmet Use: A Systematic Review and Meta-Analysis. Int. J. Epidemiol. 2017, 46, 278–292. [Google Scholar] [CrossRef] [PubMed] [Green Version]
  13. Forbes, A.E.; Schutzer-Weissmann, J.; Menassa, D.A.; Wilson, M.H. Head Injury Patterns in Helmeted and Non-Helmeted Cyclists Admitted to a London Major Trauma Centre with Serious Head Injury. PLoS ONE 2017, 12, e0185367. [Google Scholar] [CrossRef] [PubMed] [Green Version]
  14. INEC. A Pedalear, 19 de Abril, Dia Mundial de La Bicileta. Available online: https://www.ecuadorencifras.gob.ec/documentos/web-inec/Inforgrafias-INEC/2017/170417.Bicicleta.pdf (accessed on 20 May 2021).
  15. INEC. Bases de Datos Historicos de Defunción y Egresos Hospitalarios. Available online: https://www.ecuadorencifras.gob.ec/bases-de-datos-poblacion-demografia/ (accessed on 20 May 2021).
  16. McIlroy, R.C.; Plant, K.L.; Jikyong, U.; Nam, V.H.; Bunyasi, B.; Kokwaro, G.O.; Wu, J.; Hoque, M.S.; Preston, J.M.; Stanton, N.A. Vulnerable Road Users in Low-, Middle-, and High-Income Countries: Validation of a Pedestrian Behaviour Questionnaire. Accid. Anal. Prev. 2019, 131, 80–94. [Google Scholar] [CrossRef]
  17. Das, S.; Dutta, A.; Medina, G.; Minjares-Kyle, L.; Elgart, Z. Extracting Patterns from Twitter to Promote Biking. IATSS Res. 2019, 43, 51–59. [Google Scholar] [CrossRef]
  18. Yu, C.-Y. Environmental Supports for Walking/Biking and Traffic Safety: Income and Ethnicity Disparities. Prev. Med. 2014, 67, 12–16. [Google Scholar] [CrossRef] [PubMed]
  19. Dodson, J.; Sipe, N. Oil Vulnerability in the Australian City: Assessing Socioeconomic Risks from Higher Urban Fuel Prices. Urban Stud. 2007, 44, 37–62. [Google Scholar] [CrossRef] [Green Version]
  20. Frondel, M.; Vance, C. Cycling on the Extensive and Intensive Margin: The Role of Paths and Prices. Transp. Res. Part Policy Pract. 2017, 104, 21–31. [Google Scholar] [CrossRef] [Green Version]
  21. Rivara, F.P.; Thompson, D.C.; Patterson, M.Q.; Thompson, R.S. Prevention of Bicycle-Related Injuries: Helmets, Education, and Legislation. Annu. Rev. Public Health 1998, 19, 293–318. [Google Scholar] [CrossRef] [Green Version]
  22. Kirsch, S.E.D.; Pullen, N. Evaluation of a School-Based Education Program to Promote Bicycle Safety. Health Promot. Pract. 2003, 4, 138–145. [Google Scholar] [CrossRef]
  23. Hou, Y.; Edara, P.; Sun, C. Speed Limit Effectiveness in Short-Term Rural Interstate Work Zones. Transp. Lett. Int. J. Transp. Res. 2013, 5, 34–37. [Google Scholar] [CrossRef]
  24. Prati, G.; De Angelis, M.; Puchades, M.V.; Fraboni, F.; Pietrantoni, L. Characteristics of Cyclist Crashes in Italy Using Latent Class Analysis and Association Rule Mining. PLoS ONE 2017, 12, e0171484. [Google Scholar] [CrossRef]
  25. Ortiz-Prado, E.; Mascialino, G.; Paz, C.; Rodriguez-Lorenzana, A.; Gómez-Barreno, L.; Simbaña-Rivera, K.; Diaz, A.M.; Coral-Almeida, M.; Espinosa, P.S. A Nationwide Study of Incidence and Mortality Due to Traumatic Brain Injury in Ecuador (2004–2016). Neuroepidemiology 2020, 54, 33–44. [Google Scholar] [CrossRef]
  26. Baschera, D.; Jäger, D.; Preda, R.; Z’Graggen, W.J.; Raabe, A.; Exadaktylos, A.K.; Hasler, R.M. Comparison of the Incidence and Severity of Traumatic Brain Injury Caused by Electrical Bicycle and Bicycle Accidents—A Retrospective Cohort Study from a Swiss Level I Trauma Center. World Neurosurg. 2019, 126, e1023–e1034. [Google Scholar] [CrossRef]
  27. Chen, K.-Y.; Tsai, T.-Y.; Chang, C.-F.; Tsai, Y.-R.; Ou, J.; Ma, H.-P.; Tsai, S.-H.; Chiu, W.-T.; Lin, J.-W.; Liao, K.-H. Worsening of Dizziness Impairment Is Associated with BMX Level in Patients after Mild Traumatic Brain Injury. J. Neurotrauma 2015. [Google Scholar] [CrossRef]
  28. Kronisch, R.L.; Pfeiffer, R.P. Mountain Biking Injuries. Sports Med. 2002, 32, 523–537. [Google Scholar] [CrossRef] [PubMed]
  29. Gassner, R.; Tuli, T.; Emshoff, R.; Waldhart, E. Mountainbiking—A Dangerous Sport: Comparison with Bicycling on Oral and Maxillofacial Trauma. Int. J. Oral Maxillofac. Surg. 1999, 28, 188–191. [Google Scholar] [CrossRef]
  30. Dozza, M.; Schindler, R.; Bianchi-Piccinini, G.; Karlsson, J. How Do Drivers Overtake Cyclists? Accid. Anal. Prev. 2016, 88, 29–36. [Google Scholar] [CrossRef] [Green Version]
  31. Lahrmann, H.; Madsen, T.K.O.; Olesen, A.V.; Madsen, J.C.O.; Hels, T. The Effect of a Yellow Bicycle Jacket on Cyclist Accidents. Saf. Sci. 2018, 108, 209–217. [Google Scholar] [CrossRef]
  32. Baschera, D.; Feiler, S.; Jäger, D.; Z’Graggen, W.J.; Raabe, A.; Exadaktylos, A.; Hasler, R.M. Incidence and Severity of Head Injury Due to E-Bike Accidents Compared to Normal Bicycle Accidents. J. Neurol. Surg. Part Cent. Eur. Neurosurg. 2017, 78, O19. [Google Scholar]
  33. Linn, S.; Smith, D.; Sheps, S. Epidemiology of Bicycle Injury, Head Injury, and Helmet Use among Children in British Columbia: A Five Year Descriptive Study. Inj. Prev. 1998, 4, 122–125. [Google Scholar] [CrossRef] [Green Version]
  34. Isaksson-Hellman, I.; Töreki, J. The Effect of Speed Limit Reductions in Urban Areas on Cyclists’ Injuries in Collisions with Cars. Traffic Inj. Prev. 2019, 20, 39–44. [Google Scholar] [CrossRef]
  35. Twisk, D.A.; Vlakveld, W.P.; Commandeur, J.J.; Shope, J.T.; Kok, G. Five Road Safety Education Programmes for Young Adolescent Pedestrians and Cyclists: A Multi-Programme Evaluation in a Field Setting. Accid. Anal. Prev. 2014, 66, 55–61. [Google Scholar] [CrossRef] [PubMed] [Green Version]
  36. Gohl, I.; Schneider, A.; Nitsch, V. Assessing the Safety Criticality of Driver Behavior toward Cyclists at Intersections. Traffic Inj. Prev. 2019, 20, 45–50. [Google Scholar] [CrossRef] [PubMed]
  37. Nordfjærn, T.; Şimşekoğlu, Ö.; Rundmo, T. The Role of Deliberate Planning, Car Habit and Resistance to Change in Public Transportation Mode Use. Transp. Res. Part F Traffic Psychol. Behav. 2014, 27, 90–98. [Google Scholar] [CrossRef]
  38. Nordfjærn, T.; Şimşekoğlu, Ö.; Rundmo, T. Culture Related to Road Traffic Safety: A Comparison of Eight Countries Using Two Conceptualizations of Culture. Accid. Anal. Prev. 2014, 62, 319–328. [Google Scholar] [CrossRef] [PubMed]
  39. Nordqvist, A.; Petersson, C.J. Incidence and Causes of Shoulder Girdle Injuries in an Urban Population. J. Shoulder Elbow Surg. 1995, 4, 107–112. [Google Scholar] [CrossRef]
  40. McIlroy, R.C.; Plant, K.A.; Hoque, M.S.; Wu, J.; Kokwaro, G.O.; Nam, V.H.; Stanton, N.A. Who Is Responsible for Global Road Safety? A Cross-Cultural Comparison of Actor Maps. Accid. Anal. Prev. 2019, 122, 8–18. [Google Scholar] [CrossRef]
Figure 1. Mortality rate caused by bicycle traffic incidents in Ecuador, 2004–2017.
Sustainability 13 05906 g001
Table 1. Type of road traffic incident and relative % attributed to each transport mode.
Men WomenTotal
Type of Collision (n)%(n)%(n)%
Bicycle (V10–V19)2730.62270.063000.68
Pedestrian (V1–V9)985022.3327376.2012,58728.53
Motorbike (V20–V29)35608.073530.8039138.87
Tricycle (V30–V39)640.1580.02720.16
Automobile (V40–V49)8491.922760.6311252.55
Pick Up or Van (V50–V59)3590.811110.254701.07
Heavy trucks (V60–V69)1850.42390.092240.51
Bus (V70–V79)6351.442860.659212.09
Others (V80–V89)19,16943.45484410.9824,01354.43
Boats (V90–V94)930.21140.031070.24
Airplanes (V95–V97)980.2260.011040.24
Not Specified (V98–V99)2270.51570.132840.64
Total 35,36280.15875819.8544,120100.00
Table 2. Age-adjusted mortality rates among cyclist deaths in Ecuador from 2004 to 2017.
MenPopulation Rate/100,000WomenPopulation Rate/100,000
0 to 42838,0100.23838,0100.4
5 to 96844,5120.71844,5120.1
10 to 1412821,9621.52821,9620.2
15 to 1916776,6802.11776,6800.1
20 to 2421716,8812.91716,8810.1
25 to 2911656,9401.70656,9400.0
30 to 3519605,9603.10605,9600.0
35 to 3914552,1862.51552,1860.2
40 to 448490,8571.61490,8570.2
45 to 4928432,6216.52432,6210.5
50 to 5418378,2574.81378,2570.3
55 to 5927319,7448.43319,7440.9
60 to 6419258,0127.42258,0120.8
65 to 6927200,57913.50200,5790.0
70 to 7418149,87212.02149,8721.3
75 to 7913104,50712.41104,5071.0
> 8014116,79012.06116,7905.1
Total 2738,264,3653.3278,264,3650.3
Table 3. Sociodemographic variables for bicycle-related deaths from 2004 to 2017.
Variable MenWomen
(n)%(n)%
EthnicityIndigenous82.9%13.7%
Afro-Ecuadorian41.4%13.7%
Black207.2%27.4%
Mulate00.0%00.0%
Montubio186.5%00.0%
Mixed20874.8%933.3%
White31.1%00.0%
Others20.7%00.0%
Unknown105.4%1451.9%
Total273100.0%27100.0%
Civil StatusCohabitation3914.3%13.7%
Single13649.8%518.5%
Married5821.2%414.8%
Divorced93.3%13.7%
Separated31.1%13.7%
Widow93.3%27.4%
Common law00.0%00.0%
No Information 10.4%00.0%
Unknown 186.6%1348.1%
Total273100.0%27100.0%
Educational AttainmentNone238.4%27.4%
Literacy Center31.1%00.0%
Primary School12746.5%829.6%
High school5219.0%311.1%
Incomplete Secondary Diploma3312.1%13.7%
Complete Secondary Diploma41.5%00.0%
Post-secondary diploma00.0%00.0%
Undergraduate103.7%00.0%
Postgraduate00.0%00.0%
No information217.7%1348.1%
Total273100.0%27100.0%
Collisions according to ICD-10.
Table 4. Specific cause of death due to bicycle accidents in Ecuador.
Specific Cause of Death Men%Women%
V10 Pedal cycle rider injured in collision with pedestrian or animal52%14%
V11 Pedal cycle rider injured in collision with other pedal cycle10%14%
V12 Pedal cycle rider injured in collision with two- or three-wheeled motor vehicle155%14%
V13 Pedal cycle rider injured in collision with car, pickup truck or van4316%00%
V14 Pedal cycle rider injured in collision with heavy transport vehicle or bus3011%311%
V15 Pedal cycle rider injured in collision with railway train or railway vehicle00%00%
V16 Pedal cycle rider injured in collision with other nonmotor vehicle10%27%
V17 Pedal cycle rider injured in collision with fixed or stationary object62%27%
V18 Pedal cycle rider injured in noncollision transport accident2710%830%
V19 Pedal cycle rider injured in other and unspecified transport accidents14553%933%
Total273100%27100%
Table 5. Mortality rate of bicycle-related deaths per 100,000 inhabitants from 2004 to 2017.
MenWomen
ProvinceCasesDeath RateCasesDeath Rate
Azuay90.1910.02
Bolivar40.2900.00
Cañar10.0610.06
Carchi30.2400.00
Cotopaxi40.1400.00
Chimborazo20.0610.03
El Oro160.3410.02
Esmeraldas30.0700.00
Guayas1080.40110.04
Imbabura80.2610.04
Loja20.0600.00
Los Rios270.4510.02
Manabi340.3330.03
M. Santiago191.5410.09
Napo10.1210.14
Pastaza30.4400.00
Pichincha30.0230.02
Tungurahua40.1210.03
Zamora C10.1300.00
Galapagos10.5000.00
Sucumbíos20.1500.00
Orellana30.2610.11
Santo Domingo40.1400.00
Santa Elena80.3100.00
Non determined31.0400.00
Total2730.25270.03
Publisher’s Note: MDPI stays neutral with regard to jurisdictional claims in published maps and institutional affiliations.

