
Can a Win–Win Situation of Economy and Environment Be Achieved in Cities by the Government’s Environmental Regulations?


Abstract
1. Introduction
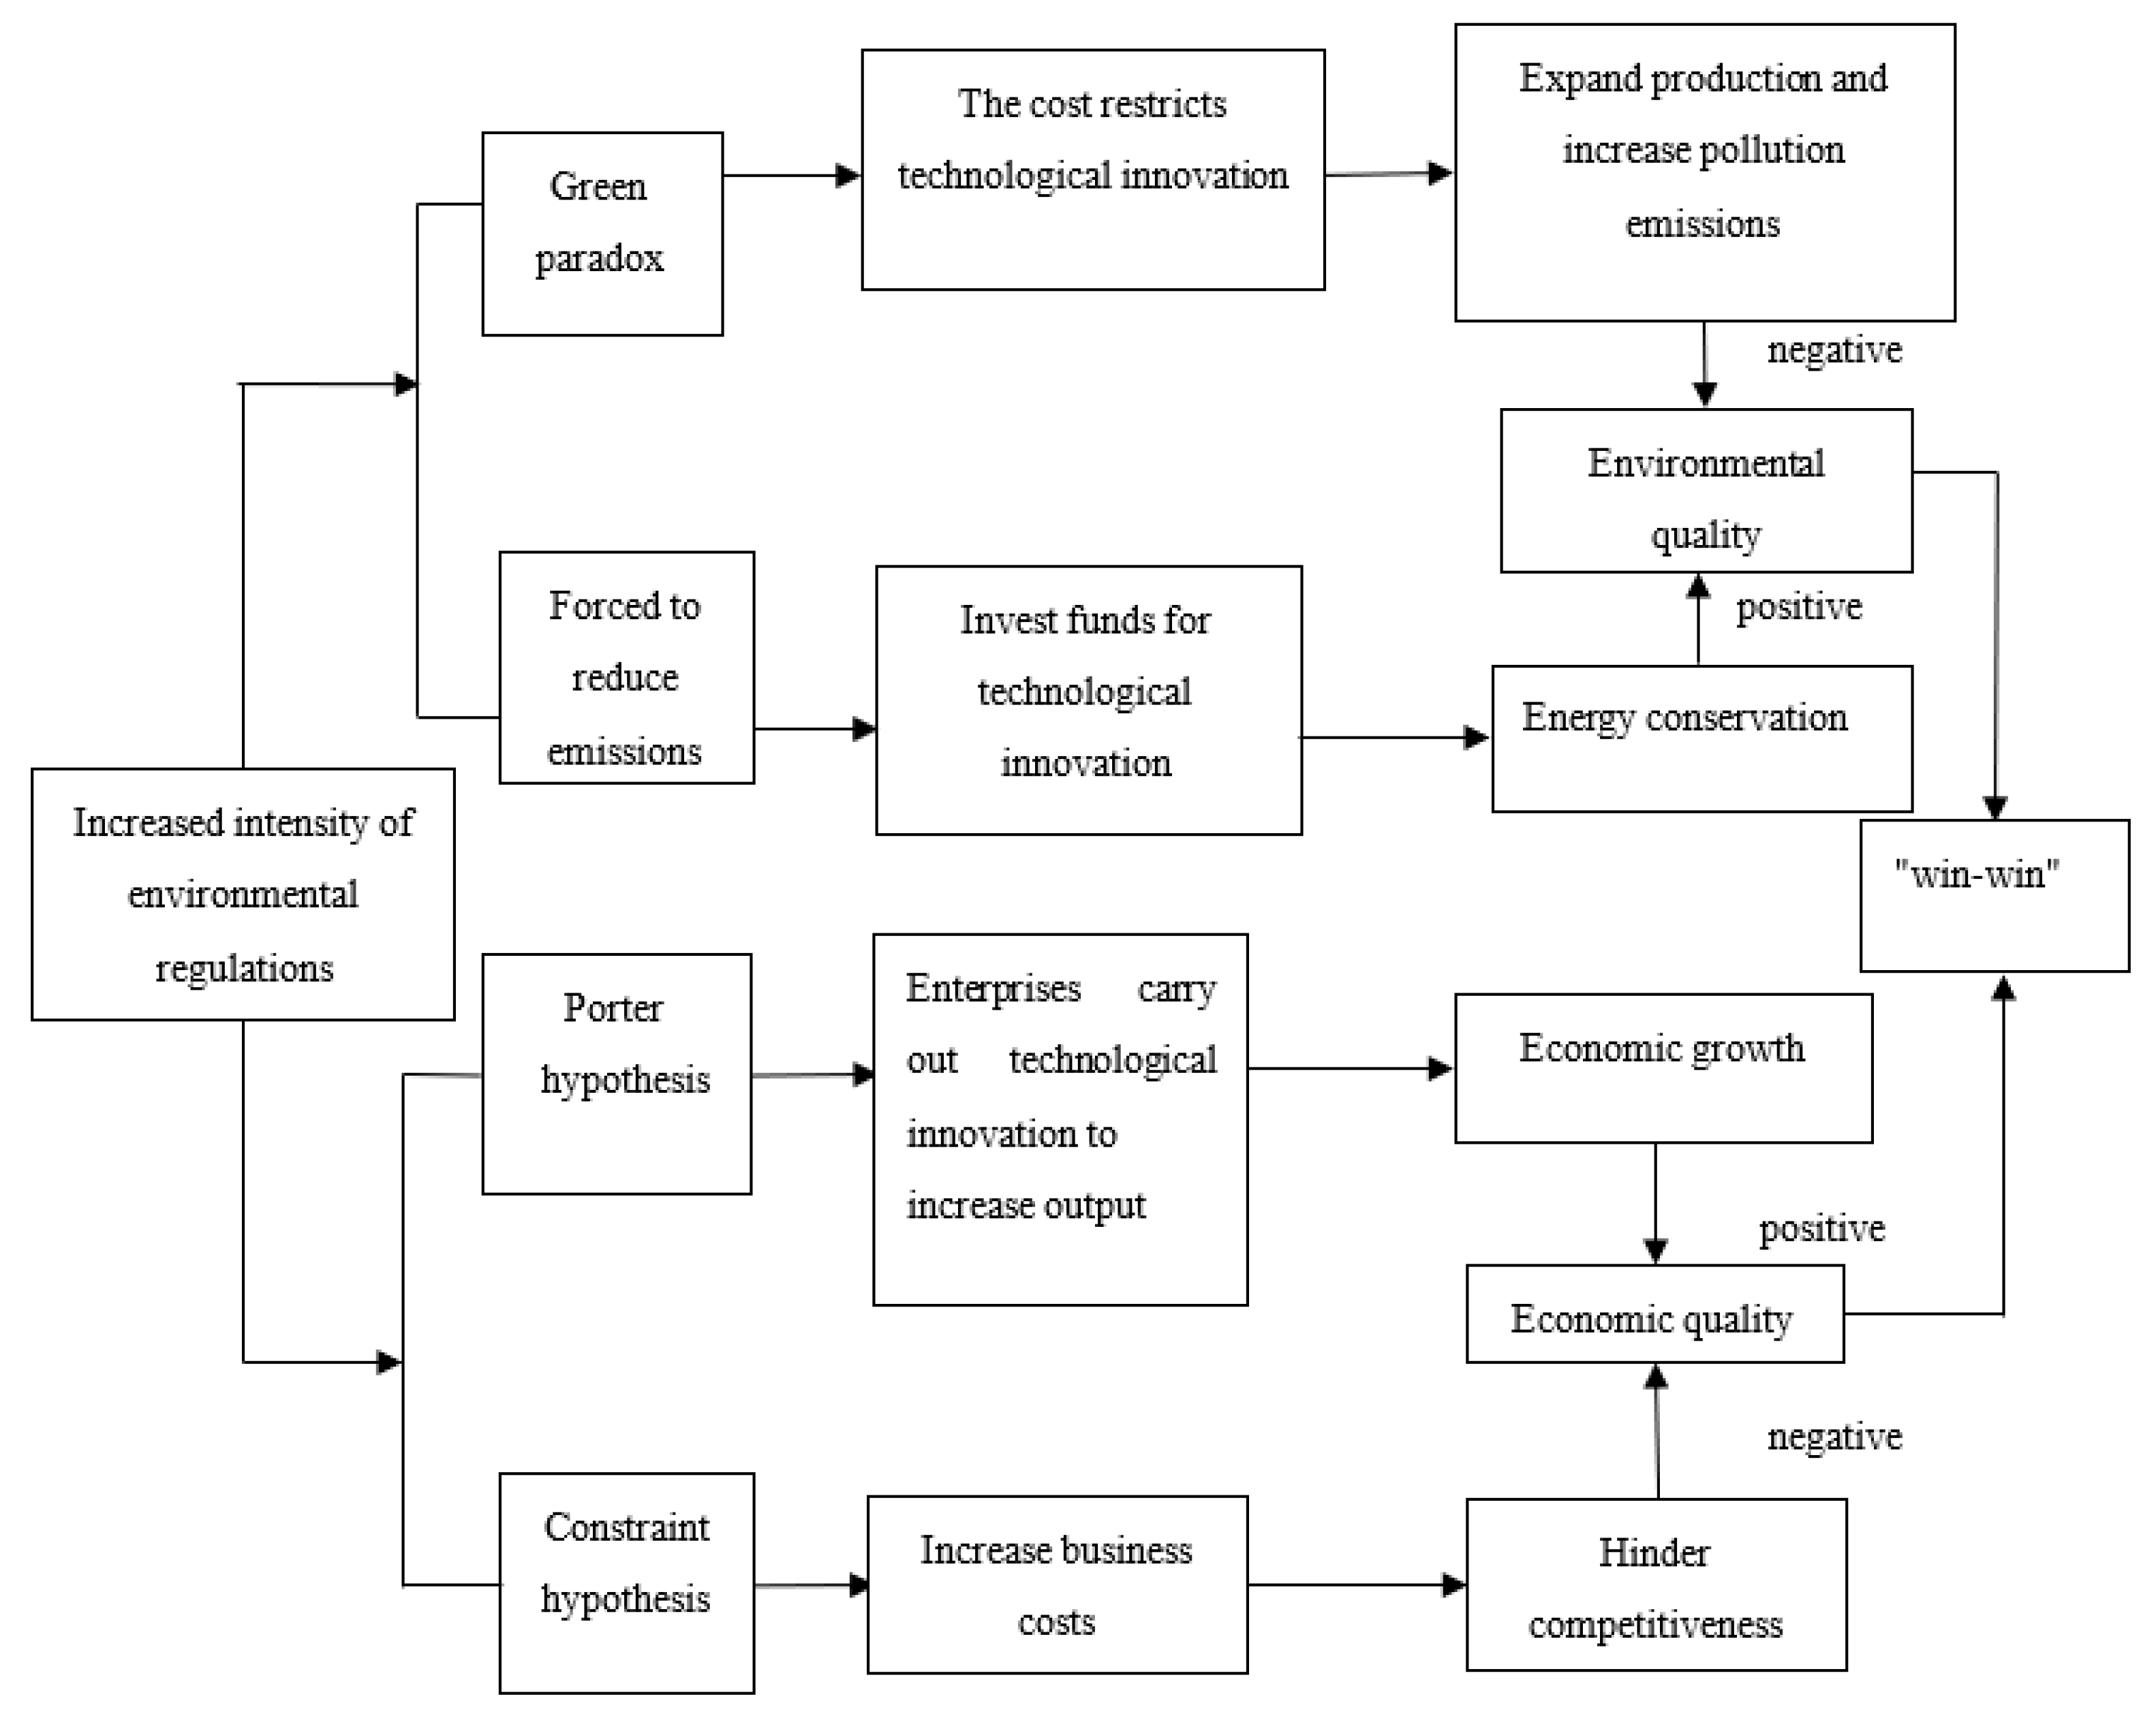
2. Theoretical Analysis
3. Research Design
3.1. Model Specification
3.2. Variable Selection
3.2.1. Green Total Factor Productivity (GTFP)
3.2.2. Other Variables
3.3. Data Description
3.4. Correlation Analysis
4. Empirical Analysis
4.1. Impact of Environmental Regulation on Environmental Quality and Economic Quality
4.1.1. Environmental Quality (PM2.5)
4.1.2. Economic Quality (GTFP)
4.2. Research by Region
4.3. Robustness Tests
5. Conclusions and Discussion
5.1. Summary and Conclusions
5.2. Suggestions and Enlightenment
Author Contributions
Funding
Institutional Review Board Statement
Informed Consent Statement
Data Availability Statement
Conflicts of Interest
References
- Liu, A.; Gu, X. Environmental regulation, technological progress and corporate profit: Empirical research based on the threshold panel regression. Sustainability 2020, 12, 1416. [Google Scholar] [CrossRef]
- Zhao, X. Exploring the spatial variation characteristics and influencing factors of PM2.5 pollution in China: Evidence from 289 Chinese cities. Sustainability 2019, 11, 4751. [Google Scholar] [CrossRef]
- Woods, N.D. Interstate competition and environmental regulation: A test of the race-to-the-bottom thesis. Soc. Sci. Q. 2006, 87, 174–189. [Google Scholar] [CrossRef]
- He, K.; Yang, F.; Ma, Y.; Zhang, Q.; Yao, X.; Chan, C.K.; Cadle, S.; Chan, T.; Mulawa, P. The characteristics of PM2.5 in Beijing, China. Atmos. Environ. 2001, 35, 4959–4970. [Google Scholar] [CrossRef]
- Song, Y.; Yang, T.; Li, Z.; Zhang, X.; Zhang, M. Research on the direct and indirect effects of environmental regulation on environmental pollution: Empirical evidence from 253 prefecture-level cities in China. J. Clean. Prod. 2020, 269, 122425. [Google Scholar] [CrossRef]
- Ziguang, X.; Fei, X.; Pengfei, G. Impact of China’s OFDI on green total factor productivity of countries along the “Belt and Road”. J. Shanghai Univ. Financ. Econ. 2019, 21, 96–110. [Google Scholar]
- Song, K.; Bian, Y.; Zhu, C.; Nan, Y. Impacts of dual decentralization on green total factor productivity: Evidence from China’s economic transition. Environ. Sci. Pollut. Res. 2020, 27, 14070–14084. [Google Scholar] [CrossRef]
- Lanoie, P.; Patry, M.; Lajeunesse, R. Environmental regulation and productivity: Testing the porter hypothesis. J. Product. Anal. 2008, 30, 121–128. [Google Scholar] [CrossRef]
- Wang, Y.; Shen, N. Environmental regulation and environmental productivity: The case of China. Renew. Sustain. Energy Rev. 2016, 62, 758–766. [Google Scholar] [CrossRef]
- Hering, L.; Poncet, S. Environmental policy and exports: Evidence from Chinese cities. J. Environ. Econ. Manag. 2014, 68, 296–318. [Google Scholar] [CrossRef]
- Linde, P.C.V.D. Toward a new conception of the environment-competitiveness relationship. J. Econ. Perspect. 1995, 9, 97–118. [Google Scholar]
- Wagner, M. On the relationship between environmental management, environmental innovation and patenting: Evidence from German manufacturing firms. Res. Policy 2007, 36, 1587–1602. [Google Scholar] [CrossRef]
- Sueyoshi, T.; Goto, M.; Shang, J. Core business concentration vs. corporate diversification in the US electric utility industry: Synergy and deregulation effects. Energy Policy 2009, 39, 4583–4594. [Google Scholar] [CrossRef]
- Ramanathan, R.; Black, A.; Nath, P.; Muyldermans, L. Impact of environmental regulations on innovation and performance in the UK industrial sector. Manag. Decis. 2010, 48, 1493–1513. [Google Scholar] [CrossRef]
- Yuan, B.; Zhang, K. Can environmental regulation promote industrial innovation and productivity? Based on the strong and weak porter hypothesis. Chin. J. Popul. Resour. Environ. 2017, 15, 54–68. [Google Scholar] [CrossRef]
- Arouri, M.E.H.; Caporale, G.M.; Rault, C.; Sova, R.; Sova, A. Environmental regulation and competitiveness: Evidence from Romania. Ecol. Econ. 2012, 81, 130–139. [Google Scholar] [CrossRef]
- Aklin, M. Re-exploring the trade and environment nexus through the diffusion of pollution. Environ. Resour. Econ. 2016, 64, 663–682. [Google Scholar] [CrossRef]
- Zhang, J.; Wei, T. Study on the green total factor productivity in main cities of China. Soc. Sci. Electron. Publ. 2016, 34, 215–234. [Google Scholar]
- Berman, E.; Linda, T.; Bui, M. Environmental regulation and productivity: Evidence from oil refineries. Rev. Econ. Stat. 2001, 83, 498–510. [Google Scholar] [CrossRef]
- Domazlicky, B.R.; Weber, W.L. Does environmental protection lead to slower productivity growth in the chemical industry. Environ. Resour. Econ. 2004, 28, 301–324. [Google Scholar] [CrossRef]
- Porter, M.E. Towards a dynamic theory of strategy. Strateg. Manag. J. 1991, 12, 95–117. [Google Scholar] [CrossRef]
- Chen, S.; Golley, J. ‘Green’ productivity growth in China’s industrial economy. Energy Econ. 2014, 44, 89–98. [Google Scholar] [CrossRef]
- Song, M.; Wang, S. Can employment structure promote environment-biased technical progress? Technol. Forecast. Soc. Chang. 2016, 112, 285–292. [Google Scholar] [CrossRef]
- Zhang, C.; Liu, H.; Bressers, H.T.; Buchanan, K.S. Productivity growth and environmental regulations—Accounting for undesirable outputs: Analysis of China’s thirty provincial regions using the Malmquist—Luenberger index. Ecol. Econ. 2011, 70, 2369–2379. [Google Scholar] [CrossRef]
- Hamamoto, M. Environmental regulation and the productivity of Japanese industries. Resour. Energy Econ. 2006, 28, 299–312. [Google Scholar] [CrossRef]
- Zhang, C.; Lu, Y.; Guo, L.; Yu, T. The intensity of environmental regulation and technological progress of production. Econ. Res. J. 2011, 2, 113–124. [Google Scholar]
- Costantini, V.; Mazzanti, M. On the green and innovative side of trade competitiveness? The impact of environmental policies and innovation on EU exports. Res. Policy 2012, 41, 132–153. [Google Scholar] [CrossRef]
- Li, B.; Wu, S. Effects of local and civil environmental regulation on green total factor productivity in China: A spatial Durbin econometric analysis. J. Clean. Prod. 2016, 153, 342–353. [Google Scholar] [CrossRef]
- Zhou, Y.; Xu, Y.; Liu, C.; Fang, Z.; Fu, X.; He, M. The threshold effect of China’s financial development on green total factor productivity. Sustainability 2019, 11, 3776. [Google Scholar] [CrossRef]
- Wang, X.L.; Sun, C.Z.; Wang, S.; Zhang, Z.; Zou, W. Going green or going away? A spatial empirical examination of the relationship between environmental regulations, biased technological progress, and green total factor productivity. Int. J. Environ. Res. Public Health 2018, 15, 1917. [Google Scholar] [CrossRef]
- Smulders, S.; Tsur, Y.; Zemel, A. Announcing climate policy: Can a green paradox arise without scarcity? J. Environ. Econ. Manag. 2012, 64, 364–376. [Google Scholar] [CrossRef]
- Levinsohn, J.; Petrin, A. Estimating production functions using inputs to control for unobservables. Rev. Econ. Stud. 2010, 70, 317–341. [Google Scholar] [CrossRef]
- Bantscheff, M.; Hopf, C.; Savitski, M.M.; Dittmann, A.; Grandi, P.; Michon, A.-M.; Schlegl, J.; Abraham, Y.; Becher, I.; Bergamini, G.; et al. Chemoproteomics profiling of HDAC inhibitors reveals selective targeting of HDAC complexes. Nat. Biotechnol. 2011, 29, 255–265. [Google Scholar] [CrossRef] [PubMed]
- Lee, H.H.; Bettens, R.P.A.; Herbst, E. Fractional abundances of molecules in dense interstellar clouds: A compendium of recent model results. Astron. Astrophys. Suppl. 2017, 119, 111–114. [Google Scholar] [CrossRef]
- Stern, M.E. Propagation of a finite—Amplitude potential vorticity front along the wall of a stratified fluid. J. Fluid Mech. 2002, 468, 179–204. [Google Scholar] [CrossRef]
- Kamaruddin, M.; Kroetsch, T.; Basrur, P.K.; Hansen, P.J.; King, W.A. Immunolocalization of heat shock protein 70 in bovine spermatozoa. Andrologia 2015, 36, 327–334. [Google Scholar] [CrossRef]
- Schou, P. When environmental policy is superfluous: Growth and polluting resources. Scand. J. Econ. 2010, 104, 605–620. [Google Scholar] [CrossRef]
- Lucas, W.D. The effect of driving restrictions on air quality in Mexico city. J. Political Econ. 2008, 116, 1. [Google Scholar]
- Oliva, P. Environmental regulations and corruption: Automobile emissions in Mexico city. Ssrn Electron. J. 2009, 123, 686–724. [Google Scholar] [CrossRef][Green Version]
- Rubashkina, Y.; Galeotti, M.; Verdolini, E. Environmental regulation and competitiveness: Empirical evidence on the porter hypothesis from European manufacturing sectors. Energy Policy 2015, 83, 288–300. [Google Scholar] [CrossRef]
- Magat, W.A.; Viscusi, W.K. Effectiveness of the EPA’S regulatory enforcement: The case of industrial effluent standards. J. Law Econ. 1990, 33, 331–360. [Google Scholar] [CrossRef]
- Laplante, B.; Rilstone, P. Environmental inspections and emissions of the pulp and paper industry Inquebec. J. Environ. Econ. Manag. 1996, 31, 19–36. [Google Scholar] [CrossRef]
- Dasgupta, S.; Laplante, B.; Mamingi, N.; Wang, H. Inspections, pollution prices, and environmental performance: Evidence from China. Ecol. Econ. 2001, 36, 487–498. [Google Scholar] [CrossRef]
- Dasgupta, S.; Laplante, B.; Wang, H.; Wheeler, D. Confronting the environmental kuznets curve. J. Econ. Perspect. 2002, 16, 147–168. [Google Scholar] [CrossRef]
- Cole, M.A.; Elliott, R.J.R.; Shimamoto, K. Industrial characteristics, environmental regulations and air pollution: An analysis of the UK manufacturing sector. J. Environ. Econ. Manag. 2005, 50, 121–143. [Google Scholar] [CrossRef]
- Boyd, G.A.; Mcclelland, J.D. The impact of environmental constraints on productivity improvement in integrated paper plants. J. Environ. Econ. Manag. 1999, 38, 121–142. [Google Scholar] [CrossRef]
- Repetto, R.; Rothman, D.; Faeth, P.; Austin, D. Has environmental protection really reduced productivity growth? Challenge 1997, 40, 46–57. [Google Scholar] [CrossRef]
- Franco, C.; Marin, G. The effect of within-sector, upstream and downstream environmental taxes on innovation and productivity. Environ. Resour. Econ. 2013, 97, 1–31. [Google Scholar] [CrossRef]
- Albrizio, S.; Kozluk, T.; Zipperer, V. Environmental policies and productivity growth: Evidence across industries and firms. J. Environ. Econ. Manag. 2017, 81, 209–226. [Google Scholar] [CrossRef]
- Chintrakarn, P. Environmental regulation and U.S. States’ technical inefficiency. Econ. Lett. 2008, 100, 363–365. [Google Scholar] [CrossRef]
- Dufour, C.; Lanoie, P.; Patry, M. Regulation and productivity. J. Product. Anal. 1998, 9, 233–247. [Google Scholar] [CrossRef]
- Greenstone, M.; List, J.A.; Syverson, C. The effects of environmental regulation on the competitiveness of U.S. manufacturing. Am. Econ. Rev. 2012, 93, 431–435. [Google Scholar]
- Chung, Y.H.; Färe, R.; Grosskopf, S. Productivity and undesirable outputs: A directional distance function approach. J. Environ. Manag. 1997, 51, 229–240. [Google Scholar] [CrossRef]
- Haifeng, H.; Tao, W. The total-factor energy efficiency of regions in China: Based on three-stage SBM model. Sustainability 2017, 9, 1664. [Google Scholar]
- Managi, S.; Kaneko, S. Environmental productivity in China. Econ. Bull. 2004, 17, 1–10. [Google Scholar]
- Managi, S.; Kaneko, S. Economic growth and the environment in China: An empirical analysis of productivity. Int. J. Glob. Environ. Issues 2006, 6, 89–133. [Google Scholar] [CrossRef]
- Hailu, A.; Veeman, T.S. Environmentally sensitive productivity analysis of the Canadian pulp and paper industry, 1959–1994: An input distance function approach. J. Environ. Econ. Manag. 2000, 40, 251–274. [Google Scholar] [CrossRef]
- Fukuyama, H.; Weber, W.L. A directional slacks-based measure of technical inefficiency. Socio Econ. Plan. Sci. 2010, 43, 274–287. [Google Scholar] [CrossRef]
- Fare, R.; Grosskopf, S. Directional distance functions and slacks based measures of efficiency. Eur. J. Oper. Res. 2010, 200, 320–322. [Google Scholar] [CrossRef]
- Donkelaar, A.V.; Martin, R.V.; Brauer, M.; Boys, B.L. Use of satellite observations for long-term exposure assessment of global concentrations of fine particulate matter. Environ. Health Perspect. 2015, 123, 135. [Google Scholar] [CrossRef]
- Li, Y.; Chen, Y. Development of an SBM-ML model for the measurement of green total factor productivity: The case of pearl river delta urban agglomeration. Renew. Sustain. Energy Rev. 2021, 145, 111131. [Google Scholar] [CrossRef]
- Li, Y.; Li, S. The influence study on environmental regulation and green total factor productivity of China’s manufacturing industry. Discret. Dyn. Nat. Soc. 2021, 2021, 1–15. [Google Scholar] [CrossRef]
- Hao, Y.; Deng, Y.; Lu, Z.N.; Chen, H. Is environmental regulation effective in China? Evidence from city-level panel data. J. Clean Prod. 2018, 188, 966–976. [Google Scholar] [CrossRef]
- Chen, Z.; Zhang, X.; Chen, F. Have driving restrictions reduced air pollution: Evidence from prefecture-level cities of China. Environ. Sci. Pollut. Res. 2021, 28, 3106–3120. [Google Scholar] [CrossRef]
- Zhao, S. Privatization, FDI inflow and economic growth: Evidence from China’s provinces, 1978–2008. Appl. Econ. 2013, 45, 2127–2139. [Google Scholar] [CrossRef]
- Ran, J.; Voon, J.P.; Li, G. How does FDI affect China? Evidence from industries and provinces. J. Comp. Econ. 2007, 35, 774–799. [Google Scholar] [CrossRef]
- Kula, F.; Asian, A.; Ozturk, I. Is per capita electricity consumption stationary? Time series evidence from OECD countries. Renew. Sustain. Energy Rev. 2012, 16, 501–503. [Google Scholar] [CrossRef]
- Resch, E.R.; Bohne, R.A.; Kvamsda, T.; Lohne, J. Impact of urban density and building height on energy use in cities. Energy Procedia 2016, 96, 800–814. [Google Scholar] [CrossRef]
- Andersson, R.; Quigley, J.M.; Wilhelmsson, M. Urbanization, productivity and innovation: Evidence from investment in higher education. Berkeley Program Hous. Urban Policy Work. Pap. 2009, 66, 2–15. [Google Scholar] [CrossRef]
- Yang, Z.J.; Zhong, Y.H. The effect of R&D on energy-saving and emission-reduction:empirical research based on Chinese Provincial panel data. J. Huaihua Univ. 2017, 36, 24–30. [Google Scholar]
- Enkel, E.; Gassmann, O.; Chesbrough, H. Open R&D and open innovation: Exploring the phenomenon. R&D Manag. 2009, 39, 311–316. [Google Scholar] [CrossRef]
- Ge, T.; Qiu, W.; Li, J.; Hao, X. The impact of environmental regulation efficiency loss on inclusive growth: Evidence from China. J. Environ. Manag. 2020, 268, 110700. [Google Scholar] [CrossRef] [PubMed]


| Classification | Name | Interpretation | Symbol | References |
|---|---|---|---|---|
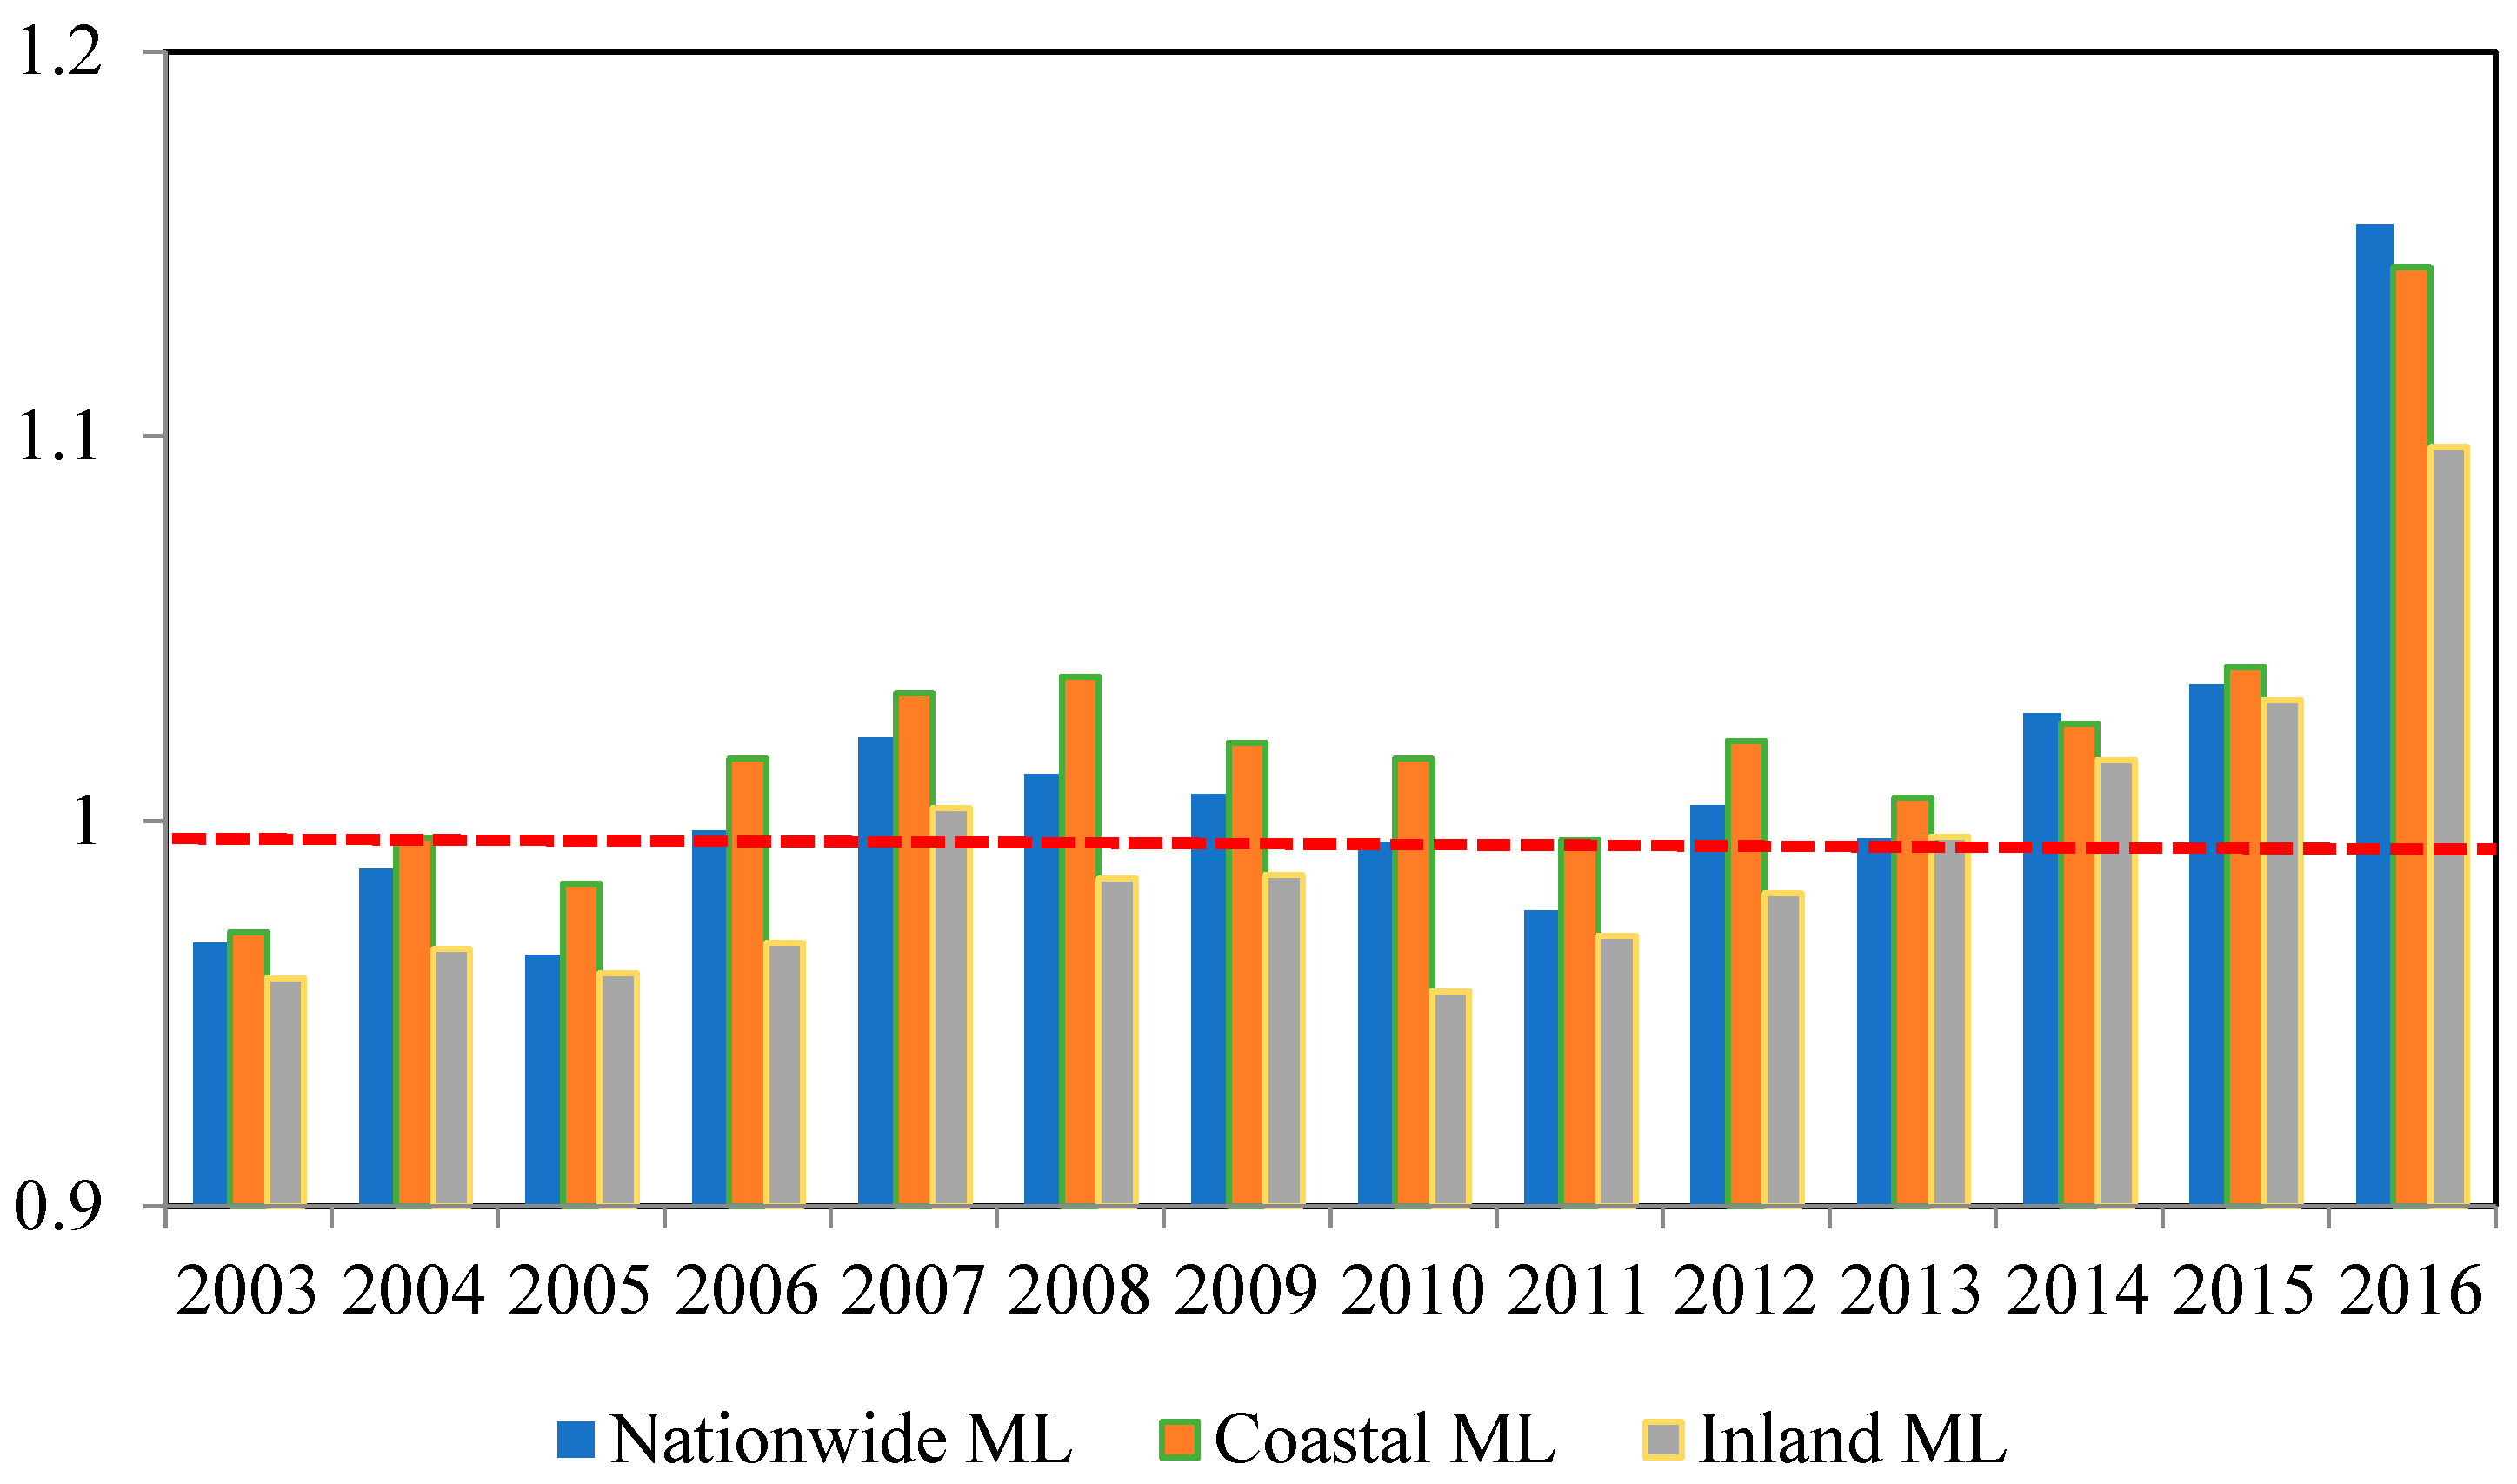
| Explained variable | Economic quality | Green total factor productivity, Malmquist–Luenberger exponent calculation based on nonradial SBM directional distance | GTFP | [61,62] |
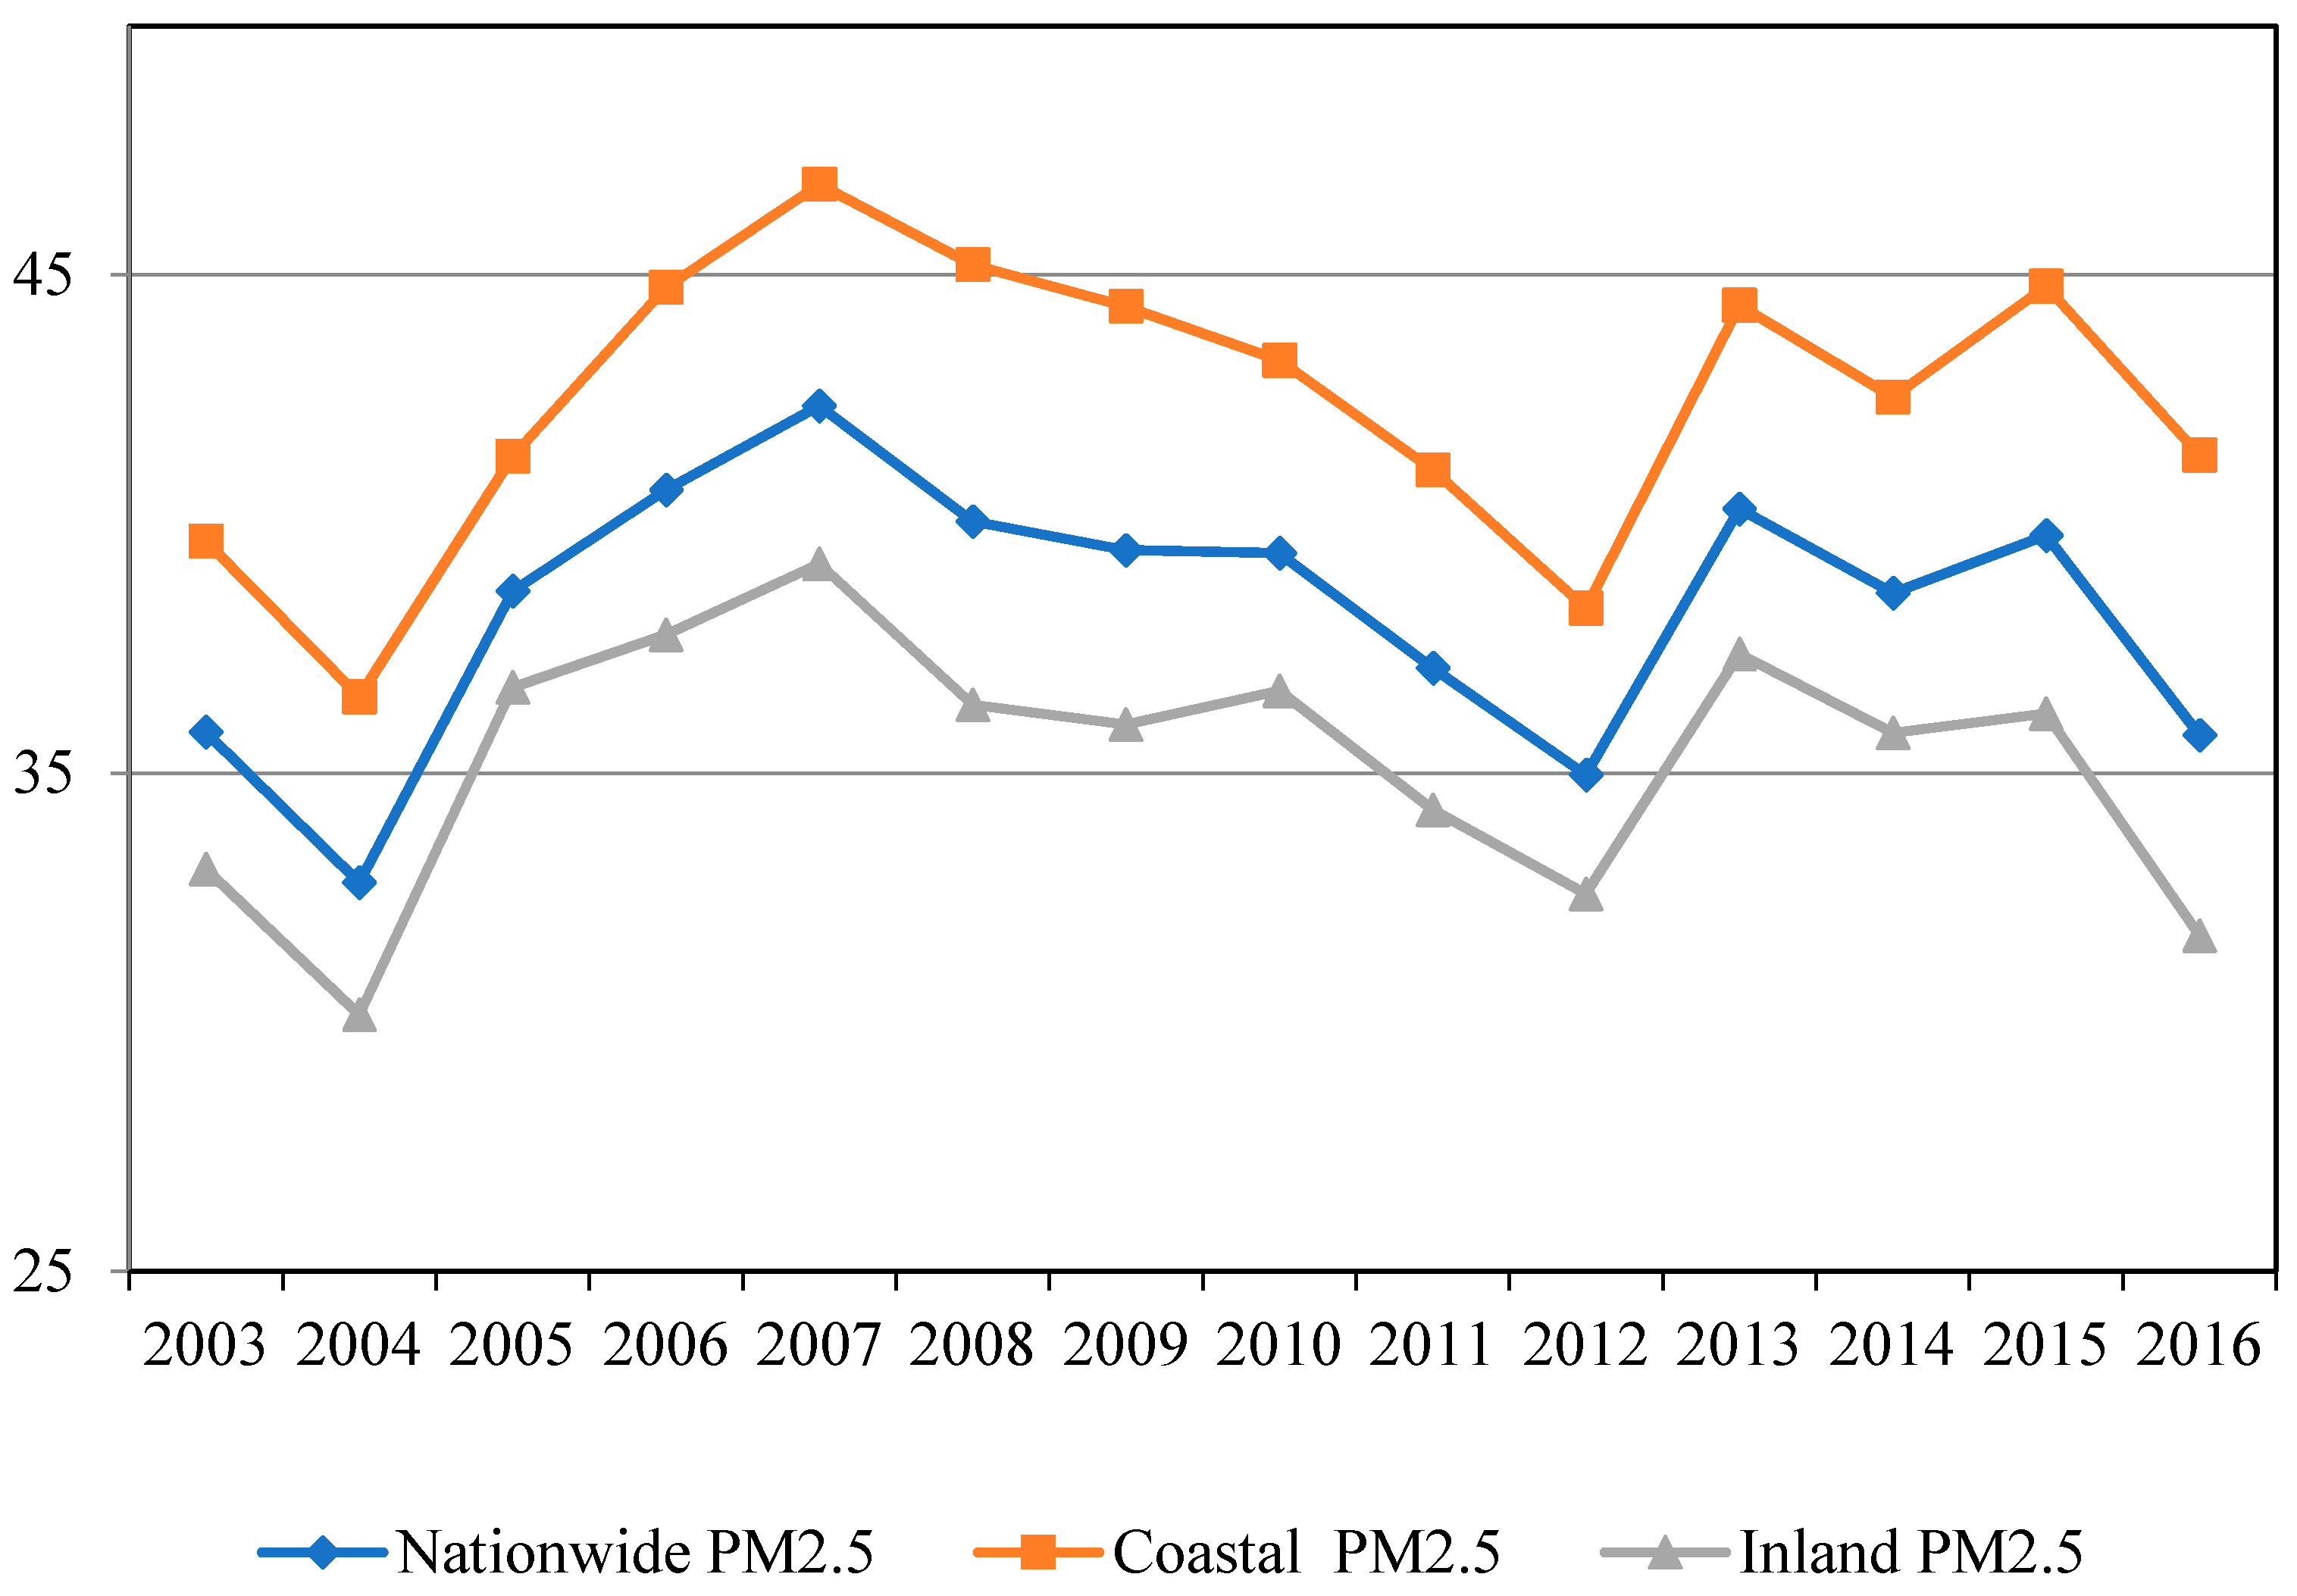
| Environmental quality | PM2.5 concentration data is based on the grid data of global PM2.5 concentration from 2003 to 2016 provided by the Center for Social and Economic Data and Application of Columbia University | PM2.5 | [60] | |
| Explanatory variable | Environmental-regulation intensity | The intensity of environmental regulations is calculated by entropy weight method through the five single indexes of industrial SO2 removal rate, smoke and dust removal rate, comprehensive utilization rate of industrial solid waste, domestic sewage treatment rate, and harmless treatment rate of domestic garbage. | GEV | [45,63] |
| Control variable | Level of urban development | GDP growth rate = (GDP of the previous year–GDP of the current year)/GDP of the previous year | GDP | [5] |
| Industrial structure | Added value of tertiary industry/added value of secondary industry | IS | [5,64] | |
| Opening up | Total industrial output value of foreign-invested enterprises(CNY 10,000)/Gross regional Product (CNY 10,000) | FDI | [65,66] | |
| Informatization | Annual electricity consumption/Year-end total population (10,000 KW/person) | TEL | [67] | |
| Infrastructure | Urban road area per capita | ROD | [68] | |
| Educational level | The natural logarithm of education expenditure ( CNY 10,000) | ED | [69] | |
| Research and development | The natural logarithm of research and development expenditure ( CNY 10,000) | RD | [70,71] |
| GTFP | PM2.5 | GEV | GDP | IS | FDI | TEL | ROD | ED | RD | |
|---|---|---|---|---|---|---|---|---|---|---|
| Mean value | 1.01 | 38.27 | 0.67 | 0.12 | 0.91 | 0.18 | 0.57 | 11.27 | 11.33 | 8.57 |
| GTFP | 1 | |||||||||
| PM2.5 | 0.03 * | 1 | ||||||||
| GEV | 0.16 *** | 0.26 *** | 1 | |||||||
| GDP | −0.12 *** | −0.01 | −0.11 *** | 1 | ||||||
| IS | 0.10 *** | −0.09 *** | 0.13 *** | −0.09 *** | 1 | |||||
| FDI | 0.04 ** | 0.23 *** | 0.20 *** | 0.03 * | −0.03 | 1 | ||||
| TEL | 0.07 *** | −0.08 *** | 0.19 *** | −0.08 *** | −0.11 *** | 0.16 *** | 1 | |||
| ROD | 0.11 *** | 0.15 *** | 0.36 *** | −0.10 *** | −0.02* | 0.33 *** | 0.46 *** | 1 | ||
| ED | 0.19 *** | 0.20 *** | 0.55 *** | −0.11 *** | 0.22 *** | 0.37 *** | 0.25 *** | 0.33 *** | 1 | |
| RD | 0.18 *** | 0.22 *** | 0.56 *** | −0.11 *** | 0.18 *** | 0.38 *** | 0.29 *** | 0.39 *** | 0.91 *** | 1 |
| Variable | PM2.5 | GFTP | ||
|---|---|---|---|---|
| Model 1 | Model 2 | Model 3 | Model 4 | |
| GEV | −10.10 ** | −1.809 * | −0.117 *** | 0.391 *** |
| (4.221) | (0.935) | (0.0336) | (0.151) | |
| GEV2 | 6.783 ** | −0.416 *** | ||
| (3.367) | (0.121) | |||
| GDP | −1.125 | −1.092 | −0.0888 *** | −0.0868 *** |
| (0.766) | (0.766) | (0.0275) | (0.0274) | |
| IS | 0.604* | 0.625 ** | 0.0298 *** | 0.0311 *** |
| (0.315) | (0.315) | (0.011) | (0.011) | |
| FDI | 0.450 | 0.399 | 0.0478 | 0.0447 |
| (0.859) | (0.859) | (0.0308) | (0.0308) | |
| TEL | 0.2080 | 0.220 | −0.0069 | −0.006 |
| (0.2960) | (0.296) | (0.0106) | (0.0106) | |
| ROD | −0.00912 | −0.0110 | 0.0001 | −0.0002 |
| (0.0193) | (0.0193) | (0.0007) | (0.0007) | |
| ED | −0.903 *** | −0.916 *** | −0.005 | −0.006 |
| (0.293) | (0.293) | (0.01) | (0.0105) | |
| RD | −0.636 *** | −0.593 *** | 0.001 | 0.004 |
| (0.293) | (0.138) | (0.005) | (0.005) | |
| Year | Control | Control | Control | Control |
| Reign | Control | Control | Control | Control |
| Constant | 52.8 *** | 50.27 *** | 1.060 *** | 0.905 *** |
| (3.843) | (3.633) | (0.13) | (0.138) | |
| Observations | 3024 | 3024 | 3024 | 3024 |
| R2 | 0.315 | 0.314 | 0.140 | 0.143 |
| Variable | PM2.5 | GTFP | ||||||
|---|---|---|---|---|---|---|---|---|
| Coastal | Inland | Coastal | Inland | |||||
| Model 5 | Model 6 | Model 7 | Model 8 | Model 9 | Model 10 | Model 11 | Model 12 | |
| GEV2 | 0.0194 | 7.457 | −0.294 ** | −0.388 ** | ||||
| (5.164) | (4.691) | (0.131) | (0.193) | |||||
| GEV | −2.560 * | −2.585 | −1.502 | −10.41 * | −0.126 *** | 0.251 * | −0.136 *** | 0.327 * |
| (1.470) | (6.794) | (1.223) | (5.732) | (0.0373) | (0.172) | (0.0504) | (0.236) | |
| GDP | −0.590 | −0.590 | −3.490 | −3.556 | −0.0875 *** | −0.0862 *** | −0.105 | −0.102 |
| (0.763) | (0.764) | (2.573) | (2.572) | (0.0193) | (0.0193) | (0.106) | (0.106) | |
| IS | 0.618 | 0.618 | 0.663 | 0.688 * | 0.0468 *** | 0.0487 *** | 0.0271 | 0.0258 |
| (0.518) | (0.519) | (0.414) | (0.414) | (0.0131) | (0.0131) | (0.0171) | (0.0171) | |
| FDI | 2.424 ** | 2.424 ** | −2.399 | −2.450 | 0.0433 * | 0.0391 | 0.0128 | 0.0154 |
| (1.028) | (1.031) | (1.502) | (1.502) | (0.0260) | (0.0261) | (0.0619) | (0.0619) | |
| TEL | −2.166 *** | −2.166 *** | 0.427 | 0.418 | −0.0266 | −0.0262 | −0.00175 | −0.0013 |
| (0.823) | (0.823) | (0.327) | (0.327) | (0.0209) | (0.0208) | (0.0135) | (0.0135) | |
| ROD | −0.0057 | −0.0057 | 0.0234 | 0.0237 | 0.00004 | −0.0001 | −0.001 | −0.001 |
| (0.0237) | (0.0238) | (0.0314) | (0.0314) | (0.0006) | (0.001) | (0.0013) | (0.0013) | |
| ED | −0.826 * | −0.826 * | −0.793 ** | −0.797 ** | 0.00249 | 0.002 | −0.0105 | −0.0103 |
| (0.498) | (0.499) | (0.370) | (0.370) | (0.0126) | (0.0126) | (0.0153) | (0.0152) | |
| RD | −0.788 *** | −0.788 *** | −0.506 *** | −0.552 *** | 0.00198 | 0.004 | −0.0003 | 0.002 |
| (0.220) | (0.223) | (0.179) | (0.182) | (0.00557) | (0.006) | (0.007) | (0.007) | |
| Year | Control | Control | Control | Control | Control | Control | Year | Control |
| Region | Control | Control | Control | Control | Control | Control | Region | Control |
| Constant | 55.29 *** | 55.30 *** | 44.10 *** | 46.88 *** | 0.980 *** | 0.856 *** | 1.128 *** | 0.983 *** |
| (4.827) | (5.301) | (3.520) | (3.929) | (0.122) | (0.134) | (0.145) | (0.162) | |
| Observations | 1260 | 1260 | 1764 | 1764 | 1260 | 1260 | 1764 | 1764 |
| R2 | 0.399 | 0.399 | 0.294 | 0.295 | 0.190 | 0.193 | 0.144 | 0.146 |
| Variable | PM2.5 | GTFP | ||
|---|---|---|---|---|
| Model 13 | Model 14 | Model 15 | Model 16 | |
| ERE | −3.296 *** | −6.669 *** | −0.088 *** | 0.204 *** |
| (0.308) | (0.639) | (0.008) | (0.017) | |
| ERE2 | 0.598 *** | −0.0206 *** | ||
| (0.099) | (0.003) | |||
| GDP | −0.037 | −0.042 | −0.0014 * | −0.0015 ** |
| (0.027) | (0.027) | (0.001) | (0.001) | |
| IS | −4.789 *** | −5.209 *** | 0.002 | −0.0123 |
| (0.597) | (0.598) | (0.016) | (0.0162) | |
| FDI | 5.655 *** | 4.401 *** | −0.121 *** | −0.165 *** |
| (1.282) | (1.292) | (0.035) | (0.035) | |
| TEL | −5.973 *** | −6.594 *** | 0.063 *** | 0.042 ** |
| (0.609) | (0.614) | (0.017) | (0.017) | |
| ROD | 0.323 *** | 0.324 *** | 0.007 *** | 0.007 *** |
| (0.048) | (0.048) | (0.001) | (0.001) | |
| ED | −1.056 * | −1.226 ** | 0.0632 *** | 0.057 *** |
| (0.540) | (0.537) | (0.015) | (0.015) | |
| RD | 1.583 *** | 1.620 *** | −0.022 ** | −0.021 ** |
| (0.339) | (0.337) | (0.009) | (0.009) | |
| Year | Control | Control | Control | Control |
| Reign | Control | Control | Control | Control |
| Constant | 43.61 *** | 48.53 *** | 0.493 *** | 0.662 *** |
| (3.947) | (4.008) | (0.107) | (0.109) | |
| Observations | 3024 | 3024 | 3024 | 3024 |
| R2 | 0.16 | 0.17 | 0.1 | 0.11 |
Publisher’s Note: MDPI stays neutral with regard to jurisdictional claims in published maps and institutional affiliations. |
© 2021 by the authors. Licensee MDPI, Basel, Switzerland. This article is an open access article distributed under the terms and conditions of the Creative Commons Attribution (CC BY) license (https://creativecommons.org/licenses/by/4.0/).
Share and Cite
Li, X.; Cheng, B.; Hong, Q.; Xu, C. Can a Win–Win Situation of Economy and Environment Be Achieved in Cities by the Government’s Environmental Regulations? Sustainability 2021, 13, 5829. https://doi.org/10.3390/su13115829
Li X, Cheng B, Hong Q, Xu C. Can a Win–Win Situation of Economy and Environment Be Achieved in Cities by the Government’s Environmental Regulations? Sustainability. 2021; 13(11):5829. https://doi.org/10.3390/su13115829
Chicago/Turabian StyleLi, Xinfei, Baodong Cheng, Qiling Hong, and Chang Xu. 2021. "Can a Win–Win Situation of Economy and Environment Be Achieved in Cities by the Government’s Environmental Regulations?" Sustainability 13, no. 11: 5829. https://doi.org/10.3390/su13115829
APA StyleLi, X., Cheng, B., Hong, Q., & Xu, C. (2021). Can a Win–Win Situation of Economy and Environment Be Achieved in Cities by the Government’s Environmental Regulations? Sustainability, 13(11), 5829. https://doi.org/10.3390/su13115829