Abstract
This study aims to explore how customer segments are characterised by leisure and mobility orientations. By means of a survey, Swiss rail customers’ socioeconomic and trip profiles as well as attitudes towards taking the rail in their leisure time were collected. Respondents were free to take part in the survey by telephone or online, resulting in 1235 full interviews. A principal component analysis followed by segmentation through cluster analysis was conducted to derive their socio-economic and trip profiles and collect data on their attitudes towards using rail in their leisure time. Five railway customer segments were established, each demonstrating typical leisure orientations and specific attitudes towards the use of rail in leisure time and on tourist trips. This paper contributes to understanding the salient preferences of each segment and provides transport companies with clear indications for developing market-oriented offerings.
1. Introduction
Customer-oriented marketing of mobility services is based on several customer characteristics. Socio-economic characteristics of persons (e.g., age) and certain behavioural characteristics (e.g., commuting versus other travel purposes) have traditionally been used for customer segmentation in the public transport industry [1,2,3]. According to existing research, other characteristics should be considered for marketing purposes: for example, preferences and orientations regarding certain activities outside the home—which are occasions for mobility—and attitudes regarding the various means of transport available to users in the relevant field of activity [4,5,6]. The underlying assumption is that different lifestyles exist within the population, which are, in turn, expressed as different consumption styles. Applied to mobility and the use of mobility services, these are referred to as the population’s ‘mobility styles’ [7].
Customer segmentation in the public transport domain can be based on such mobility styles if individual groups of the population actually differ greatly in terms of their mobility orientations and use of mobility services; e.g., if they use the train to a different extent and in different ways for excursions depending on their mobility style or use combination offers for travel and tourist services. In such cases, precise knowledge of these mobility styles offers added value compared to customer segmentations based only on a few socio-demographic characteristics or behavioural traits. This is because it enables more precise determination of what customers in individual mobility style groups prefer in their leisure time, when travelling, and how they feel about the use of railways as a means of transport for leisure activities in everyday life or for travel activities [8]. This knowledge can be used for segment-specific marketing activities in service development, communication with customers, sales and pricing policy. Considering the market potential of individual customer segments and the future development of the structure of these segments can also indicate the orientation of strategic marketing.
However, rail customer segmentations have thus-far been based primarily on socio-demographic characteristics (e.g., age) and behavioural characteristics (e.g., type of subscription ownership) [1,2,3]. This study aims to bridge this research gap through an interview-based survey tailored to generate data for rail travel for leisure and tourism purposes (i.e., not considering business travel purposes) among Swiss residents aged between 16 and 85 years. This study was designed to test the hypothesis that rail customers in the individual segments differ across key parameters of transport behaviour, including the number of kilometres travelled annually by rail, the number of daily trips and trips with overnight stays and customer value (average annual expenses on rail travel for leisure and tourism). The results of the data analyses are important for determining the sales and revenue potential of individual customer segments for the railways and for the segment-specific accentuation of marketing activities. Moreover, customer segmentation around leisure and tourism travel functions in the context of railway companies and their partners developing offers and services for the relevant market. Railways and other public transport companies can use the derived customer segment profiles to gain insight into the offers they can use to target their customers in the leisure and travel market, enabling access to potential value creation in the context of leisure and tourism transport.
2. Literature Review
Customer segmentation is an established method for dividing the (potential) customers of a market into heterogeneous groups. Meanwhile, the members of a group are homogeneous, i.e., they share similar characteristics regarding, for example, life situation, interests or needs. In the mobility sector, customer segmentation is useful for identifying the demographic, psychographic and behavioural characteristics of a customer group and addressing their requirements for mobility services [5,9,10]. There is existing research that uses cluster analysis in the transportation sector, for example to identify different segments of traffic accidents [11,12] or different groups of passengers with regard to service quality in public transport [13]. Especially the latter is worth mentioning in our research context, as it also identifies different clusters of passengers (the young students, working women, sporadic passengers, elderly passengers) in public transportation in order to develop personalised marketing measures that increase its use. Reference [14] argue that customer segmentation in public transport is an effective strategy for developing tailored offers and targeting specific customer groups using personalised advertising and incentives. The effectiveness of measures (e.g., marketing strategies) depends on the extent to which the heterogeneity and individual needs of customers are considered [1,15]. The classic approaches to customer segmentation in the mobility sector are based on gender [2,16], age [2,3] or occupation (employee, senior, student) [1]. However, neither common needs nor interests or behavioural patterns can be identified using such socio-demographic factors for segmentation. These can be very heterogeneous within a group and are subsequently not addressed by the respective marketing strategies [5].
Therefore, different approaches have been developed in recent years to segment public transport customers. For example, passengers can be grouped based on temporal, spatial, or socio-demographic characteristics, as well as activity orientations, e.g., [5,6,8]. Existing segmentation of tourist travellers within the Swiss population focuses on travel motives but is focused on the submarket of tourist travel involving overnight stays in Switzerland and abroad, with only marginal consideration of attitudes regarding the choice of transport [17]. Within this segmentation, a mix of leisure orientations and mobility orientations could be particularly suitable, given that the motive for a journey is usually the activity at the destination (e.g., hiking, visiting a museum). Depending on the type of leisure orientation, a segment needs or wants to be more mobile. Additionally, it is worth probing whether these segments prefer their trips to be by train and whether the journey itself is also an experience for the passenger [8,18]. Elsewhere, another study on leisure mobility styles included only the subpopulation of the Swiss agglomeration population and focused on everyday leisure mobility [18]. Foreign studies on leisure mobility styles [19] can only be transferred to the Swiss market to a limited extent due to differences in both social structure and the incentive and supply structure. Furthermore, current research lacks practical implications on the ways public transport operators can utilise segmentation insights in concrete supply optimisation. This study provides added value by deriving measures that have been presented to and evaluated by practitioners.
3. Study Design
3.1. Conceptual Approach
Regarding leisure activities and activities on tourist trips, the study focuses on activity-related orientations of traffic participants, which were measured by the subjective importance assigned to 27 leisure and private travel activities. These activities were selected based on results from previous studies on mobility styles in Switzerland [18].
Regarding rail use, first, attitudes towards taking the railway for leisure and travel were queried. Second, participants were asked whether other relevant persons in their environment articulate expectations of using the train for day trips (i.e., social norm). Third, regarding personal norms, participants were asked whether the train was generally used for leisure regardless of the weather (i.e., whether the person was relatively ‘weather-resistant’) and whether there was a self-commitment to generally using the train as a means of transport for day trips for environmental reasons. Fourth, the extent of perceived behavioural control was approached in terms of the ease of rail use for leisure travel, the accessibility of day trips and vacation travel destinations by rail, and the perceived costs of using the train for leisure travel. A total of 26 items were used to survey attitudes, norms, and control perceptions; these were based on [20,21,22].
The identified mobility segments for leisure and tourism trips are characterised by typical constellations regarding the two superordinate dimensions ‘activity orientations in leisure and private trips’ and ‘rail-related attitudes, norms and perceived behavioural control’. Other surveyed characteristics of the interviewees serve to further characterise and describe the respective customer segments. From the perspective of theories of rational choice [23], the (objectively measured) resource endowment of individuals can be relevant. It is expected that resource endowment influences the scope of action against the background of which certain activity orientations in leisure and travel can become apparent [24]. Empirical studies on mobility also indicate that the form of life or a person’s life stage should not be underestimated in attitudinal comparisons [25]. That is, specific preferences for leisure activities and requirements for mobility can arise depending on, for example, one’s family situation, the number of children in the household, the type of partner relationship or the phase of life (e.g., employment or retirement). Figure 1 presents the explanatory model of customer segmentation based on leisure and mobility orientations. An overview of the survey questions is provided in Appendix A.
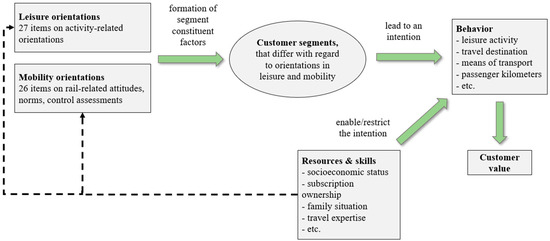
Figure 1.
Explanatory model of customer segmentation (source: own illustration).
3.2. Implementation of the Survey
Customer segmentation refers to the mobility of the Swiss resident population in the submarkets (1) leisure travel for everyday purposes, (2) day trips with private purposes and (3) trips with overnight stays with private purposes. There is a focus on trips and travel by rail. This study categorises trips connected to a multi-local lifestyle—where people regularly visit, for example, vacation homes or apartments, relatives or friends, or partners living in a different location—as leisure traffic or travel in this study because they occur for private, non-commercial reasons and can involve considerable annual traffic [26]. Trips for business purposes have been excluded because they feature different work-related reasons and require separate customer segmentation.
Survey respondents were persons between the ages of 16 and 85 pertaining to the resident population of Switzerland in the German- and French-speaking parts of the country. It was assumed that people in this age range were largely free to make mobility decisions for leisure and travel. The formation of customer segments was limited to the group of rail users. At the end of 2012, this was a total of 4.5 million people in the resident population of the German-speaking and French-speaking parts of Switzerland (meaning there were 1.7 million non-customers in these parts of the country). The criterion for rail use was at least one rail trip in the 12 months prior to taking the survey. The field period was from 21 January 2013 to 31 March 2013.
Respondents were selected using address data (telephone numbers) provided by the commissioned survey institute LINK (Lucerne). The survey was conducted in two stages. The first stage involved randomly selecting a household, and extracting individual information on the structure of the household. The second stage involved randomly selecting a person from each household to be interviewed in detail about their mobility style. This second stage was followed by screening persons based on the criterion of rail use in the last 12 months, enabling the recruitment of the group of rail users to be surveyed in detail.
Respondents were free to conduct the main survey by either telephone or online, with 43% of interviews conducted by telephone (57% online). The coverage rate at the household selection stage was 73%. At the second stage, coverage of target persons in a broader sense (users and non-users of railways) was 89%. Among the group of rail users, it was 85%. The combined response rate across all survey levels was 56%. With rail users as target persons, 1235 full interviews were realised (from 2594 household interviews). The mean duration of the telephone interviews was 26 min (median 25 min), and that of the online survey was 35 min (median 23 min).
3.3. Methods
Customer segments were formed over seven steps (see Table 1). The last step applies the findings to the development and advancement of offerings.

Table 1.
Working steps for customer segmentation (source: authors).
4. Analyses and Results
4.1. Factor Analyses
If the Kaiser-Meyer-Olkin criterion (KMO) is considered across all variables for leisure orientations (mobility orientations), a value of 0.805 (0.861) is the output for the correlation matrix. If the KMO criterion is considered variable-specific, no variable is below the threshold value of 0.5 for either orientation [27]. As such, it can be concluded that the variables are suitable for factor-analytical purposes, and all 27 (26) variables can be used for the analysis. Based on a plausibility assessment and a termination criterion with an eigenvalue greater than the value 1, seven (eight) factors were generated. The seven (eight) factors explain 51.6% (58.0%) of the variance. Appendix B presents the rotated component matrices for both leisure and mobility orientations.
Therefore, the leisure and tourism customer segments are based on seven factors of leisure orientations and eight factors of attitudes toward railroad use for leisure and personal travel, which were extracted from the more comprehensive set of items using principal component analysis. For each of the two dimensions, the extracted factors are independent of each other. They each statistically explain over 50% of the variance in the dataset. The following table (Table 2) reproduces collective terms of the respective factors, with the 15 factors spanning a 15-dimensional feature space in which the five identified customer segments of rail customers are situated.
Table 2.
Constituent principal components of segmentation (proportion of variance explained) (source: authors).
4.2. Cluster Analysis
Cluster analysis is a method for forming groups that aims to group together people demonstrating a largely related property structure. The chosen proximity measure for determining the homogeneous subsets of objects is the distance (dissimilarity) between the objects [28].
In this case, the basis for group formation is the persons interviewed in the survey. Through the previous factor analyses, characteristics were determined for these persons. Using the seven factors for leisure and eight factors for mobility orientation, a hierarchical-agglomerative clustering procedure was conducted [29]. Ward’s method was used to group factors such that internal variance increases minimally if a merger occurs. The variance criterion is used as a heterogeneity measure (error sum of squares), enabling determination of a termination criterion for the number of clusters. The increase in the error sum of squares was greatest between the fourth and fifth cluster solution. Given that the five-cluster solution also appeared to be suitable for manageability and interpretability, a five-cluster solution was favoured. After this step, the cluster centres were stored, and the solution was tested using a partitioning procedure involving the widely used K-Means algorithm. The five-cluster-typology proved to be easily interpreted because the results for the cluster centres demonstrated a high degree of similarity to the solution found using Ward’s method; thus, the results can be considered stable. The five-cluster solution derived from K-means subsequently forms the basis for defining mobility styles in leisure time among rail customers.
For individual customer segments, a specific profile of leisure orientations and rail-related mobility orientations emerges, with Table 3 showing the cluster centres of the mobility styles in leisure time for the five segments of rail travellers and highlights those profile characteristics that are comparatively strongly positive or negative for individual customer segments. The particularly strong characteristics were used to name or describe the main characteristics of the individual customer segments.
Table 3.
Segment-constituting leisure and mobility orientations (source: own illustration).
5. Discussion
The following figure (Figure 2) presents the five identified customer segments and their share of the Swiss resident population’s rail customers.
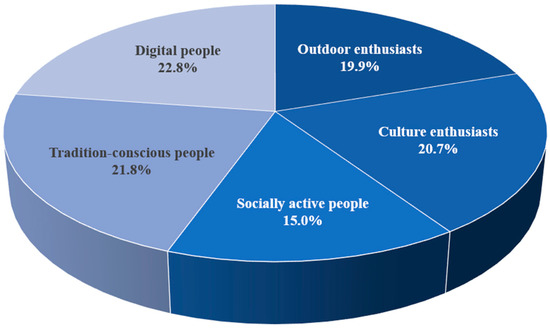
Figure 2.
Distribution of the rail customer segments in leisure and tourism (source: own illustration, n = 1235).
This section briefly describes the five identified customer segments according to their typical profile characteristics. Such characteristics are only mentioned where the customer segment in question clearly differs from other segments. The segments are presented in order of economic potential. The percentages provided refer to responses of ‘important’ plus ‘very important’ (on a five-point scale) for leisure orientations items. For attitudes towards rail-based mobility, the percentages refer to responses to relevant items of ‘strongly agree’ and ‘somewhat agree’ (also on a five-point scale).
5.1. Culture Enthusiasts
The culture enthusiasts segment comprises around 21% of Swiss rail customers. People in this segment spend an annual average of 280 Swiss francs on rail travel for leisure and tourism trips, representing the highest average value of all customer segments. Over 85% of culture enthusiasts own a subscription. About 46% of this segment’s annual train kilometres (average per person 5822 km) for travel purposes are for leisure and tourism trips.
- (a)
- Leisure orientations and travel behaviour in leisure and tourism:
Cultural activities, such as concerts (from classical to pop), museum visits and exhibitions, opera and theatre, are particularly important to culture enthusiasts compared to other customer segments. Being active (sports and going out) also tends to be highly important. In contrast, certain pleasure-related activities were of lower importance. For example, only 5% of respondents from this segment indicated that they liked to drive around by car or motorcycle, and wellness was important or very important to only 26%. Activities in nature and visiting mountains on excursion were also revealed to be comparatively low-priority items. Of the five customer segments, culture enthusiasts rank second for leisure-related day trips, making around half of those trips by train. They are travelling alone comparatively often (35%). Culture enthusiasts frequently visit another residence (e.g., a second home around 18 times a year; friends and acquaintances 12 times a year), using railway comparatively often as a means of transportation (for 32% of trips to a second residence and 70% of visits to friends and acquaintances).
- (b)
- Mobility orientations:
Culture enthusiasts are the least likely of all customer segments to perceive barriers to using rail for leisure: only 39% find day trips by rail too expensive, and only 5% find them complicated. Additionally, most (60%) feel safe from harassment when travelling by train in the evening. People in this customer segment travel in first class less often than average (5.3%). However, this customer segment features the highest proportion of people owning a GA Travelcard (26%), which allows unlimited use of public transport in Switzerland. This is matched by the affinity for e-ticketing being rather low compared to other customer segments. Culture enthusiasts demonstrate the strongest preference among all customer segments for short travel times over low prices and a high level of travel comfort.
- (c)
- Attitude towards weather:
Weather is of comparatively little importance to the leisure mobility of culture enthusiasts. Only one-third base their leisure activities on weather forecasts. Even in bad weather, rail travel is an option for a high proportion of people in this customer segment for both day trips (59%) and short trips involving overnight stays (47%). Regarding the last day trip taken, 93% of respondents indicated that they would have made this trip even if the weather had been different.
- (d)
- Trip planning and information:
The proportion of culture enthusiast respondents who spontaneously (same day) made plans for their last completed day trip was relatively low (8%), with about one-third having planned their last day trip one to four weeks in advance, 12% reporting the shorter time frame of four to six days, and 23% having planned two to three days in advance. Culture enthusiasts reported most often learning about their last day trip destination through friends or acquaintances (63%), followed by online channels such as websites, the Internet in general or timetables on the Internet (16%). Only 3% noted media such as newspapers, magazines and travel brochures being responsible.
5.2. Socially Active People
The socially active segment comprises about 15% of rail customers. People in this segment spend an annual average of around 250 Swiss francs on rail travel for leisure and tourism (457 francs across all trip purposes, representing the highest value of all segments). About 48% of their annual rail kilometres (average per person 4589 km) are for travel for leisure and tourism.
- (a)
- Leisure orientations and travel behaviour:
Socially active people are extremely active during their leisure time, most strongly expressing the leisure orientation of being active in the form of sports and going out. Sports (67%), winter sports (71%), swimming (63%) and activities with friends (91%) are very important to this segment, with activities that promise enjoyment constituting a second important orientation, with going out for dinner (75%), wellness activities (63%), short trips over the weekend (78%) and longer vacation trips (76%) particularly popular. Other activity areas are less predominant but still comparatively significant, with socially active people also enjoying spending time in nature and in the mountains (73%) and enjoying visiting mountains on excursions (75%). Additionally, high culture activities are important or very important (concerts, opera or theatre) to more than half of respondents in this segment (57%). Socially active people regularly and frequently stay in the same place with friends and acquaintances (52%), and they take a relatively large number of overnight trips (an average of 6.2 trips in the 12 months before the survey). In addition to the rail share of trips involving overnight stays being almost 50%, people in this customer segment make around half of their daily leisure trips by rail. Members of this segment travel comparatively often with their families (32%) and feature the comparatively average share of first-class travel of 12%.
- (b)
- Mobility orientations:
Socially active people are experienced travellers and actively engage in travel, including virtual travel. One-third of this segment is inspired by travel reports on the Internet. The second striking orientation is the affinity for e-ticketing. Rail enthusiasm is also relatively high, with this customer segment ranked second of the five segments. Elsewhere, socially active people have an average affinity for price, comfort and travel time.
- (c)
- Attitude towards weather:
Regarding rail use, the socially active people are relatively weather-resistant, ranking second for using railways even in bad weather. In bad weather, rail remains an option for short trips (1–3 days) for more than one-third (35%) and for day trips for around 41% of respondents from this segment. The proportion of respondents who checked the weather in advance of their last day trip was at the comparatively average level (39%).
- (d)
- Travel planning and information:
Compared to other segments, socially active people planned their last day trip further in advance. About one-third of trips were planned one to four weeks, and 22% were planned more than one month in advance. The percentage of trips planned spontaneously (on the same day) was 8%, about average across the five segments. Most people in this segment (almost 80%) became aware of their same-day travel destination through friends or acquaintances. However, online channels were also important for 29%, and newspapers, magazines and travel brochures were the source of information for 18% of day trips.
5.3. Tradition-Conscious People
The tradition-conscious segment comprises around 22% of rail customers. People in this segment spend an annual average of 260 Swiss francs on rail travel for leisure and travel, representing the second-highest value across all segments. Members of this segment have the highest average age (57 years). Although their annual rail kilometres are comparatively low (2905), they travel around 60% of this distance for leisure and tourism purposes. The proportion of tradition-conscious people with a half-fare Travelcard is high (64%).
- (a)
- Leisure orientations and travel behaviour:
Members of this customer segment typically prefer traditional and socially oriented leisure activities, such as attending religious services, churches or cemeteries (41%) and volunteering (43%). Round trips by train are attributed significantly high importance by this segment (41%) compared to other segments. This segment’s preference for relaxation during leisure time (71%) should be emphasised. Active leisure activities (e.g., going out and sports) are of low importance (6%) compared to other segments, as are activities conducted solely on the computer or the Internet (35%). Tradition-conscious people take relatively few trips by train (around 44 trips per year) and travel comparatively few kilometres annually by train (2905). Although the majority of those kilometres (60%) are for leisure and tourism purposes, this might be attributed to the fact that one-third of the people in this segment are 65 or older and thus make few trips to work. Although the number of daily trips made by this segment is the lowest of the five customer segments, the share of daily trips made by rail (50%) is the highest.
- (b)
- Mobility orientations:
Tradition-conscious people rank highest for rail enthusiasm across all customer segments. However, they are also most strongly inclined towards multi-modality, i.e., choosing a mode of transport depending on the situation and suitability. This includes using a car for leisure trips, a finding which matches this segment having the highest car availability across all customer segments (82% always have a car at their disposal; 16% can arrange access to a car). Compared with the other segments, this segment’s affinity for e-ticketing is the weakest. Additionally, this segment articulates below-average expression of travel experiences and anxiety-free use of the train in the evening. The share of first-class rail travel in this segment is above average (14%).
- (c)
- Attitude to the weather:
Most tradition-conscious people base their choices for leisure activities on the weather, with 18% of respondents from this customer segment indicating that they would not have taken their last day trip if the weather had been different. Correspondingly, 45% consulted the weather forecast in advance for their last day trip.
- (d)
- Travel planning and information:
Similar to the other segments, most tradition-conscious people planned their last day trip two to three days in advance (22%) or one to four weeks in advance (32%), with 13% of trips having been made spontaneously (on the same day). Tradition-conscious people also most often became aware of their day trip destination through friends or acquaintances (72%). This was followed by newspapers, magazines and travel brochures (17%), with tourism offices, information centres and travel agencies (4%) and online channels (6%) having insignificant shares.
5.4. Digital People
Digital people, who are not very enthusiastic about rail travel, comprise around 23% of rail customers. People in this segment spend the second-lowest annual average of 200 Swiss francs on rail travel for leisure and tourism. They have the lowest average age (36 years), and 50% of their annual rail kilometres (3027) are for leisure and tourism travel purposes.
- (a)
- Leisure orientations and travel behaviour:
Among all customer segments, leisure activities alone on the computer and on the Internet are the most important to digital people, with 55% considering it important or very important to spend leisure time alone on the computer, 74% valuing private surfing on the Internet and 15% valuing playing computer games. As such, members of this segment spend a considerable part of their free time at home and thus do not qualify as rail customers. This is further emphasised by both activities in nature and in the mountains and cultural activities holding less interest for this segment than all the other segments. However, regarding the importance of activities that promise enjoyment, this customer segment ranks second. For example, 59% consider going out for dinner to be important or very important.
- (b)
- Mobility orientations:
Digital people, who are less enthusiastic about rail, differ from the other customer segments in terms of several mobility orientations. Of the five segments, they demonstrate the lowest level of rail enthusiasm. Additionally, they most often feel unsafe taking the train in the evening. The bicycle offers only a minority (33%) of this segment a sense of leisure-time independence, and only a minority (27%) likes to walk in their leisure time. Accordingly, digital people are also rarely multi-modal, with 85% always having a car available. Regarding affinity for e-ticketing, digital people rank second. Meanwhile, concerning the choice of rail as a mode of transport, people in this segment have an above-average affinity for price and a below-average affinity for comfort. In terms of travel time, digital people are in the average range.
- (c)
- Attitude towards the weather:
For digital people, the weather plays a special role in two ways. First, the weather has the least impact on the type of leisure activities this segment chooses, with only 23% basing their leisure activities on the weather forecast. This is presumably due to the importance of in-house activities during leisure time for this group, with engagement in out-of-home activities being limited. Second, regarding rail use during leisure time, digital people are very sensitive to the weather, with only a small minority considering rail for short trips in bad weather (13%) or day trips in bad weather (21%).
- (d)
- Travel planning and information:
Compared to other segments, people in this customer segment most often plan their day trips spontaneously, with 28% planning their last day trip spontaneously, either on the same day or the day before. Only 13% of day trips were planned more than a month in advance. Among digital people, 30% became aware of their last day trip destination via online channels, with 60% being motivated by friends or acquaintances. Magazines, newspapers and travel brochures played a subordinate role (9%), as did television (6%) and posters (2%).
5.5. Outdoor Enthusiasts
The outdoor enthusiasts segment, who have an affinity for bicycles, comprises around 20% of rail customers. This segment’s customer value—the annual average spent on rail travel for leisure and tourism—is the lowest of all customer segments at slightly less than 140 Swiss francs. With an average age of 47 years, this is the second oldest customer segment. Rail usage, which averages 2284 annual rail kilometres per person, is the lowest among all customer segments, of which 45% is for leisure and tourist travel, a below-average finding. However, in terms of the number of day trips and trips involving overnight stays, this segment is highly mobile. The activities performed by this segment are moderate physical activities and, to a lesser extent, outdoor sporting activities. Possible alternative terms for this segment include ‘weather-sensitive nature-oriented people’ and ‘car-sensitive nature-oriented people’.
- (a)
- Leisure orientations and travel behaviour:
For this customer segment, spending time in nature and in the mountains is of the highest importance, which is reflected, among other things, in the above-average importance of activities such as hiking/mountain walking (77%) and cycling/mountain biking (61%). Meanwhile, traditional activities and social activities are of relatively low importance. Activities in the culture dimension (e.g., concerts and theatre) and enjoyment of life are also of rather low importance. Regarding these two orientations, bike-favouring outdoor enthusiasts differ most strongly from the similarly sports- and exercise-oriented customer segment constituted by socially active people. Outdoor enthusiasts with an affinity for cycling take relatively few rail trips per year (44.1 on average). Although they make many daily trips on average, only a small proportion (19%) are by rail. The last completed day trip for respondents in this customer segment, similar to the socially active segment, was comparatively more often with their families (34%).
- (b)
- Mobility orientations:
The low rail use by persons in this customer segment is accompanied by rather low rail enthusiasm and clearly perceived barriers to travel by rail for leisure and travel, with 68% perceiving rail travel as too expensive and 41% considering it too complicated for their travel purposes. In contrast, most associate a feeling of independence with cycling (82%) and enjoy walking for leisure (72%). Elsewhere, rail travel experiences are relatively limited compared to train journeys made in the past with parents, and few impulses from the social environment encourage more intensive use of the train. Only a small minority (4%) have an expectation articulated by an important reference person to use the train for day trips. Among members of this segment, the proportion of GA Travelcard holders is comparatively low, while driver’s licence ownership is the highest of all customer segments (97%), and a large proportion (82%) always have a passenger car at their disposal. Additionally, 85% report a sense of independence gleaned from using a car during their leisure time. Thus, the possibility of this customer segment using railways more intensively for leisure and travel is curtailed by generally unfavourable overall conditions. People in this segment have an average affinity for price, comfort and time when it comes to using the train.
- (c)
- Attitude to the weather:
This customer segment includes very weather-sensitive people, with the weather playing a role in the way many people in this segment (67%) spend their leisure time. Furthermore, leisure activities are very often (55%) based on the weather forecast, and members of this segment express comparatively limited willingness to use the train for short trips (11%) or for day trips (20%) in the event of bad weather. A high proportion (43%) checked the weather before their last day trip, with weather applications on mobile phones reported to be of relatively high importance (used by 37% of the respondents from this segment).
- (d)
- Travel planning and information:
Over one-third (34%) of outdoor enthusiasts with an affinity for cycling planned their last day trip one to four weeks in advance, compared to 13% four to six days in advance and 18% two to three days. Spontaneous travel decisions on the same day (8%) or the day before (10%) were relatively rare. Outdoor enthusiasts with an affinity for cycling became aware of their trip destination largely through friends or acquaintances (71%), followed by magazines, newspapers and travel brochures (16%). Online channels played a subordinate role (9%).
5.6. Practical Implications
Based on the customer segmentation, this section proposes several strategic directions for future market developments. Given that it is difficult to determine the segment to which a customer belongs, in addition to presenting a concrete offer idea for each segment, further developments appealing to several segments are also presented. Given that outdoor leisure activities are popular with all segments except the digital segment, awareness-raising campaigns for leisure mobility by public transport can be useful, utilising communication based on the particular leisure activity, with which public transport can then be emotionally linked. The railway sector must invoke symbolic words and discourse through its communication to appeal to people who do not currently travel by public transport in their free time.
Notably, while culture enthusiasts, tradition-conscious people and socially active people regularly use public transport in their leisure time, they use it for very different purposes. Many campaigns aimed at concrete actions work with price reductions. Future campaigns should focus on different leisure activities, potentially developing new offers with tourism partners.
In particular, culture enthusiasts often spend their leisure time outside and use public transport to be mobile. This segment can be permanently tied to public transport, with increased consumption encouraged by rewards and additional offers as well as through establishing emotional affiliation. Given the segment’s high customer value, it is of substantial potential for the railway sector, demanding that their preference for public transport be maintained and further supported. This could be achieved by expanding public transport to ensure that cultural activities and active leisure activities (such as sports) are easily and quickly accessible from anywhere.
Meanwhile, socially active people appear very technology-savvy, leading to the recommendation of online marketing via social media and travel blogs. Furthermore, this segment’s affinity for e-ticketing is high, meaning that technological advances and improved public transport offerings can attract people from this segment.
Elsewhere, given that tradition-conscious people have various mobility alternatives at their disposal, they can quickly switch to another means of transport if one approach does not work or is uncomfortable or inconvenient. Given that tradition-conscious people appear open to convenient solutions such as car sharing, carpooling and park-and-rides, the integration of such mobility services into public transport offerings as a Mobility-as-a-Service concept is recommended [30,31].
To reach each of the three segments, it would be beneficial to regionalise market presence to concretely further develop railway offerings. This includes route marketing, regional marketing, linking the train to tourist attractions and establishing personal networks with local cooperation partners. Train interiors as well as exteriors could be redesigned to feature memorable statements (such as ‘a pleasant train’) and pictures of popular sights or regional celebrities. To attract new customers, railway operators could design information brochures about regional leisure excursions in coordination with the municipality, as well as providing information on commuter services. Providers benefit by getting closer to the customer and establishing greater emotional attachments to the train and the region [32].
The remaining two customer segments constitute weak rail customers in terms of leisure and tourism due to their activity orientations, their reported rail use for leisure and travel, and certain socio-economic characteristics. Notably, digital people comparatively most often feel unsafe on the train in the evening. Higher usage by this segment could be achieved by targeted marketing campaigns aiming to improve the segment’s perception of public transport by presenting public transport as a ‘safe’ and ‘independence-enhancing’ alternative on digital communication channels such as social media. Trial use could also reduce rejection of public transport, with one possible strategy being offering free public transport for a certain period (e.g., one week) starting at a certain time each day (e.g., 7 pm).
Meanwhile, considering that GA Travelcard ownership is comparatively low for the outdoor enthusiasts, who walk and cycle regularly, this group could be addressed by special tickets based on combining public transport and cycling. Furthermore, people in this segment are very sensitive to the weather. Their demonstrated limited willingness to use rail for short trips (11%) and day trips (20%) when the weather is bad indicates an opportunity to develop low-priced offers that encourage public transport use when conditions for cycling and walking are bad [33].
To attract digital people and outdoor enthusiasts, we recommend defining and implementing a series of opportunities for acquiring new customers directly through personal conversation with railway employees and indirectly via travel-company partners, competitions and localised special promotions. This would target people who do not have a fundamentally positive attitude towards rail travel but whose position could be changed by positive experiences. For providers, this would have the benefit of it being relatively easy to attract new customers if the sales process were to be more efficient, based on the experience of banks, insurance companies or telecom companies who have relied on direct marketing.
In general, niche offerings based on the modular principle can helpfully retain customers who already use railways during their leisure time as well as attract non-customers. Many existing offerings have the potential to provide additional services tailored to individual segment groups. In this context, the complete offering is constructed by the customer according to the modular principle, meaning that an outdoor activity, a boat trip, an overnight stay in a wellness hotel or a dinner can be booked individually (online). This constructed offering makes possible the provision of, for example, the transport of sports equipment to a mountain for a downhill ride, travel by taxi to restaurants, targeted offers (e.g., extreme sports, engineering, major events) and within-trip experiences (e.g., computer gaming or poker on the road). Thus, providers can benefit by developing niches for different segments, with niches generating higher willingness to pay among consumers. Additionally, providers can earn additional income by coordinating with corresponding service providers.
6. Conclusions
The five identified customer segments differ greatly in terms of their propensity to use rail and their preferred leisure and tourism activities. In terms of attitude, two customer segments (culture enthusiasts and socially active people) demonstrate a strong affinity for using rail for leisure and tourism, resulting in high levels of rail travel for partly differentiated leisure preferences. Meanwhile, the tradition-conscious customer segment is also relatively rail-savvy; however, due to their preferred leisure activities and their specific socio-demographic profile, their rail transport performance is comparatively lower. Finally, digital people and outdoor people are only weak rail customers (in terms of leisure and tourism). This is due to their activity orientations, their evaluation of rail use for leisure and travel, and certain socio-economic characteristics.
It should be noted that a sixth customer segment exists largely in the background, comprising those people who, at the time of the survey, were characterised as non-rail users because they had not made any rail journeys within the previous 12 months. This group comprises 27.3% of Swiss residents between the ages of 16 and 85 and has not been discussed because members of the group were not interviewed in detail as part of this study. However, non-users can constitute potential users, and they can be attracted by service improvement [34]. Thus, future research should focus on non-users and analyse how they can be addressed with suitable offers.
Another limitation is that rail providers cannot determine with precision the segment to which a customer belongs. However, social media will likely soon provide sufficient information to address members of segments with tailored offers and mobile-based communication [35,36]. This study was conducted in the context of railways in Switzerland. Switzerland is known for its good public transport network and the relatively high willingness of its inhabitants to use the train in their leisure time. To transfer this study’s results to other countries, further research is needed.
Further research could also investigate which external measures might contribute to the increased use of railways for leisure purposes. Special attention should be paid to the extent to which measures to reduce the attractiveness of private cars, such as increasing parking fees or reducing parking spaces, could support and promote the measures and offers of rail operators. Moreover, the ongoing COVID-19 pandemic is completely challenging the mobility of leisure travellers. Existing mobility styles have been influenced and constrained by the COVID-19 pandemic [37]. Future studies should therefore investigate the mobility behaviour of leisure travellers after the pandemic and determine whether it has changed permanently.
Author Contributions
Conceptualization, W.v.A.; writing—original draft preparation, L.D.; writing—review and editing, W.v.A. and L.D. Both All authors have read and agreed to the published version of the manuscript.
Funding
This research was supported by Innosuisse.
Data Availability Statement
The data used can be requested from the authors.
Acknowledgments
We are deeply indebted to our late colleague Helmut Schad (deceased 2017). He contributed significantly to the conception and elaboration of the research findings in this paper. This paper and the research behind it would not have been possible without his exceptional support.
Conflicts of Interest
The authors declare no conflict of interest.
Appendix A
Table A1.
Overview of the Survey.
Table A1.
Overview of the Survey.
| Segment-constituting questions (Topics A–B) | |
| Topic A Leisure orientations |
|
| Topic B Attitudes towards using railroads in leisure and tourism |
|
| Segment-descriptive questions (Topics C–G) | |
| Topic C Trip with overnight stay |
|
| Topic D Day trips |
|
| Topic E Everyday mobility |
|
| Topic F ‘Mobility tools’ (cars/public transport subscription) |
|
| Topic G Socio-economic and demographic characteristics, housing situation |
|
Appendix B
Table A2.
Rotated Component Matrix for Leisure Orientations.
Table A2.
Rotated Component Matrix for Leisure Orientations.
| Rotated Component Matrix for Leisure Orientations | Factors | |||||||
|---|---|---|---|---|---|---|---|---|
| How important are the following leisure activities for you? | com. | 1 | 2 | 3 | 4 | 5 | 6 | 7 |
| Other sports (without winter sports) | 0.522 | 0.699 | 0.104 | −0.012 | −0.028 | 0.131 | 0.036 | 0.058 |
| Winter sports | 0.595 | 0.567 | 0.311 | 0.137 | −0.066 | −0.010 | −0.354 | −0.169 |
| Attending sports events | 0.453 | 0.511 | −0.033 | 0.140 | −0.132 | 0.281 | −0.026 | 0.272 |
| Partying, going out in clubs, bars | 0.597 | 0.500 | −0.322 | 0.331 | −0.025 | 0.365 | 0.008 | −0.001 |
| Swimming | 0.367 | 0.492 | 0.188 | 0.127 | 0.093 | −0.141 | 0.140 | 0.158 |
| Going out with friends | 0.409 | 0.488 | −0.107 | 0.205 | 0.215 | 0.028 | 0.262 | 0.047 |
| Hiking, mountain walking | 0.639 | 0.099 | 0.745 | −0.018 | 0.163 | −0.129 | −0.177 | 0.009 |
| Visit excursion mountains | 0.646 | 0.012 | 0.720 | 0.285 | 0.101 | 0.048 | −0.128 | 0.129 |
| Being out in nature | 0.547 | 0.064 | 0.623 | −0.037 | 0.186 | −0.288 | 0.158 | 0.106 |
| Cycling, mountain biking | 0.467 | 0.418 | 0.514 | −0.069 | −0.016 | 0.027 | −0.079 | −0.126 |
| Doing home improvement or gardening | 0.303 | −0.023 | 0.495 | −0.003 | −0.073 | −0.025 | 0.124 | 0.190 |
| Going out for dinner | 0.494 | 0.006 | 0.057 | 0.653 | 0.157 | 0.079 | 0.176 | −0.046 |
| Short trips over the weekend | 0.567 | 0.230 | 0.079 | 0.650 | 0.234 | 0.043 | −0.170 | −0.004 |
| Driving around by car/motorcycle | 0.593 | −0.094 | 0.070 | 0.515 | −0.393 | 0.313 | 0.138 | 0.205 |
| Going on longer vacation trips | 0.484 | 0.352 | −0.092 | 0.462 | 0.266 | −0.178 | 0.026 | −0.188 |
| Sauna, leisure pool, wellness | 0.443 | 0.392 | 0.131 | 0.457 | 0.060 | −0.108 | 0.217 | 0.041 |
| Museums or art exhibitions | 0.687 | −0.095 | 0.163 | 0.110 | 0.790 | −0.040 | 0.013 | 0.115 |
| Concerts (classical, jazz, pop), opera, theatre | 0.604 | 0.105 | 0.069 | 0.201 | 0.730 | 0.038 | 0.035 | 0.111 |
| Computer games and game consoles | 0.549 | 0.084 | −0.153 | 0.017 | −0.052 | 0.710 | 0.106 | −0.007 |
| Using the Internet privately | 0.459 | 0.272 | 0.023 | 0.196 | 0.064 | 0.486 | 0.081 | −0.315 |
| Doing something with family, partner, children | 0.400 | 0.270 | 0.282 | 0.248 | −0.072 | −0.384 | 0.181 | −0.026 |
| Relaxing or doing nothing | 0.490 | 0.028 | 0.034 | 0.125 | 0.023 | −0.044 | 0.686 | 0.003 |
| Watching television, DVDs or videos | 0.625 | 0.048 | −0.006 | −0.032 | 0.005 | 0.437 | 0.656 | 0.010 |
| Going shopping, going to the store | 0.464 | 0.241 | −0.207 | 0.419 | −0.067 | −0.008 | 0.425 | 0.037 |
| Visiting churches, church services, cemeteries | 0.597 | 0.013 | 0.147 | −0.088 | 0.015 | −0.087 | 0.138 | 0.735 |
| Volunteering (with associations etc.) | 0.513 | 0.350 | 0.009 | −0.056 | 0.115 | −0.028 | −0.074 | 0.606 |
| Taking day trips by train | 0.426 | −0.025 | 0.208 | 0.287 | 0.232 | 0.047 | −0.052 | 0.491 |
| Extraction method: Principal component analysis | ||||||||
| Rotation method: Varimax with Kaiser normalisation | ||||||||
| Variance explanation: 51.6%; com. = communalities | ||||||||
Table A3.
Rotated Component Matrix for Mobility Orientations.
Table A3.
Rotated Component Matrix for Mobility Orientations.
| Rotated Component Matrix for Mobility Orientations | Factors | ||||||||
|---|---|---|---|---|---|---|---|---|---|
| To what extent do the following statements apply to you? | com. | 1 | 2 | 3 | 4 | 5 | 6 | 7 | 8 |
| Travelling by train is an experience for me in my free time and is part of the excursion. | 0.597 | 0.741 | 0.166 | −0.061 | 0.008 | 0.055 | −0.029 | 0.055 | 0.096 |
| It excites me to travel by train to regions where I have not been before. | 0.555 | 0.698 | 0.217 | 0.035 | −0.026 | −0.004 | 0.092 | 0.066 | 0.077 |
| I talk to friends and colleagues about my train trips in my free time. | 0.546 | 0.695 | 0.123 | −0.015 | 0.012 | 0.064 | 0.160 | −0.003 | −0.135 |
| When I travel by train in my free time, I have time for myself. | 0.582 | 0.685 | 0.070 | 0.107 | −0.092 | 0.101 | −0.228 | 0.039 | 0.157 |
| By train, I can go to places where I can experience something. | 0.531 | 0.654 | 0.070 | 0.035 | −0.132 | −0.103 | 0.149 | 0.170 | 0.134 |
| I can easily reach my favourite destinations on day trips by train. | 0.564 | 0.622 | 0.197 | 0.057 | −0.294 | −0.208 | 0.056 | 0.032 | −0.005 |
| When I travel by train, I can relax. | 0.636 | 0.621 | 0.032 | 0.049 | −0.081 | 0.171 | −0.392 | 0.093 | 0.223 |
| I can easily reach my preferred vacation destinations by train. | 0.489 | 0.583 | 0.163 | 0.074 | −0.234 | −0.099 | 0.058 | 0.005 | −0.223 |
| For environmental reasons, it is important to me to make my leisure journeys by train. | 0.561 | 0.520 | 0.411 | 0.063 | −0.076 | −0.042 | −0.121 | 0.247 | −0.185 |
| In cases of bad weather, the train is an option for me as a means of transport for short trips featuring stays of one to three nights. | 0.725 | 0.252 | 0.793 | −0.028 | −0.145 | 0.039 | −0.006 | 0.084 | 0.046 |
| In cases of bad weather, the train is an option for me as a means of transport for day trips. | 0.726 | 0.327 | 0.765 | 0.051 | −0.142 | −0.005 | −0.063 | 0.048 | 0.071 |
| People who are important to me expect me to use rail for my day trips. | 0.454 | 0.306 | 0.434 | 0.053 | 0.082 | 0.133 | 0.184 | −0.010 | −0.334 |
| The weather plays a role in my leisure activities. | 0.778 | 0.046 | −0.022 | 0.877 | 0.021 | 0.003 | 0.021 | 0.025 | 0.063 |
| My leisure activities are based on weather forecasts. | 0.760 | 0.082 | 0.050 | 0.857 | 0.062 | −0.016 | 0.077 | 0.072 | 0.029 |
| Day trips by train are expensive for me. | 0.469 | −0.074 | −0.131 | −0.006 | 0.640 | −0.089 | 0.096 | 0.141 | 0.012 |
| It is complicated for me to organise trips by train in my free time. | 0.486 | −0.250 | −0.062 | 0.096 | 0.600 | 0.137 | −0.007 | −0.172 | −0.047 |
| I print out my tickets at home. | 0.638 | 0.064 | −0.056 | 0.022 | 0.006 | 0.792 | 0.014 | 0.058 | 0.001 |
| I download my tickets to my mobile phone. | 0.600 | −0.080 | 0.121 | −0.037 | 0.012 | 0.751 | 0.100 | −0.046 | −0.034 |
| I get inspiration from travel reports on the Internet. | 0.578 | 0.180 | −0.164 | 0.060 | −0.109 | 0.222 | 0.660 | 0.118 | 0.069 |
| When I travel by train in my free time, I am confronted with unpleasant people. | 0.521 | −0.097 | 0.099 | 0.110 | 0.264 | −0.016 | 0.632 | −0.120 | −0.078 |
| My parents used to travel with me by train quite often. | 0.469 | 0.117 | 0.331 | −0.142 | −0.178 | 0.002 | 0.389 | 0.016 | 0.377 |
| When I ride a bicycle in my free time, I feel independent. | 0.585 | 0.072 | 0.035 | 0.159 | 0.123 | 0.017 | 0.107 | 0.723 | 0.067 |
| In the evening I feel safe from harassment on the train. | 0.565 | 0.102 | 0.120 | −0.065 | −0.388 | 0.020 | −0.129 | 0.606 | −0.023 |
| I walk with enthusiasm in my free time. | 0.530 | 0.379 | 0.063 | −0.065 | 0.386 | −0.034 | −0.197 | 0.429 | 0.076 |
| I am not committed to a particular means of transport—depending on the occasion, I choose what suits me. | 0.573 | 0.256 | 0.074 | 0.098 | −0.030 | −0.038 | −0.019 | 0.121 | 0.689 |
| With a car, I feel independent in my free time. | 0.561 | −0.252 | −0.175 | 0.122 | 0.416 | 0.033 | 0.025 | −0.124 | 0.512 |
| Extraction method: Principal component analysis | |||||||||
| Rotation method: Varimax with Kaiser normalisation | |||||||||
| Variance explanation: 58.0%, com. = communalities | |||||||||
References
- Daniels, R.; Mulley, C. The paradox of public transport peak spreading: Universities and travel demand management. Int. J. Sustain. Transp. 2013, 7, 143–165. [Google Scholar] [CrossRef]
- De Oña, R.; De Oña, J. Analysis of transit quality of service through segmentation and classification tree techniques. Transp. A Transp. Sci. 2015, 11, 365–387. [Google Scholar] [CrossRef]
- Li, H.; Raeside, R.; Chen, T.; McQuaid, R.W. Population ageing, gender and the transportation system. Res. Transp. Econ. 2012, 34, 39–47. [Google Scholar] [CrossRef]
- Kieu, L.M.; Bhaskar, A.; Chung, E. Passenger segmentation using smart card data. IEEE Trans. Intell. Transp. Syst. 2015, 16, 1537–1548. [Google Scholar] [CrossRef]
- Kieu Le Minh Ou, Y.; Cai, C. Large-scale transit market segmentation with spatial-behavioural features. Transp. Res. Part C Emerg. Technol. 2018, 90, 97–113. [Google Scholar] [CrossRef]
- Lin, H.Z.; Lo, H.P.; Chen, X.J. Lifestyle classifications with and without activity-travel patterns. Transp. Res. Part A Policy Pract. 2009, 43, 626–638. [Google Scholar] [CrossRef]
- Götz, K. Freizeit-Mobilität im Alltag oder Disponible Zeit, Auszeit, Eigenzeit—Warum wir in der Freizeit raus Müssen; Duncker & Humblot: Berlin, Germany, 2007. [Google Scholar]
- Lanzendorf, M. Mobility styles and travel behavior: Application of a lifestyle approach to leisure travel. Transp. Res. Rec. 2002, 1807, 163–173. [Google Scholar] [CrossRef]
- Fürst, E. Making the way to the university environmentally sustainable: A segmentation approach. Transp. Res. Part D Transp. Environ. 2014, 31, 1–12. [Google Scholar] [CrossRef]
- Ma, Z.; Koutsopoulos, H.N.; Liu, T.; Basu, A.A. Behavioral response to promotion-based public transport demand management: Longitudinal analysis and implications for optimal promotion design. Transp. Res. Part A Policy Pract. 2020, 141, 356–372. [Google Scholar] [CrossRef]
- De Oña, J.; López, G.; Mujalli, R.; Calvo, F.J. Analysis of traffic accidents on rural highways using Latent Class Clustering and Bayesian Networks. Accid. Anal. Prev. 2013, 51, 1–10. [Google Scholar] [CrossRef] [PubMed]
- Depaire, B.; Wets, G.; Vanhoof, K. Traffic accident segmentation by means of latent class clustering. Accid. Anal. Prev. 2008, 40, 1257–1266. [Google Scholar] [CrossRef]
- de Oña, J.; de Oña, R.; López, G. Transit service quality analysis using cluster analysis and decision trees: A step forward to personalized marketing in public transportation. Transportation 2016, 43, 725–747. [Google Scholar] [CrossRef]
- Haustein, S.; Hunecke, M. Identifying target groups for environmentally sustainable transport: Assessment of different segmentation approaches. Curr. Opin. Environ. Sustain. 2013, 5, 197–204. [Google Scholar] [CrossRef]
- Bamberg, S.; Fujii, S.; Friman, M.; Gärling, T. Behaviour theory and soft transport policy measures. Transp. Policy 2011, 18, 228–235. [Google Scholar] [CrossRef]
- Schrover, M.; Van der Leun, J.; Quispel, C. Niches, labour market segregation, ethnicity and gender. J. Ethnic Migr. Stud. 2007, 33, 529–540. [Google Scholar] [CrossRef]
- Lässer, C.; Bieger, T. Travel Market Switzerland 2007. Basic Report and Database Specification. St. Gallen. 2008. Available online: https://www.unisg.ch/-/media/dateien/unisg/hsgservices/hsgmediacorner/aktuell/2008/august2008/report-travel-market-switzerland-2007-21august2008.pdf?la=de&hash=AE9B844BB30CDEAE811F79E3F62FB1D8107705BB (accessed on 13 March 2021).
- Ohnmacht, T.; Götz, K.; Schad, H. Leisure mobility styles in Swiss conurbations: Construction and empirical analysis. Transportation 2009, 36, 243–265. [Google Scholar] [CrossRef]
- Steinberg, G.; Hoenninger, P.; Klemme, M. Ergebnisse der Besucherbefragung im Landkreis Wernigerode unter Berücksichtigung einer Freizeitmobilitätsstilbasierten Typologie. Bericht für das Projekt MobiHarz; Planersocietät: Dortmund, Germany, 2003. [Google Scholar]
- Ajzen, I. The Theory of Planned Behavior. Organ. Behav. Hum. Decis. Process. 1991, 50, 179–211. [Google Scholar] [CrossRef]
- Hunecke, M.; Böhler, S.; Grischkat, S.; Haustein, S. MOBILANZ—Möglichkeiten zur Reduzierung des Energieverbrauches und der Stoffströme Unterschiedlicher Mobilitätsstile durch Zielgruppenspezifische Mobilitätsdienstleistungen. 2008. Available online: https://www.ruhr-uni-bochum.de/ecopsy/projekte/bmbffkz07ngs07.pdf (accessed on 24 April 2021).
- Preisendörfer, P. Umwelteinstellungen und Umweltverhalten in Deutschland; Springer: Wiesbaden, Germany, 1999. [Google Scholar]
- Becker, G.S. The Economic Approach to Human Behaviour; University of Chicago Press: Chicago, IL, USA, 1976. [Google Scholar]
- Lanzendorf, M. The Same Procedure as Last Weekend: Routines and Leisure Mobility. In Transport Developments and Innovations in an Evolving World; Beuthe, L., Himanen, M., Reggiani, V., Zamparini, A., Eds.; Springer Science & Business Media: Berlin/Heidelberg, Germany, 2004. [Google Scholar]
- Scheiner, J. Wohnen und Aktionsraum: Welche Rolle spielen Lebensstil, Lebenslage und Raumstruktur? Geogr. Z. 2006, 94, 43–62. [Google Scholar]
- Bieland, D.; Sommer, C.; Witte, C. Uncommon leisure traffic–Analyses of travel behaviour of visitors. Transp. Res. Procedia 2017, 25, 3971–3984. [Google Scholar]
- Kaiser, H.F. An index of factorial simplicity. Psychometrika 1974, 39, 31–36. [Google Scholar] [CrossRef]
- Backhaus, K.; Erichson, B.; Plinke, W.; Weiber, R. Multivariate Analysemethoden: Eine Anwendungsorientierte Einführung; Springer: Berlin, Germany, 2000. [Google Scholar]
- Wiedenbeck, M.; Züll, C. Klassifikationen mit Clusteranalyse: Grundlegende Techniken Hierarchischer und K-Means-Verfahren. Zuma How--Reihe 2001, 10, 1–18. Available online: https://www.gesis.org/fileadmin/upload/forschung/publikationen/gesis_reihen/howto/how-to10mwcz.pdf (accessed on 26 February 2021).
- Becker, H.; Balac, M.; Ciari, F.; Axhausen, K.W. Assessing the welfare impacts of Shared Mobility and Mobility as a Service (MaaS). Transp. Res. Part A Policy Pract. 2020, 131, 228–243. [Google Scholar] [CrossRef]
- Esztergár-Kiss, D.; Kerényi, T. Creation of mobility packages based on the MaaS concept. Travel Behav. Soc. 2020, 21, 307–317. [Google Scholar] [CrossRef]
- Vicente, P.; Sampaio, A.; Reis, E. Factors influencing passenger loyalty towards public transport services: Does public transport providers’ commitment to environmental sustainability matter? Case Stud. Transp. Policy 2020, 8, 627–638. [Google Scholar] [CrossRef]
- Liu, Y.; Wang, S.; Xie, B. Evaluating the effects of public transport fare policy change together with built and non-built environment features on ridership: The case in South East Queensland, Australia. Transport Policy 2019, 76, 78–89. [Google Scholar] [CrossRef]
- Amrapala, C.; Choocharukul, K. Perceived Service Quality and Commuter Segmentation of Informal Public Transport Service in Bangkok, Thailand. Eng. J. 2019, 23, 1–18. [Google Scholar] [CrossRef]
- Chin, K.S.; Yang, Q.; Chan CY, P.; Tsui, K.L.; Li, Y.L. Identifying passengers’ needs in cabin interiors of high-speed rails in China using quality function deployment for improving passenger satisfaction. Transp. Res. Part A Policy Pract. 2019, 119, 326–342. [Google Scholar] [CrossRef]
- Jevinger, Å.; Persson, J.A. Exploring the potential of using real-time traveler data in public transport disturbance management. Public Transp. 2019, 11, 413–441. [Google Scholar] [CrossRef]
- Magdolen, M.; von Behren, S.; Burger, L.; Chlond, B. Mobility styles and car ownership—Potentials for a sustainable urban transport. Sustainability 2021, 13, 2968. [Google Scholar] [CrossRef]
Publisher’s Note: MDPI stays neutral with regard to jurisdictional claims in published maps and institutional affiliations. |
© 2021 by the authors. Licensee MDPI, Basel, Switzerland. This article is an open access article distributed under the terms and conditions of the Creative Commons Attribution (CC BY) license (https://creativecommons.org/licenses/by/4.0/).