Structure Characteristics and Influencing Factors of Cross-Border Electricity Trade: A Complex Network Perspective
Abstract
1. Introduction
2. Materials and Methods
2.1. Cross-Border Electricity Trade Network Construction
2.2. Network Feature Measurements
2.2.1. Overall Structural Features
- (1)
- Average clustering coefficient
- (2)
- Reciprocity coefficient
2.2.2. Individual Structural Features
- (1)
- Degree centrality
- (2)
- Betweenness centrality
2.2.3. Microstructure Features
2.3. ERGM Conceptualization
3. The Characteristic Fact Analysis
3.1. Electricity Market
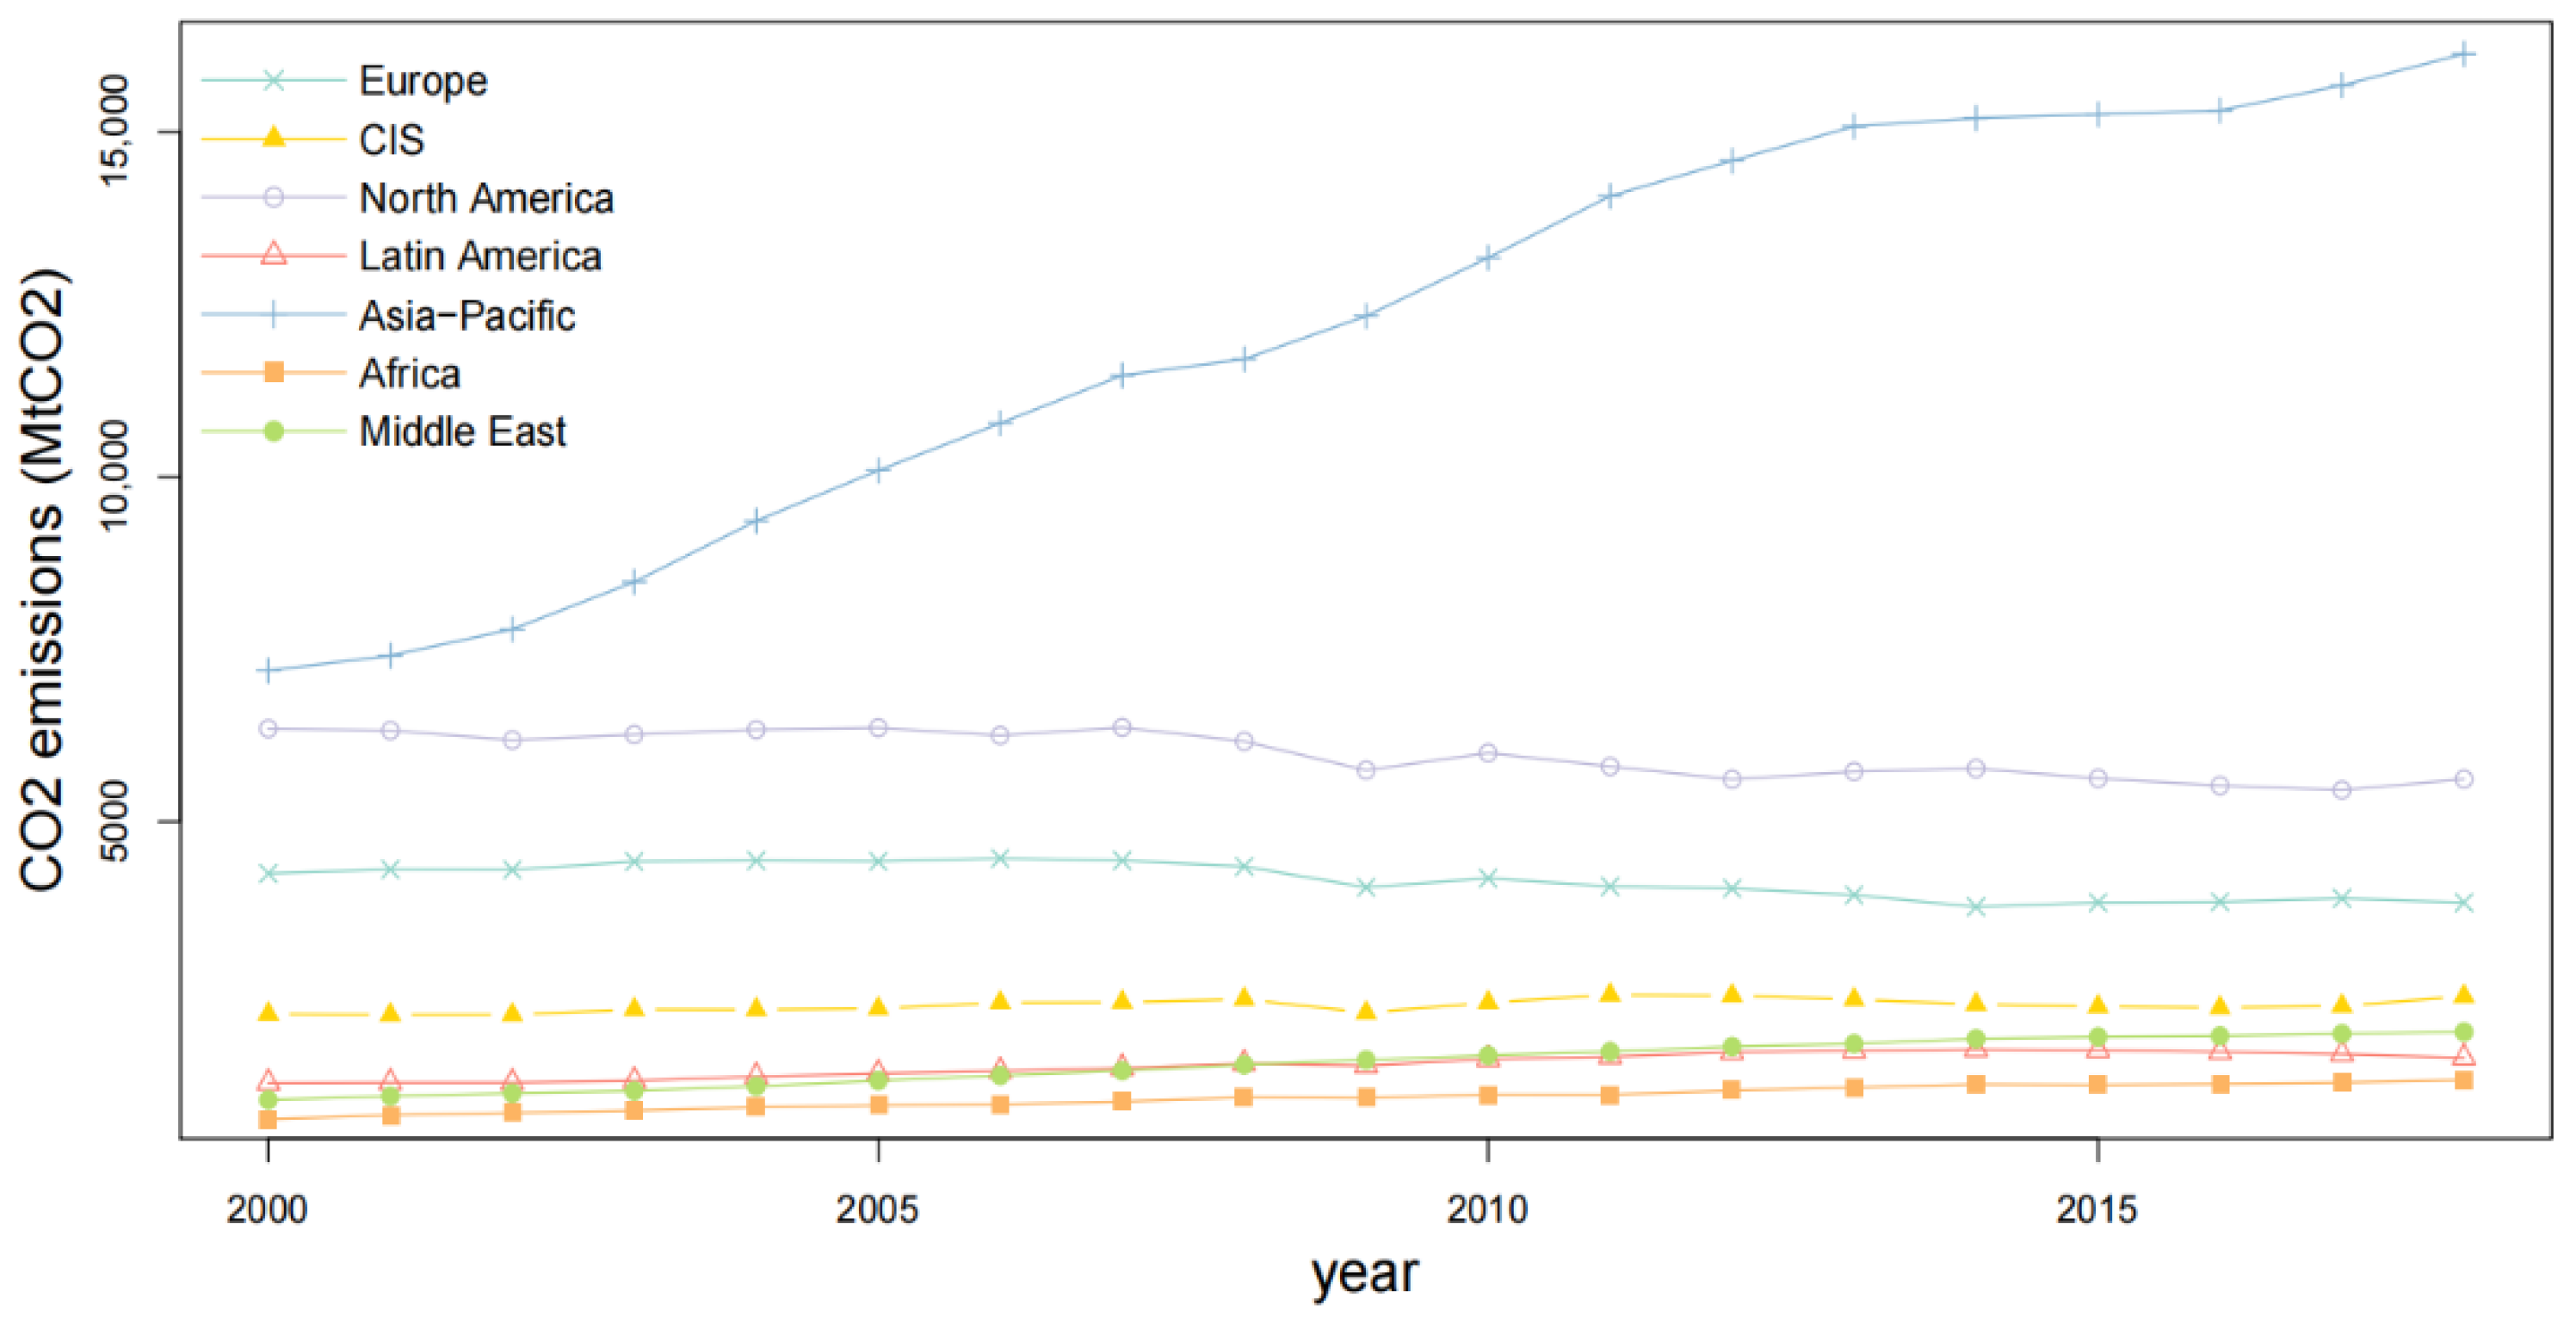
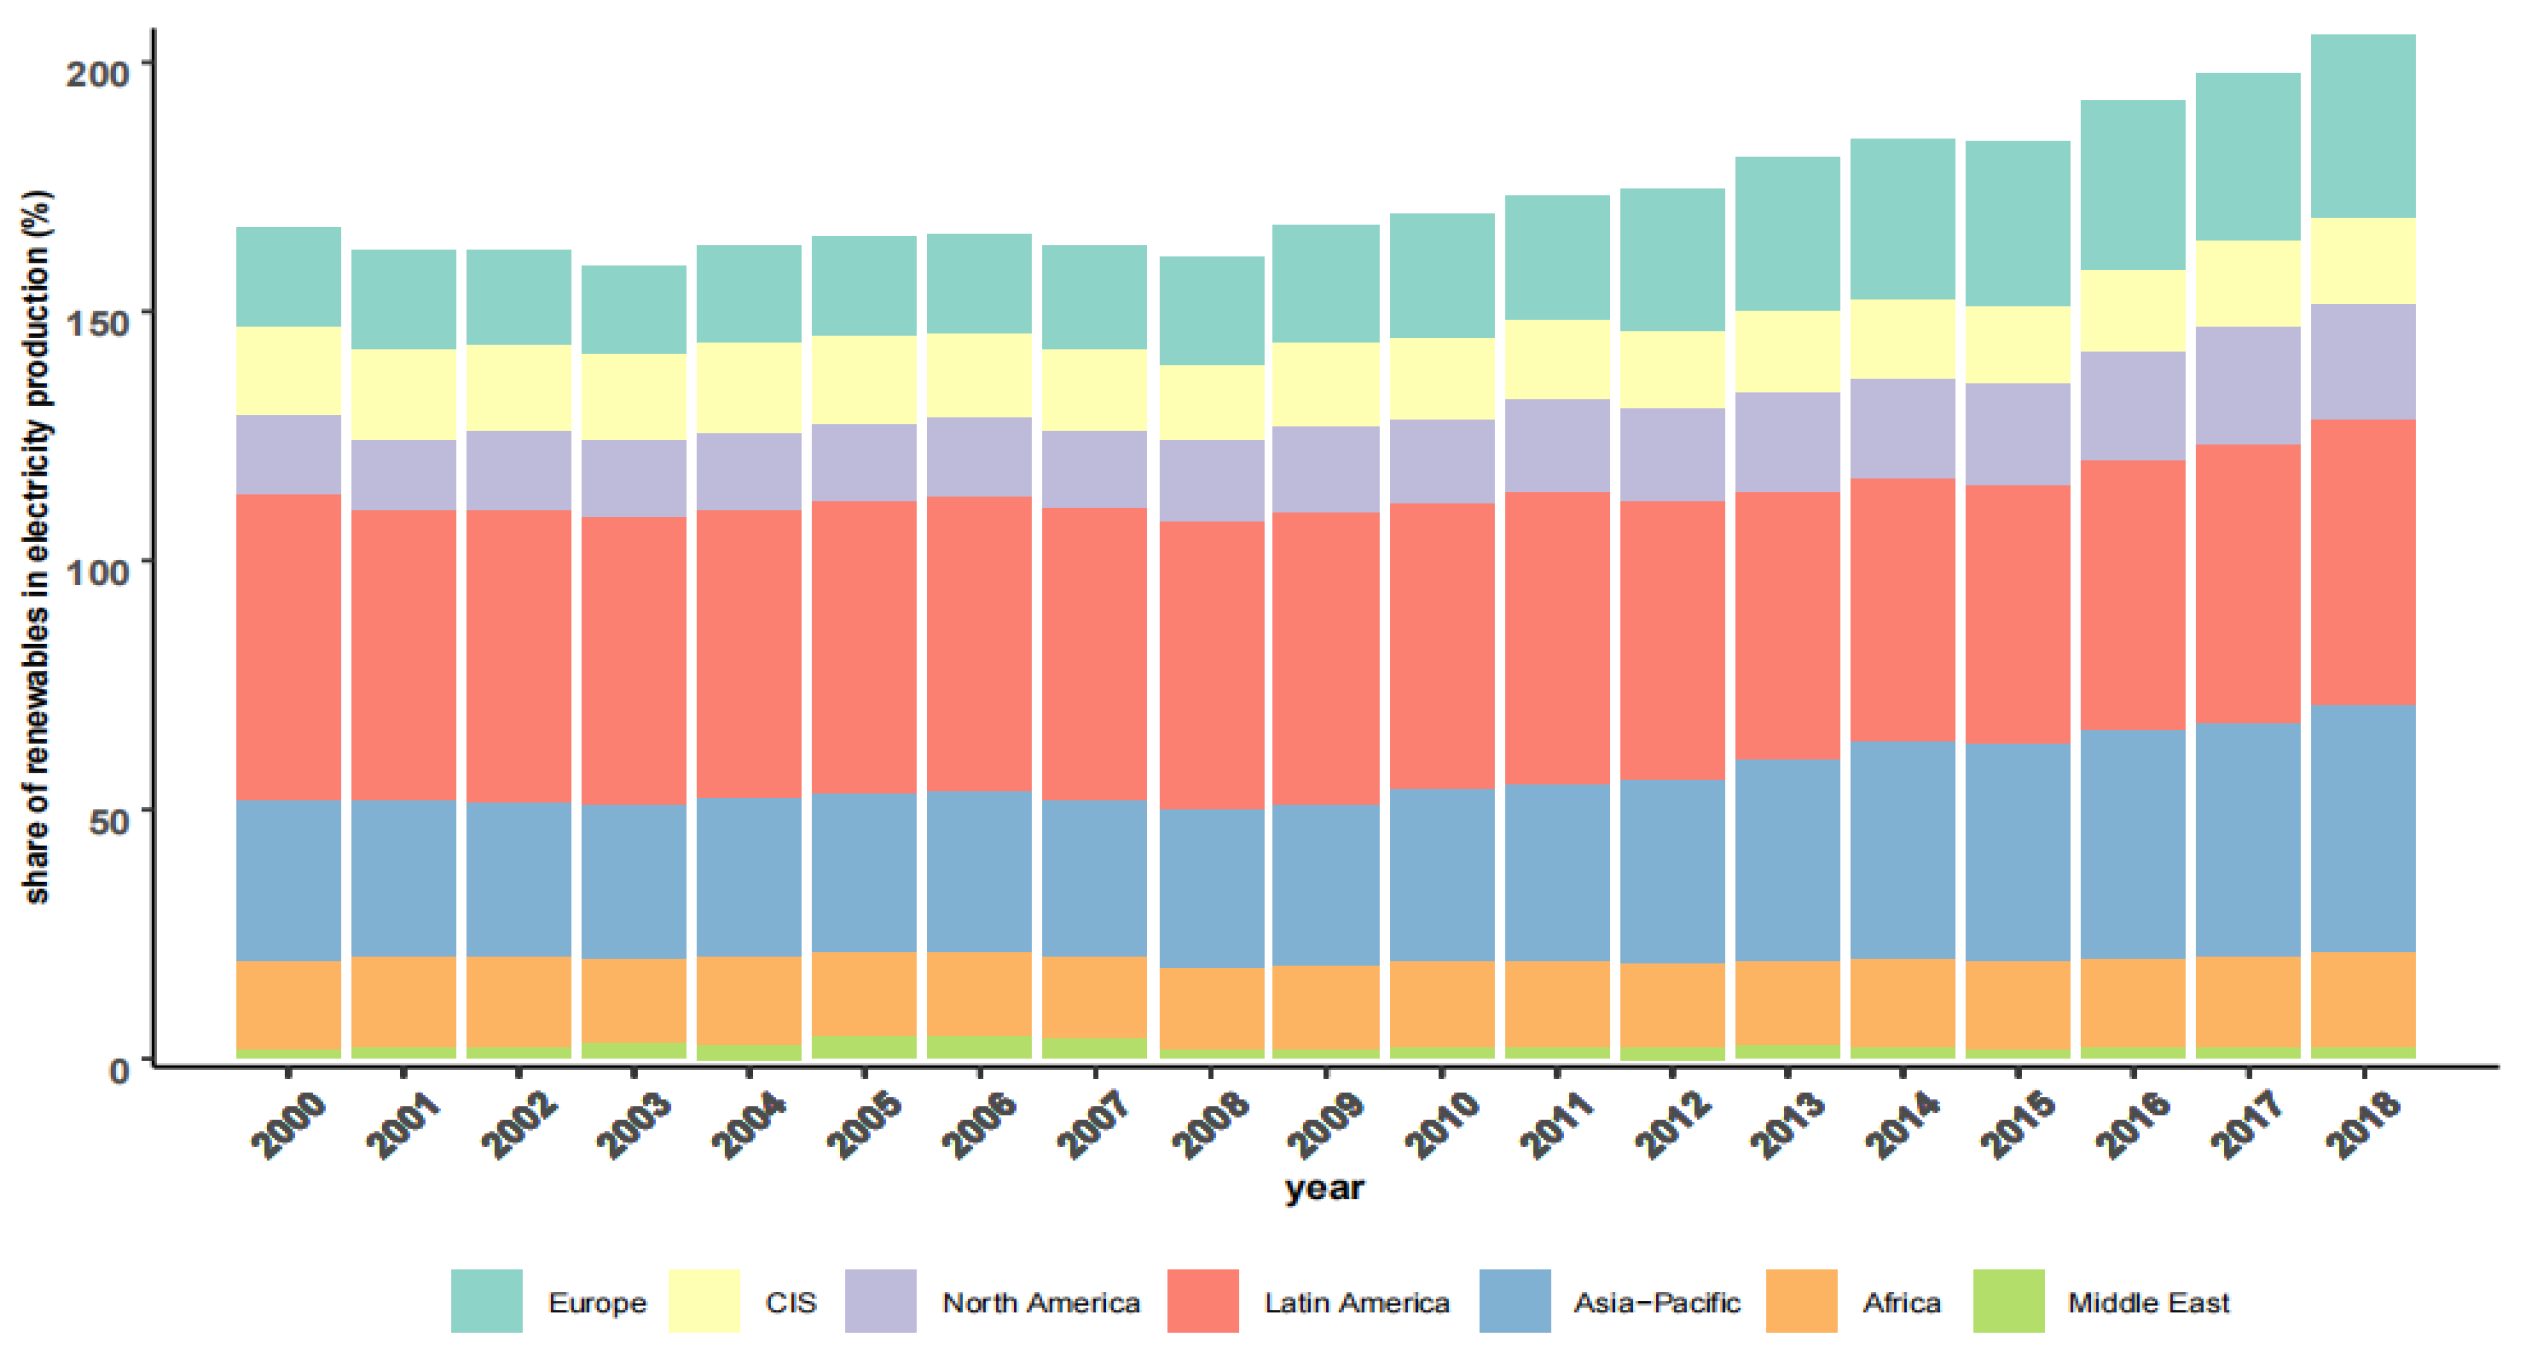
3.2. Electricity Production and Electricity Consumption, CO2 and Renewable Energy
4. Structural Characteristics of Cross-Border Electricity Trade Network
4.1. Overall Network Structure
4.2. Analysis of Individual Network Structure
4.3. Analysis of Network Motif
5. Analysis of Influencing Factors of Cross-Border Electricity Trade Network
5.1. Variables
5.1.1. Pure Structural Effect
5.1.2. Actor Attribute Effect
5.1.3. Network Embedding Effect
5.2. ERGM Results
6. Conclusions
Author Contributions
Funding
Institutional Review Board Statement
Informed Consent Statement
Data Availability Statement
Conflicts of Interest
Appendix A. Data Source and Data Description
| Variable | Definition | Source |
|---|---|---|
| Pure structural effect | ||
| Edges | The influence of network density on the formation of network relations, which is similar to a constant | ERGM https://cran.r-project.org/web/packages/ergm/index.html (accessed on 17 February 2021) |
| Mutual | Reciprocity | ERGM https://cran.r-project.org/web/packages/ergm/index.html (accessed on 17 February 2021) |
| Actor attribute effect | ||
| pco2 | Carbon dioxide emissions per capita (It is divided into three levels according to theemissions) | World Development Indicators Database (WDI) https://databank.worldbank.org/source/world-development-indicators (accessed on 17 February 2021) |
| GDP | Gross domestic product (current prices, millions of US dollars) | UNdata database https://data.un.org/ (accessed on 17 February 2021) |
| industry | Proportion of secondary industry in GDP | World Development Indicators Database (WDI) https://databank.worldbank.org/source/world-development-indicators (accessed on 17 February 2021) |
| renewable | Proportion of renewable energy in electricity production | International Renewable Energy Agency (IRENA) https://www.irena.org/ (accessed on 17 February 2021) |
| capacity | Electricity installed capacity (MW) | International Renewable Energy Agency (IRENA) https://www.irena.org/ (accessed on 17 February 2021) |
| consumption | Electricity domestic consumption (TWh) | UNdata database https://data.un.org/ (accessed on 17 February 2021) |
| generation | Electricity production (TWh) | UNdata database https://data.un.org/ (accessed on 17 February 2021) |
| loss | Electricity losses (kilowatt-hours, million) | UNdata database https://data.un.org/ (accessed on 17 February 2021) |
| price | Electricity price (price of electricity, US cents per kWh) | Doing Business https://databank.worldbank.org/source/doing-business (accessed on 17 February 2021) |
| Network embedding effect | ||
| WGI | Matrix of institutional distance | World Development Indicators Database (WDI) https://databank.worldbank.org/source/world-development-indicators (accessed on 17 February 2021) |
| language | Matrix of common language (official language) | CEPII Database http://www.cepii.fr/cepii/en/bdd_modele/bdd.asp (accessed on 17 February 2021) |
| distance | Matrix of geographical distance | CEPII Database http://www.cepii.fr/cepii/en/bdd_modele/bdd.asp (accessed on 17 February 2021) |
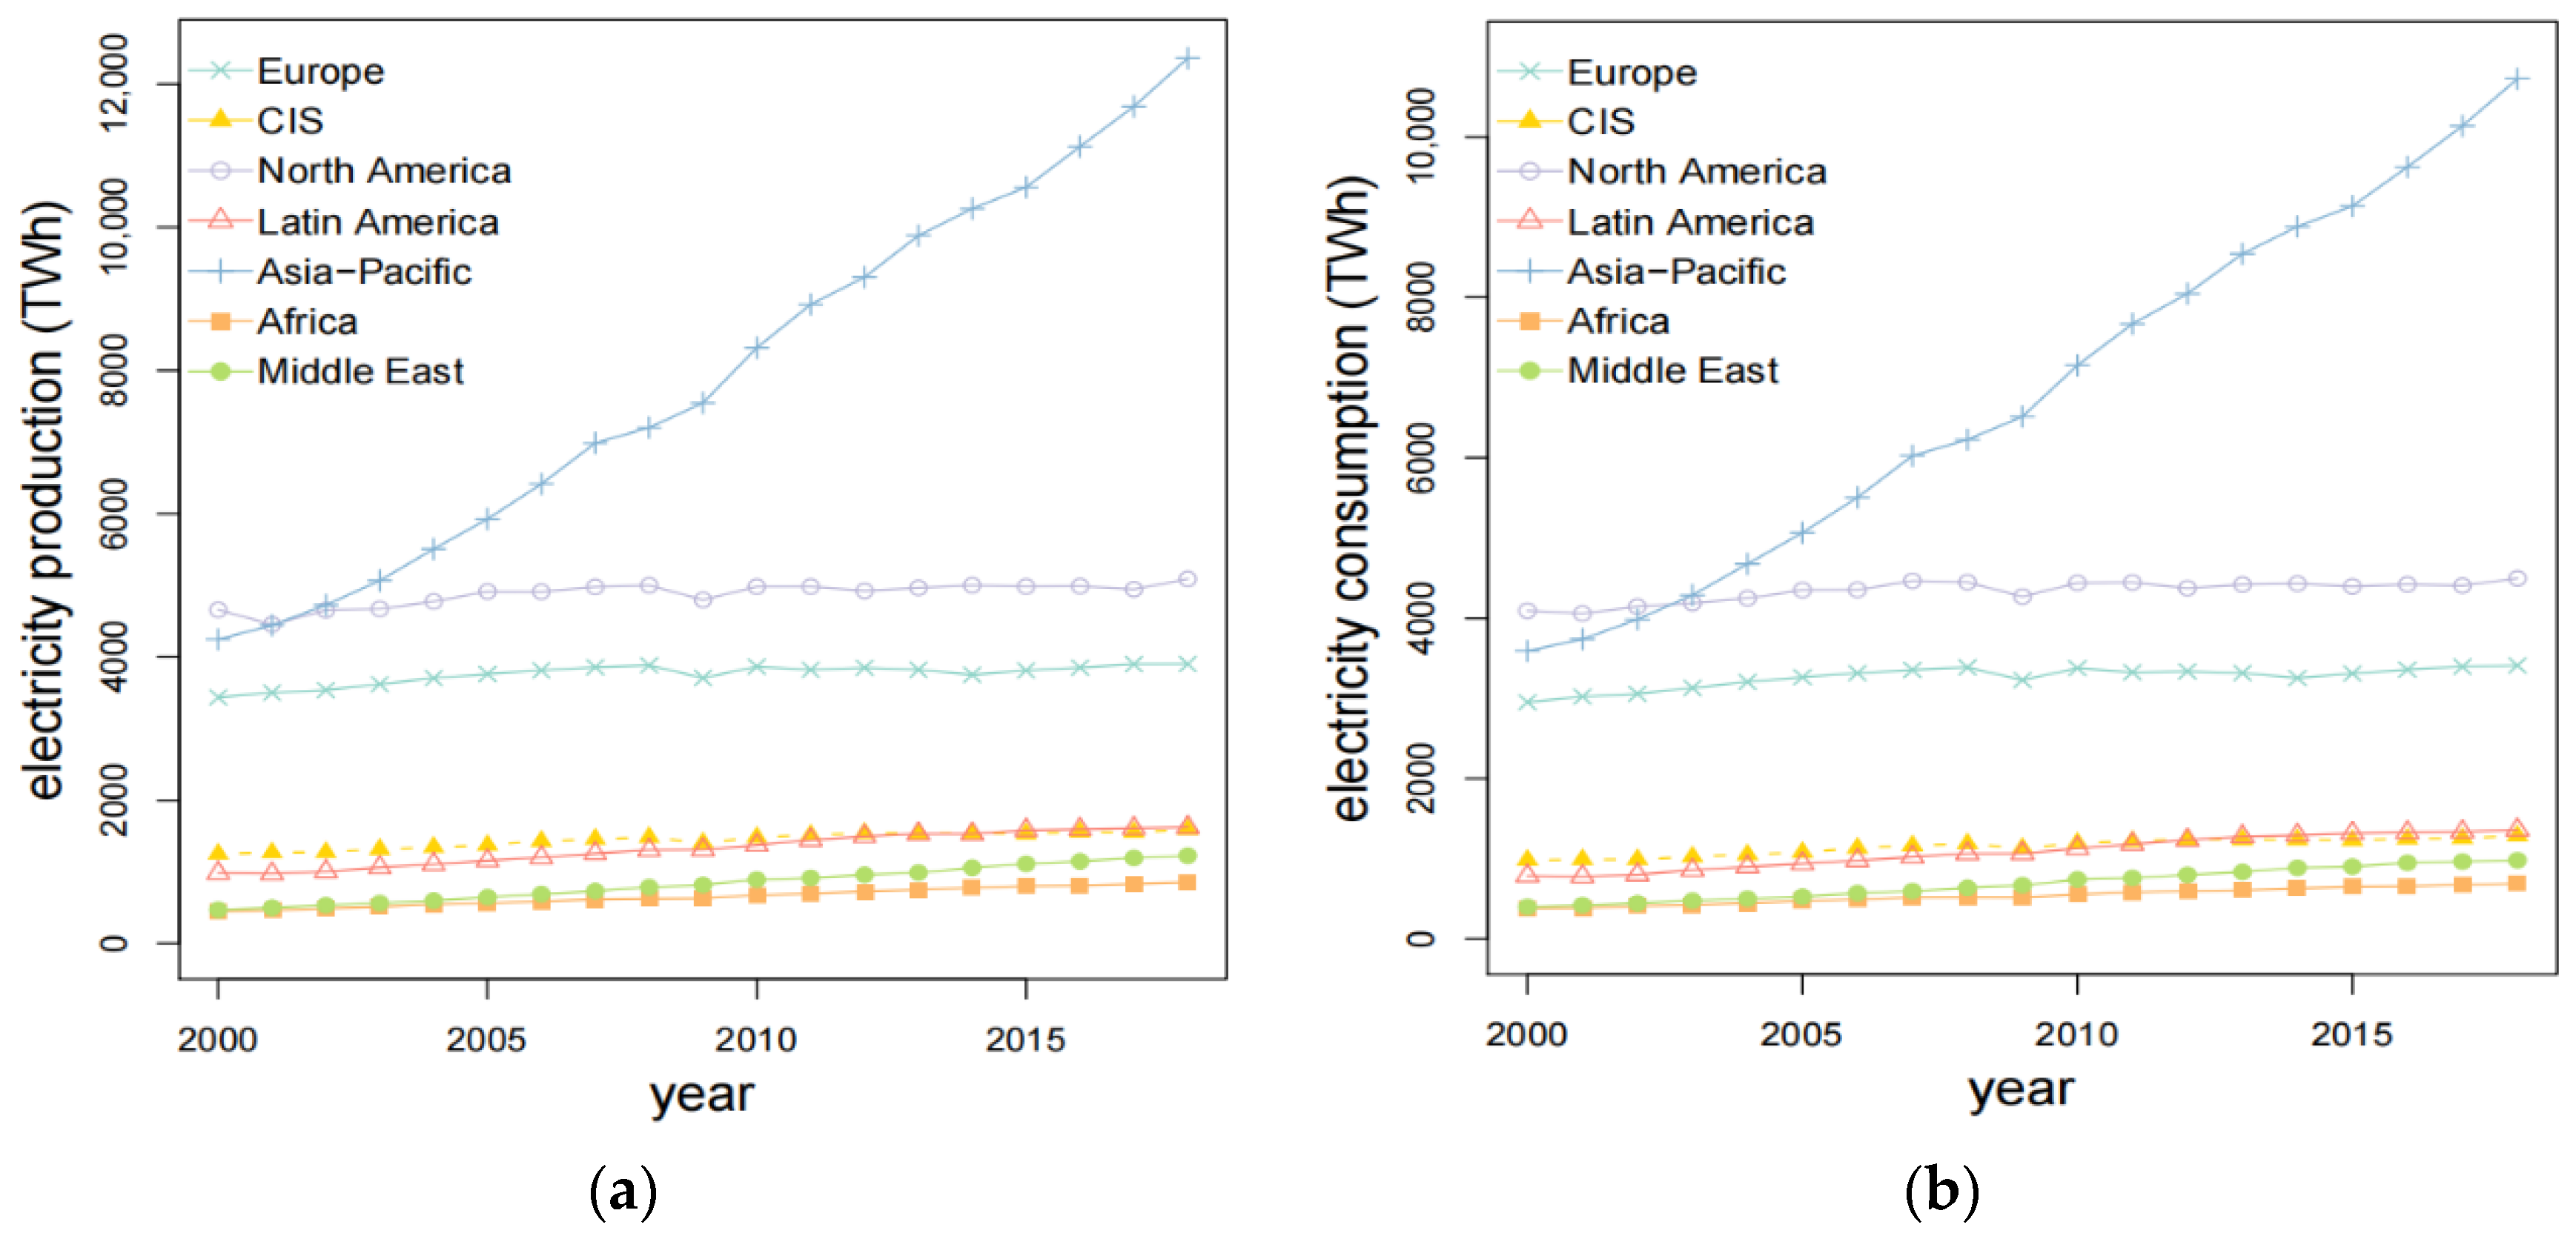
Appendix B. Electricity Trade, Electricity Supply and Demand

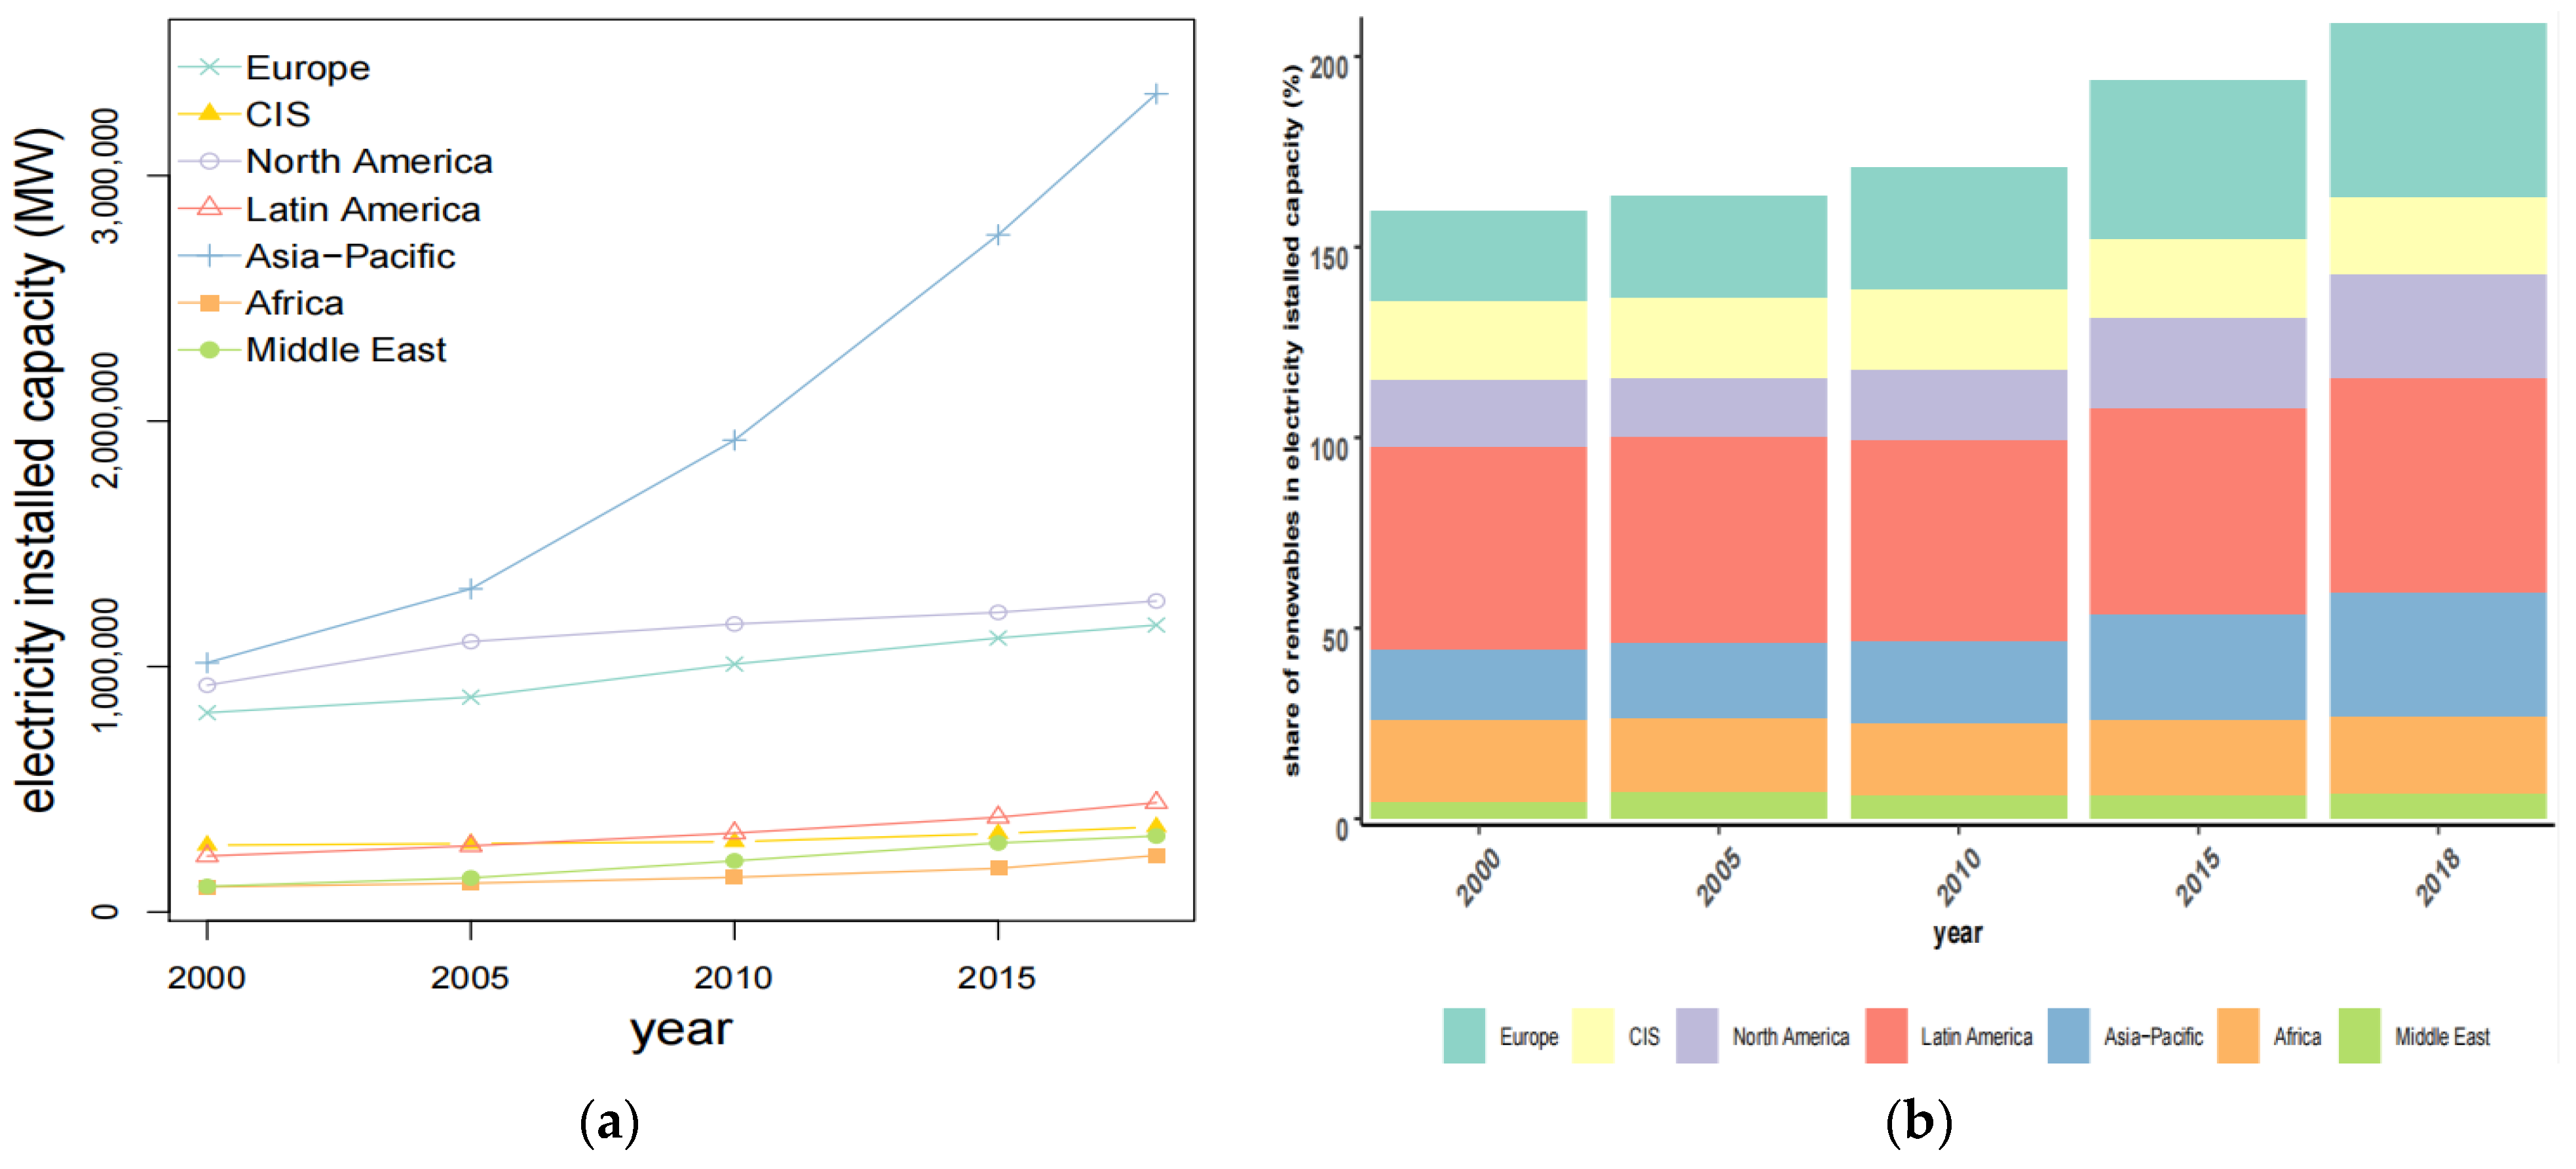
Appendix C. Electricity Installed Capacity
References
- Statistical Review of World Energy. 2020. Available online: https://www.bp.com/ (accessed on 5 March 2021).
- World Economy Situation and Prospects 2020. Available online: https://www.un.org/development/desa/dpad/document_gem/global-economic-monitoring-unit/world-economic-situation-and-prospects-wesp-report/ (accessed on 5 March 2021).
- SDG7: Data and Projections. 2020. Available online: https://www.iea.org/reports/sdg7-data-and-projections (accessed on 5 March 2021).
- Newbery, D.; Strbac, G.; Viehoff, I. The benefits of integrating European electricity markets. Energy Policy 2016, 94, 253–263. [Google Scholar] [CrossRef]
- Zhou, S.; Wei, W.; Chen, L.; Zhang, Z.; Liu, Z.; Wang, Y.; Kong, J.; Li, J. Impact of a Coal-Fired Power Plant Shutdown Campaign on Heavy Metal Emissions in China. Environ. Sci. Technol. 2019, 53, 14063–14069. [Google Scholar] [CrossRef] [PubMed]
- Weber, C.L.; Jaramillo, P.; Marriott, J.; Samaras, C. Life Cycle Assessment and Grid Electricity: What Do We Know and What Can We Know? Environ. Sci. Technol. 2010, 44, 1895–1901. [Google Scholar] [CrossRef] [PubMed]
- Steinke, F.; Wolfrum, P.; Hoffmann, C. Grid vs. storage in a 100% renewable Europe. Renew. Energy 2013, 50, 826–832. [Google Scholar] [CrossRef]
- Rahman, M.M. Environmental degradation: The role of electricity consumption, economic growth and globalisation. J. Environ. Manag. 2020, 253, 109742. [Google Scholar] [CrossRef] [PubMed]
- Bento, J.P.C.; Moutinho, V. CO2 emissions, non-renewable and renewable electricity production, economic growth, and international trade in Italy. Renew. Sustain. Energy Rev. 2016, 55, 142–155. [Google Scholar] [CrossRef]
- Genc, T.; Aydemir, A. Power Trade, Welfare, and Air Quality. SSRN Electron. J. 2013, 67, 423–438. [Google Scholar] [CrossRef]
- Antweiler, W. Cross-border trade in electricity. J. Int. Econ. 2016, 101, 42–51. [Google Scholar] [CrossRef]
- Singh, A.; Jamasb, T.; Nepal, R.; Toman, M. Electricity cooperation in South Asia: Barriers to cross-border trade. Energy Policy 2018, 120, 741–748. [Google Scholar] [CrossRef]
- Hawkes, A. Long-run marginal CO2 emissions factors in national electricity systems. Appl. Energy 2014, 125, 197–205. [Google Scholar] [CrossRef]
- Practical Action. Poor People’s Energy Outlook 2014: Key Messages on Energy for Poverty Alleviation; Practical Action Publishing Ltd.: Rugby, UK, 2014. [Google Scholar]
- Dornan, M. Access to electricity in Small Island Developing States of the Pacific: Issues and challenges. Renew. Sustain. Energy Rev. 2014, 31, 726–735. [Google Scholar] [CrossRef]
- Ben Amor, M.; Pineau, P.-O.; Gaudreault, C.; Samson, R. Electricity trade and GHG emissions: Assessment of Quebec’s hydropower in the Northeastern American market (2006–2008). Energy Policy 2011, 39, 1711–1721. [Google Scholar] [CrossRef]
- Qu, S.; Li, Y.; Liang, S.; Yuan, J.-H.; Xu, M. Virtual CO2 Emission Flows in the Global Electricity Trade Network. Environ. Sci. Technol. 2018, 52, 6666–6675. [Google Scholar] [CrossRef] [PubMed]
- Wei, W.; Zhang, P.; Yao, M.; Xue, M.; Miao, J.; Liu, B.; Wang, F. Multi-scope electricity-related carbon emissions accounting: A case study of Shanghai. J. Clean. Prod. 2020, 252, 119789. [Google Scholar] [CrossRef]
- Yuan, M.; Tapia-Ahumada, K.; Reilly, J. The role of cross-border electricity trade in transition to a low-carbon economy in the Northeastern U.S. Energy Policy 2021, 154, 112261. [Google Scholar] [CrossRef]
- Bélaïd, F.; Youssef, M. Environmental degradation, renewable and non-renewable electricity consumption, and economic growth: Assessing the evidence from Algeria. Energy Policy 2017, 102, 277–287. [Google Scholar] [CrossRef]
- Silva, S.; Soares, I.; Pinho, C. The impact of renewable energy sources on economic growth and CO2 emissions—A SVAR approach. Eur. Res. Studies J. 2012, 15, 133–144. [Google Scholar] [CrossRef]
- Balsalobre-Lorente, D.; Shahbaz, M.; Roubaud, D.; Farhani, S. How economic growth, renewable electricity and natural resources contribute to CO2 emissions? Energy Policy 2018, 113, 356–367. [Google Scholar] [CrossRef]
- Abrell, J.; Rausch, S. Cross-country electricity trade, renewable energy and European transmission infrastructure policy. J. Environ. Econ. Manag. 2016, 79, 87–113. [Google Scholar] [CrossRef]
- Haque, H.E.; Dhakal, S.; Mostafa, S. An assessment of opportunities and challenges for cross-border electricity trade for Bangladesh using SWOT-AHP approach. Energy Policy 2020, 137, 111118. [Google Scholar] [CrossRef]
- Mondal, A.H.; Ringler, C. Long-term optimization of regional power sector development: Potential for cooperation in the Eastern Nile region? Energy 2020, 201, 117703. [Google Scholar] [CrossRef]
- Timilsina, G.R.; Toman, M. Potential gains from expanding regional electricity trade in South Asia. Energy Econ. 2016, 60, 6–14. [Google Scholar] [CrossRef]
- Purvins, A.; Gerbelova, H.; Sereno, L.; Minnebo, P. Social welfare impact from enhanced Trans-Asian electricity trade. Energy 2021, 215, 119106. [Google Scholar] [CrossRef]
- Bollino, C.A.; Madlener, R.; Bigerna, S.; Polinori, P. Foreword to the Special Issue on “High Shares of Renewable Energy Sources and Electricity Market Reform”. Energy J. 2016, 37. [Google Scholar] [CrossRef]
- Green, R.; Staffell, D.P.I.; Strbac, G. Market Design for Long-Distance Trade in Renewable Electricity. Energy J. 2016, 37, 161–184. [Google Scholar] [CrossRef]
- Neuhoff, K.; Wolter, S.; Schwenen, S. Power markets with Renewables: New perspectives for the European Target Model. Energy J. 2016, 37. [Google Scholar] [CrossRef]
- Praktiknjo, A.; Erdmann, G. Renewable Electricity and Backup Capacities: An (Un-) Resolvable Problem? Energy J. 2016, 37. [Google Scholar] [CrossRef]
- Schroeder, A.; Oei, P.-Y.; Sander, A.; Hankel, L.; Laurisch, L.C. The integration of renewable energies into the German transmission grid—A scenario comparison. Energy Policy 2013, 61, 140–150. [Google Scholar] [CrossRef]
- Makrygiorgou, D.I.; Andriopoulos, N.; Georgantas, I.; Dikaiakos, C.; Papaioannou, G.P. Cross-Border Electricity Trading in Southeast Europe Towards an Internal European Market. Energies 2020, 13, 6653. [Google Scholar] [CrossRef]
- Ardian, F.; Concettini, S.; Creti, A. Renewable Generation and Network Congestion: An Empirical Analysis of the Italian Power Market. Energy J. 2018, 39, 3–39. [Google Scholar] [CrossRef]
- Kunz, F.; Zerrahn, A. Coordinating Cross-Country Congestion Management: Evidence from Central Europe. Energy J. 2016, 37. [Google Scholar] [CrossRef]
- Barabási, A.-L. The network takeover. Nat. Phys. 2011, 8, 14–16. [Google Scholar] [CrossRef]
- Fagiolo, G. The international-trade network: Gravity equations and topological properties. J. Econ. Interact. Co-ord. 2010, 5, 1–25. [Google Scholar] [CrossRef]
- Dueñas, M.; Fagiolo, G. Modeling the International-Trade Network: A gravity approach. J. Econ. Interact. Co-ord. 2013, 8, 155–178. [Google Scholar] [CrossRef]
- Neumann, A.; Viehrig, N.; Weigt, H. Intragas—A Stylized Model of the European Natural Gas Network. SSRN Electron. J. 2009. [Google Scholar] [CrossRef][Green Version]
- Lupu, Y.; Traag, V.A. Trading Communities, the Networked Structure of International Relations, and the Kantian Peace. J. Confl. Resolut. 2012, 57, 1011–1042. [Google Scholar] [CrossRef]
- Zhong, W.; An, H.; Shen, L.; Dai, T.; Fang, W.; Gao, X.; Dong, D. Global pattern of the international fossil fuel trade: The evolution of communities. Energy 2017, 123, 260–270. [Google Scholar] [CrossRef]
- Xanat, V.M.; Jiang, K.; Barnett, G.A.; Park, H.W. International trade of GMO-related agricultural products. Qual. Quant. 2018, 52, 565–587. [Google Scholar] [CrossRef]
- Xu, H.; Cheng, L. The QAP weighted network analysis method and its application in international services trade. Phys. A Stat. Mech. Appl. 2016, 448, 91–101. [Google Scholar] [CrossRef]
- Brashears, M.E. Exponential Random Graph Models for Social Networks: Theory, Methods, and Applications. Contemp. Sociol. A J. Rev. 2014, 43, 552–553. [Google Scholar] [CrossRef]
- Feng, L.; Xu, H.; Wu, G.; Zhao, Y.; Xu, J. Exploring the structure and influence factors of trade competitive advantage network along the Belt and Road. Phys. A Stat. Mech. Appl. 2020, 559, 125057. [Google Scholar] [CrossRef]
- Zhang, H.; Wang, Y.; Yang, C.; Guo, Y. The impact of country risk on energy trade patterns based on complex network and panel regression analyses. Energy 2021, 222, 119979. [Google Scholar] [CrossRef]
- Hao, X.; An, H.; Qi, H.; Gao, X. Evolution of the exergy flow network embodied in the global fossil energy trade: Based on complex network. Appl. Energy 2016, 162, 1515–1522. [Google Scholar] [CrossRef]
- Gao, C.; Sun, M.; Shen, B. Features and evolution of international fossil energy trade relationships: A weighted multilayer network analysis. Appl. Energy 2015, 156, 542–554. [Google Scholar] [CrossRef]
- Semanur, S.; Hüseyin, T.; Halil, Ö. An Alternative View to the Global Coal Trade: Complex Network Approach. Stud. Bus. Econ. 2020, 15, 270–288. [Google Scholar] [CrossRef]
- Ji, Q.; Zhang, H.-Y.; Fan, Y. Identification of global oil trade patterns: An empirical research based on complex network theory. Energy Convers. Manag. 2014, 85, 856–865. [Google Scholar] [CrossRef]
- Peng, P.; Lu, F.; Cheng, S.; Yang, Y. Mapping the global liquefied natural gas trade network: A perspective of maritime transportation. J. Clean. Prod. 2021, 283, 124640. [Google Scholar] [CrossRef]
- Geng, J.-B.; Ji, Q.; Fan, Y. A dynamic analysis on global natural gas trade network. Appl. Energy 2014, 132, 23–33. [Google Scholar] [CrossRef]
- Dong, G.; Qing, T.; Du, R.; Wang, C.; Li, R.; Wang, M.; Tian, L.; Chen, L.; Vilela, A.L.; Stanley, H.E. Complex network approach for the structural optimization of global crude oil trade system. J. Clean. Prod. 2020, 251, 119366. [Google Scholar] [CrossRef]
- Peer, R.A.M.; Chini, C.M. An integrated assessment of the global virtual water trade network of energy. Environ. Res. Lett. 2020, 15, 114015. [Google Scholar] [CrossRef]
- Ji, L.; Jia, X.; Chiu, A.S.F.; Xu, M. Global Electricity Trade Network: Structures and Implications. PLoS ONE 2016, 11, e0160869. [Google Scholar] [CrossRef] [PubMed][Green Version]
- UN Comtrade/Commodity Trade. International Trade Statistics Database. 2019. Available online: https://comtrade.un.org/ (accessed on 19 January 2021).
- Kellenberg, D.; Levinson, A. Misreporting trade: Tariff evasion, corruption, and auditing standards. Rev. Int. Econ. 2018, 27, 106–129. [Google Scholar] [CrossRef]
- Barrat, A.; Barthelemy, M.; Pastor-Satorras, R.; Vespignani, A. The architecture of complex weighted networks. Proc. Natl. Acad. Sci. USA 2004, 101, 3747–3752. [Google Scholar] [CrossRef] [PubMed]
- Squartini, T.; Picciolo, F.; Ruzzenenti, F.; Garlaschelli, D. Reciprocity of weighted networks. Sci. Rep. 2013, 3, 2729. [Google Scholar] [CrossRef] [PubMed]
- Yu-Ping, S.; Jing, N. Effect of variable network clustering on the accuracy of node centrality. Acta Phys. Sin. 2016, 65, 028901. [Google Scholar] [CrossRef]
- Goh, K.-I.; Oh, E.; Kahng, B.; Kim, D. Betweenness centrality correlation in social networks. Phys. Rev. E 2003, 67, 017101. [Google Scholar] [CrossRef]
- Milo, R.; Itzkovitz, S.; Kashtan, N.; Levitt, R.; Shen-Orr, S.; Ayzenshtat, I.; Sheffer, M.; Alon, U. Superfamilies of Evolved and Designed Networks. Science 2004, 303, 1538–1542. [Google Scholar] [CrossRef]
- Cranmer, S.J.; Desmarais, B.A.; Menninga, E.J. Complex Dependencies in the Alliance Network. Confl. Manag. Peace Sci. 2012, 29, 279–313. [Google Scholar] [CrossRef]
- Cranmer, S.J.; Leifeld, P.; McClurg, S.D.; Rolfe, M. Navigating the Range of Statistical Tools for Inferential Network Analysis. Am. J. Polit. Sci. 2016, 61, 237–251. [Google Scholar] [CrossRef]
- Silk, M.J.; Croft, D.; Delahay, R.J.; Hodgson, D.J.; Weber, N.; Boots, M.; McDonald, R.A. The application of statistical network models in disease research. Methods Ecol. Evol. 2017, 8, 1026–1041. [Google Scholar] [CrossRef]
- Strecker, S.; Weinhardt, C. Electronic OTC Trading in the German Wholesale Electricity Market. In Proceedings of the International Conference on Electronic Commerce and Web Technologies, London, UK, 4–6 September 2000; pp. 280–290. [Google Scholar]
- Beus, M.; Pavic, I.; Stritof, I.; Capuder, T.; Pandžič, H. Electricity Market Design in Croatia within the European Electricity Market—Recommendations for Further Development. Energies 2018, 11, 346. [Google Scholar] [CrossRef]
- Biskas, P.N.; Chatzigiannis, D.I.; Bakirtzis, A.G. Market coupling feasibility between a power pool and a power exchange. Electr. Power Syst. Res. 2013, 104, 116–128. [Google Scholar] [CrossRef]
- FIA. Available online: https://www.fia.org/ (accessed on 3 May 2021).
- Enerdata Database. Available online: https://www.enerdata.net/ (accessed on 17 February 2021).
- IEA Database. Available online: https://www.iea.org/ (accessed on 17 February 2021).
- Mavisto Software. Available online: http://mavisto.ipk-gatersleben.de/ (accessed on 21 February 2021).
- Handcock, M.S.; Hunter, D.R.; Butts, C.T.; Goodreau, S.M.; Morris, M. Statnet: Software Tools for the Representation, Visualization, Analysis and Simulation of Network Data. J. Stat. Softw. 2008, 24, 1–11. [Google Scholar] [CrossRef]
- Melitz, J. Language and foreign trade. Eur. Econ. Rev. 2008, 52, 667–699. [Google Scholar] [CrossRef]
- Artal-Tur, A.; Ghoneim, A.F.; Peridy, N. Proximity, trade and ethnic networks of migrants: Case study for France and Egypt. Int. J. Manpow. 2015, 36, 619–648. [Google Scholar] [CrossRef]
- De Groot, H.L.F.; Linders, G.-J.; Rietveld, P.; Subramanian, U. The Institutional Determinants of Bilateral Trade Patterns. Kyklos 2004, 57, 103–123. [Google Scholar] [CrossRef]
- Cuervo-Cazurra, A.; Genc, M. Transforming disadvantages into advantages: Developing-country MNEs in the least developed countries. J. Int. Bus. Stud. 2008, 39, 957–979. [Google Scholar] [CrossRef]
- Håkanson, L.; Ambos, B. The antecedents of psychic distance. J. Int. Manag. 2010, 16, 195–210. [Google Scholar] [CrossRef]
- Belloc, M. Institutions and International Trade: A Reconsideration of Comparative Advantage. J. Econ. Surv. 2006, 20, 3–26. [Google Scholar] [CrossRef]
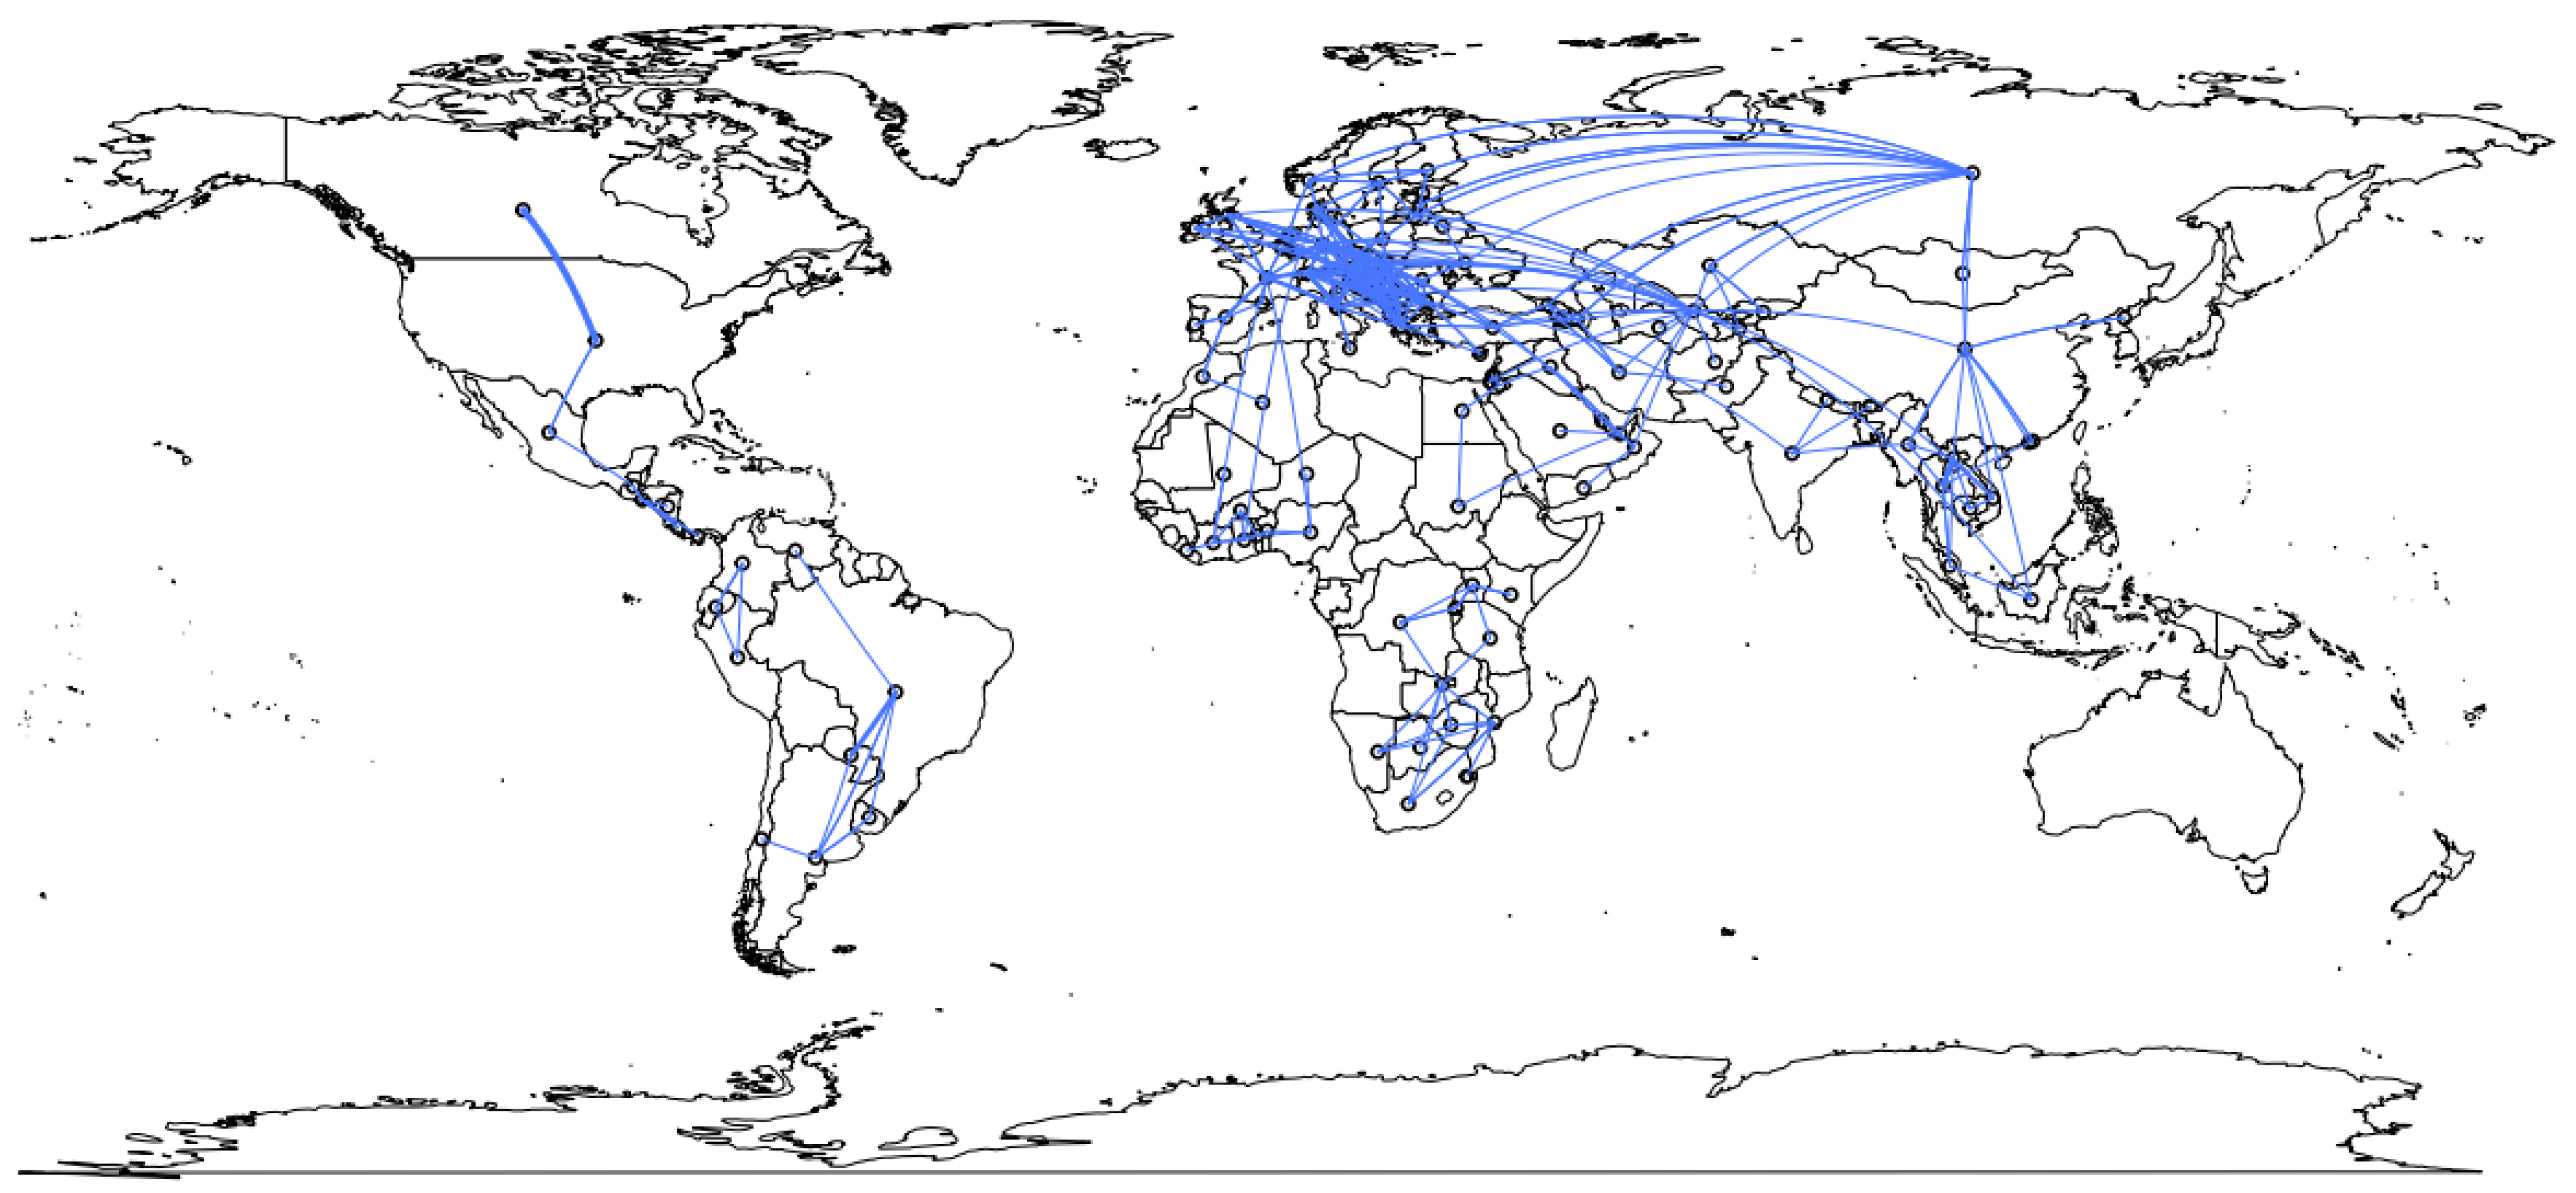
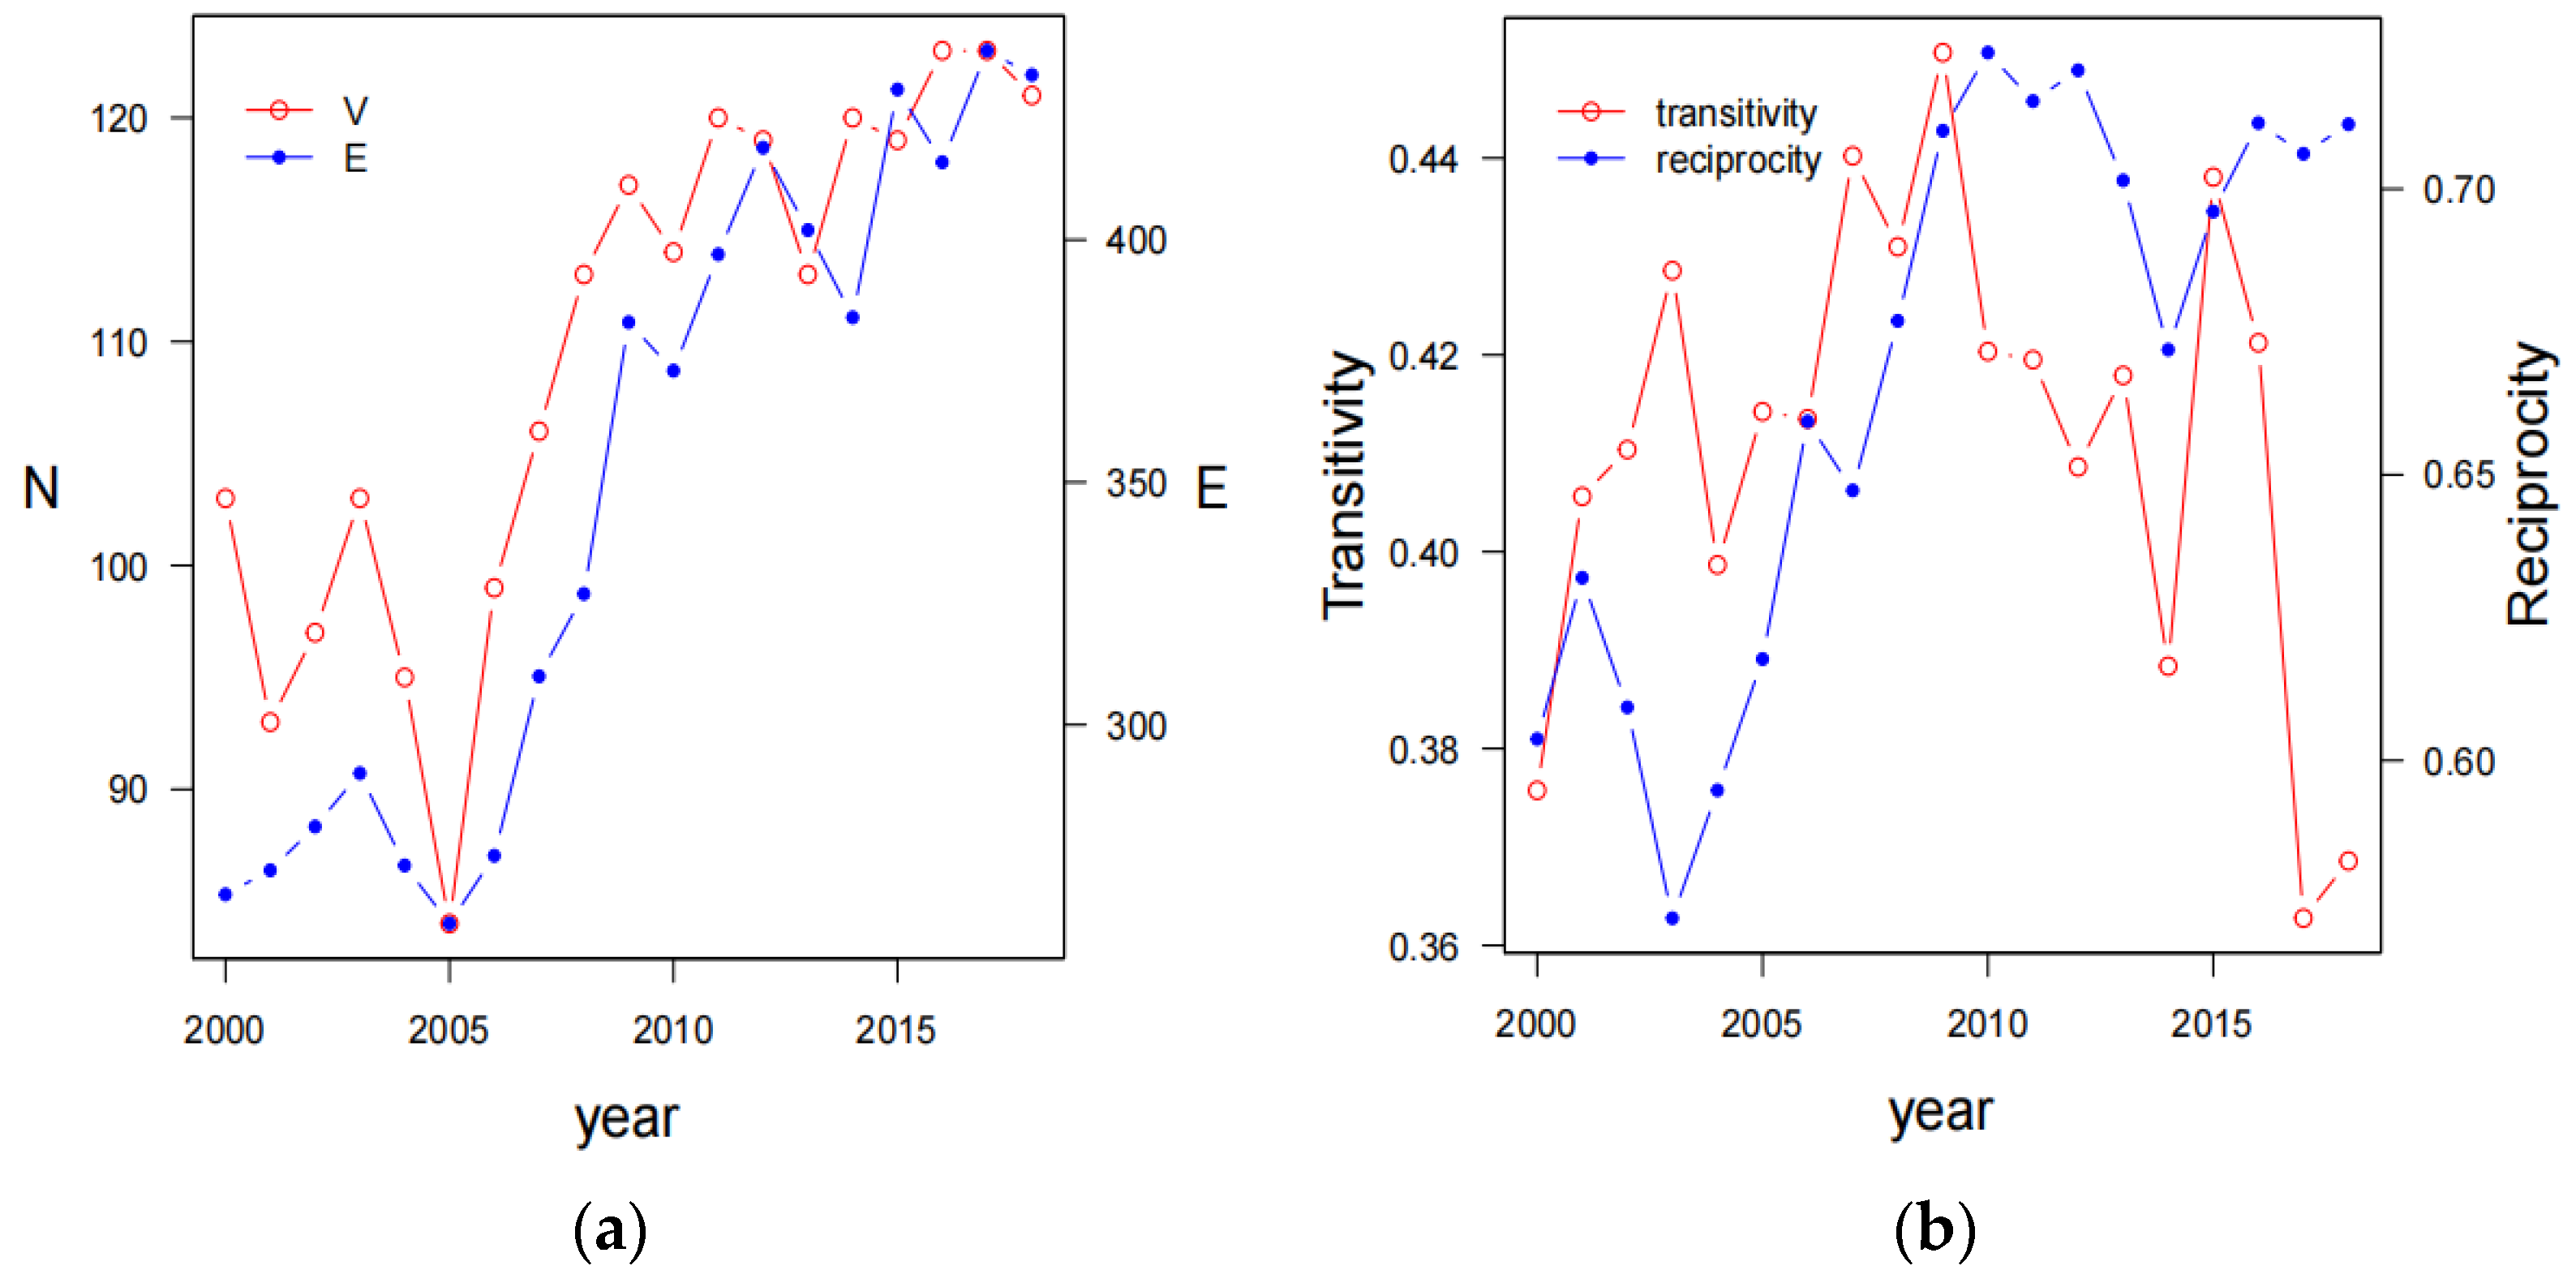
| Year | Rank | In-Degree Centrality | Out-Degree Centrality | Degree Centrality | Betweenness Centrality | ||||
|---|---|---|---|---|---|---|---|---|---|
| Economy | ID | Economy | OD | Economy | D | Economy | BC | ||
| 2000 | 1 | DEU | 12 | DEU | 13 | DEU | 25 | CHE | 0.114 |
| 2 | CHE | 10 | RUS | 13 | CHE | 20 | RUS | 0.107 | |
| 3 | FRA | 9 | CHE | 10 | RUS | 20 | SVK | 0.106 | |
| 4 | SVK | 8 | BEL | 10 | FRA | 28 | SCG | 0.101 | |
| 5 | HRV | 8 | FRA | 9 | BEL | 16 | DEU | 0.097 | |
| 6 | SWE | 8 | GBR | 8 | SVK | 15 | POL | 0.082 | |
| 7 | NLD | 7 | SVK | 7 | GBR | 15 | BGR | 0.059 | |
| 8 | GBR | 7 | HRV | 7 | HRV | 15 | FIN | 0.047 | |
| 9 | SCG | 7 | AUT | 7 | SVN | 14 | NLD | 0.038 | |
| 2005 | 1 | DEU | 15 | DEU | 14 | DEU | 29 | SRB | 0.096 |
| 2 | SVN | 12 | POL | 10 | SVN | 22 | RUS | 0.081 | |
| 3 | CHE | 12 | SVN | 10 | CHE | 21 | DEU | 0.081 | |
| 4 | HRV | 10 | HRV | 10 | HRV | 20 | BIH | 0.074 | |
| 5 | CZE | 10 | CZE | 10 | CZE | 20 | FIN | 0.068 | |
| 6 | GBR | 9 | CHE | 9 | ESP | 18 | DNK | 0.067 | |
| 7 | ESP | 9 | ESP | 9 | POL | 16 | NOR | 0.067 | |
| 8 | AUT | 8 | ROU | 9 | GBR | 15 | SVN | 0.051 | |
| 9 | HUN | 7 | UKR | 8 | ROU | 14 | HUN | 0.046 | |
| 2010 | 1 | SVN | 20 | CZE | 18 | SVN | 36 | RUS | 0.155 |
| 2 | CZE | 17 | SVN | 16 | CZE | 35 | UKR | 0.125 | |
| 3 | GRC | 16 | CHE | 14 | DEU | 27 | HRV | 0.105 | |
| 4 | DEU | 14 | DEU | 13 | CHE | 26 | ROU | 0.087 | |
| 5 | CHE | 12 | HUN | 13 | GRC | 24 | DEU | 0.086 | |
| 6 | SRB | 12 | HRV | 11 | SRB | 23 | SVK | 0.081 | |
| 7 | HRV | 11 | ESP | 11 | HRV | 22 | CHN | 0.074 | |
| 8 | AUT | 10 | SRB | 11 | HUN | 21 | GRC | 0.069 | |
| 9 | ROU | 8 | RUS | 11 | ESP | 19 | CZE | 0.066 | |
| 2015 | 1 | NLD | 26 | CZE | 19 | CZE | 39 | RUS | 0.153 |
| 2 | CZE | 20 | SVN | 17 | SVN | 35 | SVN | 0.150 | |
| 3 | SVN | 18 | BGR | 17 | NLD | 31 | NLD | 0.114 | |
| 4 | GRC | 14 | ITA | 14 | DEU | 27 | IRL | 0.107 | |
| 5 | SRB | 14 | DEU | 13 | CHE | 26 | ITA | 0.099 | |
| 6 | DEU | 14 | CHE | 13 | ESP | 25 | CHN | 0.088 | |
| 7 | CHE | 13 | ESP | 13 | SRB | 25 | BIH | 0.088 | |
| 8 | ESP | 12 | RUS | 12 | BGR | 24 | EST | 0.075 | |
| 9 | ITA | 10 | SRB | 11 | ITA | 24 | ROU | 0.067 | |
| 2018 | 1 | CZE | 23 | UZB | 23 | CZE | 44 | RUS | 0.191 |
| 2 | BGR | 18 | CZE | 21 | BGR | 34 | GRC | 0.115 | |
| 3 | SVN | 17 | BGR | 16 | SVN | 32 | GEO | 0.111 | |
| 4 | GRC | 15 | SVN | 15 | GRC | 28 | CZE | 0.111 | |
| 5 | DEU | 14 | DEU | 14 | DEU | 28 | UZB | 0.101 | |
| 6 | SRB | 12 | GRC | 13 | UZB | 25 | KGZ | 0.099 | |
| 7 | CHE | 12 | ITA | 12 | ITA | 23 | KAZ | 0.098 | |
| 8 | ITA | 11 | SRB | 11 | SRB | 23 | TUR | 0.091 | |
| 9 | HUN | 11 | HUN | 11 | CHE | 22 | CHN | 0.079 | |
| Code | Motif | Frequency | p-Value | Z-Score | Top Three |
|---|---|---|---|---|---|
| F7F |  | 1555 | 1 | 0 | CZE (332); SVN (301); DEU (213) |
| F8R |  | 2859 | 1 | 0 | CZE (651); SVN (600); DEU (426) |
| F8X |  | 2297 | 0 | 22.415 | CZE (555); SVN (532); DEU (361) |
| FKX |  | 1182 | 0 | 33.073 | SVN (348); CZE (310); DEU (219) |
| FMF |  | 484 | 0 | 47.008 | SVN (156); CZE (129); DEU (95) |
| GCR |  | 1620 | 1 | 0 | NLD (355); CZE (354); SVN (320) |
| GCX |  | 2228 | 0 | 20.369 | CZE (563); SVN (533); DEU (377) |
| GDF |  | 881 | 0 | 50.037 | CZE (237); SVN (234); CHE (159) |
| GOX |  | 346 | 0 | 21.173 | SVN (107); CZE (90); DEU (71) |
| GQX |  | 731 | 0 | 73.844 | SVN (259); CZE (204); DEU (170) |
| IMF |  | 873 | 0 | 43.343 | SVN (290); CZE (236); DEU (191) |
| JQF |  | 451 | 0 | 41.072 | SVN (147); CZE (126); DEU (98) |
| K4F |  | 102 | 0 | 98.609 | SVN (38); CZE (29); DEU (25) |
| Effect Classification | Variable Symbol | Variable Name | Schematic Diagram | Meaning |
|---|---|---|---|---|
| Pure structural effect | Edges | Edges |  | The influence of network density on the formation of network relations, which is similar to a constant. |
| Mutual | Reciprocity |  | Whether the network economies prefer reciprocal trade. | |
| Ostar-K | Out-K Star |  | The impact of scalability on the formation of network relationships. | |
| Istar-K | Istar-K |  | The influence of convergence on the formation of network relationships. | |
| Actor attribute effect | Homophily | Homophily effect |  | Whether economies with the same node attributes are more inclined to form network relationships. |
| Heterophily | Heterophily effect |  | The influence of economies with different node attributes on the formation of network relationships. | |
| Receiver | Receiver effect |  | The influence of node attributes on network inbound relationships. | |
| Sender | Sender effect |  | The influence of node attributes on network outgoing relationships. | |
| Network embedding effect | NCov | Network covariates |  | The influence of other network relationships on the cross-border electricity network relationships. |
| Variables | Benchmark Model | Attribute Model | Network Covariate Model | Compound Model | |||
|---|---|---|---|---|---|---|---|
| (1) | (2) | (3) | (4) | (5) | (6) | ||
| Pure structural variables | Edges | −4.540 *** (0.095) | −4.087 *** (0.046) | −3.329 *** (0.045) | −4.115 *** (0.043) | −4.799 *** (0.040) | −4.250 *** (0.039) |
| Mutual | 5.491 *** (0.205) | 5.314 *** (0.019) | 5.138 *** (0.019) | 5.263 *** (0.018) | 4.683 *** (0.019) | 4.596 *** (0.018) | |
| Actor attribute variables | Homophily (pco2) | 0.373 *** (0.066) | 0.231 *** (0.070) | 0.354 *** (0.066) | 0.224 *** (0.062) | 0.141 ** (0.065) | |
| Receiver (pco2low) | −0.113 *** (0.040) | −0.090 ** (0.042) | −0.177 *** (0.039) | −0.022 *** (0.006) | −0.088 *** (0.003) | ||
| Sender (pco2low) | −0.840 *** (0.037) | −0.826 *** (0.040) | −0.913 *** (0.037) | −0.762 *** (0.006) | −0.815 *** (0.004) | ||
| Receiver (pco2high) | 0.546 *** (0.053) | 0.569 *** (0.053) | 0.513 *** (0.054) | 0.470 *** (0.055) | 0.448 *** (0.054) | ||
| Sender (pco2high) | −0.307 *** (0.050) | −0.263 *** (0.050) | −0.349 *** (0.051) | −0.317 *** (0.049) | −0.341 *** (0.048) | ||
| Heterophily (GDP) | −0.0002 ** (0.0001) | −0.0002 ** (0.0001) | −0.0002 ** (0.0001) | −0.0002 ** (0.0001) | −0.0002 ** (0.0001) | ||
| Receiver (GDP) | 0.0001 ** (0.0001) | 0.0001 ** (0.0001) | 0.0001 * (0.0001) | 0.0001 ** (0.0001) | 0.0001 *** (0.0001) | ||
| Sender (GDP) | 0.0004 *** (0.0001) | 0.0004 *** (0.0001) | 0.0004 *** (0.0001) | 0.0003 ** (0.0001) | 0.0003 ** (0.0001) | ||
| Heterophily (industry) | −33.682 *** (0.143) | −29.308 *** (0.138) | −31.232 *** (0.141) | −17.055 *** (0.135) | −14.236 *** (0.135) | ||
| Heterophily (price) | −0.042 *** (0.009) | −0.040 *** (0.009) | −0.042 *** (0.009) | −0.027 *** (0.010) | −0.029 *** (0.010) | ||
| Heterophily (capacity) | 0.001 (0.001) | 0.0003 (0.001) | 0.001 (0.001) | 0.0004 (0.001) | 0.0003 (0.001) | ||
| Sender (renewable) | 0.169 *** (0.035) | 0.191 *** (0.032) | 0.193 *** (0.033) | 0.309 *** (0.014) | 0.290 *** (0.014) | ||
| Sender (consumption) | −0.013 *** (0.003) | −0.015 *** (0.003) | −0.013 *** (0.003) | −0.013 *** (0.004) | −0.013 *** (0.004) | ||
| Sender (generation) | 0.012 *** (0.003) | 0.013 *** (0.003) | 0.011 *** (0.003) | 0.012 *** (0.003) | 0.012 *** (0.003) | ||
| Sender (loss) | −0.0003 (0.003) | 0.00001 (0.003) | −0.002 (0.003) | 0.006 ** (0.003) | 0.005 * (0.003) | ||
| Network covariates | Edgecov (WGI) | −3.204 *** (0.011) | −1.820 *** (0.010) | ||||
| Edgecov (language) | 0.739 *** (0.023) | 0.401 *** (0.011) | |||||
| Edgecov (distance) | 974.138 *** (1.521) | 863.523 *** (1.546) | |||||
| AIC | 2567.345 | 2414.505 | 2311.548 | 2378.616 | 1988.713 | 1958.653 | |
| BIC | 2581.942 | 2538.577 | 2442.918 | 2509.986 | 2120.083 | 2104.620 | |
| Variables | 2005 | 2010 | 2015 | ||||
|---|---|---|---|---|---|---|---|
| Attribute Model | Compound Model | Attribute Model | Compound Model | Attribute Model | Compound Model | ||
| Pure Structural variables | Edges | −3.821 *** (0.050) | −4.032 *** (0.070) | −4.621 *** (0.039) | −4.839 *** (0.044) | −4.303 *** (0.035) | −4.391 *** (0.031) |
| Mutual | 4.327 *** (0.016) | 3.555 *** (0.018) | 5.609 *** (0.015) | 4.998 *** (0.016) | 5.342 *** (0.013) | 4.614 *** (0.012) | |
| Actor Attribute variables | Homophily (pco2) | 0.347 *** (0.088) | −0.018 (0.110) | 0.299 *** (0.071) | 0.046 (0.090) | 0.365 *** (0.066) | 0.121 * (0.065) |
| Receiver (pco2low) | −0.492 *** (0.045) | −0.366 *** (0.054) | −0.873 *** (0.032) | −0.791 *** (0.035) | −0.158 *** (0.040) | −0.133 *** (0.004) | |
| Sender (pco2low) | −0.691 *** (0.048) | −0.455 *** (0.058) | −0.388 *** (0.039) | −0.445 *** (0.045) | −0.885 *** (0.037) | −0.846 *** (0.005) | |
| Receiver (pco2high) | 0.231 *** (0.068) | 0.064(0.078) | 0.324 *** (0.055) | 0.245 *** (0.064) | 0.555 *** (0.053) | 0.441 *** (0.051) | |
| Sender (pco2high) | −0.015 (0.069) | −0.118 (0.081) | 0.149 *** (0.054) | 0.121 * (0.063) | −0.326 *** (0.050) | −0.359 *** (0.044) | |
| Heterophily (GDP) | −0.0003 ** (0.0001) | −0.0003 ** (0.0001) | −0.0002 (0.0001) | −0.0001 (0.0001) | −0.0002 ** (0.0001) | −0.0002 ** (0.0001) | |
| Receiver (GDP) | 0.0004 *** (0.0001) | 0.0004 *** (0.0001) | 0.0001 (0.0001) | 0.0001 * (0.0001) | 0.0001 ** (0.0001) | 0.0002 *** (0.0001) | |
| Sender (GDP) | 0.0005 *** (0.0001) | 0.001 *** (0.0001) | 0.0004 ** (0.0001) | 0.0003 ** (0.0001) | 0.0003 *** (0.0001) | 0.0002 * (0.0001) | |
| Heterophily (industry) | −46.373 *** (0.092) | −30.567 *** (0.093) | −32.978 *** (0.112) | −17.278 *** (0.104) | −36.069 *** (0.137) | −15.817 *** (0.135) | |
| Heterophily (capacity) | −0.002 (0.001) | −0.001 (0.001) | −0.0003 (0.001) | −0.0002 (0.001) | 0.0005 (0.001) | 0.0002 (0.001) | |
| Sender (renewable) | 0.119 *** (0.045) | 0.205 *** (0.052) | 0.541 *** (0.037) | 0.894 *** (0.043) | 0.134 *** (0.031) | 0.270 *** (0.012) | |
| Sender (consumption) | −0.029 *** (0.006) | −0.028 *** (0.006) | −0.026 *** (0.005) | −0.026 *** (0.006) | −0.011 *** (0.003) | −0.012 *** (0.004) | |
| Sender (Generation) | 0.027 *** (0.005) | 0.025 *** (0.006) | 0.024 *** (0.004) | 0.023 *** (0.005) | 0.010 *** (0.003) | 0.011 *** (0.003) | |
| Sender (loss) | 0.007 (0.007) | 0.025 *** (0.008) | 0.007 (0.005) | 0.019 *** (0.005) | −0.001 (0.003) | 0.004 (0.003) | |
| Network covariates | Edgecov (WGI) | −1.440 *** (0.028) | −1.673 *** (0.014) | −1.773 *** (0.009) | |||
| Edgecov (language) | 0.738 *** (0.163) | 0.499 *** (0.017) | 0.371 *** (0.009) | ||||
| Edgecov (distance) | 801.902 *** (1.189) | 754.871 *** (1.539) | 875.894 *** (1.537) | ||||
| AIC | 1638.516 | 1368.874 | 2025.382 | 1654.681 | 2434.686 | 1963.468 | |
| BIC | 1747.725 | 1498.560 | 2140.263 | 1791.103 | 2551.459 | 2102.137 | |
Publisher’s Note: MDPI stays neutral with regard to jurisdictional claims in published maps and institutional affiliations. |
© 2021 by the authors. Licensee MDPI, Basel, Switzerland. This article is an open access article distributed under the terms and conditions of the Creative Commons Attribution (CC BY) license (https://creativecommons.org/licenses/by/4.0/).
Share and Cite
Pu, Y.; Li, Y.; Wang, Y. Structure Characteristics and Influencing Factors of Cross-Border Electricity Trade: A Complex Network Perspective. Sustainability 2021, 13, 5797. https://doi.org/10.3390/su13115797
Pu Y, Li Y, Wang Y. Structure Characteristics and Influencing Factors of Cross-Border Electricity Trade: A Complex Network Perspective. Sustainability. 2021; 13(11):5797. https://doi.org/10.3390/su13115797
Chicago/Turabian StylePu, Yue, Yunting Li, and Yingzi Wang. 2021. "Structure Characteristics and Influencing Factors of Cross-Border Electricity Trade: A Complex Network Perspective" Sustainability 13, no. 11: 5797. https://doi.org/10.3390/su13115797
APA StylePu, Y., Li, Y., & Wang, Y. (2021). Structure Characteristics and Influencing Factors of Cross-Border Electricity Trade: A Complex Network Perspective. Sustainability, 13(11), 5797. https://doi.org/10.3390/su13115797


