Regional Inclusive Development: An Assessment of Russian Regions
Abstract
1. Introduction
2. Literature Review
2.1. Academic Literature
“development that includes marginalized people, sectors and countries in social, political and economic processes for increased human well-being, social and environmental sustainability, and empowerment. Inclusive development is an adaptive learning process, which responds to change and new risks of exclusion and marginalization.”[5] (p. 546)
“growth that not only creates new economic opportunities, but also one that ensures equal access to the opportunities created for all segments of society, particularly for the poor.”[22] (p. 12)
2.2. Grey Literature
2.3. Main Insights from the Literature Review and Research Questions
3. Materials and Methods
- Investment block, including investments in fixed assets, foreign direct investment in the region, research and development costs, education costs, and environmental costs.
- Accumulated funds—fixed assets in the economy, less depreciation.
- Environmental block. Since the block of environmental indicators is still poorly developed in Russian statistics, the performance indicators of two industries were chosen to assess adjustment for the environmental component: extractive production and pollution elimination. It is obvious that the shipment volume by the ‘Extractive production’ type of business is fundamentally a valuation of minerals extracted in the region, that is, it can be regarded as the volume of natural resource depletion. The shipment volume by the ‘Water supply, water disposal, waste collection and disposal and pollution elimination activities’ type of business represents the amount of funds spent on managing the pollution disposal process; it can be an indirect indicator of the damage caused to the environment.
4. Results
5. Discussion and Conclusions
Author Contributions
Funding
Informed Consent Statement
Data Availability Statement
Conflicts of Interest
References
- WEF. The Inclusive Development Index 2018 Summary and Data Highlights, Report. 2018, p. 14. Available online: http://reports.weforum.org/the-inclusive-development-index-2018/files/2018/10/2018-Inclusive-Development-Index-FULL.pdf (accessed on 22 July 2020).
- Stiglitz, J.E.; Fitoussi, J.-P.; Durand, M. Beyond GDP; OECD: Paris, France, 2018. [Google Scholar]
- Kubiszewski, I.; Costanza, R.; Franco, C.; Lawn, P.; Talberth, J.; Jackson, T.; Aylmer, C. Beyond GDP: Measuring and achieving global genuine progress. Ecol. Econ. 2013, 93, 57–68. [Google Scholar] [CrossRef]
- Coscieme, L.; Mortensen, L.F.; Anderson, S.; Ward, J.; Donohue, I.; Sutton, P.C. Going beyond Gross Domestic Product as an indicator to bring coherence to the Sustainable Development Goals. J. Clean. Prod. 2020, 248, 119232. [Google Scholar] [CrossRef]
- Gupta, J.; Pouw, N.R.M.; Ros-Tonen, M.A.F. Towards an elaborated theory of inclusive development. Eur. J. Dev. Res. 2015, 27, 541–559. [Google Scholar] [CrossRef]
- van Gent, S. Beyond Buzzwords: What Is “Inclusive Development”? Synthesis Report. INCLUDE–Knowledge Platform on Inclusive Development Policies. August 2017. Available online: https://includeplatform.net/wp-content/uploads/2017/09/Beyond-buzzwords.pdf (accessed on 22 July 2020).
- Commission on Growth and Development. The Growth Report: Strategies for Sustained Growth and Inclusive Development; World Bank: Washington, DC, USA, 2008; Available online: http://hdl.handle.net/10986/6507 (accessed on 22 July 2020).
- World Bank. Inclusive Green Growth; World Bank: Washington, DC, USA, 2012. [Google Scholar] [CrossRef]
- Scottish Government. Scotland’s Economic Strategy; The Scottish Government: Edinburgh, UK, 2015.
- Samans, R.; Blanke, J.; Corrigan, G.; Drzeniek, M. The Inclusive Growth and Development Report; World Econ. Forum, World Economic Forum: Geneva, Switzerland, 2017; Available online: http://www3.weforum.org/docs/Media/WEF_Inclusive_Growth.pdf (accessed on 23 July 2020).
- Skhvediani, A.; Kudryavtseva, T. The Socioeconomic Development of Russia: Some Historical Aspects. Eur. Res. Stud. J. 2018, XXI, 195–207. [Google Scholar] [CrossRef]
- Razinkina, E.; Pankova, L.; Trostinskaya, I.; Pozdeeva, E.; Evseeva, L.; Tanova, A. Student satisfaction as an element of education quality monitoring in innovative higher education institution. In Proceedings of the E3S Web of Conferences, Semarang, Indonesia, 15–16 August 2017; p. 03043. [Google Scholar]
- Khadra, J.B.; Goncharova, N.L.; Radwan, Y. Regional aspects the small and medium enterprises and their impact on the social and economic development. In Proceedings of the 33rd International Business Information Management Association Conference, IBIMA 2019: Education Excellence and Innovation Management through Vision 2020, Granada, Spain, 10–11 April 2019. [Google Scholar]
- Gutman, S.; Rytova, E.; Kravchenko, V. System of regional indicators for sustainable development of the far North regions. In Proceedings of the 31st International Business Information Management Association Conference, IBIMA 2018: Innovation Management and Education Excellence through Vision 2020, Milan, Italy, 25–26 April 2018. [Google Scholar]
- Agnew, J. From the political economy of regions to regional political economy. Prog. Hum. Geogr. 2000, 24, 101–110. [Google Scholar] [CrossRef]
- Rodionov, D.G.; Kudryavtseva, T.J.; Skhvediani, A.E. Human development and income inequality as factors of regional economic growth. Eur. Res. Stud. J. 2018, 21, 323–337. [Google Scholar]
- Herrschel, T.; Newman, P. Cities as International Actors; Palgrave Macmillan: London, UK, 2017. [Google Scholar]
- UN-HABITAT. The New Urban Agenda; United Nations: New York, NY, USA, 2016; pp. 175–195.
- World Bank. Promoting Inclusive Growth by Creating Opportunities for the Urban Poor; World Bank: Washington, DC, USA, 2017. [Google Scholar]
- Lupton, R.; Rafferty, A.; Hughes, C. Inclusive Growth: Opportunities and Challenges for Greater Manchester. 2016. Available online: https://www.manchestercommunitycentral.org/sites/manchestercommunitycentral.co.uk/files/IGAUGreaterManchesterReport.pdf (accessed on 22 July 2020).
- Leeds City Council. Leeds Inclusive Growth Strategy; Leeds City Council: Leeds, UK, 2018.
- Badgaiyan, B. Measuring Inclusive Growth. SSRN Electron. J. 2011, 24. [Google Scholar] [CrossRef]
- Turok, I. Inclusive Growth. Handbook of Local and Regional Development; Routledge: London, UK, 2015; pp. 1–20. [Google Scholar] [CrossRef]
- Piketty, T. Capital in the 21st Century; Routledge: London, UK, 2018; pp. 43–48. [Google Scholar]
- Heshmati, A.; Kim, J.; Wood, J. A Survey of Inclusive Growth Policy. Economies 2019, 7, 65. [Google Scholar] [CrossRef]
- Zenkova, I.; Sarvari, R. Human capital in the system of inclusive economic growth. Vestn. PSU Part D Econ. Law Sci. 2019, 6, 14–17. [Google Scholar]
- Shelest, S.A. Problems in measuring inclusive economic growth in Russia and CIS countries. Russ. Trends Prospect. Dev. 2017, 12–1, 517–520. [Google Scholar]
- Ali, I.; Son, H.H. Defining and Measuring Inclusive Growth: Application to the Philippines; ERD Working Paper Series; The Asian Development Bank (ADB): Metro Manila, Philippines, 2007; pp. 1–44. [Google Scholar]
- Khan, A.; Khan, G.; Safdar, S.; Munir, S.; Andleeb, Z. Measurement and Determinants of Inclusive Growth: A Case Study of Pakistan (1990–2012). Pak. Dev. Rev. 2016, 55, 455–466. [Google Scholar] [CrossRef]
- Kacem, S.; Abid, L.; Ghorbel-Zouari, S. Measurement of inclusive growth: Evidence from Tunisia. Econ. Dev. 2019, 18, 19–33. [Google Scholar] [CrossRef]
- Oshota, S.O. Technology Access, Inclusive Growth and Poverty Reduction in Nigeria: Evidence from Error Correction Modeling Approach. Zagreb Int. Rev. Econ. Bus. 2019, 22, 1–21. [Google Scholar] [CrossRef]
- Neagu, O.; Teodoru, M.C. The Economic Competitiveness and Inclusive Development Nexus: Empirical Evidence from 101 Economies. Stud. Univ. Vasile Goldis Arad–Econ. Ser. 2018, 28, 1–19. [Google Scholar] [CrossRef]
- Neagu, O. Disparities regarding competitiveness, human capital and inclusive development in the EU: A cluster analysis. Analele Univ. Constantin Brâncuşi din Târgu Jiu Ser. Econ. 2019, 61–71. [Google Scholar]
- McKinley, T. Inclusive Growth Criteria and Indicators: An Inclusive Growth Index for Diagnosis of Country Progress; The Asian Development Bank Working Paper; The Asian Development Bank (ADB): Metro Manila, Philippines, 2010; pp. 1–34. [Google Scholar]
- Cichowicz, E.; Rollnik-Sadowska, E. Inclusive Growth in CEE Countries as a Determinant of Sustainable Development. Sustainability 2018, 10, 3973. [Google Scholar] [CrossRef]
- Sun, C.; Liu, L.; Tang, Y. Measuring the Inclusive Growth of China’s Coastal Regions. Sustainability 2018, 10, 2863. [Google Scholar] [CrossRef]
- Sun, Y.; Ding, W.; Yang, Z.; Yang, G.; Du, J. Measuring China’s regional inclusive green growth. Sci. Total Environ. 2020, 713, 136367. [Google Scholar] [CrossRef]
- Sharafutdinov, R.I.; Akhmetshin, E.M.; Polyakova, A.; Gerasimov, V.O.; Shpakova, R.; Mikhailova, M.V. Inclusive growth: A dataset on key and institutional foundations for inclusive development of Russian regions. Data Brief 2019, 23, 103864. [Google Scholar] [CrossRef]
- Sharafutdinov, R.I.; Izmailova, D.O.; Akhmetshin, E.M. Examination of the national key performance criteria of inclusive growth and regional development of the Russian Federation. Theor. Appl. Econ. 2018, 3, 118–134. [Google Scholar] [CrossRef]
- Sevastyanova, A.Y.; Tokarev, A.N.; Shmat, V.V. Peculiarities of Applying the Inclusive Development Concept for Resource Regions. Reg. Res. Russ. 2018, 8, 101–109. [Google Scholar] [CrossRef]
- Mikheeva, N. Qualitative aspect of the regional growth in Russia: Inclusive development index. Reg. Sci. Policy Pract. 2020, 12, 611–626. [Google Scholar] [CrossRef]
- OECD. All on Board; OECD: Paris, France, 2015. [Google Scholar]
- UNDP. Strategy for Inclusive and Sustainable Growth; United Nations: New York, NY, USA, 2017; pp. 1–147.
- European Commission. Europe 2020: Europe’s Growth Strategy; European Commission: Luxembourg, 2013. [Google Scholar] [CrossRef]
- Asian Development Bank. Asian Development Bank 2018 Annual Report; Asian Development Bank: Manila, Philippines, 2018. [Google Scholar]
- Rauniyar, G.; Kanbur, R. Inclusive growth and inclusive development: A review and synthesis of Asian Development Bank literature. J. Asia Pac. Econ. 2010, 15, 455–469. [Google Scholar] [CrossRef]
- Pacetti, E.G. The Five Characteristics of an Inclusive Economy: Getting Beyond the Equity-Growth Dichotomy, December 13, The Rockefeller Foundation. 2016. Available online: https://www.rockefellerfoundation.org/blog/five-characteristics-inclusive-economy-getting-beyond-equity-growth-dichotomy/ (accessed on 24 July 2020).
- Benner, C.; Pastor, M. Inclusive Economy Indicators–Framework & Indicator Recommendations. 2016. Available online: https://www.rockefellerfoundation.org/wp-content/uploads/Inclusive-Economies-Indicators-Full-Report-DEC6.pdf (accessed on 24 July 2020).
- World Economic Forum, The Future of Jobs Report 2018. 2018. Available online: http://www3.weforum.org/docs/WEF_Future_of_Jobs_2018.pdf (accessed on 22 July 2020).
- RSA, Inclusive Growth Commission: Making Our Economy Work for Everyone. 2017. Available online: https://www.thersa.org/discover/publications-and-articles/reports/final-report-of-the-inclusive-growth-commission (accessed on 25 July 2020).
- GMCA, Stronger Together Greater Manchester Strategy 2013. 2013. Available online: https://www.greatermanchester-ca.gov.uk/media/1683/gm_strategy_stronger_together.pdf (accessed on 23 July 2020).
- Rafferty, A.; Hughes, C.; Lupton, R. Inclusive Growth (IG) Monitor 2017: Local Enterprise Partnerships; Inclusive Growth Analysis Unit (IGAU), University of Manchester: Manchester, UK, 2017. [Google Scholar]
- Hawksworth, J.; Jones, N.C.; Ussher, K. Good Growth. 2011. Available online: https://www.pwc.co.uk/assets/pdf/pwc_good_growth.pdf (accessed on 25 July 2020).
- Uskova, T. Regional Sustainability Management; LitRes: Moscow, Russia, 2019. [Google Scholar]
- Bobylev, S.N.; Minakov, V.S.; Solovyov, S.V.; Tretyakov, V.V. Ecological-Economic Index of Russian Regions; WWF Russia, RIA Novosti: Moscow, Russia, 2012. [Google Scholar]
- Bekish, E.L. Net savings as an indicator of the sustainable development of various types of regions in Russia. Collect. Sci. Pap. SWorld 2011, 13, 91–96. [Google Scholar]
- Maschenko, S.O.; Chalaya, V.S.; Drigola, K. Green Housing: Regional Development Policy; Lambert AC: Los Angeles, CA, USA, 2018. [Google Scholar]
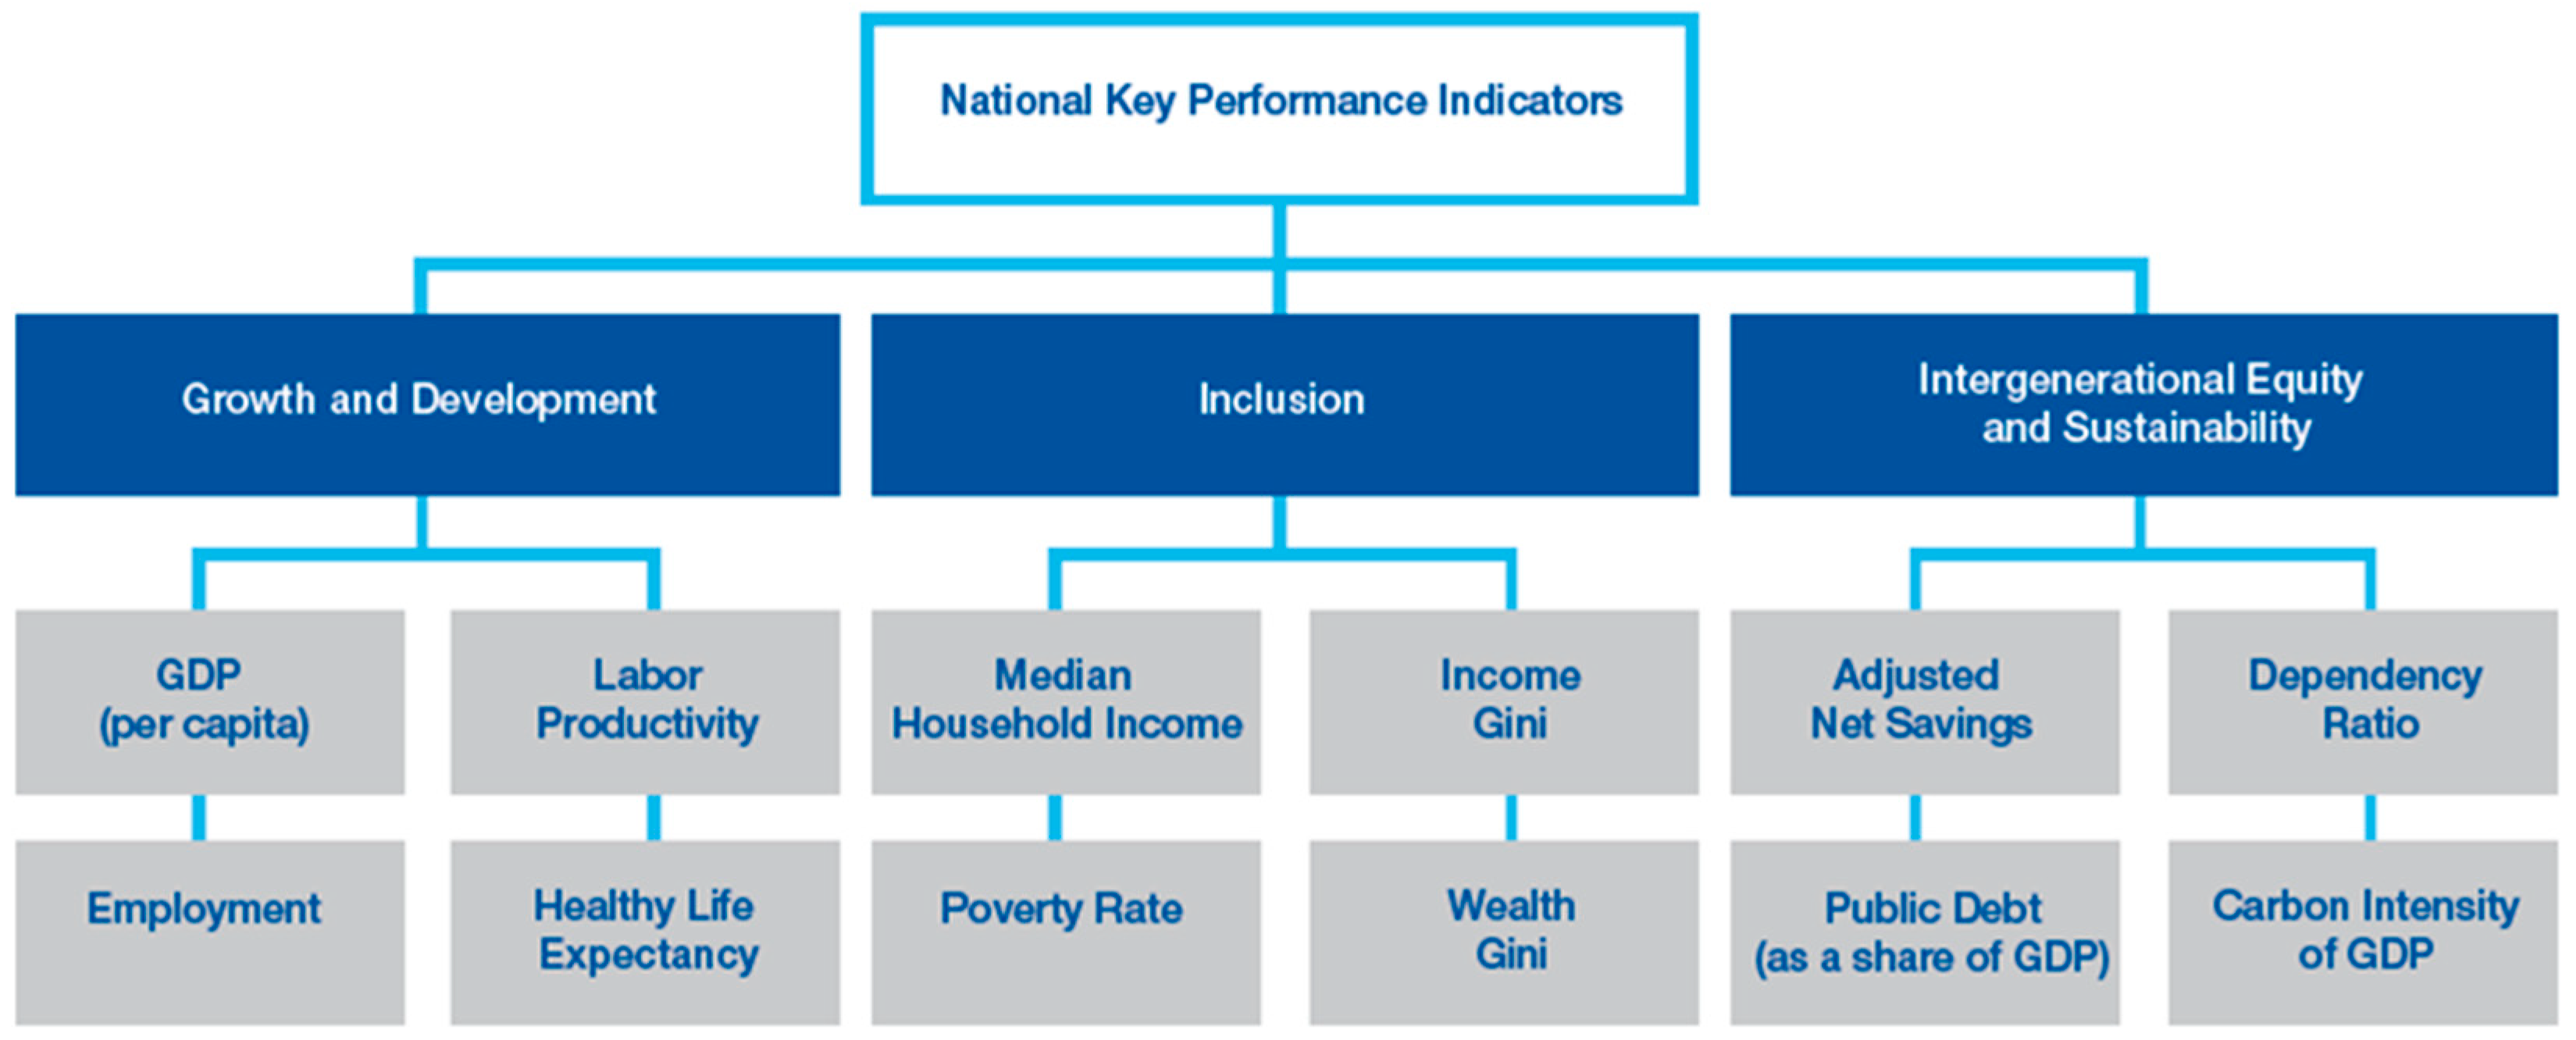
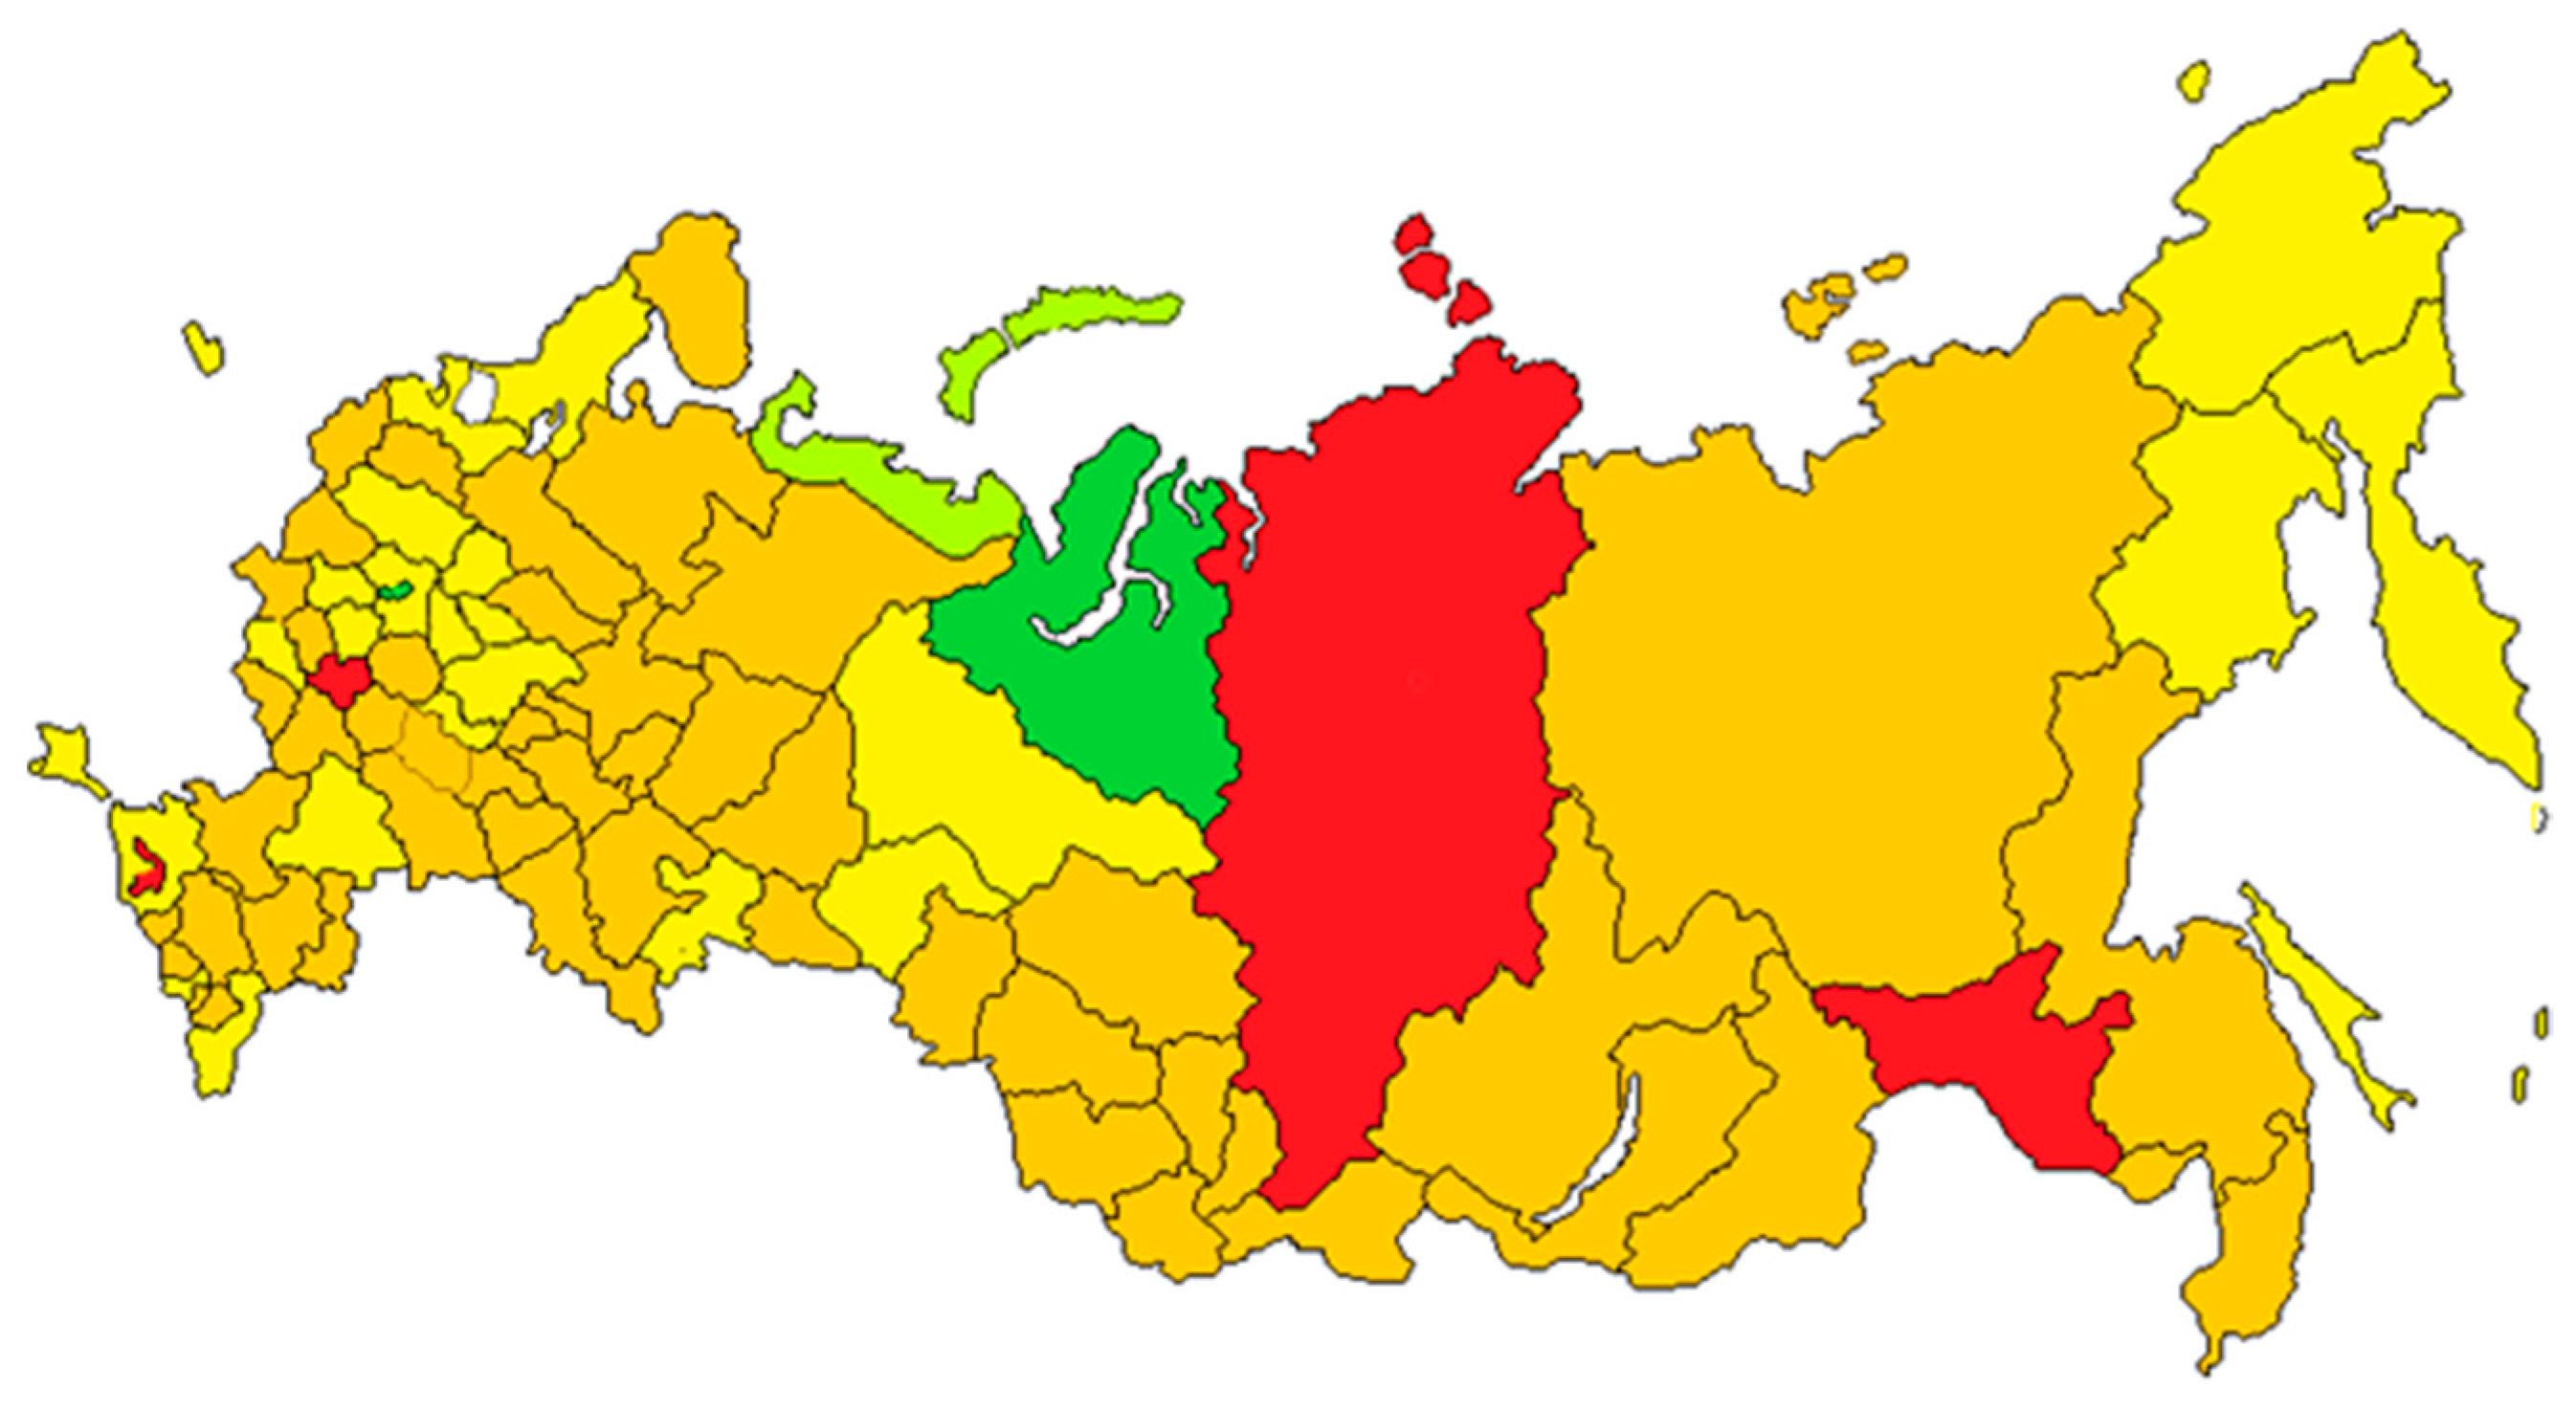
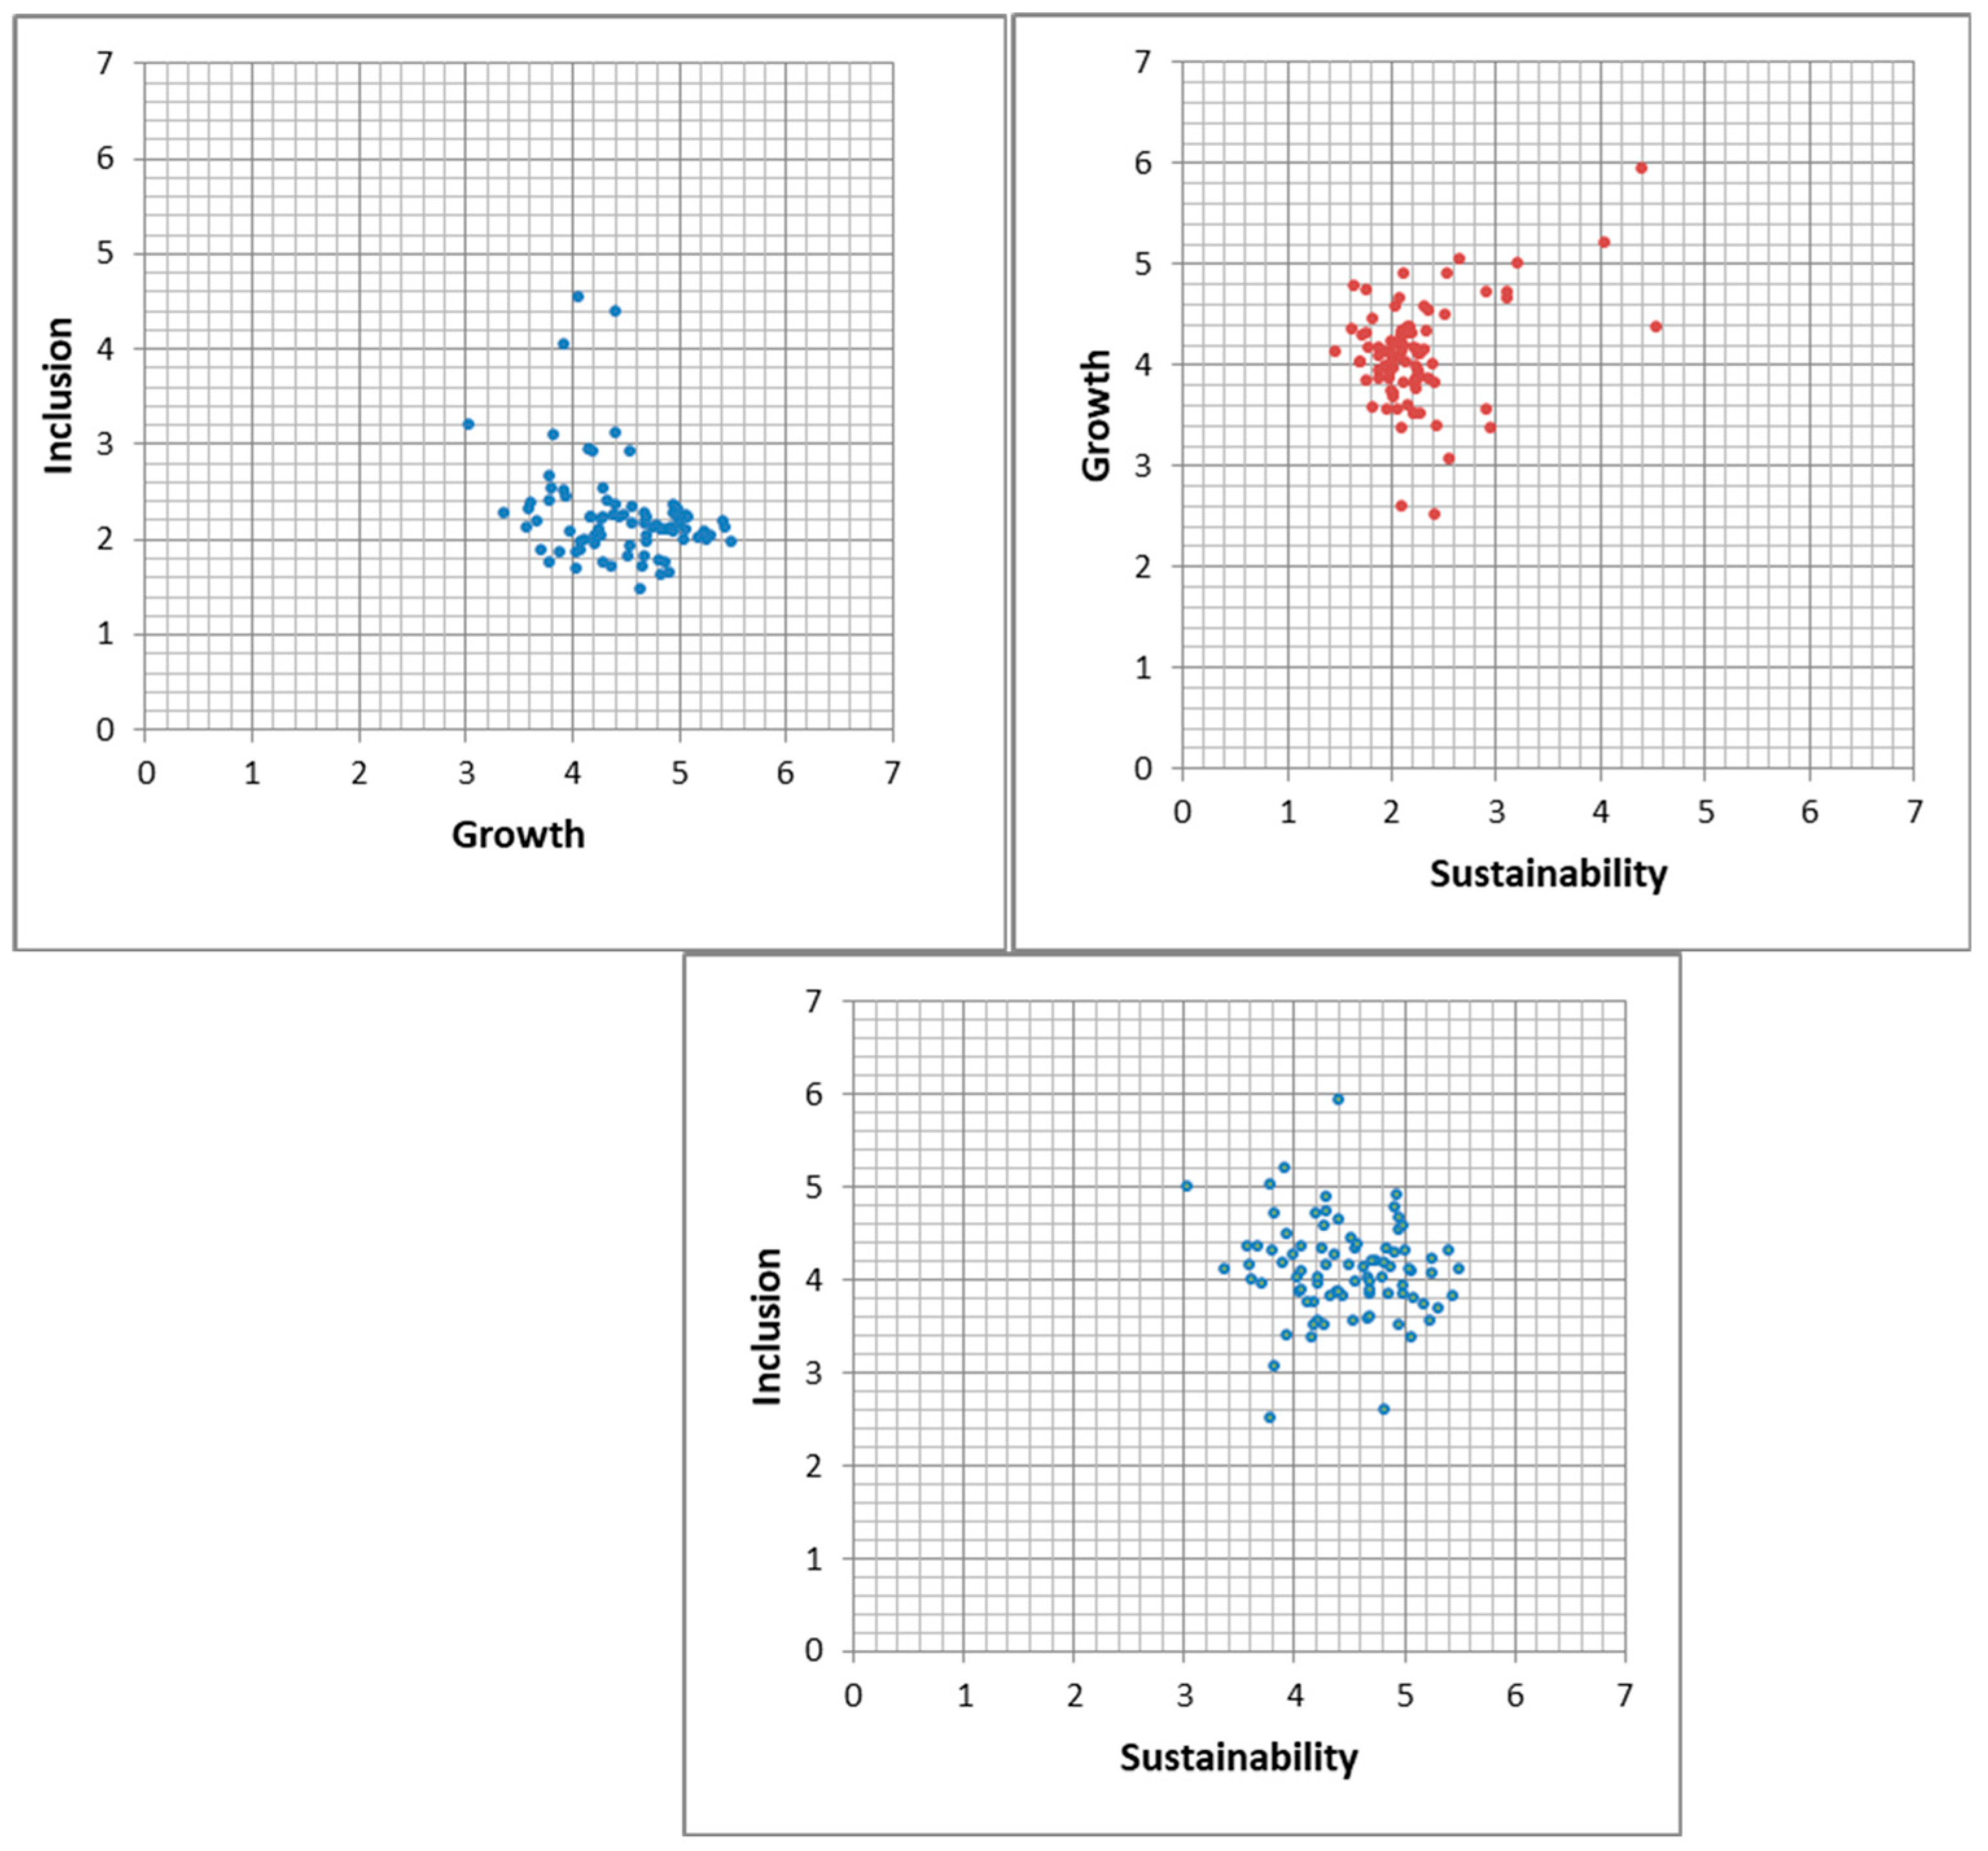
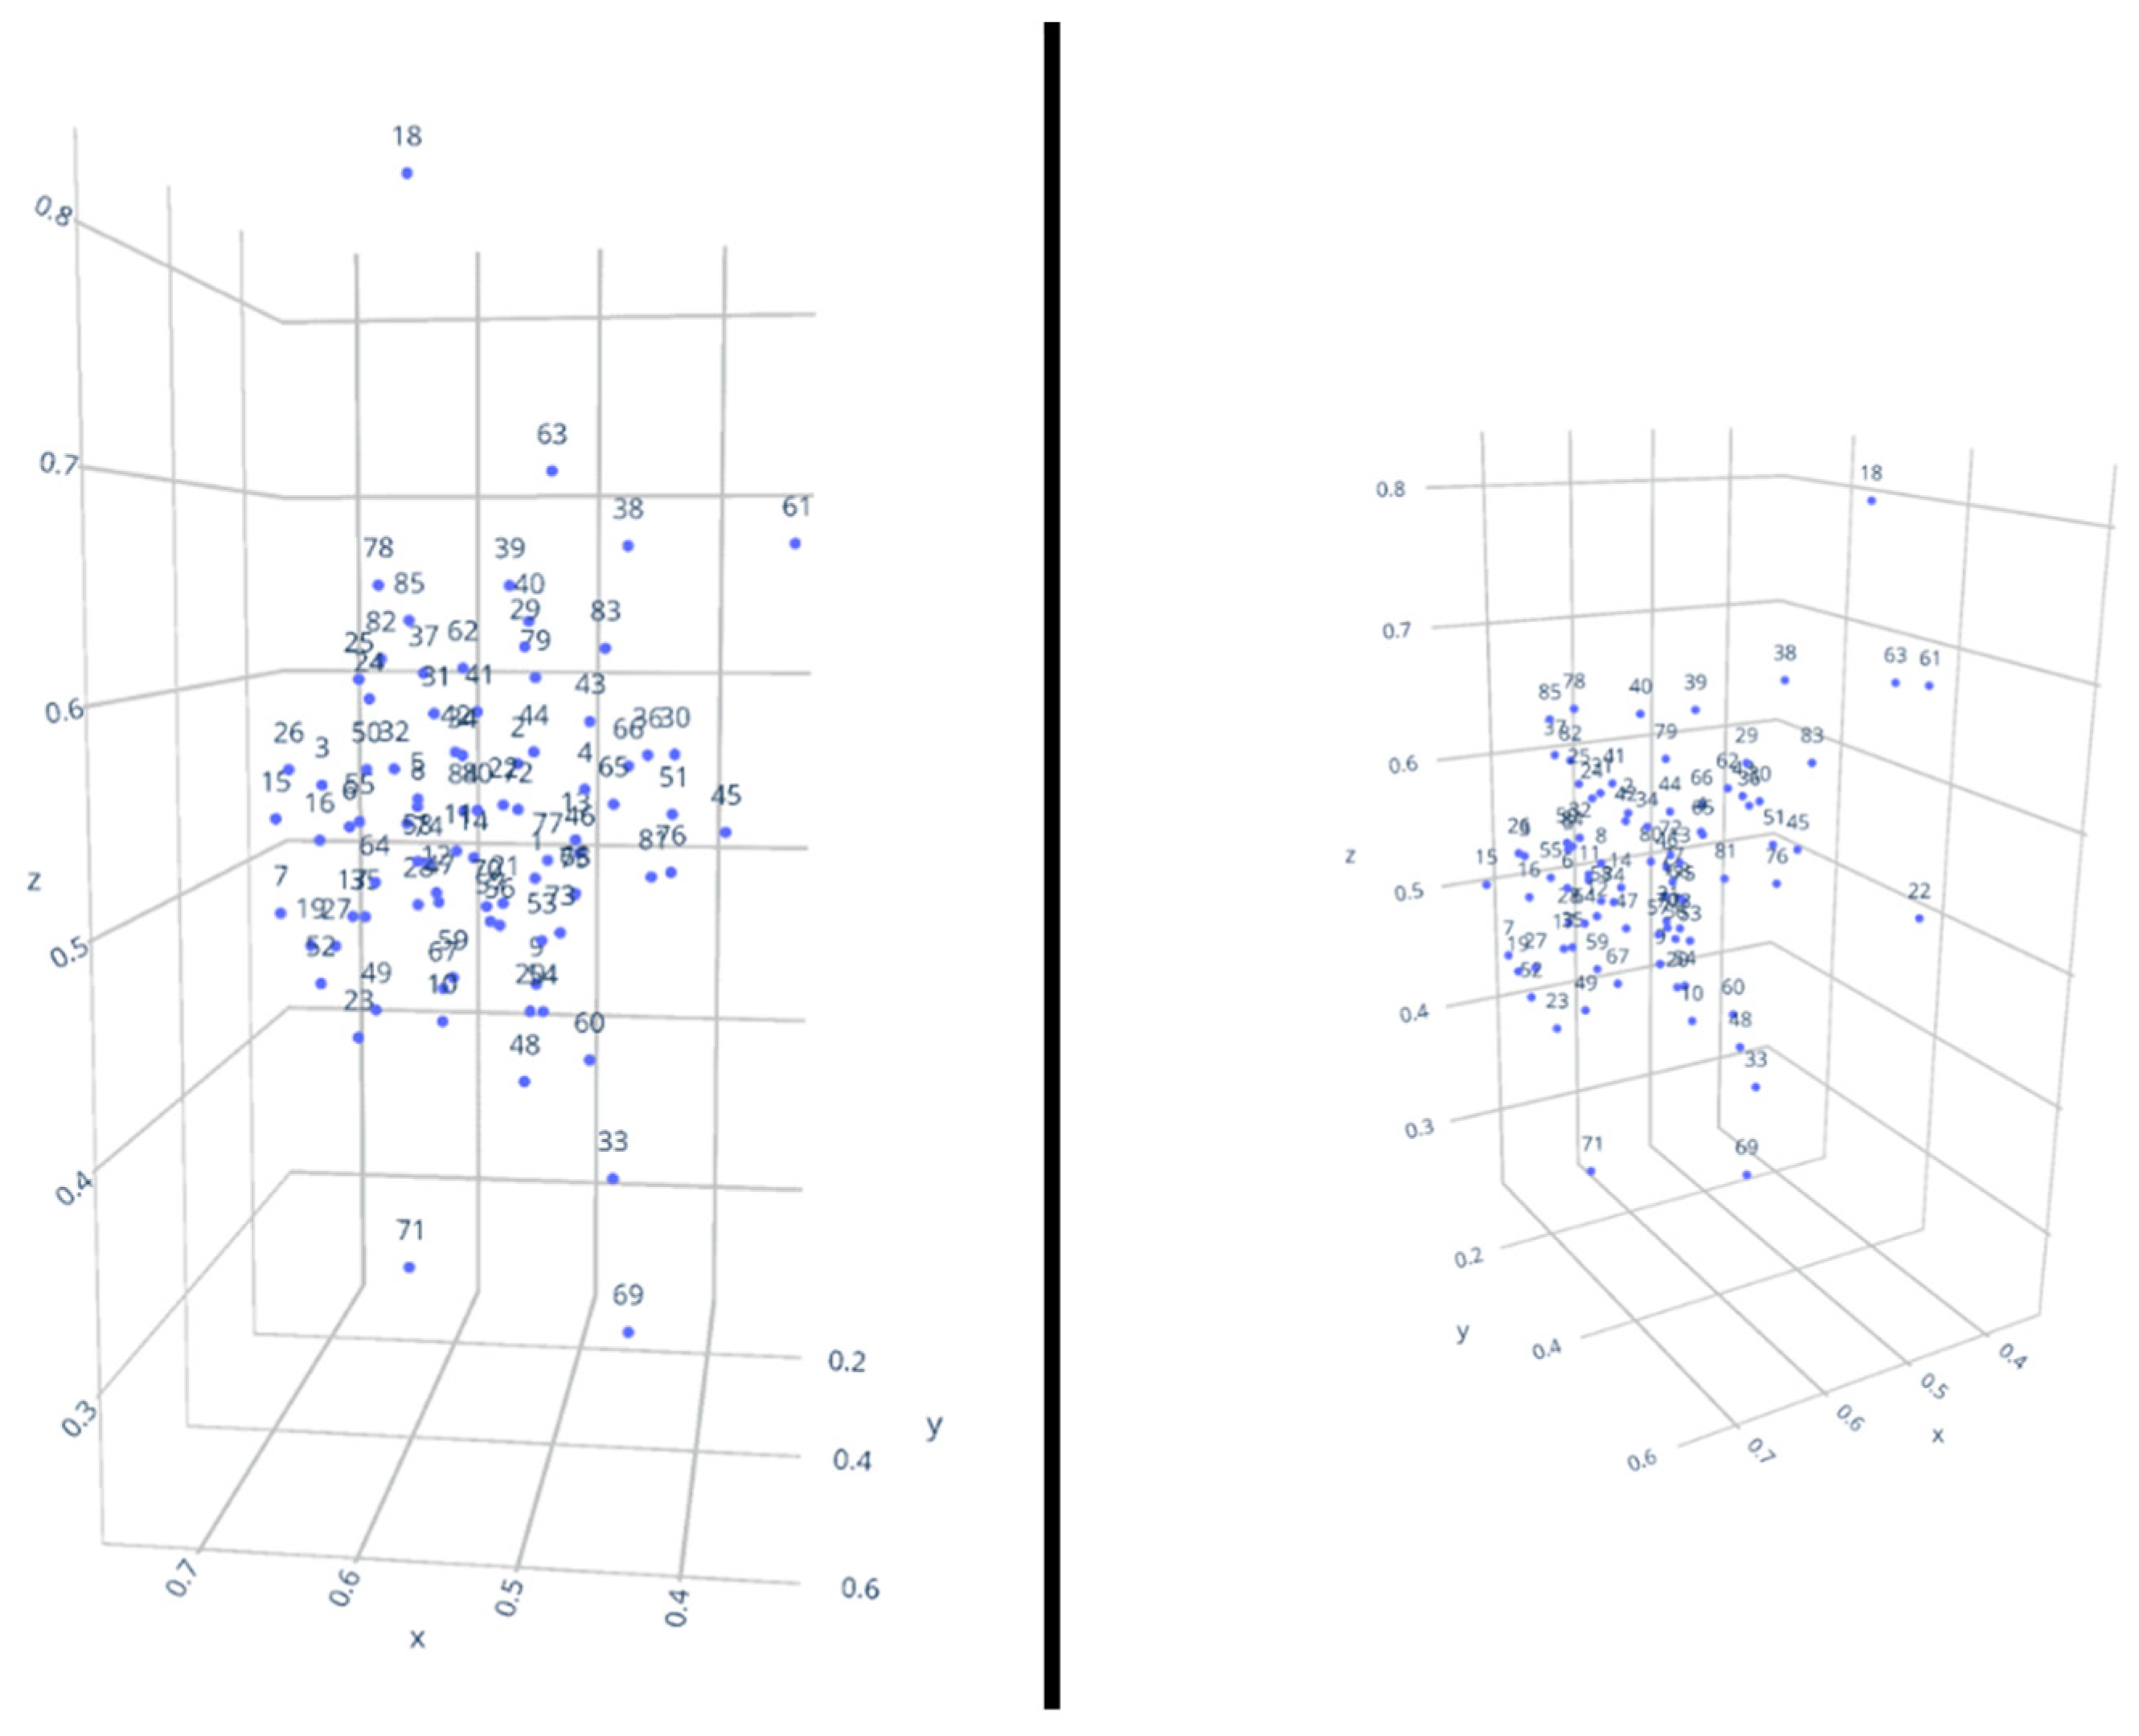
| WEF Indicators | Indicators for Russian Regions * |
|---|---|
| Growth and Development Indicators | |
| GDP per capita | Gross Regional Product (GRP) per capita, rubles |
| Labor productivity—GDP per employee | Productivity (calculated according to Rosstat as the ratio of GRP in millions of rubles to the average annual number of employed in the region in thousands of people) |
| Healthy life expectancy | Healthy life expectancy, years ** |
| Employment | Average annual number of employed, thousands of people |
| Inclusion Indicators | |
| Income stratification coefficient | Gini coefficient |
| Poverty rate | Poverty rate (share of the population with incomes below the subsistence level), % |
| Society distribution stratification coefficient | Funds coefficient, times |
| Median income | Median per capita income (Me) (rubles per month) |
| Intergenerational Equity and Sustainability Indicators | |
| Adjusted net savings | Data absent from regional statistics (calculation assumed) |
| Carbon intensity of GDP (kilograms of CO2 emissions per dollar) | Carbon intensity of GRP, tons per million rubles (calculated according to Rosstat as the ratio of the indicator ‘Air emissions from stationary sources, thousand tons’ to GRP in million rubles). Data on CO2 emissions absent from regional statistics |
| Public debt | Public debt volume, thousand rubles (according to the Ministry of Finance of the Russian Federation as of 1 January 2019) *** |
| Dependency ratio | Dependency ratio (non-productive people per 1000 people of working age) |
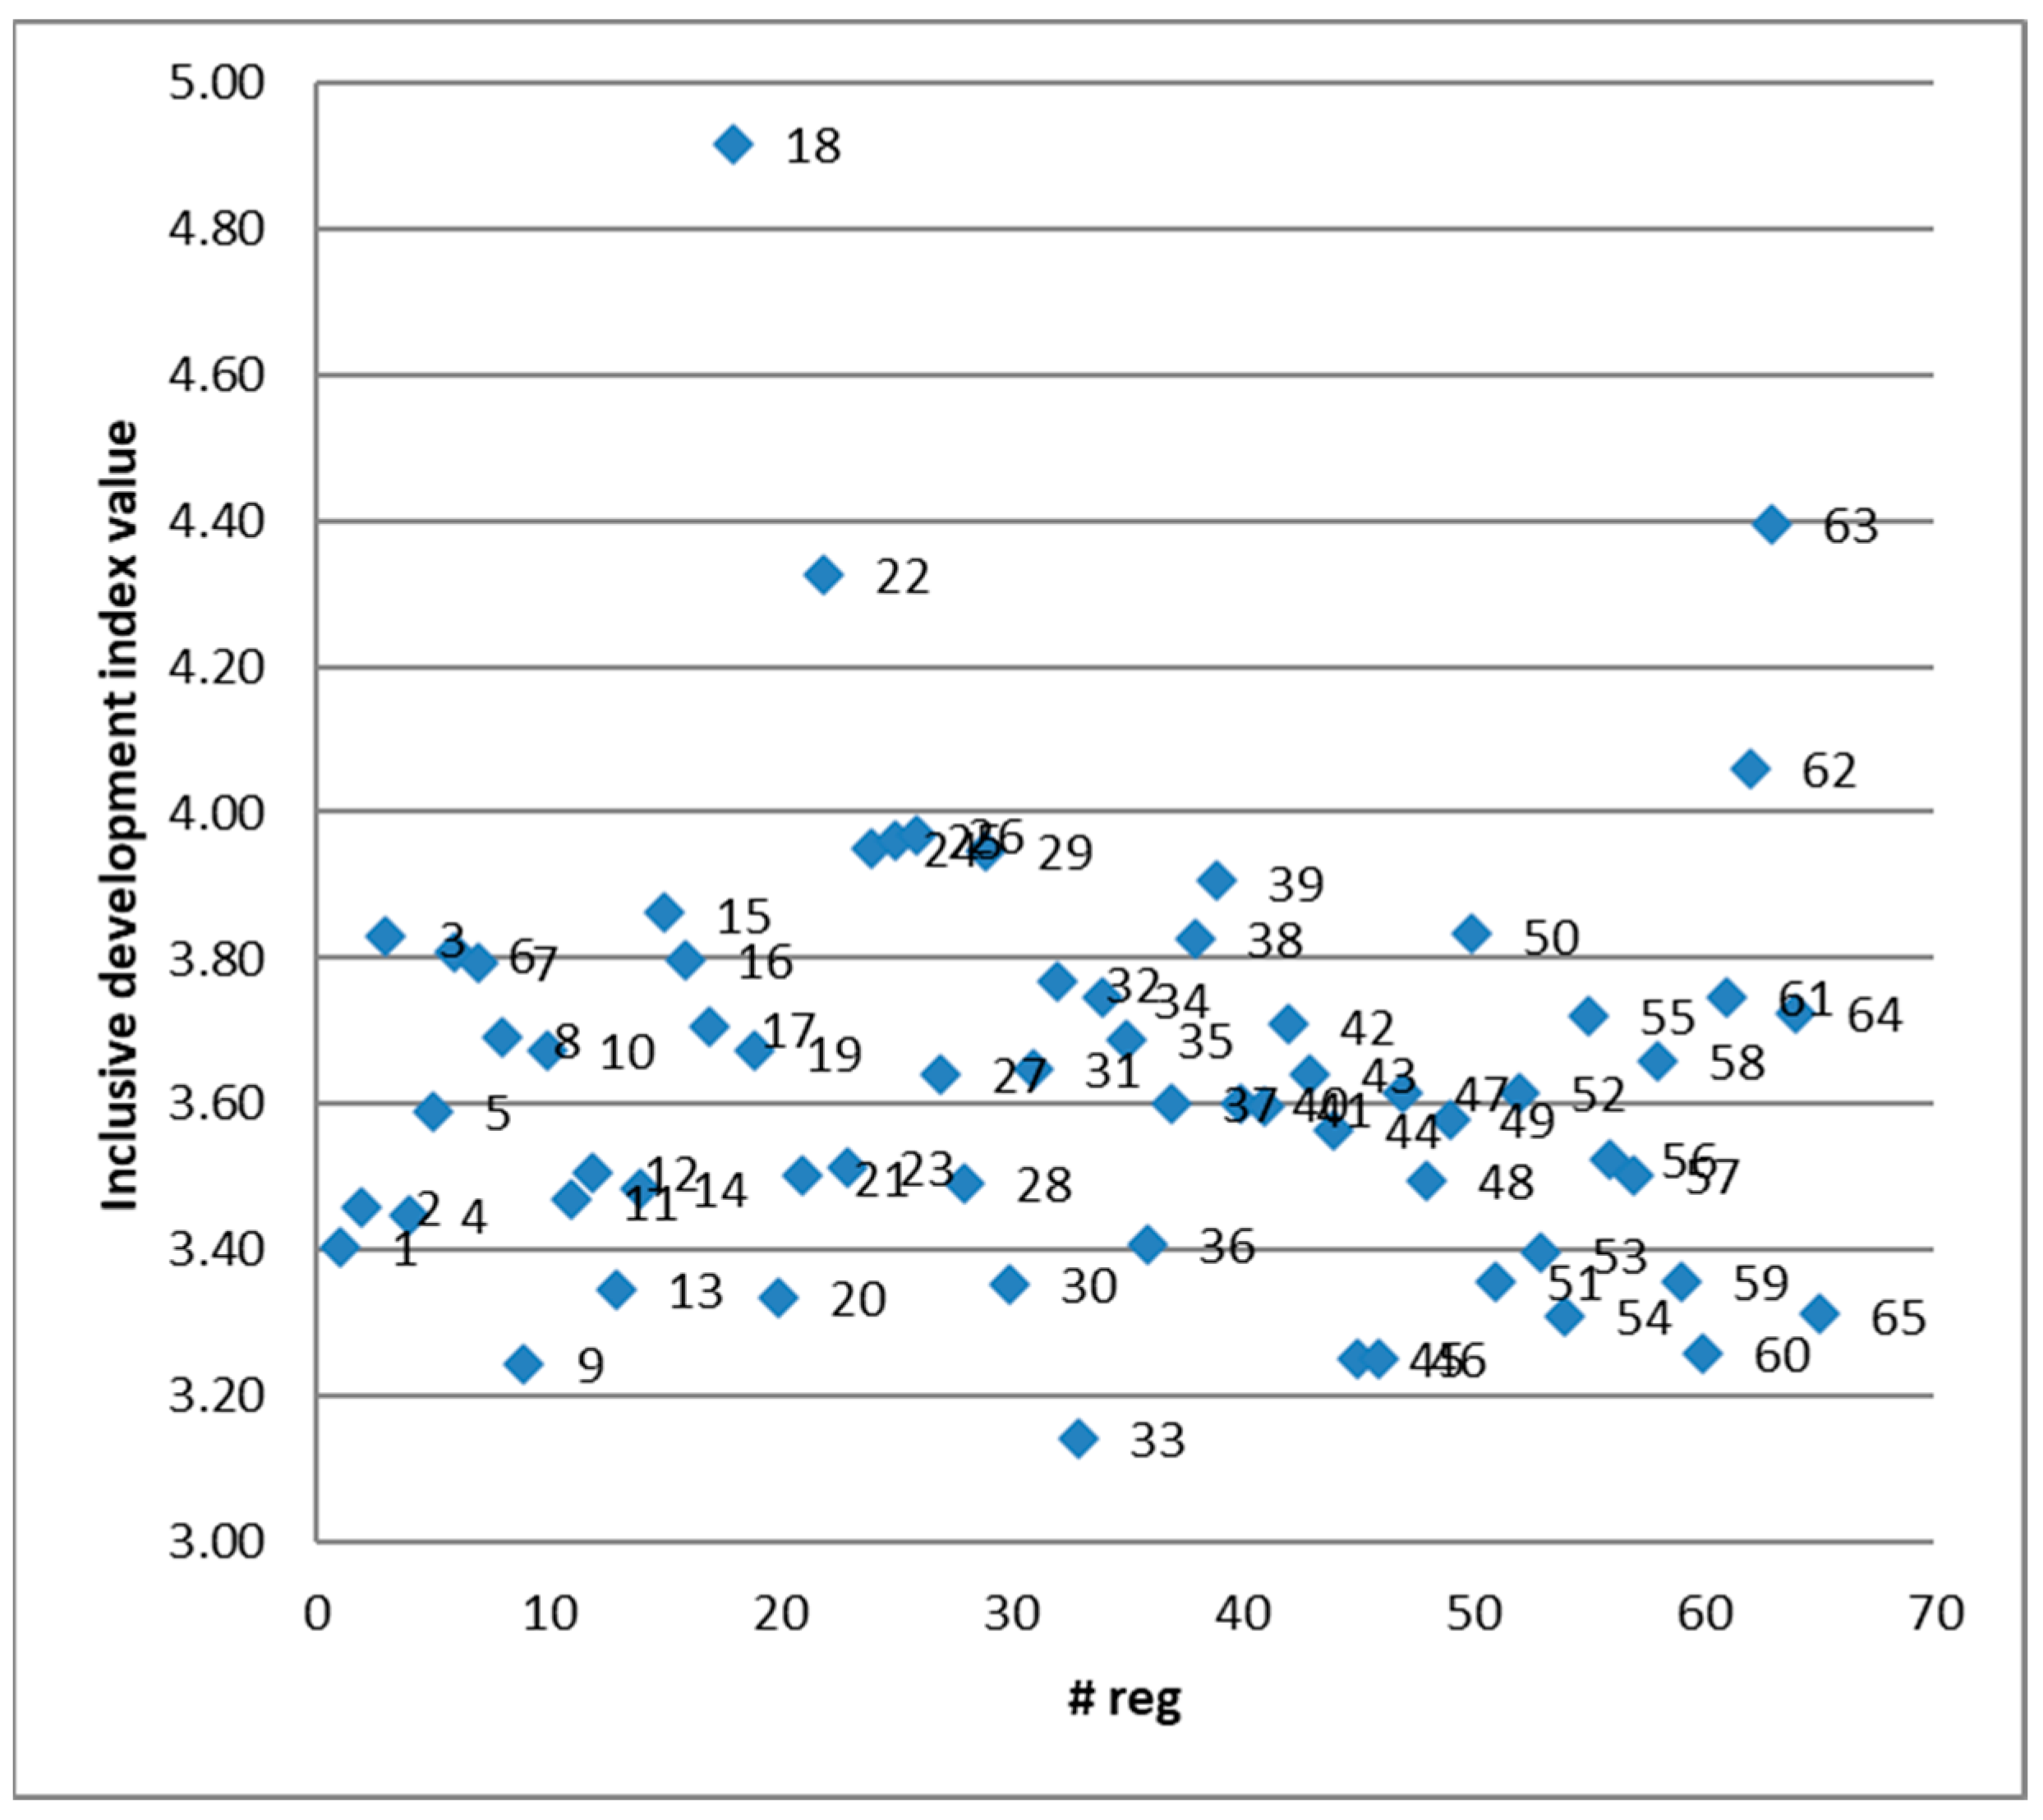
| # Reg * | Index Value | Ranking | For Reference: Quality of Life Ranking | For Reference: Regions Ranking by GRP | |
|---|---|---|---|---|---|
| Moscow City | 18 | 4.92 | 1 | 1 | 1 |
| Yamalo-Nenets Autonomous District | 63 | 4.40 | 2 | 12 | 6 |
| Nenets Autonomous District | 22 | 4.33 | 3 | 67 | 58 |
| Khanty-Mansi Autonomous District—Yugra | 62 | 4.06 | 4 | 8 | 3 |
| Kamchatka Territory | 78 | 3.99 | 5 | 32 | 63 |
| Murmansk Region | 26 | 3.97 | 6 | 36 | 43 |
| Leningrad Region | 25 | 3.96 | 7 | 11 | 21 |
| Kaliningrad Region | 24 | 3.95 | 8 | 10 | 45 |
| St. Petersburg City | 29 | 3.95 | 9 | 2 | 5 |
| Republic of Ingushetia | 39 | 3.91 | 10 | 82 | 84 |
| Magadan Region | 82 | 3.90 | 11 | 35 | 73 |
| Sakhalin Region | 83 | 3.88 | 12 | 46 | 20 |
| Tver Region | 15 | 3.86 | 13 | 59 | 46 |
| Republic of Chuvashia | 50 | 3.83 | 14 | 47 | 60 |
| Vladimir Region | 3 | 3.83 | 15 | 34 | 47 |
| Republic of Dagestan | 38 | 3.83 | 16 | 69 | 36 |
| Kaluga Region | 6 | 3.81 | 17 | 21 | 44 |
| Tula Region | 16 | 3.80 | 18 | 17 | 34 |
| Kostroma Region | 7 | 3.79 | 19 | 60 | 71 |
| Chukotka Autonomous District | 85 | 3.78 | 20 | 70 | 79 |
| Republic of Crimea | 32 | 3.77 | 21 | 52 | 50 |
| Tyumen Region | 61 | 3.75 | 22 | 14 | 2 |
| Astrakhan Region | 34 | 3.75 | 23 | 56 | 41 |
| Chelyabinsk Region | 64 | 3.73 | 24 | 23 | 13 |
| Penza Region | 55 | 3.72 | 25 | 30 | 49 |
| Republic of North Ossetia-Alania | 42 | 3.71 | 26 | 65 | 76 |
| Yaroslavl Region | 17 | 3.71 | 27 | 27 | 40 |
| Kursk Region | 8 | 3.69 | 28 | 15 | 48 |
| Volgograd Region | 35 | 3.69 | 29 | 37 | 26 |
| Moscow Region | 10 | 3.67 | 30 | 3 | 4 |
| Republic of Karelia | 19 | 3.67 | 31 | 74 | 61 |
| Ulyanovsk Region | 58 | 3.66 | 32 | 28 | 52 |
| Republic of Kalmykia | 31 | 3.65 | 33 | 81 | 81 |
| Republic of Chechnya | 43 | 3.64 | 34 | 71 | 70 |
| Novgorod Region | 27 | 3.64 | 35 | 61 | 62 |
| Tomsk Region | 74 | 3.64 | 36 | 51 | 39 |
| Khabarovsk Region | 80 | 3.63 | 37 | 29 | 31 |
| Primorsky Region | 79 | 3.62 | 38 | 50 | 27 |
| Republic of Mordovia | 47 | 3.62 | 39 | 44 | 66 |
| Kirov Region | 52 | 3.62 | 40 | 63 | 53 |
| Republic of Kabardino-Balkaria | 40 | 3.60 | 41 | 76 | 75 |
| Sevastopol City | 37 | 3.60 | 42 | 20 | 78 |
| Republic of Karachay-Cherkessia | 41 | 3.60 | 43 | 84 | 80 |
| Ivanovo Region | 5 | 3.59 | 44 | 48 | 69 |
| Republic of Udmurtia | 49 | 3.58 | 45 | 35 | |
| Stavropol Region | 44 | 3.56 | 46 | 22 | 29 |
| Novosibirsk Region | 72 | 3.56 | 47 | 24 | 18 |
| Irkutsk Region | 70 | 3.54 | 48 | 68 | 15 |
| Samara Region | 56 | 3.53 | 49 | 18 | 12 |
| Vologda Region | 23 | 3.51 | 50 | 62 | 37 |
| Ryazan Region | 12 | 3.51 | 51 | 26 | 51 |
| Saratov Region | 57 | 3.50 | 52 | 38 | 30 |
| Arkhangelsk Region | 21 | 3.50 | 53 | 75 | 28 |
| Republic of Tatarstan | 48 | 3.50 | 54 | 4 | 7 |
| Pskov Region | 28 | 3.49 | 55 | 58 | 74 |
| Tambov Region | 14 | 3.49 | 56 | 40 | 54 |
| Republic of Khakassia | 67 | 3.48 | 57 | 55 | 64 |
| Orel Region | 11 | 3.47 | 58 | 41 | 65 |
| Bryansk Region | 2 | 3.46 | 59 | 49 | 55 |
| Voronezh Region | 4 | 3.45 | 60 | 7 | 24 |
| Jewish Autonomous Region | 84 | 3.41 | 61 | 78 | 83 |
| Baikal Region | 77 | 3.41 | 62 | 83 | 56 |
| Rostov Region | 36 | 3.41 | 63 | 19 | 14 |
| Belgorod Region | 1 | 3.41 | 64 | 5 | 25 |
| Nizhny Novgorod Region | 53 | 3.40 | 65 | 16 | 16 |
| Perm Region | 51 | 3.36 | 66 | 42 | 17 |
| Kurgan Region | 59 | 3.36 | 67 | 79 | 68 |
| Republic of Adygea | 30 | 3.35 | 68 | 31 | 77 |
| Smolensk Region | 13 | 3.35 | 69 | 39 | 57 |
| Republic of Sakha (Yakutia) | 76 | 3.34 | 70 | 72 | 22 |
| Republic of Komi | 20 | 3.33 | 71 | 64 | 33 |
| Republic of Buryatia | 75 | 3.32 | 72 | 77 | 67 |
| Republic of Altai | 65 | 3.31 | 73 | 80 | 85 |
| Orenburg Region | 54 | 3.31 | 74 | 33 | 23 |
| Omsk Region | 73 | 3.29 | 75 | 57 | 32 |
| Republic of Tuva | 66 | 3.29 | 76 | 85 | 82 |
| Altai Territory | 68 | 3.26 | 77 | 73 | 42 |
| Sverdlovsk Region | 60 | 3.26 | 78 | 13 | 10 |
| Republic of Mari El | 46 | 3.25 | 79 | 66 | 72 |
| Republic of Bashkortostan | 45 | 3.25 | 80 | 25 | 11 |
| Lipetsk Region | 9 | 3.24 | 81 | 9 | 38 |
| Amur Region | 81 | 3.18 | 82 | 53 | 59 |
| Kemerovo Region | 71 | 3.18 | 83 | 54 | 19 |
| Krasnodar Territory | 33 | 3.14 | 84 | 6 | 8 |
| Krasnoyarsk Territory | 69 | 2.90 | 85 | 45 | 9 |
Publisher’s Note: MDPI stays neutral with regard to jurisdictional claims in published maps and institutional affiliations. |
© 2021 by the authors. Licensee MDPI, Basel, Switzerland. This article is an open access article distributed under the terms and conditions of the Creative Commons Attribution (CC BY) license (https://creativecommons.org/licenses/by/4.0/).
Share and Cite
Rytova, E.; Gutman, S.; Sousa, C. Regional Inclusive Development: An Assessment of Russian Regions. Sustainability 2021, 13, 5773. https://doi.org/10.3390/su13115773
Rytova E, Gutman S, Sousa C. Regional Inclusive Development: An Assessment of Russian Regions. Sustainability. 2021; 13(11):5773. https://doi.org/10.3390/su13115773
Chicago/Turabian StyleRytova, Elena, Svetlana Gutman, and Cristina Sousa. 2021. "Regional Inclusive Development: An Assessment of Russian Regions" Sustainability 13, no. 11: 5773. https://doi.org/10.3390/su13115773
APA StyleRytova, E., Gutman, S., & Sousa, C. (2021). Regional Inclusive Development: An Assessment of Russian Regions. Sustainability, 13(11), 5773. https://doi.org/10.3390/su13115773


