Abstract
One way to reduce healthcare costs is to target the high spenders who remain persistently high in cost over time. Using claims data from China between 2010 to 2014, we sought to identify the level of concentration in spending and the proportion of spenders whose costs remain high over five years. Using a transition matrix and a linear regression strategy, we find that the top 10% of the spenders account for more than 50% of total expenditures. Of the individuals who were in the top 10% in 2010, 33.6% remained in the top 10% one year later and 23.6% were still in that category even four years later. Past spending plays a major role in the dynamic of health spending. A 10% increase in expenditure is associated with an increase of 0.36% to 1.33% of spending in the future. Persistence has some heterogeneity in terms of age, gender, and income level. Many diseases have strong predictive power for future spending. Research on the concentration and persistence of health expenditures will inform policymakers in terms of controlling costs and providing protection for catastrophic spending.
1. Introduction
Health care spending is increasing rapidly in both developed and developing countries [1,2]. Controlling health expenditure as well as promoting population health is becoming a great concern around the world [3].
One area that has received particular attention has been the focus on high-cost patients, who account for a disproportionate amount of spending and have significant health needs [3,4]. There is a robust set of research from developed countries and regions that suggests that a small percentage of the population accounts for a large share of total healthcare expenditures [5,6], and these patients have high spending persistently over time [7,8,9,10]. However, as far as we know, the time interval for most of these studies is short and the information revealed about the trend of concentration and persistence over time is limited. In addition, the studies on the concentration and persistence of health spending are mostly about developed countries and regions, such as the United States, Britain, and France. There is little research about developing countries due to a lack of long-term administrative and survey data. Results from developing countries such as China may be different given differences in disease profiles, stage of population aging, and medical system [11].
To fill the literature gap, in this paper we investigate the concentration and dynamic of health spending in China using a unique individual-level claim dataset with a 5-year observation period. Using a transition matrix and a linear regression strategy, we reach three conclusions. First, we find that the top 10% of spenders account for more than 50% of total expenditures. The top 50% consume more than 90% of medical resources. Of the individuals who were in the top 10% in 2010, 33.6% remained in the top 10% one year later. The probability declined gradually thereafter, but 23.6% of the top spenders in 2010 were still in the same category four years later. Past spending plays a major role in the dynamic of health spending, and is dependent on age, gender, conditions (health), and other characteristics. A 10% increase in expenditure is associated with an increase of 0.36% to 1.33% in spending in the future.
Second, the most expensive 10% of health care users tend to be older, male, urban residents, and seeking care in secondary and tertiary health institutions. Diagnoses of the top 10% of spenders are concentrated among neoplasms, diseases of the circulatory system, diseases of the digestive system, diseases of the genitourinary system, neurodevelopmental disorders and injury, poisoning, and other consequences of external causes. Among them, malignant neoplasms and digestive system, cerebrovascular, hypertensive, and ischemic heart diseases play a major role. These findings support disease management for conditions that are strong predictors of future high spending.
Third, persistence has some heterogeneity in terms of age, gender, and income level. The spending persistence trend is weaker among people older than 65 than among younger people ranging from 18 to 44, even after controlling for diagnoses. This may be because the elderly enjoys less health investment than younger people in China, especially in rural areas. Compared with higher income patients, the financially constrained group experiences stronger expenditure persistence.
Our research makes several contributions to the literature. First, this is the first research studying the concentration of health expenditure based on claim-level data in one metropolitan region of China. Existing studies on the concentration of health care expenditures are mainly about developed countries. They show that the distribution of spending is highly right-skewed, and a small group of people account for a large share of total expenditures. For example, the top 5% of spenders accounted for around 50% of total health care expenditures in the United States from 1996 to 2012 [4,5,6,12,13,14]. In Taiwan, the top 10%, on average, accounted for 55% of total National Health Insurance expenditures between 2005 and 2009 [9]. Gastaldi-Ménager et al. [10] found that the top 10% of spenders in France consumed about 59% and 62% of total health resources in 2008 and 2013, respectively. In China, Peng and Du [11] studied health spending concentration in one county of China and found that the top 10% of spenders accounted for about 50% of total expenditures. However, the data they used were at the NCMS claim level and thus the population covered was rural residents. We extend their research by using claim-level data from a metropolitan area covering both rural and urban citizens. We find the top 10% of the spenders utilize more than 50% of health resources.
Second, it contributes to the research on the persistence of health expenditure based on claim-level data in one metropolitan area of China. Existing studies on the persistence of health care expenditures are mainly on developed countries. They have proved that expenditures, especially high expenditures, persist from one year to the next over a long-term period. Hirth et al. [8] show that for the under-65 population of the United States, of those in the top 10% in 2003, 34.4% remained in the top 10% five years later. Kohn and Liu [15] found that past use of health services is significantly predictive for future use in Britain. Ku et al. [9] proved that of the top 10% of health care users in Taiwan in 2005, 39% remained in this category one year later between 2005 and 2009. Gastaldi-Ménager et al. [10] found that, of the top 10% of spenders in France in 2008, 48% were still in the top decile of spenders in 2009. Many other studies have reached a similar conclusion [7,14,16,17,18,19,20,21,22,23,24,25]
However, some research has concluded that health spending has no strong persistence characteristics, and the main reason is that high spenders are more likely to die and exit the reimbursement sample [26]. Research on health expenditure persistence in developing regions is rare, which may be due to a lack of long-term administrative and survey data. Xu et al. [27] studied health expenditure persistence using claim-level data of the UEBMI from one city in China. However, the data span they use is too short (only three years) and the information revealed about health expenditure is thus limited.
As far as we know, our research is the first study on the concentration and persistence of health care expenditures of both rural and urban citizens in China based on long-term unique administrative data in one metropolitan region. In this paper we carry out two further activities. First, we utilize various statistical methods, including a transition matrix, to tackle the high-skewed distribution of health spending. Second, we incorporate four lags of expenditures as regressors into the regression model to identify the effect of past spending on future spending, conditional on other covariates. Kohn and Liu [15] prove that past use should be incorporated into econometric models of health care use. However, existing studies about spending persistence rarely have lags of expenditures as explanatory variables and some just take the first/base year spending as a regressor to predict future expenditures [8]. Long-term data are essential to study the concentration and persistence of health expenditure. By using long-term administrative data, we can identify the persistence characteristics of expenditures and predict future spending more precisely and convincingly. First, it will take a long time for some diseases (such as malignant neoplasms) to be cured, so short-term data may be misleading. Second, diseases that can be treated and cured transform with technology development. The persistence and concentration may thus change, and long-term data can reveal these kinds of aspects. Finally, long-term data can provide more precise information on resources of health costs.
2. Data
China has accomplished the goal of universal health coverage; more than 1.35 billion, or 98% of the Chinese people, have been covered by the public health insurance program (Chinese Health Statistics Yearbook, 2020). The Urban Employee Basic Medical Insurance (UEBMI) is for the urban employed population, the New Rural Cooperative Medical Insurance Scheme (NCMS) is for rural residents, and the Urban Resident Basic Medical Insurance (URBMI) targets urban residents without formal employment, especially the elderly and children. The NCMS and URBMI have been integrated since 2016 in most regions of China due to similar financing and reimbursement arrangements, as well as to promote efficiency.
In this paper, we use the inpatient claim-level data of the NCMS and URBMI from 2010 to 2014 in one metropolitan region, namely S city of China. The administrative data consist of information on health care utilization, expenditures, and patient demographics. Health care utilization data include dates of admission and discharge, diagnoses, and level of health care institutions. Expenditure data cover total expenditure, out-of-pocket expenditure, and drug and test spending. Patient information provides date of birth, gender, enrollment location, and income level. Like other administrative data, there is no record of education in our dataset.
From this dataset, we retain individuals aged 18 and older, and drop observations with negative expenditures, or those missing key variables (e.g., age, gender, and enrollment location). The sample is restricted to individuals with claims data in each year, but is not balanced over time since we do not have information about date of death. In this way, our research of persistence should be a lower bound in consideration of death, and concentration of spending is an average level for decedents and survivors. However, we will definitely improve our analysis in future research once we gain access to death information. Total annual health care expenditures for those recipients with more than one claim within one calendar year are calculated by summing all the expenditures within the year. This leads to a total of 779,785 individuals by yearly observations. The recorded reimbursements are in current RMB. We transform them into 2014 RMB using the rural residents’ medical cost Consumer Price Index of the province in which this city is located.
Several selected conditions are used to measure health status. Cancer, cardiac disease, and cerebrovascular disease were selected since they have been identified among the most expensive and fatal conditions in inpatient settings across China. Chronic renal disease, chronic pulmonary disease, chronic liver disease, mental disorders, and trauma were included given their high prevalence in the sample. Hypertension and diabetes were also selected because they are quite common chronic conditions. These conditions were identified by the inpatient diagnosis record with corresponding ICD-10-CM codes. We also have one dummy variable to indicate whether an individual was admitted more than once in the same calendar year.
3. Methods
3.1. Statistical Analysis
To describe the concentration of health spending, we divide beneficiaries of each year into different percentiles by total annual expenditures (including the top 1%, 5%, 10%, 20%, and 50%), and calculate each percentile’s cumulative percentage of the aggregate expenditures for each year. To analyze the persistence of high spending over time, we construct a transition matrix showing the probability that a recipient in the top 10% and top 20% of the expenditure distribution in 2010 remains in the top 10% and top 20% four years later. We also study the persistence of health spending by counting the number of admissions based on hospitalization records over five years.
3.2. Empirical Analysis
To provide more empirical evidence of the dynamic of health care expenditure and to predict the contribution of each variable to future spending, we run an ordinary least squares estimation by including the lag of expenditure as the independent variable. The regression model is as follows:
where dependent variable is the health expenditure of individual i in calendar year t. The key independent variables are the lag of health expenditure for each individual i over a certain number of calendar years. For example, includes , , , for calendar year 2014 for an individual who has four years of expenditure. The log values of all the expenditure variables are taken. Given that medical utilization is highly skewed, the log transformation helps in improving precision and reducing the effect of outliers [28].
is a vector of covariates which consists of the age and gender of individual i, the level of health care institutions, whether individual i has been hospitalized more than once within one calendar year, as well as diagnoses (including cancer, cardiac disease, cerebrovascular disease, chronic renal disease, chronic pulmonary disease, chronic liver disease, mental disorders, trauma, hypertension, and diabetes). is district fixed effect and denotes time fixed effect. is a random error term.
The parameter for the lag of health expenditure is our concern. It indicates the percent by which the current expenditure will increase once k year’s lag of spending increases by 1%.
4. Statistical Analysis
4.1. Concentration of Health Spending
Table 1 describes the minimum health care spending for recipients who are in the top 1%, 5%, 10%, 20%, and 50% of health care spenders in each year. For the top 1%, the minimum expenditure in 2014 is 85,150 RMB ($13,914). The minimum spending for each percentile increased with time, except for the top 1%.

Table 1.
Distribution of Expenditure by Year, 2010–2014.
Figure 1 shows the concentration of expenditures. The top 1% of users consume almost 20% of medical resources. The top 10% and 20% of spenders account for more than 50% and 70% of total expenditures, respectively. The top 50% account for more than 90% of total spending. As shown in Figure 2 and Figure 3, many other countries and regions share similar trends. For example, the top 1% and 10% of spenders in the United States accounted for more than 20% and 60% of overall health care expenditures, respectively [4,5,6,12,13,14]. In Taiwan the top 10% of users on average accounted for 55% of total National Health Insurance expenditures between 2005 and 2009 [9]. In France the top 10% of spenders in 2008 and 2013 consumed 59% and 62% of medical resources, respectively [10].
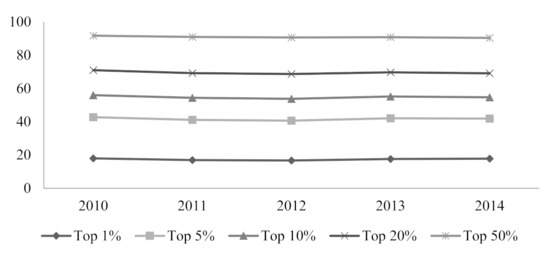
Figure 1.
Concentration of Health Spending in China. Source: Authors’ analysis of claims data for 2010–2014.
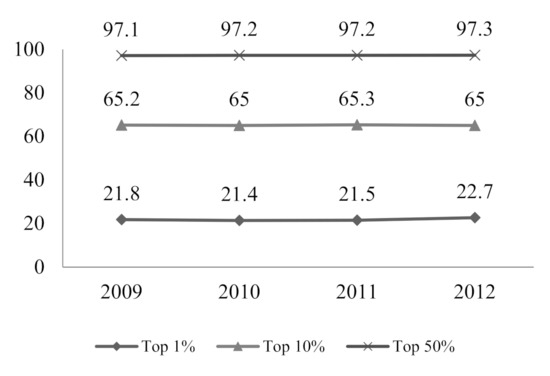
Figure 2.
Concentration of Health Spending in the U.S. source: Data is from Cohen [4,14]. Notes: All ratios are calculated based on inpatient spending.
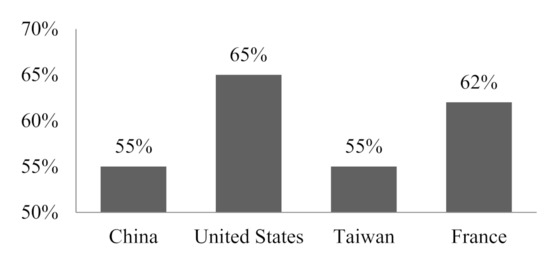
Figure 3.
Concentration of Health Spending for the Top 10% of Users in Different Countries and Regions. Source: Data for China is from the sample we used in this paper, and it is the average ratio during 2010–2014. Data for the United States is from Cohen [4,14] and it is averaged during 2005–2012. Data for France is from Gastaldi-Ménager et al. [10] and it is in 2013.
4.2. Demographic and Diagnoses Characteristics of High Spenders
Given the high concentration of health spending, identifying the characteristics of those high spenders is of great concern for managing their health care expenditures. Table 2 provides summary statistics for high spenders and the rest of the population. It shows that there are statistically significant differences between the top 10% and 20% of spenders and the rest of the population. The top 10% tend to be older, male, urban residents, and seeking care in secondary and tertiary health institutions. Moreover, high spenders are prone to having more serious and chronic conditions than the rest, except for hypertension and pulmonary diseases. We believe that the main reason for this is that the data we used are inpatient claim data, while many hypertension and pulmonary disease patients in China utilize outpatient clinical services. At the same time, those in the top 10% are prone to having more than one admission record in the same calendar year (in other words, they are hospitalized more than once within one year). The top 20% have similar characteristics to the top 10%.

Table 2.
Demographic and Diagnoses Characteristics of High Spenders.
Figure 4 and Figure 5 report age density distribution of the top 10% of spenders and average spending for each age group. Figure 4 shows that the age distribution has an inverted U shape, with high spending concentrated around people aged 45 and 60. These ages also have the highest average spending, as reported by Figure 5. This differs from developed countries, in which health spending steadily increases with age. This shows the underuse of health care services for the elderly in China. Our result is consistent with Gao and Yao [29], Yan and Chen [30], and Feng et al. [31], who proved that people older than 65 in China had lower health status and less health spending.
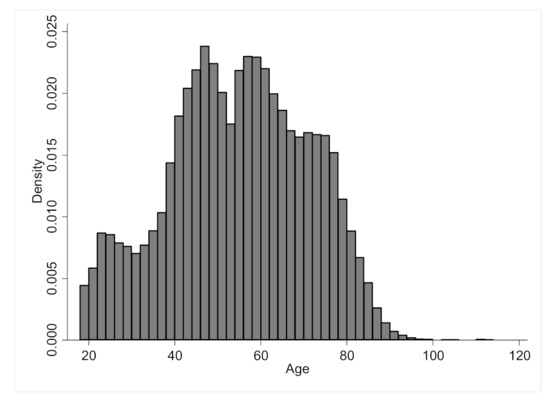
Figure 4.
Age Density Distribution of the Top 10% of Users. Source: Authors’ analysis of claims data for 2010–2014.
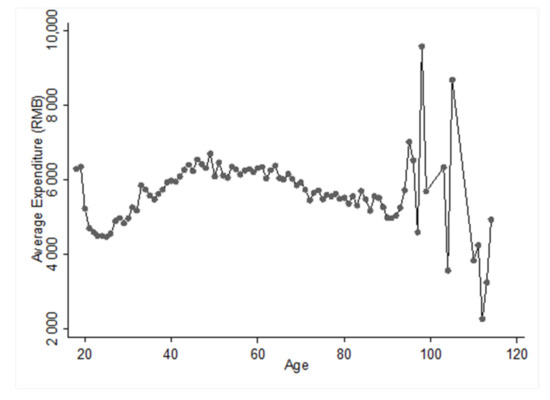
Figure 5.
Average Spending of the Top 10% of Users by Age Group. Source: Authors’ analysis of claims data for 2010–2014.
Table 3 reports the top six categories of diagnoses for the top 10% of spenders. They make up almost 50% of total observations. Among them, neoplasms, diseases of the circulatory system, and diseases of the digestive system account for 3.6%, 13.9%, and 12.3% of total observations, respectively. Malignant neoplasms make up 41.0% of all the neoplasms, indicating that the probability of being diagnosed with a malignant neoplasm is very high. For diseases of the circulatory system, cerebrovascular diseases, hypertensive diseases, and ischemic heart diseases account for 35.3%, 27.9%, and 11.4%, respectively. This implies that patients in the studied region suffer from these common diseases and that they play a major role in high health expenditure. Diseases of the genitourinary system also make a great contribution. Mental, behavioral, and neurodevelopmental disorders and injury, poisoning, and other consequences of external causes contribute 1.1% and 8.7%, respectively.

Table 3.
Diagnoses Distribution of The Top 10% Spending.
4.3. Expenditure Persistence
4.3.1. Dynamic of Concentration of Health Spending
It is overwhelming that the top 10% of spenders consume more than 50% of total health resources. Does this persist over time? We aggregate expenditure for everyone over several years to calculate the proportion of total expenditure accounted for by the top 10% of spenders. As shown in Figure 6, the ratio for 2010 is 55.9% and it decreases slightly as we add up expenditure over a longer period. The top 10% of spenders still account for 54.9% of total expenditure after five years. This indicates that there is strong health expenditure persistence in light of persisting health spending concentration.
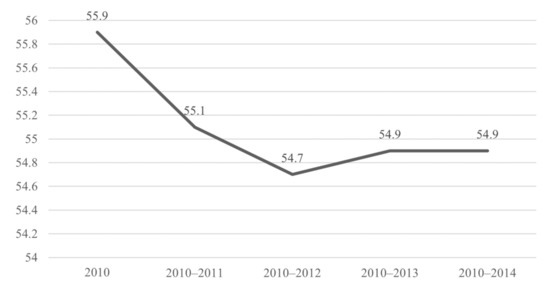
Figure 6.
The Proportion of Total Expenditure Accounted for by The Top 10% of Spenders. Source: Authors’ analysis of claims data for 2010–2014.
4.3.2. Transition Matrix Analysis for Persistence of Health Spending
Table 4 presents the probability of the top 10% beneficiaries remaining in the top 10% and 20% categories, respectively. For individuals who were in the top 10% in 2010, 33.6% remained in the top 10% one year later. The probability declined gradually thereafter, with 23.6% of the top spenders in 2010 still in the same category four years later. Therefore, approximately 74.7% (25.1%/33.6%) and 70.2% (23.6%/33.6%) of individuals who were the highest spenders were likely to remain so three and four years later, respectively. The probability of the top 10% beneficiaries remaining in the top 20% was 79.5% (38.5%/48.4%) and 75.6% (36.6%/48.4%) three and four years later, respectively.

Table 4.
Persistence of High Spending Across Years.
4.3.3. Distribution of Years of Admission and Number of Admissions
We calculate distribution of years of admission and number of admissions to provide more evidence for health expenditure persistence. For the distribution of years of admission, we add up all expenditures during each calendar year for everyone and take one individual’s one year as one observation. For the distribution of number of admissions, we take one admission as one observation. As shown in Table 5, 51.5% of observations have two or more years of health spending. However, average expenditure does not increase as persistence increases. The main reason for this is that high spenders are more likely to die and exit the reimbursement sample. Figure 7 reports the distribution of years of admission and number of admissions for the top 10% of spenders. For this group, the proportion of observations with two or more years of spending is 22.5%, which is lower than the total sample. It may be that diagnoses and conditions for higher spenders are usually serious, and thus the mortality rate is high and persistence is weaker. Number of admissions concentrated around four for the top 10% of spenders.

Table 5.
Distribution of Years of Admission and Average Expenditure.
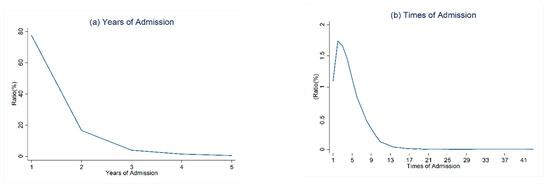
Figure 7.
Distribution of Years and Number of Admissions for The Top 10% of Spenders. Source: Authors’ analysis of claims data for 2010–2014. Notes: For distribution of years of admission, we add up all expenditures during each calendar year for everyone and take one individual one year as one observation. For distribution of number of admissions, we take one admission as one observation. Subfigure (a,b) report the distribution of years of admission and number of admissions for the top 10% of spenders, respectively.
5. Empirical Analysis
5.1. Persistence of Health Spending
To provide more empirical evidence on the persistence of health expenditures, we run the regression of health spending on the lagged dependent variable. The results are shown in Table 6. The key finding is that—conditional on age, gender, conditions, and other covariates—estimated coefficients for all the lagged health expenditures are statistically significant. Although the coefficients decrease as we add more lagged health spending, they are still statistically and economically significant. Taking regression incorporating four periods of lagged dependent variables as an example, once an individual is hospitalized and there is a 10% increase in expenditure, the spending will significantly increase by 1.1% 1 year later and 0.76% 2 years later. The coefficient is 0.62% for 3 years later. Health spending will increase by 0.36% even after 4 years. This suggests that past spending plays a major role in the dynamic of health spending, and depends on conditions (health).

Table 6.
Regression Results for Persistence of Health Spending.
In terms of comorbidities, spenders with serious and chronic conditions generally have higher health expenditure. For example, the expenditure for spenders with tumor diagnoses is 16% to 59.9% higher than for people without this condition. Conditional on four periods of lagged expenditure, spending for recipients with heart attacks, cerebrovascular disease, diabetes mellitus, and pulmonary disease is 12.4%, 7.6%, 9.9%, and 9.9% higher than for people without those conditions, respectively.
It is worth noting that kidney disease and mental disorders played a major role in predicting high spending over a long time period. For those with kidney disease or mental disorders, spending is 50.4% and 97.6% higher than for people with none of these conditions, respectively. Trauma also has some predictive power for high expenses. This is different from Hirth et al. [14]. They found marginal effects for medical conditions tended to be larger than those for psychiatric conditions, and trauma has a relatively small marginal effect for predicting expenses.
5.2. Heterogeneity Analysis
5.2.1. Heterogeneity Analysis by Age and Gender
As shown in Columns 1 and 2 of Table 7, males have stronger expenditure persistence than females. Age is an important indicator for forecasting health spending since health expenditure steadily increases with age in developed countries. Surprisingly, there is a weaker spending persistence trend among people older than 65 than among those aged 18 to 44, even after controlling for diagnoses. The main reason for this is that the elderly enjoys less health investment than younger people in China, especially in rural areas. According to field research from six villages in eight provinces in China, “getting rid of the pain and sickness” and “financial difficulties” are the top two reasons for elderly females living in rural China committing suicide [32]. Our research is consistent with this finding.

Table 7.
Heterogeneity Analysis for Persistence of Expenditure by Gender and Age.
5.2.2. Heterogeneity Analysis by Income Level and Enrollment Location
Columns 1 and 2 in Table 8 report estimations for heterogeneity analysis by income level. Compared with higher income patients, the financially constrained group experiences stronger expenditure persistence. This indicates that low-income populations usually have a poorer health status than high income people. Moreover, financially constrained patients usually enjoy more medical assistance. We also divide the sample into urban and rural subsamples according to their enrollment location. The former includes observations of city and town, and the latter observations of rural enrollment location. Columns 3 and 4 in Table 8 show that there are no obvious differences between these two groups.

Table 8.
Heterogeneity Analysis for Persistence of Expenditure by Income and Enrollment Location.
6. Discussion and Conclusions
Protection for catastrophic spending is crucial considering the persistence and concentration of health expenditure. Do high spenders have enough insurance protection? Figure 8 shows that the top 10% of spenders account for 60.3% of total out-of-pocket expenditures and it remains 58.1% four years later. Figure 9 reports average individual cost sharing for the top 10% and the other 90% of spenders. High spenders, on average, have higher cost shares. The average cost share for the top 10% of spenders was 53.7% between 2010 and 2014. Research from the World Health Organization finds that the low-income population will face catastrophic spending risk once cost share gets higher than 30% (Health Financing Strategy for the Asia Pacific Region (2010-2015), WHO, 2009: 18). At the same time, the average out-of-pocket expenditure for the top 10% of spenders is 25,637 RMB (about $4042), which is about 250% of the average income for the studied region. The maximum is 993,380 RMB (about $156,635). Moreover, total average spending for the top 10% of spenders is 31,746 RMB, which is about three times the average income. The protection for catastrophic spending is insufficient from this point of view.
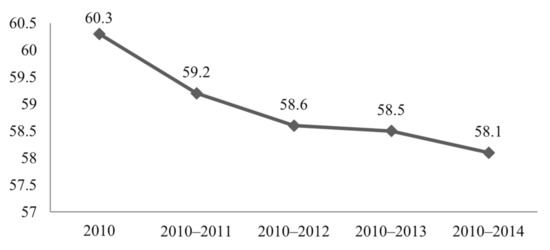
Figure 8.
The Proportion of Out-of-pocket Expenditure Accounted for by The Top 10% of Spenders. Source: Authors’ analysis of claims data for 2010–2014.
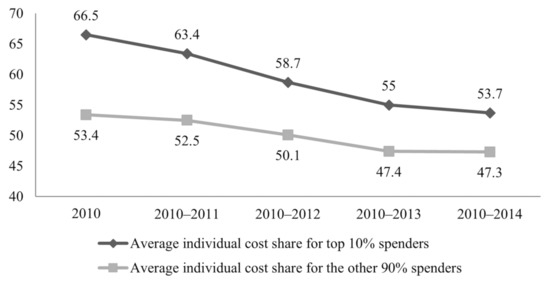
Figure 9.
Average Individual Cost Share for the Top 10% and The Other 90% of Spenders. Source: Authors’ analysis of claims data for 2010–2014.
However, we do not have enough evidence to make conclusions regarding whether catastrophic spending is related to high costs of healthcare services or a low level of insurance protection since we do not have individual/family income data. We will do further research to precisely identify the sources of catastrophic spending once we have access to more data, so as to understand the right entry points and measures to control costs and/or provide protection for catastrophic spending.
Given the extreme skewness and persistence of health spending in developed countries and regions, little is known about the spending patterns in developing countries. Using a unique individual-level claim dataset with a 5-year observation period, this paper provides considerable evidence of the long-term concentration and persistence characteristics of health care expenditures in China.
We find that the top 10% of spenders account for more than 50% of total expenditures. The top 50% consume more than 90% of medical resources. Of the individuals who were in the top 10% in 2010, 33.6% remained in this category 1 year later. The probability declined gradually thereafter, with 23.6% of the top spenders in 2010 still in this category 4 years later. Conditional on age, gender, conditions (health), and other characteristics, past spending plays a major role in the dynamic of health spending. A 10% increase in expenditure is associated with an increase of 0.36% to 1.33% of spending in the future.
The most expensive 10% of users tend to be older, male, urban residents, and seeking care in secondary and tertiary health institutions. Diagnoses of the top 10% of spenders are concentrated among neoplasms, diseases of the circulatory system, diseases of the digestive system, diseases of the genitourinary system, neurodevelopmental disorders and injury, poisoning, and other consequences of external causes. Among them, malignant neoplasms and digestive system, cerebrovascular, hypertensive, and ischemic heart diseases play a big role. These findings support disease management for conditions that are strong predictors of future high spending.
Persistence has some heterogeneity in terms of diagnosis and hospital level, as well as age, gender, and income level. Expenditure on chronic conditions shows stronger persistence. Compared with secondary and tertiary hospitals, community health centers have stronger spending persistence. This may be because city S is not very developed and patients there consume many healthcare services in community health centers. Spending persistence is weaker among people older than 65 than among people aged 18 to 44, even after controlling for diagnoses. The main reason for this is that the elderly enjoys less health investment than younger people in China, especially in rural areas. Compared with higher income patients, the financially constrained group experiences stronger expenditure persistence.
Sources of health spending persistence should include transition of disease profiles from acute infectious disease to chronic disease, as the latter often involve regular diagnostic testing and ongoing use of costly medications. Population aging is another contribution since the elderly have higher probability of being diagnosed as chronic disease than younger ones.
Endogenous issues will be induced when the lagged dependent variable is included, since the lagged dependent variables are correlated with unobservable individual heterogeneity and the strict exogenous hypothesis will be violated. Generalized method of moments (GMM) is utilized to deal with the endogenous problem. However, in this paper, GMM estimation would induce estimation bias. The differences in lagged health spending are instrument variables for the endogenous variables when running GMM estimation. However, they are taken as missing values for those observations without lagged spending. Therefore, sample selection and estimation bias would occur in this circumstance. Luckily, we are concerned with forecasting health spending, so the estimated parameter is not that important for our study. Nevertheless, further efforts should be made to deal with this endogenous issue.
Although it presents some interesting results on the skewness distribution and persistence of health expenditures, this paper has potential limitations. First, this research relies on a relatively limited sample. The data are individual-level reimbursement records from one city in China. Therefore, these results should be interpreted with caution. Second, since we have no records of death, data attrition caused by death cannot be tackled. However, we still find strong evidence of health spending persistence, although it may be weakened by death. Therefore, the persistence in our paper should be a lower bound.
Research on the concentration and persistence of health expenditures will inform policymakers in terms of controlling costs and providing protection for catastrophic spending.
Author Contributions
Conceptualization, X.P.; methodology, X.P. and M.S.; software, X.P. and H.C.; validation, H.C., X.P. and M.S.; formal analysis, X.P.; investigation, H.C. and X.P.; resources, X.P. and M.S.; data curation, X.P. and M.S.; writing—original draft preparation, X.P.; writing—review and editing, X.P. and M.S.; visualization, H.C.; supervision, H.C.; project administration, X.P. and H.C.; funding acquisition, X.P. and H.C. All authors have read and agreed to the published version of the manuscript.
Funding
This research was funded by National Natural Science Foundation of China “Optimization of Children’s Health Insurance: Econometric Analysis and Policy Simulation Based on Individual Participation and Reimbursement Data”, grant number [72004245]; Beijing Natural Science Foundation “Improve the Value of Health Care: Research from the Perspective of Persistence and Concentration of Health Expenditure”, grant number [9194032]; Science Foundation of Ministry of Education of China “Birth Weight, Health and Cognitive Ability”, grant number [17YJC790116]; National Natural Science Foundation of China “Welfare Effects Evaluation and Policy Optimization Study on the Integration of Basic Medical Insurance System of Urban and Rural Residents”, grant number [71974221].
Data Availability Statement
Data was obtained from China Charities Aid Foundation for Children and are available from the authors with the permission of China Charities Aid Foundation for Children.
Acknowledgments
The authors gratefully acknowledge support from China Charities Aid Foundation for Children.
Conflicts of Interest
The authors declare no conflict of interest.
Appendix A

Table A1.
ICD-10 (International Classification of Diseases, 10th Revision) Codes.
Table A1.
ICD-10 (International Classification of Diseases, 10th Revision) Codes.
| Condition | ICD-10 Codes |
|---|---|
| Neoplasms | C00-D48 |
| Malignant Neoplasms | C00-C97 |
| In situ Neoplasms | D00-D09 |
| Benign Neoplasms | D10-D36 |
| Injury, Poisoning and Certain Other Consequences of External Causes | S00-T98 |
| Diseases of The Circulatory System | I00-I99 |
| Hypertensive Diseases | I10-I15 |
| Ischemic Heart Diseases | I20-I25 |
| Cerebrovascular Diseases | I60-I69 |
| Diseases of The Digestive System | K00-K93 |
| Diseases of Esophagus, Stomach and Duodenum | K20-K31 |
| Diseases of Appendix | K35-K38 |
| Disorders of Gallbladder, Biliary Tract and Pancreas | K80-K87 |
| Diseases of Liver | K70-K77 |
| Noninfective Enteritis and Colitis | K50-K52 |
| Diseases of The Genitourinary System | N00-N99 |
| Urolithiasis | N20-N23 |
| Acute Kidney Failure and Chronic Kidney Disease | N17-N19 |
| Diseases of Male Genital Organs | N40-N51 |
| Inflammatory Diseases of Female Pelvic Organs | N70-N77 |
| Noninflammatory Disorders of Female Genital Tract | N80-N98 |
| Mental, Behavioral and Neurodevelopmental Disorders | F00-F99 |
| Schizophrenia, Schizotypal, Delusional, And Other Non-Mood Psychotic Disorders | F20-F29 |
| Anxiety, Dissociative, Stress-Related, Somatoform and Other Nonpsychotic Mental Disorders | F40-F48 |
| Mental Disorders Due to Known Physiological Conditions | F00-F09 |
| Diseases of The Musculoskeletal System and Connective Tissue | M00-M99 |
References
- Finkelstein, A.; Arrow, K.J.; Gruber, J.; Newhouse, J.P.; Stiglitz, J.E. Moral Hazard in Health Insurance; Columbia University Press: New York, NY, USA, 2014. [Google Scholar]
- Shigeoka, H. The Effect of Patient Cost Sharing on Utilization, Health, and Risk Protection. Am. Econ. Rev. 2014, 104, 2152–2184. [Google Scholar] [CrossRef]
- Figueroa, J.F.; Zhou, X.; Jha, A.K. Characteristics and Spending Patterns of Persistently High-Cost Medicare Patients. Health Aff. 2019, 38, 107–114. [Google Scholar] [CrossRef] [PubMed]
- Cohen, S.B. The Concentration and Persistence in the Level of Health Expenditures over Time: Estimates for the U.S. Population, 2011–2012; Statistical Brief #449; Agency for Healthcare Research and Quality: Rockville, MD, USA, 2014.
- Berk, M.L.; Monheit, A.C. The Concentration of Health Care Expenditures, Revisited. Health Aff. 2001, 20, 9–18. [Google Scholar] [CrossRef] [PubMed]
- Cohen, S.B. The Concentration of Health Care Expenditures in the U.S. and Predictions of Future Spending. J. Econ. Soc. Meas. 2016, 41, 167–189. [Google Scholar] [CrossRef]
- Shenkman, E.; Knapp, C.; Sappington, D.; Vogel, B.; Schatz, D. Persistence of High Health Care Expenditures among Children in Medicaid. Med. Care Res. Rev. 2007, 64, 304–330. [Google Scholar] [CrossRef]
- Hirth, R.A.; Gibson, T.B.; Levy, H.G.; Smith, J.A.; Calónico, S.; Das, A. New Evidence on the Persistence of Health Spending. Med. Care Res. Rev. 2015, 72, 277–297. [Google Scholar] [CrossRef]
- Ku, L.E.; Chiou, M.; Liu, L. Variations in the Persistence of Health Expenditures and the Implications for the Design of Capitation Payments in Taiwan. J. Health Serv. Res. Policy 2015, 20, 146–153. [Google Scholar] [CrossRef]
- Gastaldi-Ménager, C.; Geoffard, P.; de Lagasnerie, G. Medical Spending in France: Concentration, Persistence and Evolution before Death: Medical spending in France. Fisc. Stud. 2016, 37, 499–526. [Google Scholar] [CrossRef]
- Peng, X.B.; Du, C. Concentration and Persistence of Health Spending: Micro-Empirical Evidence from China. J. World Econ. 2019, 42, 52–76. [Google Scholar]
- Zuvekas, S.H.; Cohen, J.W. Prescription Drugs and the Changing Concentration of Health Care Expenditures. Health Aff. 2007, 26, 249–257. [Google Scholar] [CrossRef] [PubMed][Green Version]
- Lin, P.; Biddle, A.K.; Ganguly, R.; Kaufer, D.I.; Maciejewski, M.L. The Concentration and Persistence of Health Care Expenditures and Prescription Drug Expenditures in Medicare Beneficiaries with Alzheimer Disease and Related Dementias. Med. Care 2009, 47, 1174–1179. [Google Scholar] [CrossRef]
- Cohen, S.B. The Concentration and Persistence in the Level of Health Expenditures over Time: Estimates for the U.S. Population, 2009–2010; Statistical Brief #392; Agency for Healthcare Research and Quality: Rockville, MD, USA, 2012.
- Kohn, J.L.; Liu, J.S. The Dynamics of Medical Care Use in the British Household Panel Survey: Dynamics of Medical Care Ese. Health Econ. 2013, 22, 687–710. [Google Scholar] [CrossRef] [PubMed]
- Newhouse, J.P.; Manning, W.G.; Keeler, E.B.; Sloss, E.M. Adjusting Capitation Rates Using Objective Health Measures and Prior Utilization. Health Care Financ. Rev. 1989, 10, 41–54. [Google Scholar]
- McClellan, M.B.; Wise, D.A. Where the Money Goes: Medical Expenditures in a Large Corporation; NBER Working Paper 5294; National Bureau of Economic Research: Cambridge, MA, USA, 1995. [Google Scholar]
- Eichner, M.J.; McClellan, M.B.; Wise, D.A. Insurance or Self-Insurance? Variation, Persistence, and Individual Health Accounts. In Inquiries in the Economics of Aging; Wise, D.A., Ed.; University of Chicago Press: Chicago, IL, USA, 1998; pp. 19–45. [Google Scholar]
- Feenberg, D.; Skinner, J. The Risk and Duration of Catastrophic Health Care Expenditures. Rev. Econ. Stat. 1994, 76, 633–647. [Google Scholar] [CrossRef]
- Garber AMMaCurdy, T.E.; McClellan, M.B. Persistence of Medicare Expenditures among Elderly Medicare Beneficiaries. In Frontiers in Health Policy Research; Garber, A.M., Ed.; MIT Press: Cambridge, MA, USA, 1998; pp. 154–178. [Google Scholar]
- Monheit, A.C. Persistence in Health Expenditures in the Short Run: Prevalence and Consequences. Med. Care 2003, 41, III53–III64. [Google Scholar] [CrossRef] [PubMed]
- French, E.; Jones, J.B. On the Distribution and Dynamics of Health Care Costs. J. Appl. Econom. 2004, 19, 705–721. [Google Scholar] [CrossRef]
- Pauly, M.V.; Zeng, Y. Adverse Selection and the Challenges to Stand-alone Prescription Drug Insurance. Front. Health Policy Res. 2004, 7, 55. [Google Scholar] [CrossRef] [PubMed][Green Version]
- Rettenmaier, A.J.; Wang, Z. Persistence in Medicare Reimbursements and Personal Medical Accounts. J. Health Econ. 2006, 25, 39–57. [Google Scholar] [CrossRef]
- Riley, G.F. Long-Term Trends in the Concentration of Medicare Spending. Health Aff. 2007, 26, 808–816. [Google Scholar] [CrossRef]
- van Vliet, R.C.J.A. Predictability of Individual Health Care Expenditures. J. Risk Insur. 1992, 59, 443–461. [Google Scholar] [CrossRef]
- Xu, L.L.; Gong, G.; Wang, H.M. On Medical Expenditure under Basic Medical Insurance System for Urban Employees: Non-negligible Persistence. J. Financ. Econ. 2011, 37, 25–35. [Google Scholar]
- Aron-Dine, A.; Einav, L.; Finkelstein, A.; Cullen, M. Moral Hazard in Health Insurance: Do Dynamic Incentives Matter? Rev. Econ. Stat. 2015, 97, 725–741. [Google Scholar] [CrossRef] [PubMed]
- Gao, M.T.; Yao, Y. Gender, Life-Cycle and Intrahousehold Health Investment. Econ. Res. J. 2004, 7, 115–125. [Google Scholar]
- Yan, J.; Chen, Y.P. Does the Rural Elderly Consume More Health Resources? Policy Implication of Age Distribution of Rural China’s Health Expenditure. Manag. World 2010, 13, 91–95. [Google Scholar]
- Feng, J.; Yu, Y.Y.; Lou, P.Y. Medical Demand and Growing Medical Costs in China-Based on the Gap between Senior Citizens’ Medical Costs in Urban and Rural Areas. Soc. Sci. China 2015, 3, 85–103. [Google Scholar]
- Liu, Y.W. Research on Suicide of Peasants; Social Sciences Academic Press: Beijing, China, 2014. [Google Scholar]
Publisher’s Note: MDPI stays neutral with regard to jurisdictional claims in published maps and institutional affiliations. |
© 2021 by the authors. Licensee MDPI, Basel, Switzerland. This article is an open access article distributed under the terms and conditions of the Creative Commons Attribution (CC BY) license (https://creativecommons.org/licenses/by/4.0/).