Article

Toward the Dynamic Modeling of Transition Problems: The Case of Electric Mobility

1
Department of Islamic Studies and Management, Imam Sadiq University, Tehran 1465943681, Iran
2
Department of Industrial Engineering & Innovation Sciences, Eindhoven University of Technology, 5600 MB Eindhoven, The Netherlands
3
Monash Sustainable Development Institute, Monash University, Clayton, VIC 3800, Australia
*
Author to whom correspondence should be addressed.
Sustainability 2021, 13(1), 38; https://doi.org/10.3390/su13010038
Submission received: 19 November 2020 / Revised: 15 December 2020 / Accepted: 17 December 2020 / Published: 22 December 2020
(This article belongs to the Special Issue Business Innovation and Sustainable Development)

Abstract

:
Transportation systems are transitioning to e-mobility, but scholars and policymakers are struggling to understand how to accomplish this transition effectively. In response, we draw on the technological innovation systems perspective and the unified theory of acceptance and use of technology to develop a theory-guided and entity-based simulation model to better understand, among others, electric vehicle (EV) adoption processes as a specific yet core element driving business innovation. By doing so, our model is among the first to capture and combine the macro-and micro-level interactions associated with the EV transition process. Our simulation results shed light on the impact of alternative innovation policies, notably by explaining relations between EV market dynamics and changes in e-mobility policies, such as EV-related subsidies and resource mobilization. As such, the simulation modeling approach adopted in this paper enables a more in-depth study of transition problems related to e-mobility. Notably, the resulting modular model can be adjusted to other e-mobility transition problems by changing the specified entities.

1. Introduction

Transportation is crucial for economic competitiveness as well as for commercial and cultural exchanges [1]. However, current transportation systems are severely challenged by land-use restrictions, soil sealing, congestion, accidents, and the fragmentation of natural, semi-natural, and agricultural areas [2,3]. While some of these challenges may be difficult, if not impossible, to tackle in the short to medium term, specific (e.g., environmental and resource scarcity) problems caused by Internal Combustion Engine Vehicles (ICEVs) may be resolved by transitioning to more sustainable mobility solutions.
In this respect, sustainable mobility systems are envisioned to retain the high social and economic benefits associated with mobility while reducing some of their negative impacts, for example, [4,5]. However, sustainable mobility is a (contested) concept regarding the way people or goods move, for example, [6,7]. A narrow definition of this concept focuses on individual technological solutions, such as specific types of vehicles and transportation infrastructures. A broader view of sustainable mobility includes improved mobility patterns and travel choices, fiscal incentives, institutional reforms, land-use changes, and technological innovations, for example, [8,9]. Concerning the latter, several niche innovations such as Alternative Fuel Vehicles (AFVs) and intelligent transportation systems may facilitate the transition toward sustainable mobility [10]. In this respect, Electric Mobility (EM) or e-mobility has a history going back to the mid-19th century and has been gaining new momentum in the last two decades [11].
E-mobility has distinct advantages over conventional, ICEV-based transportation systems [12]. Environmentally, electric vehicles (EVs) are locally emission-free, and they may reduce greenhouse gas emissions [13,14]. Furthermore, they are relatively quiet during operation and, as such, limit local levels of noise pollution. Also, technologically speaking, EVs are advantageous compared to ICEVs. For instance, EVs do not need a (complicated) gearbox, are subject to less wear and tear (e.g., notably fewer moving components in the engine), and have substantially less energy loss during idle operation [15]. Finally, from an economic perspective, e-mobility appears to provide a major growth opportunity in the saturated markets of car manufacturers. Some policymakers even consider EM to be a geopolitical response to oil-producing countries and emerging economies such as China [16].
Despite all these advantages, the e-mobility transition is subject to many mechanisms and trends, which make this transition highly challenging to study [17,18]. The transition to EM involves complex multi-level (e.g., technological, economic, and socio-cultural) processes. Furthermore, there is a broad range of actors that seek to influence these transition processes—with each actor having unique attributes and decision rules [10,19]. These matters make (studying) transition processes highly complex.
Scholars and policymakers in this area are thus struggling to understand the main dynamic patterns in e-mobility transition processes [17,20], such as EV adoption processes—as a core element of business innovation. In this paper, we adopt a simulation modeling approach to shed light on (mutual) influences of the macro-level and micro-level variables of the e-mobility transition. We draw on the technological innovation systems perspective and the unified theory of acceptance and use of technology to develop an entity-based and theory-guided system dynamics model of e-mobility transitions and create a better understanding of the multi-level dynamics at play.

2. Theoretical Background

Various previous studies describe and use simulation models on mobility transition processes [21,22,23]. For instance, Pasaoglu et al. [22] built a simulation model, employing system dynamics and an agent-based approach to study the technology transition in the EU light-duty road transport sector. Harrison and Theil [23] extended this work to model powertrain technology transitions within the European Union, while Lewe et al. [21] employed system dynamics to study intercity transportation systems. Finally, Köhler et al. [2] developed a hybrid agent-based system dynamics model to assess the transition to sustainable mobility. They were among the first to model the multi-level nature of the transition but failed to consider specific entities (e.g., the energy supply system and fuel infrastructure).
Typically, studies of e-mobility involve a social and/or technological diffusion process, a fleet aging chain, and a choice model for the purchase decision with varying levels of detail or market segmentation [24]. Similarly, we break the e-mobility system down into various interconnected components, namely the following types of entities: the e-mobility innovation system, charging points, EV pricing, EV related subsidies, and EV purchasers. While the e-mobility innovation system serves to explain the dynamics of EV diffusion at the macro level, the other entities involve micro-level issues around EV purchasers and the related market dynamics of the fleet. This decomposition serves to provide a comprehensive yet parsimonious model, one that includes both the macro-level process and the micro-level of individual agents.
In this study, we model the various entity types using two dominant theories. This theory-guided research allows a more systematic approach to study transition problems. Also, the integration of theory in the modeling process makes it possible to interpret the simulation findings in terms of the theory. We draw on the Technological Innovation Systems (TIS) framework as well as the Unified Theory of Acceptance and Use of Technology (UTAUT). These two theories are selected because they (a) adequately reflect the entities mentioned, utilizing key variables in each entity type [25,26] and (b) are sufficiently aligned with each other such that they can be combined in a single model. In this respect, TIS informs the macro-level structure of EV diffusion, whereas UTAUT describes the micro-level structure of an e-mobility system, including the decision rules that guide the behavior of individual actors.

2.1. Technological Innovation Systems

The TIS literature provides a framework for understanding and steering transition processes through radical new technologies, in particular in the context of sustainable development [27,28]. Markard and Truffer [29] (p. 611) define a technological innovation system as “a set of networks of actors and institutions that jointly interact in a specific technological field and contribute to the generation, diffusion and utilization of variants of a new technology and/or a new product.”
Over the years, scholars have studied the structure driving the dynamic behavior of (technological) innovation systems. In this regard, TIS scholars have uncovered so-called functions, which reflect a set of processes and activities that an innovation system (around a particular technology) needs to perform in order to develop over time successfully [25,30,31,32,33,34,35,36,37]. These functions are: (1) entrepreneurial activities that involve projects aimed to prove the usefulness of the emerging technology in a practical and/or commercial environment; (2) knowledge development and diffusion, which involves learning activities, mostly on the emerging technology but also on markets, networks, users, and so forth; and partnerships between actors, but also meetings like workshops and conferences; (3) guidance of the search that refers to activities shaping the needs, requirements, and expectations of actors with respect to their (further) support of the emerging technology; (4) market formation that involves activities that contribute to the creation of a demand for the emerging technology; (5) mobilization of resources for the allocation of financial, material and human capital; (6) creation of legitimacy, involving activities within the system that may increase its social acceptance and compliance with relevant institutions and other relevant actors and stakeholders.
Recently, TIS researchers have been focusing more on how to conceptualize, measure, and intervene in a complex TIS that supports or blocks system changes in various temporal and spatial settings [28]. These studies particularly aim to understand how (patterns of) interactions between innovation functions (e.g., in terms of cumulative causation and motors of innovation) trigger complex TIS dynamics. Here, the inclusion of micro-level (market agents) elements will help to improve the explanatory and predictive power of the TIS approach. By doing so, the dynamic analysis of innovation systems would move beyond a mere qualitative and a rather reductionist description of the system [38,39] to a more quantified and holistic perspective.

Contextualization of TIS in the E-Mobility Sector

To contextualize the TIS perspective for the e-mobility sector, we adopt a dynamic and systemic approach toward mapping the effect of the e-mobility innovation system on the diffusion and adoption of electric vehicles. To accomplish this, we draw on work by Suurs [40] and the formalization and further development of his work by Walrave and Raven [41]. Accordingly, we consider the innovation functions as aggregate stocks, representing “the state of a specific innovation system in a defined moment” [42] (p. 77). The function’s fulfillment can then give rise to cycles of processes of change (or feedback loops). That is, in particular conditions, these loops will reinforce each other and create momentum for the innovation system to grow [37]. For the “e-mobility innovation system” entity type in our model, we draw on TIS literature to model the following functions: (1) entrepreneurial activities, (2) knowledge development and diffusion, (3) guidance of the search, (4) mobilization of resources, and (5) creation of legitimacy. The market formation function (6) is formulated by using more fine-grained and context-specific entity types, such as EV purchasers and charging points.

2.2. The Unified Theory of Acceptance and Use of Technology

The UTAUT is the most robust model of technology acceptance for evaluating and predicting technology diffusion, for example, [43,44,45]. The UTAUT details the factors that influence the intention of potential purchasers to adopt a technology [46]. The theory was developed by Venkatesh et al. [46] by synthesizing eight different theories and models of technology use: theory of reasoned action [47,48], technology acceptance model [49,50], theory of planned behavior [51], decomposed theory of planned behavior [52,53], motivational model [54,55], model of PC utilization [56,57], innovation diffusion theory [58], social cognitive theory [46,59,60].
In its initial form, the UTAUT posits that four key factors influence the adoption of technology [43]: (1) performance expectancy, that is, the perceived degree to which a particular technology will provide benefits in performing certain activities; (2) effort expectancy, referring to the perceived degree of ease associated with the use of technology; (3) social influence, as the extent to which potential users perceive that significant others believe they should use a particular technology; and (4) facilitating conditions, that is, the potential users’ perceptions of the resources and support available to perform a particular action, for example, [46,61]. Also, UTAUT suggests that individual attributes such as age, gender, experience, and habit moderate the relationship between these four factors and technology acceptance. Many studies replicating, extending, and applying (parts of) the original UTAUT model have substantially improved its generalizability [26].

Contextualization of UTAUT in E-Mobility System

To contextualize the UTAUT, we adopted the theoretical interpretation by Venkatesh et al. [26] and its update for the e-mobility sector by Sovacool [62]. We used the UTAUT to determine and formulate the variables and decision-rules of potential EV purchasers [46]. Notably, we adopted the following variables: (1) performance and effort expectancy, that is, the degree to which an individual believes that EVs will help in meeting mobility demands as well as be easy to use; (2) facilitating conditions, the degree to which an individual believes that the infrastructure can cope with EV adoption (i.e., the availability of charging points vis-à-vis the EV car population); (3) price value of EVs, involving the purchaser’s cognitive tradeoff between the relative desirability of the EV price compared to the price of corresponding models of ICEV; (4) hedonic motivation, that is, the fun or pleasure expected to be derived from driving EVs; (5) social influence, the extent to which potential purchasers are exposed to pro-EV social networks. To model such social influence, we include the influence of Word-of-Mouth (WoM) on adoption; see, for example, [63,64]. In addition, we argue that marketing and promotion activities are necessary to inform potential purchasers, also to reduce the uncertainty and anxiety arising from the adoption of an EV; see, for example, [65,66]. Therefore, we assume advertising to moderate the effect of the performance and effort expectancy, facilitating conditions, and hedonic motivation on the purchaser’s intention to buy EVs.

3. Method: System Dynamics Modeling

Computational and simulation models can support and inform the handling, analysis, and inference of critical features of transition problems. That is, this type of model provides a more explicit, less ambiguous, and more interlinked representation of transitions. Also, the process of modeling itself—irrespective of the modeling outcomes—appears to facilitate learning about the systems of interest and enable systematic experiments that facilitate learning about ongoing transitions, for example, [67,68,69,70,71].
In the context of transportation systems, System Dynamics (SD) modeling is especially appropriate because it serves to reveal underlying system structures and the transition dynamics arising from these structures. Furthermore, SD can assist in developing experimental transport tools to explore various transport policies and provide a platform for learning about transport problems [72]. In this respect, several SD models have been designed to conceptualize and analyze policies regarding the uptake of AFVs [2,21,22,23,72,73,74,75,76,77,78,79,80,81,82,83,84,85,86,87,88]. While these models all vary in their scope, focus, and assumptions about technological innovation [76], they all capture AFV development, diffusion, and adoption. None of the models developed so far, however, allow for the exploration of multi-level interactions and how these influence the system’s dynamics. Therefore, we develop a model that considers the multi-level nature of the e-mobility transition process, using an entity-based SD model. Entity-based models can provide more effective explanations by decomposing problems into various entity types [89,90].

3.1. Model Description

This section presents a high-level description of the model. Figure 1 depicts a stylized overview of the model. We focus here on the most important feedback loops in this model, as depicted in Figure 1. The list of variables and equations of the model, as well as the stylized overview of the entity types, are provided in the Supplementary Materials (S1, S2 and S3). Overall, the main feedback loops arise from the various cause-effect relationships between EV adoption, EV-related subsidies, perceived EV legitimacy, learning, and relative availability of charging points.
First, the balancing Subsidy Dependence loop (B.1) reflects the pivotal role of subsidies in the diffusion of e-mobility: this loop runs from Subsidies via Public Charging Points and EV adoption rate to the number of EV Adopters and back to Subsidies. When EV Adopters increase, the number (and size) of subsidies declines. When subsidies decline, another loop reinforces B.1, via the decreasing Price Value of EV (i.e., the price of EV relative to ICEV) that reduces the Intention Rate to Buy EV, which in turn affects the EV purchase intention rate and so forth.
Second, the balancing Regime Resistance loop (B.2) is about the (potential) adopters’ perceived legitimacy of the e-mobility system. When the number of EV Adopters increases to a certain threshold, ICEV manufacturers are likely to invest in improving their products to prohibit further loss of their customers; this is known as the sailing-ship effect, for example, [41,91,92]. This effect is in line with studies that observed how incumbent firms, representing the dominant regime, actively resist the diffusion of niche innovations, see, for example, [93,94,95]. Therefore, the Perceived Legitimacy of EVs may decrease (or grow slower than initially anticipated) and thus demotivate Entrepreneurial Activities, which in turn reduces EV Production Rate (across all EV manufacturers). As such, this may decrease the EV adoption rate when this loop is dominant (i.e., when the total number of people with an intention to buy an EV is higher than the number of EVs produced).
Perceived Legitimacy is also part of the reinforcing loop R.1, called the Legitimization loop. Accordingly, an increasing number of EV Adopters enhances the Perceived Legitimacy of EVs, which in turn stimulates Entrepreneurial Activities and thereby the EV production and adoption rates. Moreover, Entrepreneurial Activities are also likely to lead to more Public Charging Points, which also motivates more people to adopt EVs—similar to how “word-of-mouth” works.
There are several learning loops in the model, which are all reinforcing in nature and capture the influence of experience on the EV adoption rate. In the Performance Learning loop (R.2), the EV adoption rate positively affects learning and, thereby, Knowledge Development and Diffusion, which in turn—after a time delay—positively affects EV Performance and Effort Expectancy as well as Hedonic Expectancy. These two factors influence the Intention Rate to Buy EVs, and so forth.
The Entrepreneurial Learning loop (R.3) involves the effect of Knowledge Development and Diffusion on the Perceived Legitimacy of EVs, which in turn affects the Entrepreneurial Activities. The latter stimulates the EV Production Rate and the growth in Public Charging Points, which together positively affect the EV adoption rate. Via enhanced Learning, this loop feeds back to Knowledge Development and Diffusion.
In the reinforcing Price Learning loop (R.4), a higher EV adoption rate leads to more learning—for example, with regard to manufacturing and economies of scale and scope. As a result, the Price Value of EVs is likely to increase, which in turn motivates more people to buy an EV, and so forth.
The balancing Availability of Charging Points loop (B.3) is about the effect of changes in the number of EV Adopters on the expectancy of facilitating conditions (i.e., the available public charging points): for example, when the number of EV Adopters increases rapidly (everything else being unchanged), the expectancy regarding the availability of charging points per EV declines. As a result, the Intention Rate to Buy EVs declines, affecting the Purchase Intention Rate, and so forth.
Finally, the Return on Knowledge Investment loop (R.5) reflects the reinforcing effect from Resource Mobilization (e.g., for investing in more efficient Charging Points respectively EV design and development) on Knowledge Development and Diffusion. The latter improves the Guidance of Search for solutions, which in turn positively affects the Resources being mobilized.

3.2. Dynamics of the Entity Types

3.2.1. Entity Type: E-Mobility Innovation System

This entity type appears to be the “motor” of any e-mobility system, and we draw on TIS functions to capture this system. Specifically, we draw on recent work describing the causal relations among these functions [25,40,41]. Accordingly, we assume that the higher the stock of EV adopters is, the stronger the associated actors believe in the growth potential of the EV market (see Figure 1). Accordingly, the Guidance of Search toward e-mobility solutions will improve, which promotes Entrepreneurial Activities in the area of Charging Points as well as EV Production.
Clear signals about the attractiveness of the e-mobility system are likely to motivate actors—for example (local) governments—to mobilize more resources to support EV development. These resources may include human capital and competencies, developed through education and research in the fields of e-mobility as well as in entrepreneurship, management, and financial resources (e.g., seed and venture capital) and complementary assets such as charging points, maintenance services, and network infrastructure. In our model in Figure 1, we depict the function of Resource Mobilization as being dependent on both the Guidance of Search and the available Subsidies for purchasing EVs and installing public charging points.
Overall, the level of Resource Mobilization affects, among others, the level of Knowledge Development and Diffusion because actors gain more experience with EVs over time. Knowledge Development and Diffusion, together with more EV adopters (being visible on the roads), also positively affects the legitimacy of EVs. Meanwhile, during the pre-development and take-off phases of the transition [96], we assume that the Sailing Ship Effect might revitalize the conventional mobility system to sustain its own legitimacy and thereby halt, or slow down, the growth of the e-mobility innovation system [41]. However, as the Perceived Legitimacy of EVs increases, more entrepreneurs are likely to become involved in the e-mobility system.
Specifically, in this entity type, the Return on Knowledge Investment loop is reinforcing in nature. Accordingly, with improving Guidance of Search, more resources are mobilized for the e-mobility system, which over time stimulates Knowledge Development and Diffusion, and so forth [41,97].

3.2.2. Entity Type: Charging Points

Recent research shows that the purchaser’s decision to buy an EV is tied directly to the relative availability of charging points [98,99]. This availability can be specified in terms of the number, location, and types of chargers needed to meet the demands of EV users. To keep our model as parsimonious as possible, we assume the availability of chargers is dependent on the number of charging points per EV.
Nevertheless, we do not yet know precisely how many EV chargers are needed for the successful accomplishment of the e-mobility transition [100]. It seems that policymakers and users have different wishes regarding the numbers of EV chargers per EV, also dependent on the various phases of e-mobility development. For our model, we posit that the relative number of desired charging points increases as the number of EV adopters grows. Initially, early adopters of EVs might accept a shortage of charging points, but at later stages, the number of charging points per EV should satisfy the interest of the general public—hence the balancing nature of this entity. As such, a shortfall in charging points stimulates a rise in charging points installments. This rise then provides the opportunity to install new charging points even faster. Overall, the relative capacity of charging points determines the Facilitating Conditions Expectancy, as one of the main factors contributing to EV adoption.

3.2.3. Entity Type: EV Pricing

The UTAUT framework implies the purchaser’s evaluation of price is one of the pivotal determinants of product acceptance and use. In this respect, numerous studies have compared the costs of different vehicle technologies, including EVs [101,102,103], by mainly focusing on the Total Cost of Ownership (TCO). In reality, however, private purchasers mainly judge products such as EVs in terms of their purchase price rather than their TCO [104].
In this entity, we, therefore, focus on the Price Value of EV, that is, the desirability of the price of an EV compared to the corresponding ICEV. We determine the future price of an EV as a function of its initial price, including an annual mark-up (i.e., inflation). Also, we assume Subsidies and Learning to lower EV prices. To calculate the latter, we draw on learning curve theory, which states that the accumulation of experience leads to performance increases [105,106,107]. Notably, the prices of EVs and related services are likely to decrease over time as a result of learning, economies of scale and scope, and other effects that decrease costs of EV production and diffusion. For the price of an ICEV, we assume an annual price growth and (increasingly higher) taxes levied to ICEV users.

3.2.4. Entity Type: EV Related Subsidies

Incentives have been important for the introduction of AFVs, but incentives are also crucial for the further adoption of EVs. Purchasing an EV—from the customers’ point of view—is still considered a risky choice: many are unfamiliar with the technology, and, moreover, EVs are still relatively expensive compared to ICEVs [108,109]. While the design and level of incentives vary greatly over different countries [109], fiscal incentives are most frequently used to facilitate the adoption of EVs. As such, our model includes the option of a changeable (i.e., decreasing over time) direct subsidy to EV purchasers. In addition, we assume that the government covers the costs associated with installing public charging points in order to stimulate EV diffusion.

3.2.5. Entity Type: EV Purchasers

The micro-level of the e-mobility transition mainly involves (potential) adopters. Therefore, in this entity type, we focus on (potential) EV purchasers. The UTAUT framework informs the structure and design of this entity type [46]. Notably, by using the input from the other entity types, we can determine the potential purchaser’s intention to buy an EV as a function of the following constructs: (1) Performance and Effort Expectancy that depends on the performance of EVs; we posit that the performance of EVs is, in itself, related to the functional part of Knowledge Development and Diffusion; (2) Hedonic Expectancy, which is a function of the hedonic benefits of EVs; (3) Facilitating Conditions Expectancy that is determined by the entity type Charging Points; and (4) Price Value of EV, which is formulated in the entity of EV pricing. In the base runs of our simulations (in Section 3.3), we will assume all (potential) EV adopters follow the same rule to decide on purchasing an EV, given these four inputs. Subsequently, we will also explore the effects of different decision rules adopted by people of different ages, income levels, and levels of urbanization.
As explained earlier, we also consider Word-of-Mouth (WoM) to be the main determinant of social influence (one of the UTAUT factors). Here, we assume both negative and positive WoM by (dis)satisfied EV adopters [110,111,112,113,114]. In addition, we added advertising as a moderator of the following variables: Performance and Effort Expectancy, Hedonic Expectancy, and Facilitating Conditions Expectancy [115]. Finally, we limit the adoption rate to the amount of EVs in stock and assume that EVs are produced through Entrepreneurial Activities in the niche market of e-mobility.

3.3. Experimental Setup

We adopt an experimental setup to explore the workings of the model, to investigate how the macro-and micro-level variables and interactions influence the e-mobility transition. To do so, we zoom out/in on the simple structure of EV adoption by adding macro-and micro-level variables of the selected entities to explore the overall dynamic behavior. The simulations in the remainder of this paper especially serve to explore the effects of different age groups, income levels and urbanization levels on EV adoption. In the remainder of this section, these experiments are described in detail. Table 1 provides an overview of our base run and the scenarios developed. In future work, other scenarios can be developed to examine the effect of adding other entities. In this paper, we focus on demonstrating the added value of our modeling approach.
The base run: We start our experiments by running a selected part of the overall model, the EV Purchasers entity type, which includes only four main stocks: Potential Adopters of EV, Potential Adopters with Intention to Buy EV, EV Adopters, and Dissatisfied EV Adopters. That is, this run concerns our base case, which excludes influence from the variables associated with TIS and UTAUT on the diffusion and adoption of EVs (see Figure 1).
Scenario 1: This scenario serves to make sense of the effects on the e-mobility transition development as a result of including the TIS macro-level variables.
Scenario 2: In the second scenario, we also consider the effects of the UTAUT entities and variables on EV Purchase Intention Rate. Note that in this scenario, we also trace the interactions and mutual influences of macro-level variables of TIS and micro-level variables of UTAUT on e-mobility development.
Subsequently, we continue with a set of sub-scenarios (i.e., 2-1, 2-2, and 2-3) that focus on the differential effects on the system’s dynamics as a result of various attributes of (potential) EV purchasers. These scenarios serve to illustrate the potential insights arising from a simulation model that incorporates both the micro and macro-level dimensions of the e-mobility transition. Accordingly, we differentiate EV purchasers in terms of income, age, and urbanization level. These attributes are selected because they are among the most important moderators in EV adoption [116]. As such, we model different classes of potential purchasers to adopt EV, based on various timings and different decision rules. This means each group of EV purchasers attaches different weights to the UTAUT variables that influence their decision to purchase an EV. In the following paragraphs, we describe each of these scenarios. Table 2 and S4 in Supplementary Materials provide more details about each scenario.
Scenario 2-1. In this scenario, we explore the effect of varying income levels on EV adoption. As such, we change the weights of the UTAUT variables for different groups of potential purchasers. The main assumption in estimating these weights is that people with higher income levels are more likely to buy an EV at an earlier point in time [117,118], as the initially high relative price of EV matters less to this group. Performance and Effort Expectancy, Hedonic Expectancy, and Facilitating Conditions Expectancy are arguably more important to this group. Notably, we assume people with an income of over 50,000 € annually to be “early adopters” of EVs.
Scenario 2-2. In this scenario, we investigate the influence of age on EV adoption. Here, we assume that the likelihood of buying an EV is greater for young or middle-aged groups [119,120]. We posit that the higher the age is, the higher the importance of Performance and Effort Expectancy will be. However, a higher age will decrease the importance of Hedonic Expectancy and Facilitating Conditions because the (average) distance traveled per day will decrease. Therefore, the importance of public charging points and facilitating conditions will decrease [116]. We also assume that there is no relationship between the purchaser’s age and price sensitivity. As such, we assume that older and younger people attach the same weight, as in the base run, to the price of EV. In scenario 2-2, we assume that potential adopters aged between 18 and 49 will be the first interested in buying an EV. Note that we keep the demographical distribution fixed over the course of a simulation (i.e., nobody “ages” in our model).
Scenario 2-3. In this scenario, we use the urbanization level as an indication of population density, and the average distance traveled per day as the key indicator of the mobility pattern. That is, we assume that the higher the urbanization level, the higher the density. As a result, the average daily distance traveled per day decreases. As such, to estimate the weights of the UTAUT for different groups, scenario 2-3 assumes that by increasing density, the importance of Performance and Effort Expectancy, Hedonic Expectancy, and Facilitating Conditions Expectancy decreases—because drivers spend less time driving. However, the importance of EV Value Price in determining EV adoption increases. Finally, we assume that the early adopters of EVs are especially people living in high-density cities [121].

4. Results

To run the model, we used data on the number of EVs, the (public) charging points, and the potential EV purchasers (i.e., current ICEV drivers) in the Netherlands. Notably, the Netherlands is an international frontrunner in stimulating EVs and developing its associated infrastructure. In 2019, the Netherlands was among the top five countries where EVs make up more than 1.5% of the total fleet; furthermore, the Netherlands currently has the highest density of charging points [122].
We also used secondary data such as policy notes and weblogs, public databases on EV adoption, and the literature on innovation adoption and e-mobility to specify the model. We simulate 360 months (i.e., the period 2016–2046) in order to explore the workings of the model (S2, in Supplementary Materials, provides more details). We also subjected the model to various sensitivity tests, which suggest the model is robust; see S5 in Supplementary Materials for a detailed overview. In the remainder of this section, we describe the results of the various scenarios.

4.1. Base Run

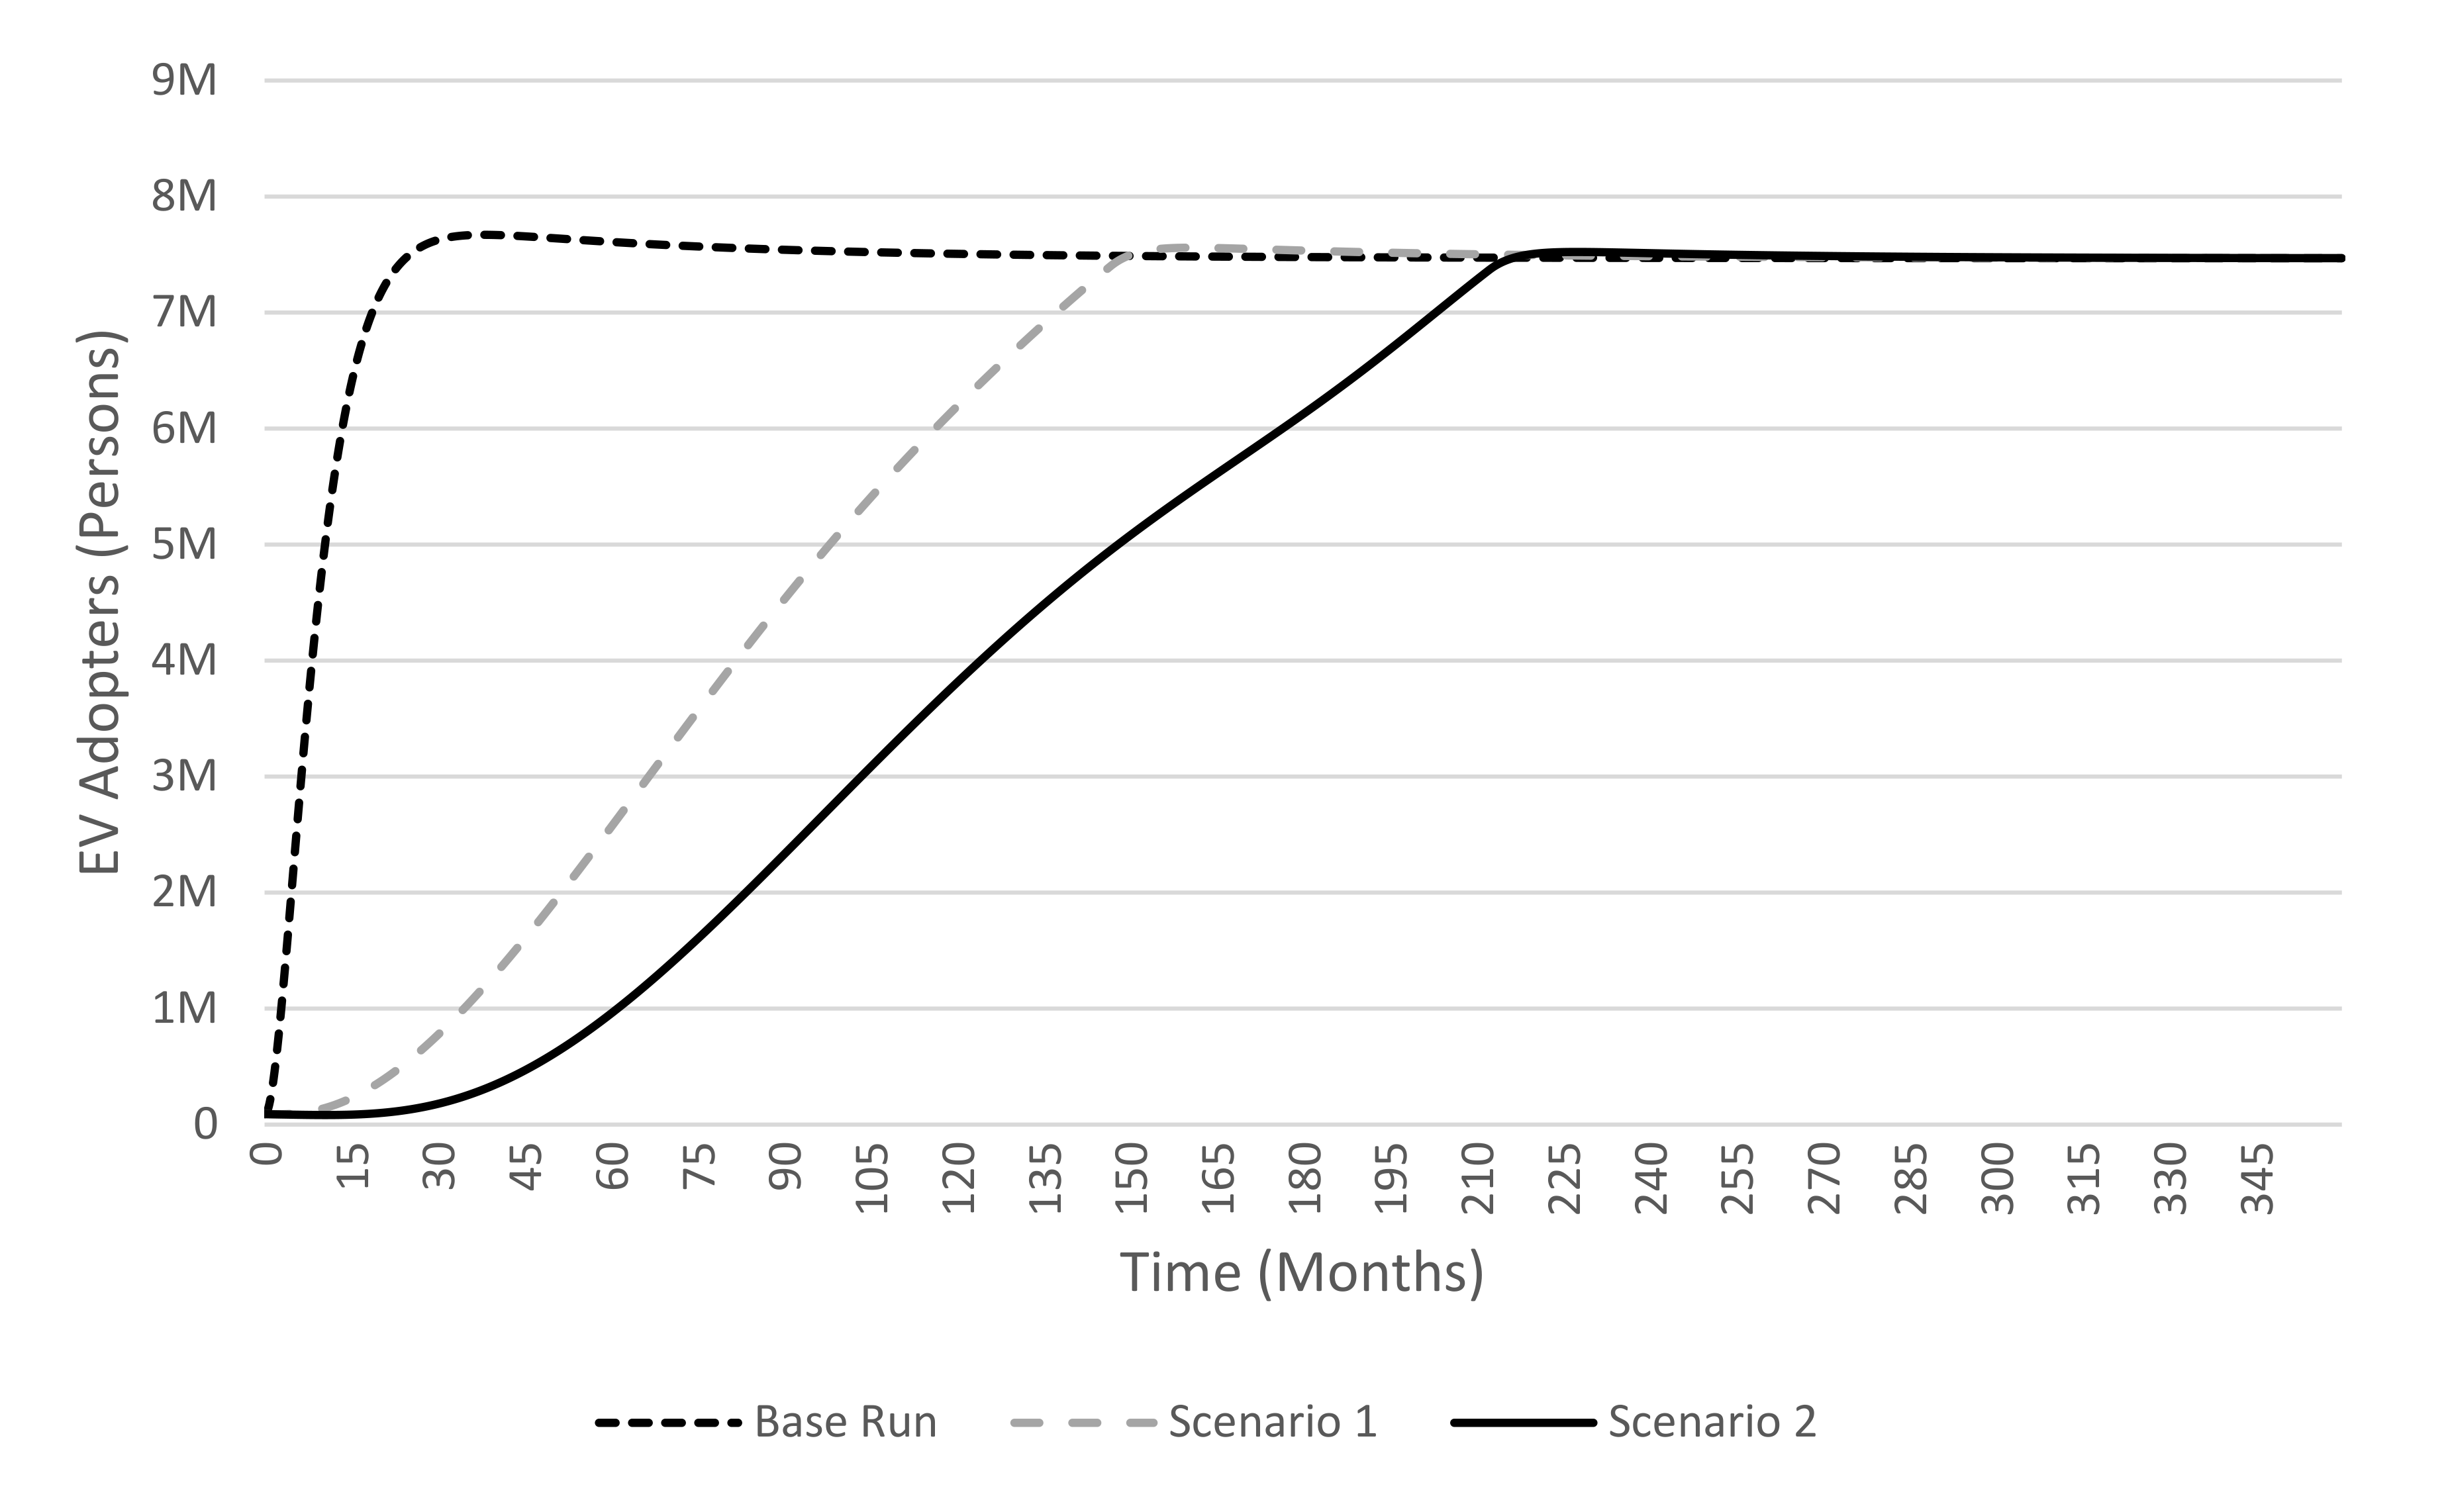
Figure 2 shows the base run scenario, in which the total group of EV adopters reaches a state of equilibrium, that is, the stabilization phase of EV adoption, where the rate of change is (close to) zero [96]; this equilibrium is reached in about two years. This adoption curve is, of course, not realistic. However, the dynamics show an S-shaped growth curve, with a very steep slope, which resonates with growth models of transition development in the literature, for example, [123,124].

4.2. Analysis of the Scenario Results

4.2.1. Scenario 1

In the first scenario, we consider the influence of the TIS macro-level variables on the basic EV adoption model. Figure 2 shows that the S-shaped growth behavior of EV Adopters is evidently slower than the growth we observed for the base run. This is the case because the balancing Regime Resistance loop (loop B.2) moderates the exponential growth of EV adoption driven by the reinforcing loops (i.e., loop R.1 and R.3).

4.2.2. Scenario 2

For the second scenario, we add UTAUT as the micro-level theory to our model. This implies we extend the model with several entity types described earlier. Here, we specifically assume that all potential purchasers follow the same decision-making rules for adopting EVs. The resulting scenario in Figure 2 thus shows a slower growth of EV adopters compared to the first scenario. This deceleration of EV adoption can be attributed to the interaction of macro-and micro-level variables. More specifically, this slowing down of the adoption curve arises from the balancing loops B.1 and B.3 and the reinforcing loops R.2 and R.4. The balancing loops are stronger here than the reinforcing ones, which explains the differences in scenarios 1 and 2 in Figure 2.
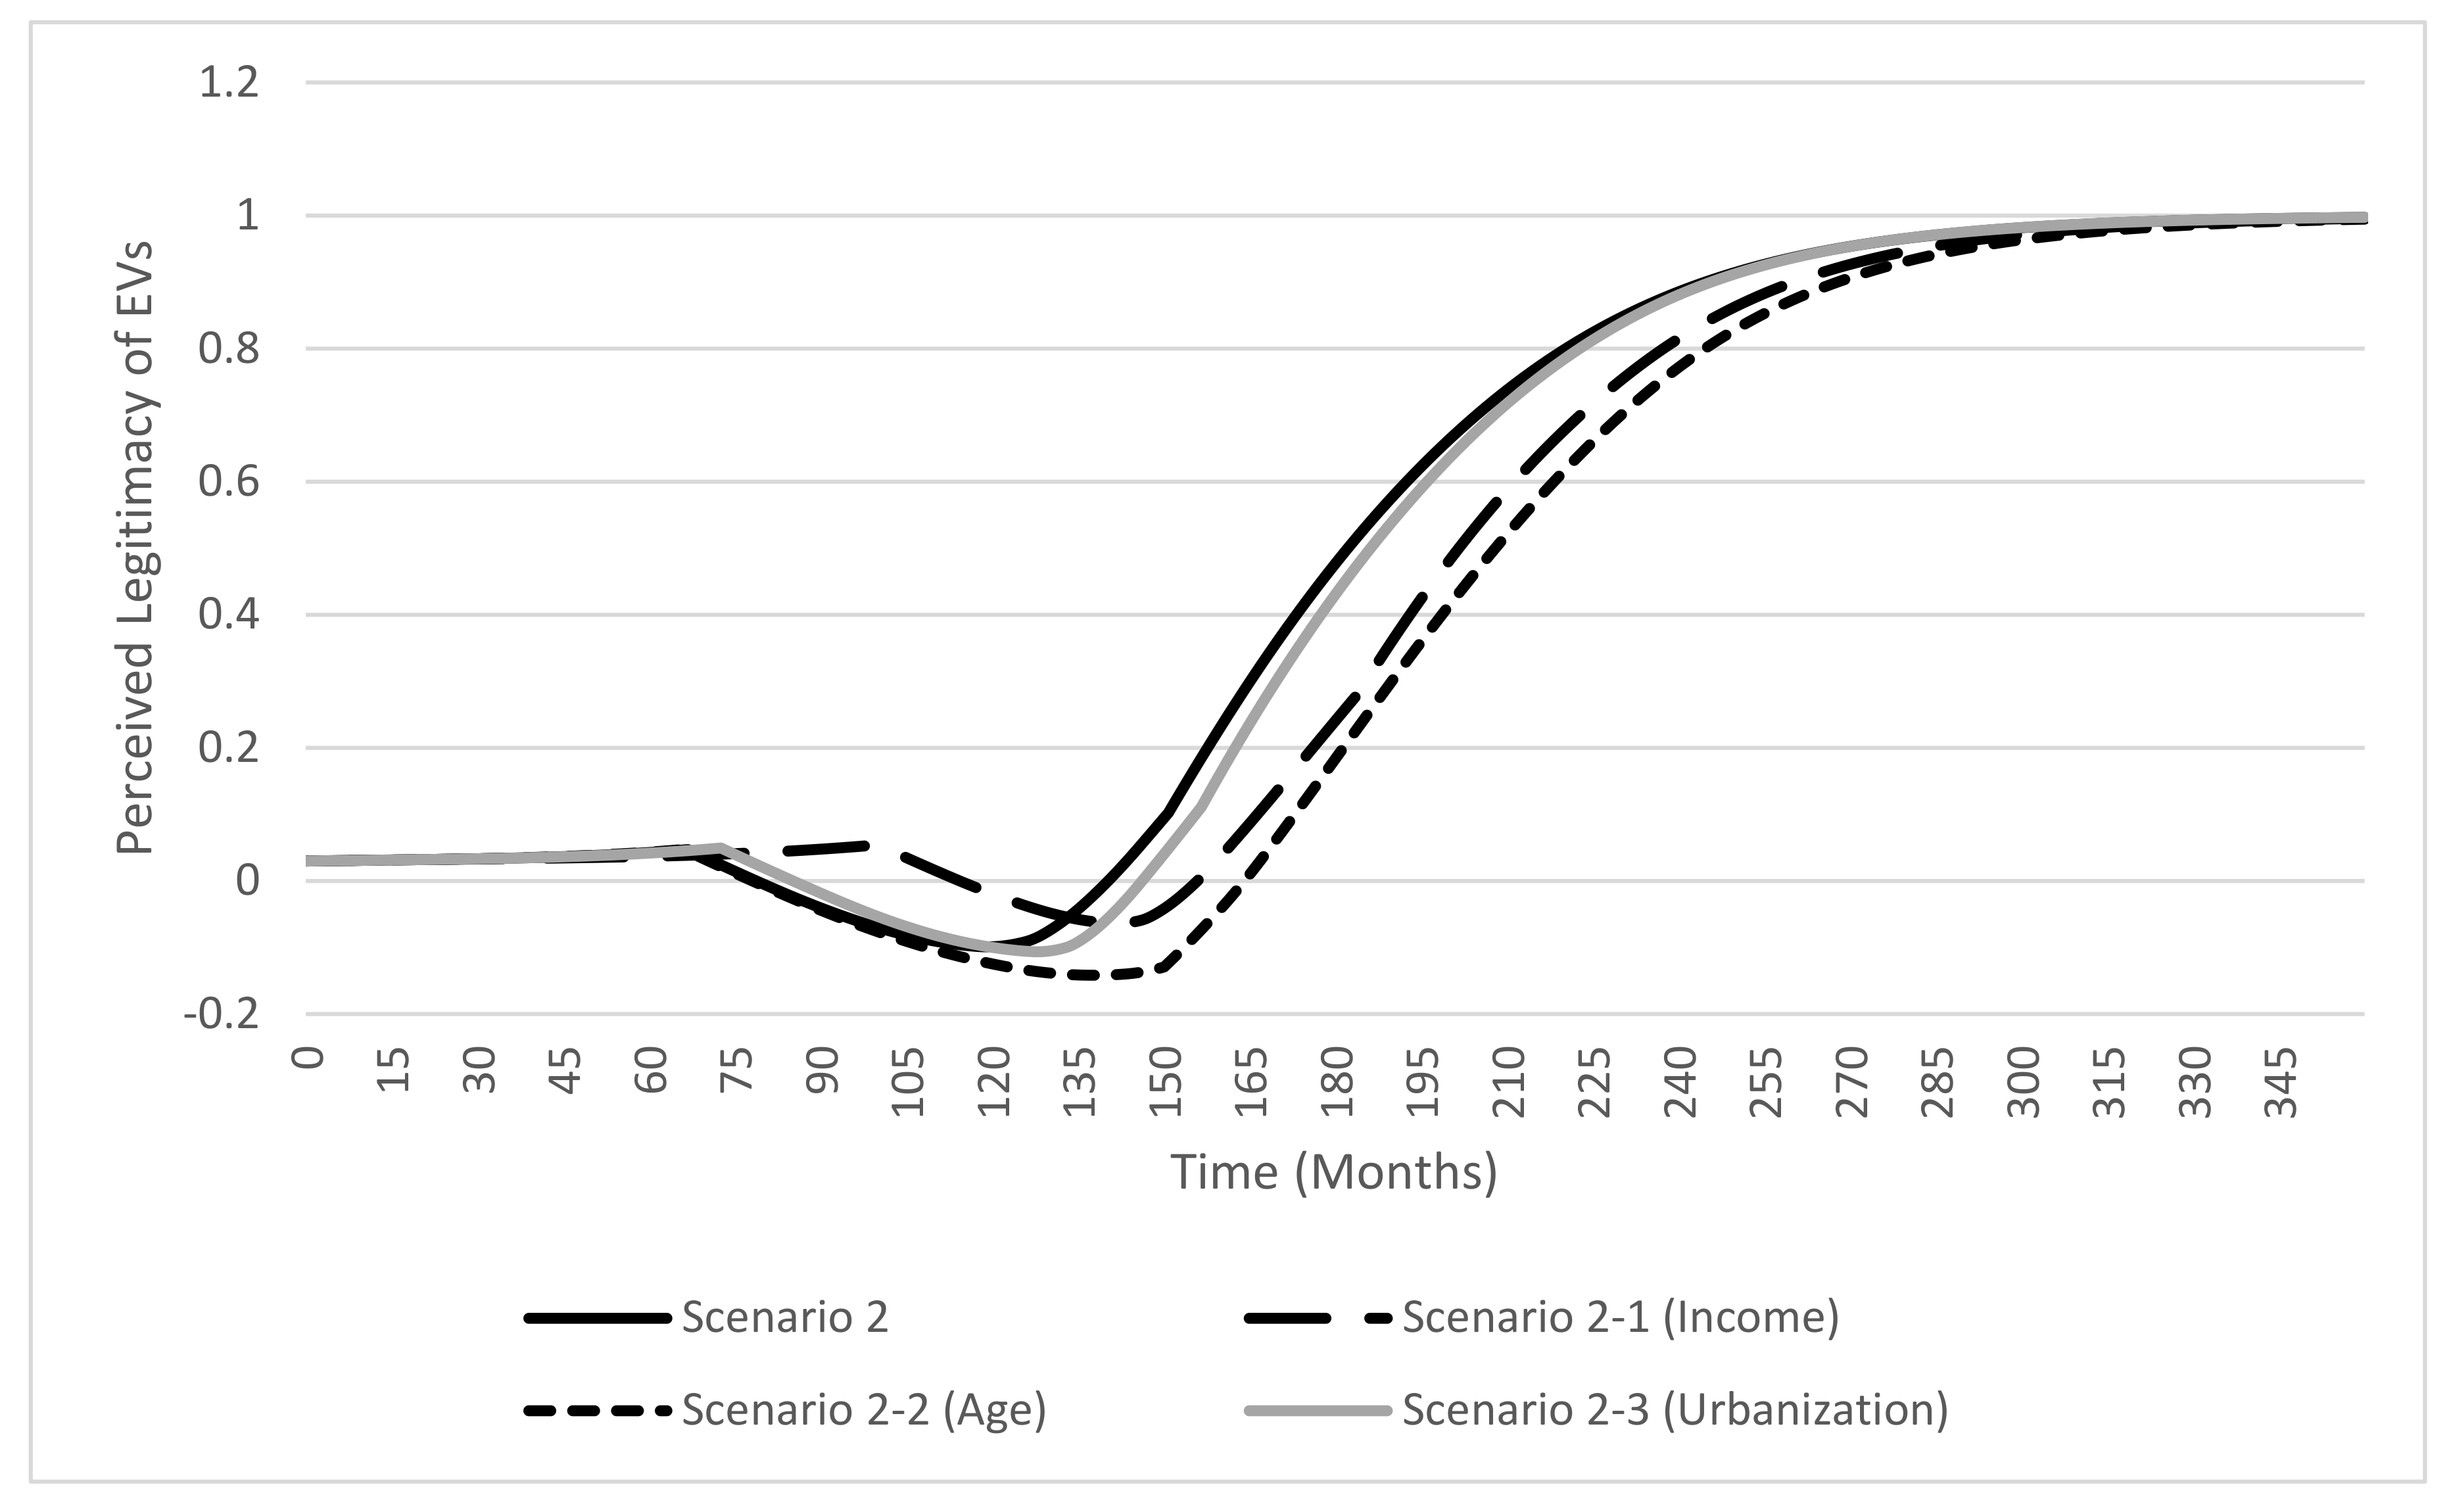
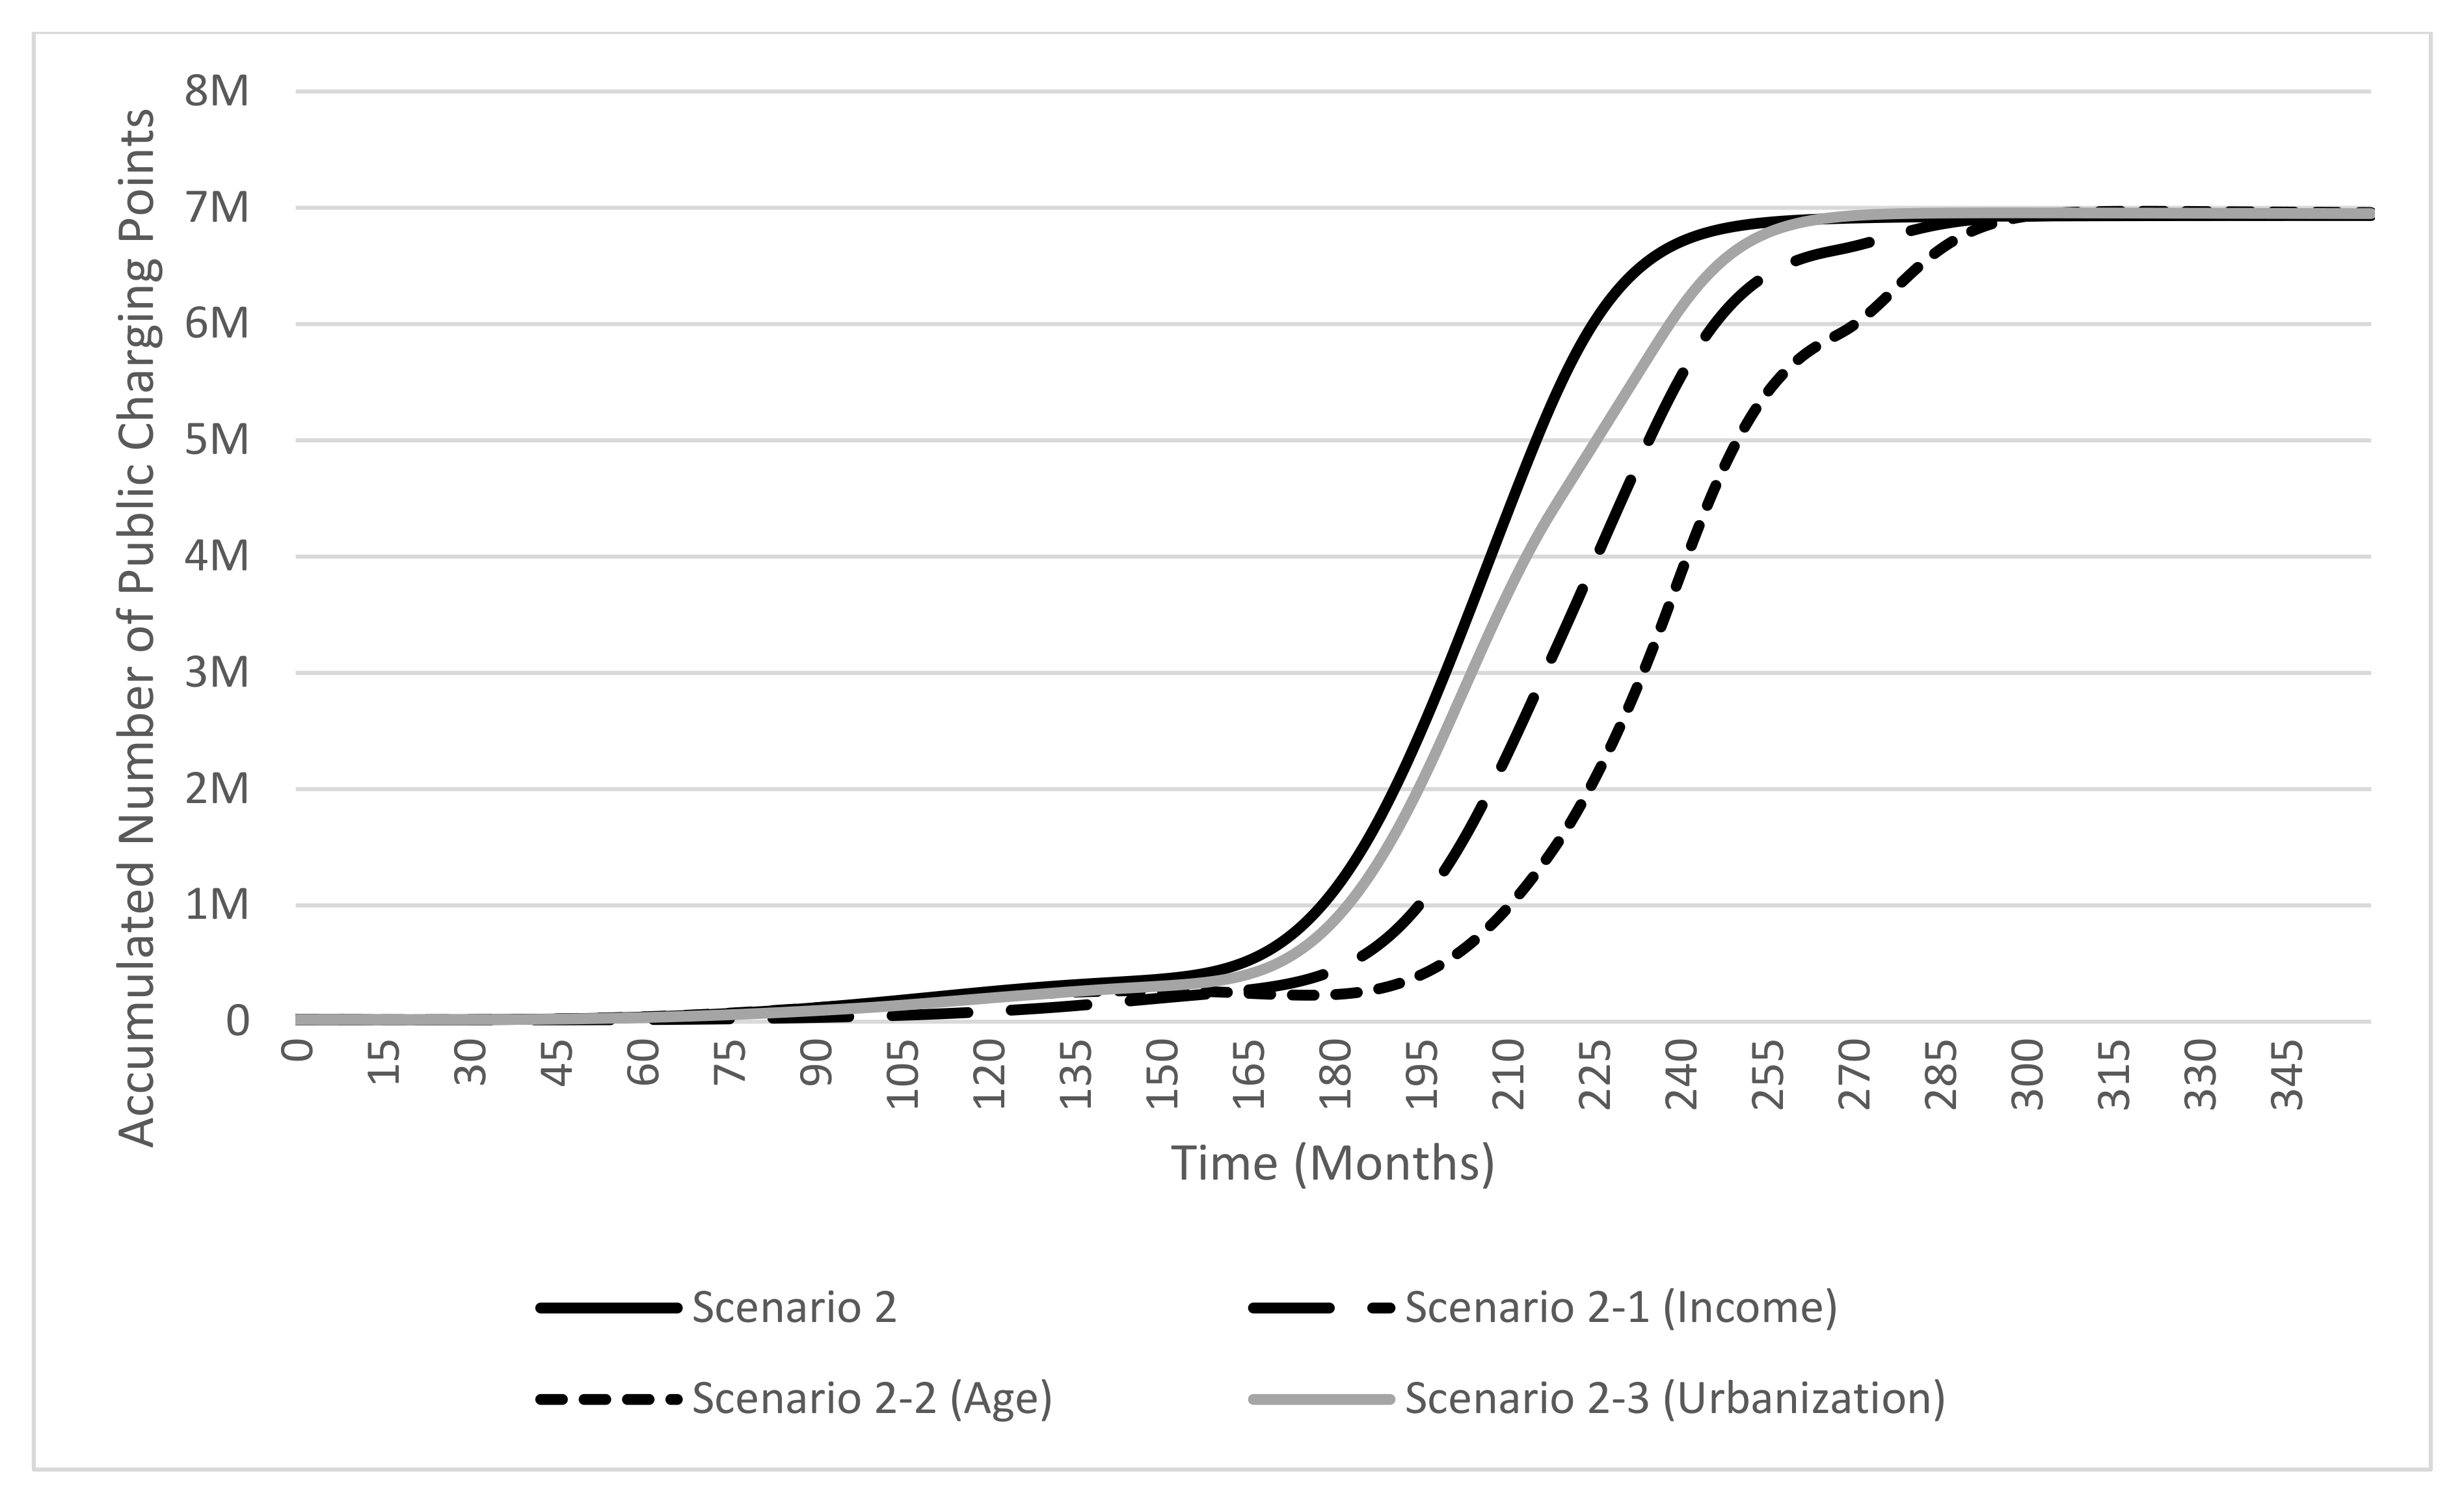
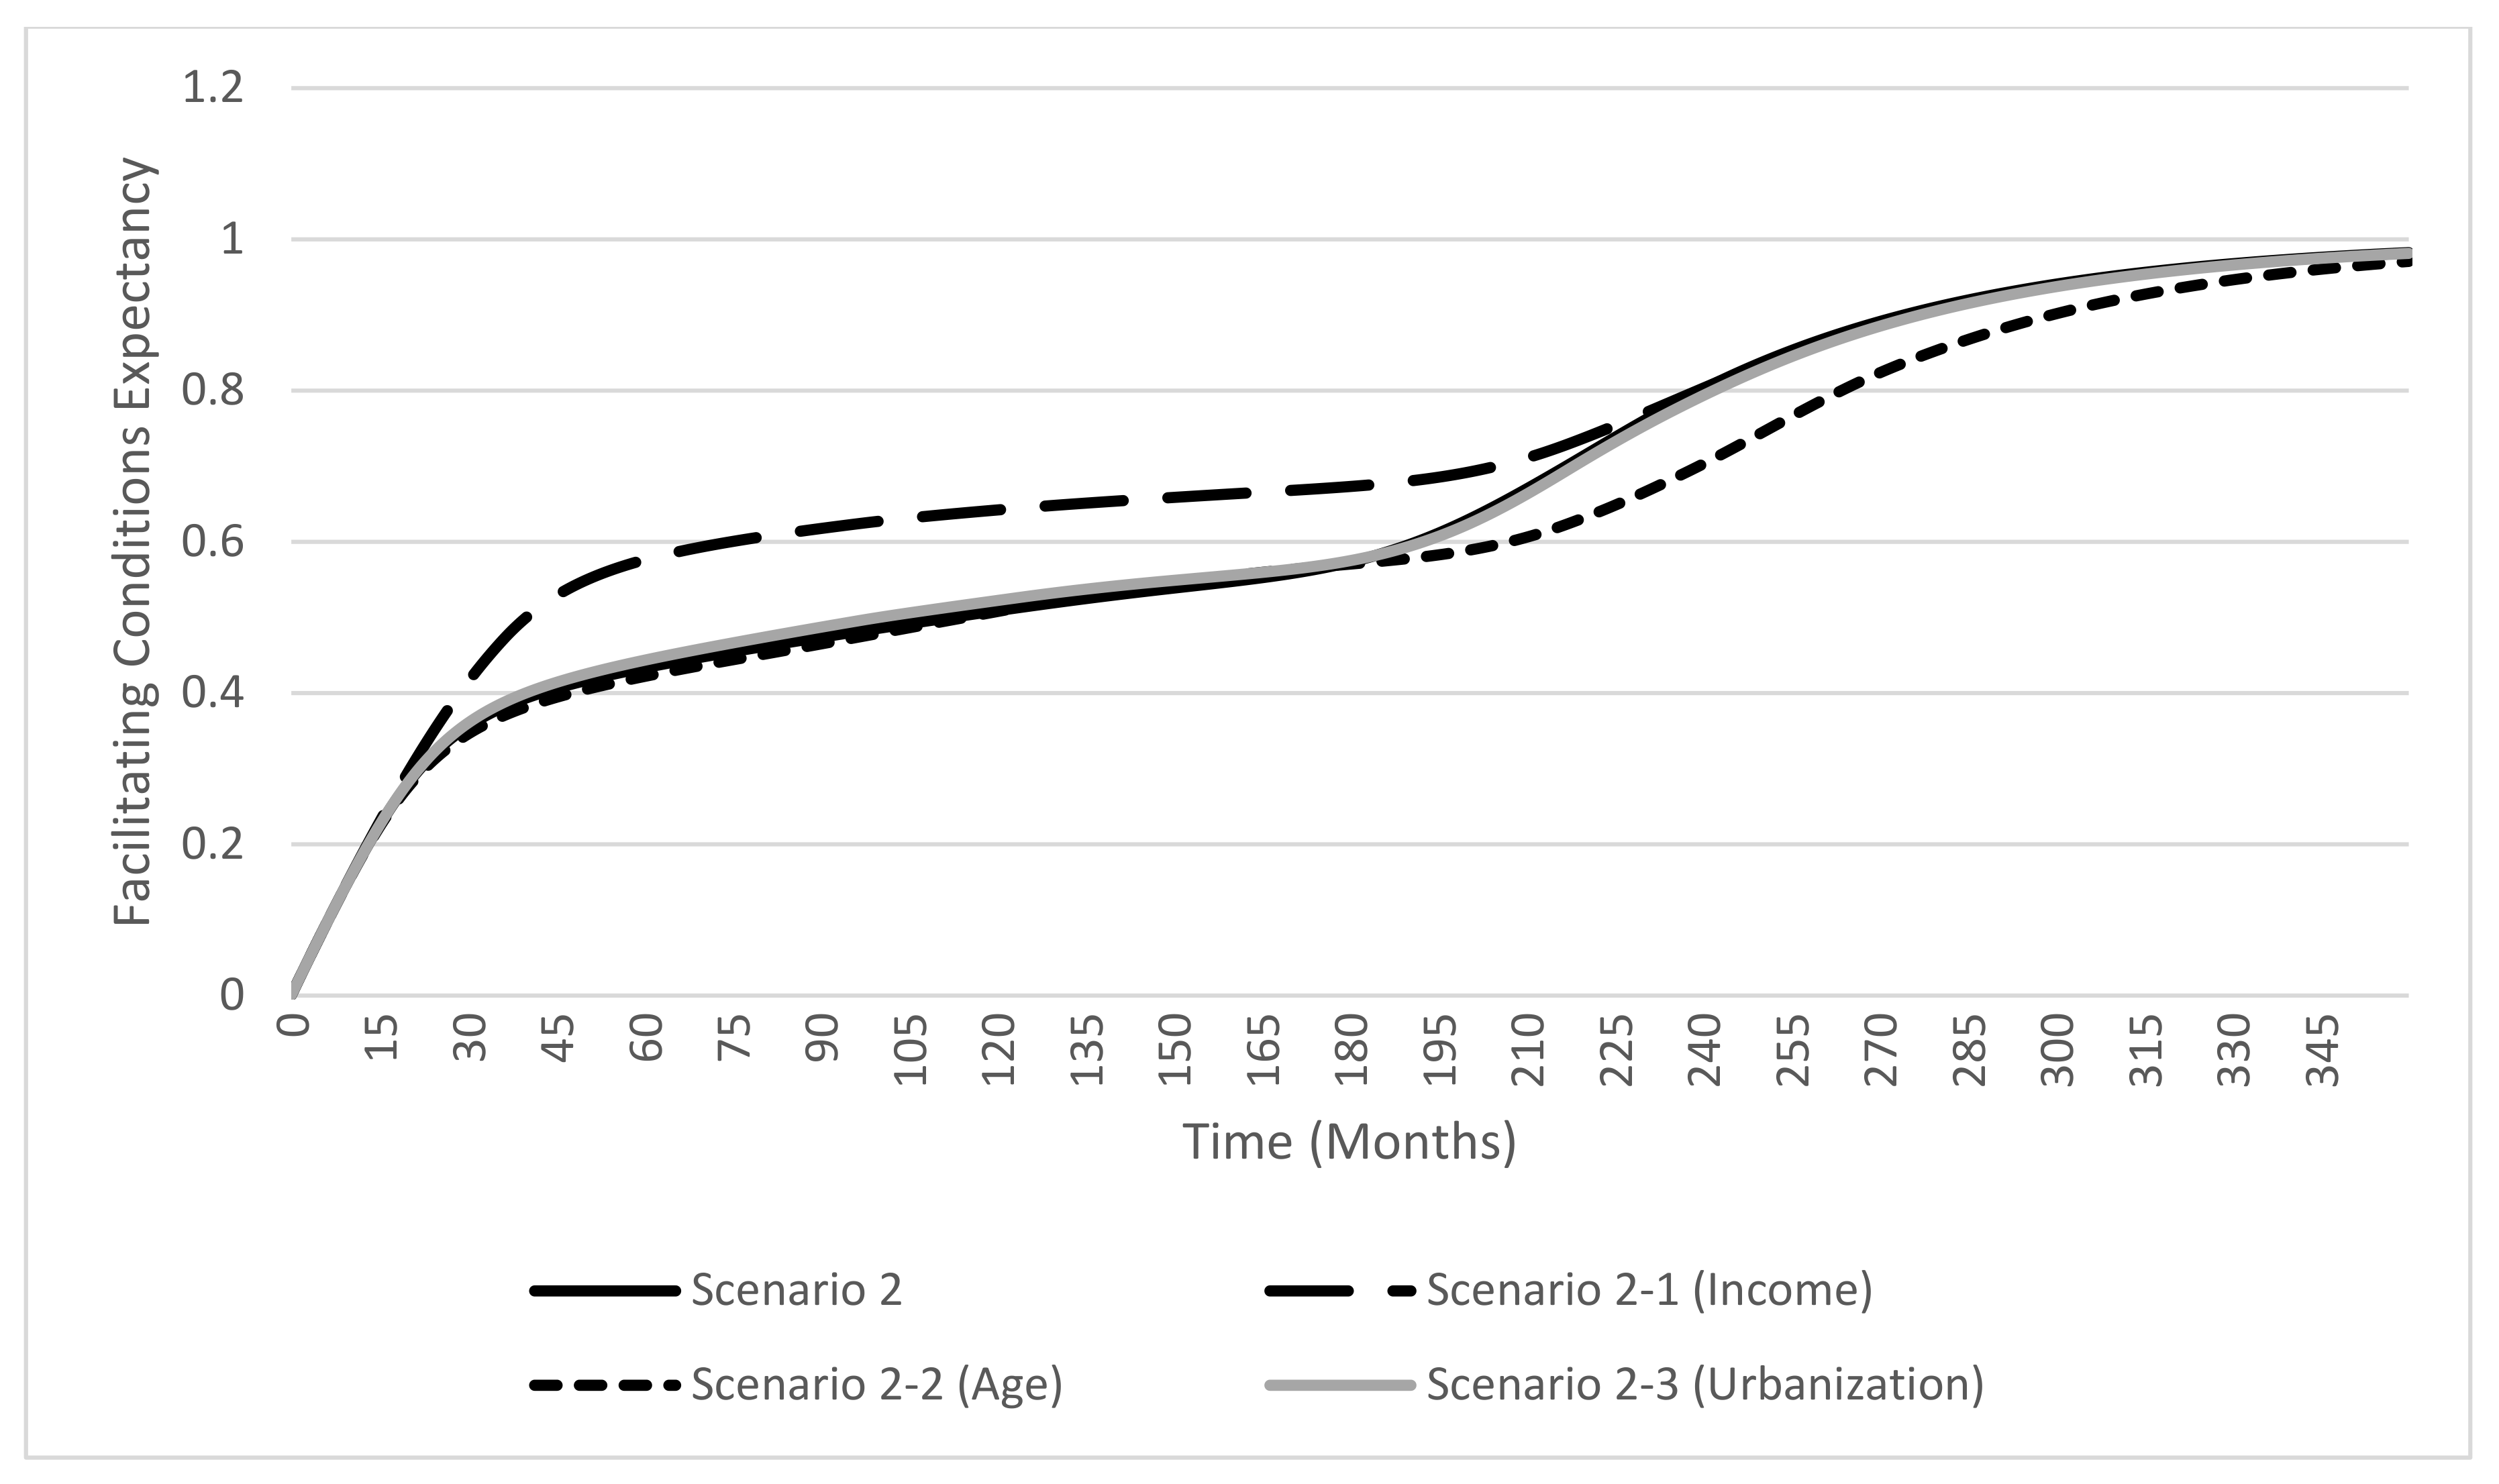
Figure 3 illustrates the Perceived Legitimacy of EVs for scenario 2—which increases over time (see Scenario 2 in this figure), but only after a dip during a rather long period because of the Sailing Ship Effect (see Section 3.2.1). Furthermore, Figure 4 indicates that the number of charging points grows over time, which can be explained from the reinforcing Entrepreneurial Learning loop (R.3): see scenario 2 in this figure. In addition, Figure 5 shows the increase of Facilitating Conditions Expectancy, resulting from the Entrepreneurial Learning loop R.3. We will turn to the other scenarios in Figure 3, Figure 4 and Figure 5 later.

4.2.3. Scenarios 2-1, 2-2, and 2-3

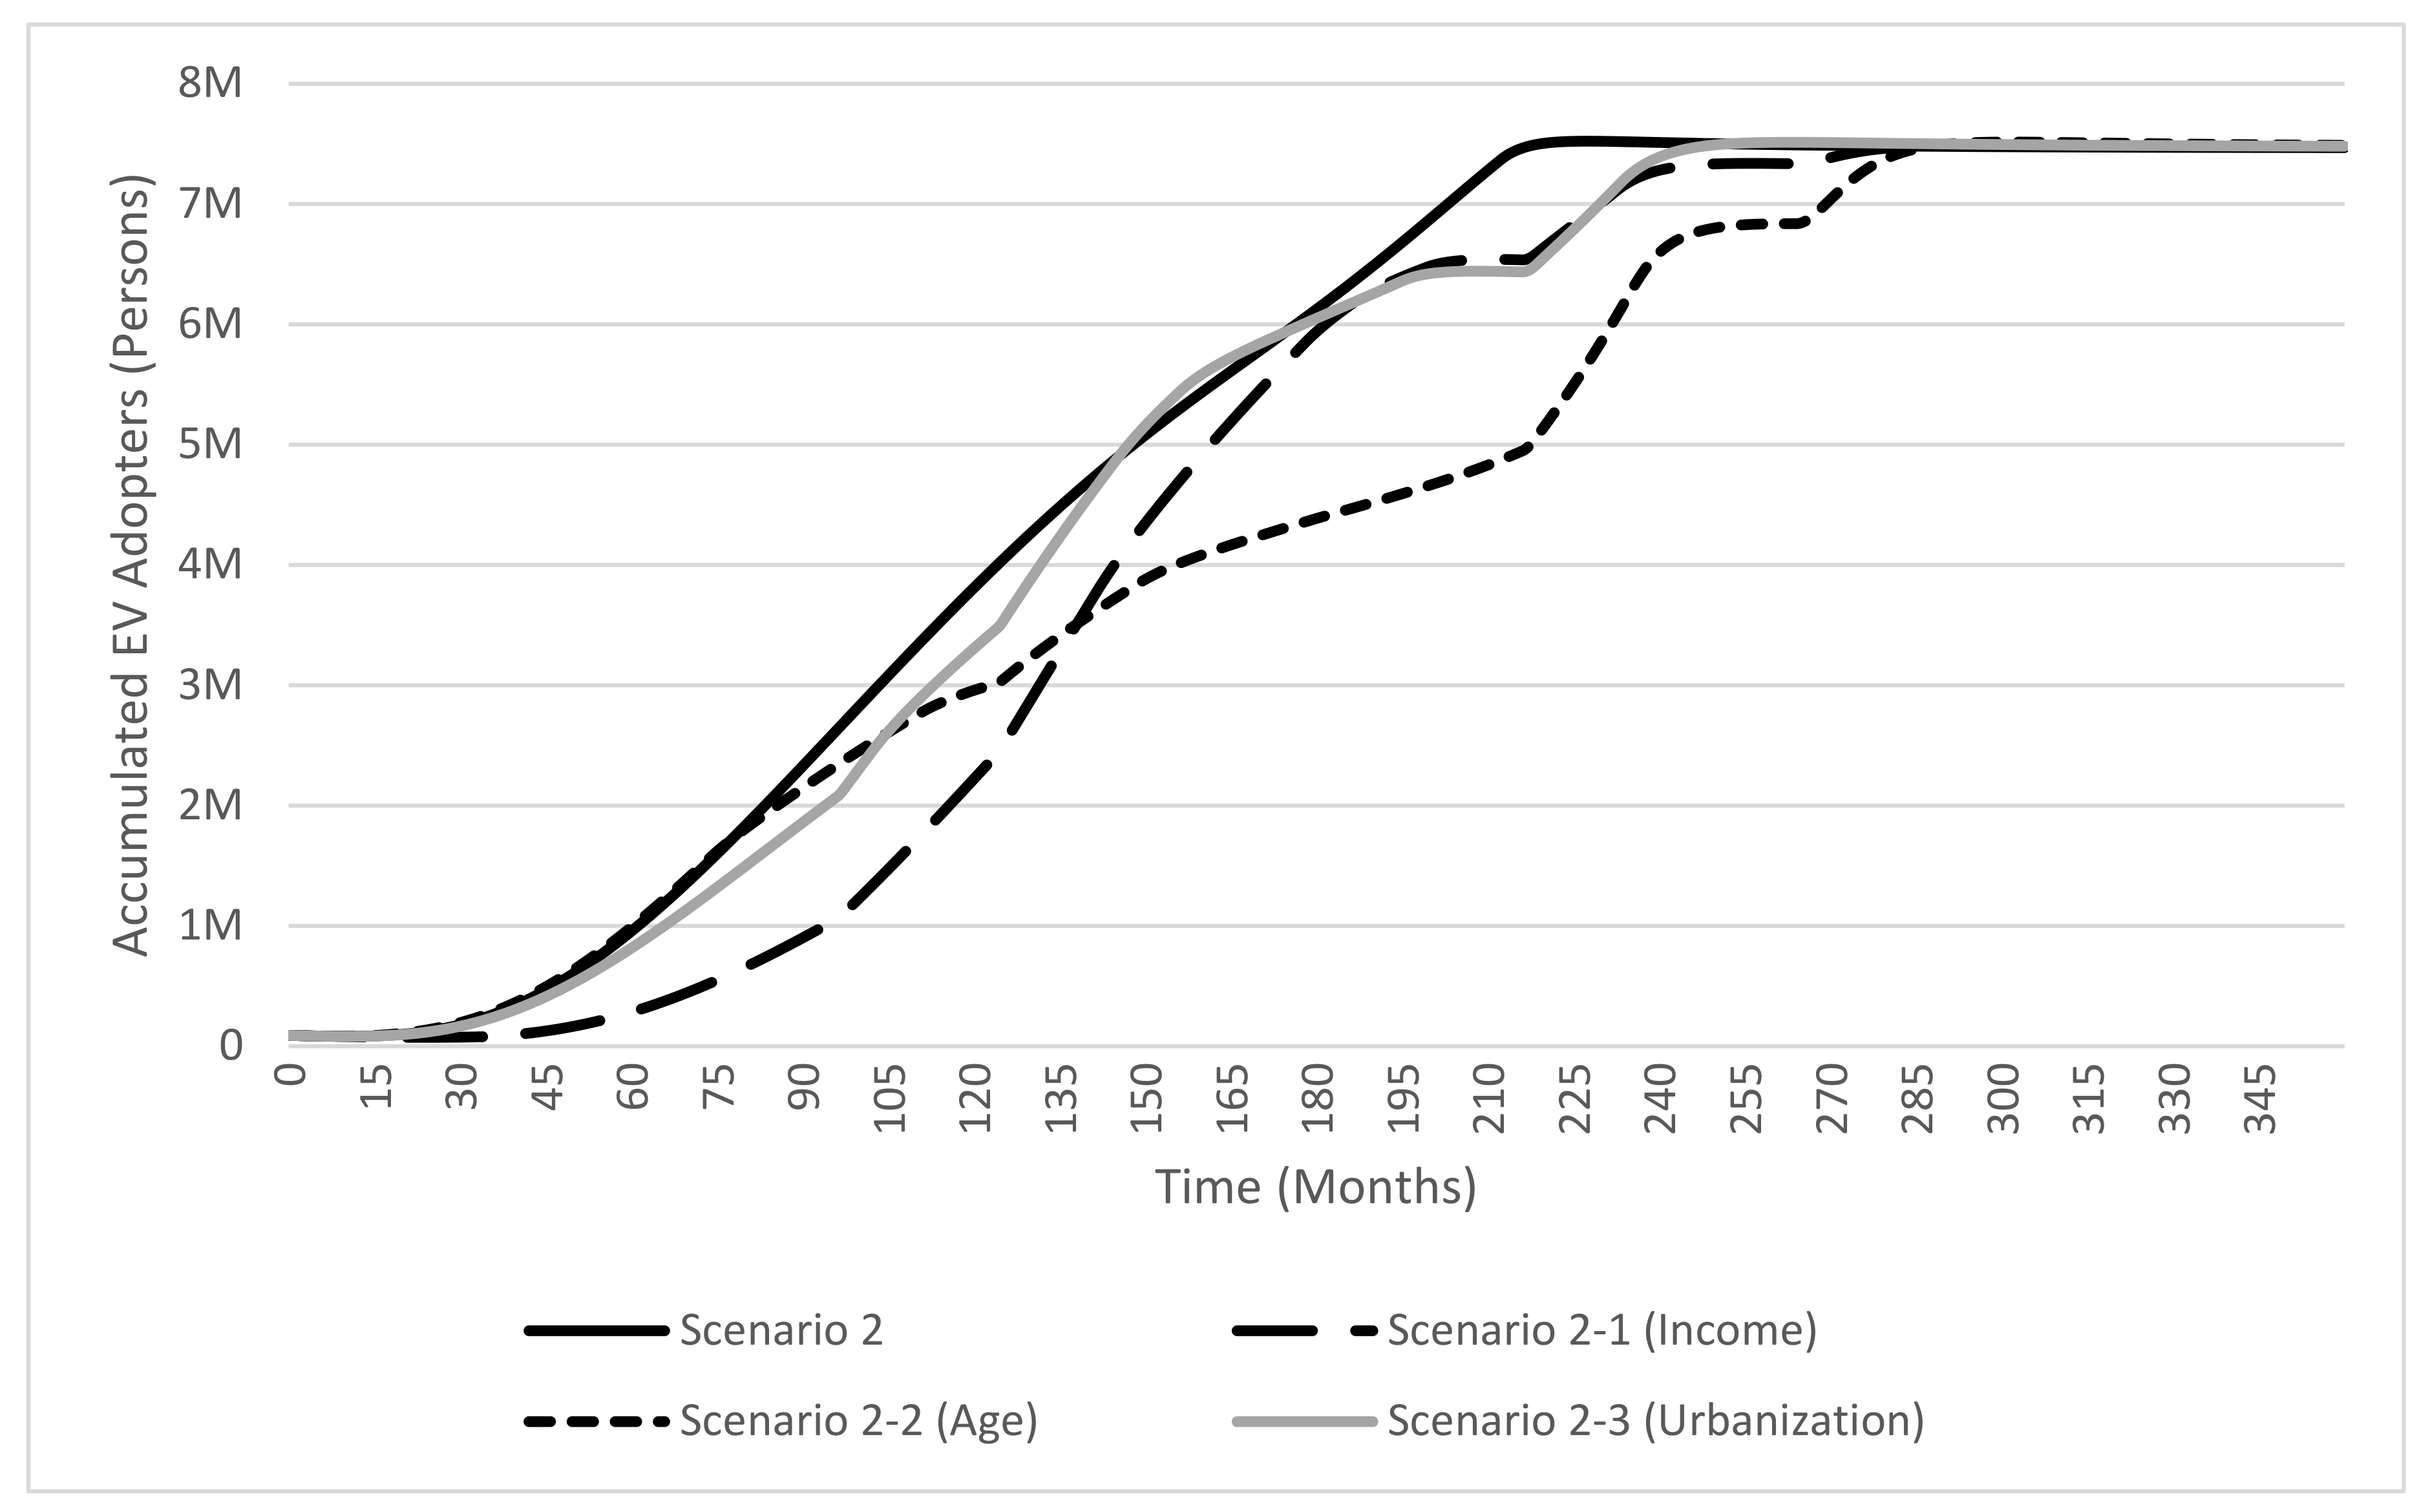
We now turn to scenarios 2-1, 2-2, and 2-3. Figure 6 depicts the development of the total number of EV adopters in these three scenarios, compared to scenario 2. It is evident that the overall growth of EV adoption in these three scenarios is slower than in scenario 2, in which the whole population is assumed to behave as early adopters. More specifically, the stabilization phase is reached after (approximately) 220, 250, 280, and 290 months in scenario 2, the urbanization scenario, income scenario, and age scenario. This figure also implies that market segmentation based on income leads to the slowest progress in the early phases of EV development (i.e., pre-development and take-off phases). In this respect, scenario 2-1 assumes that a smaller population (i.e., purchasers in higher-income classes) is more likely to buy EV in these early phases. By contrast, the age scenario 2-2 shows a steep adoption curve in the first six years but then slows down strongly, compared to all other scenarios. This scenario assumes that the likelihood of buying an EV is greater for young or middle-aged groups (see Section 3.3).
However, in the breakthrough phase (as of months 140–150), the behavior of the income scenario increasingly converges with scenario 2, while the development of the age scenario increasingly diverges from scenario 2. The former effect occurs because of the desirability of the UTAUT variables, such as the EV price value, increases—especially among the remaining potential purchasers, such as people with middle and low incomes who are adopting EVs for the first time. As such, more people will be inclined to buy EVs. Consequently, the speed of EV adoption in different (low) income classes increases because the desirability of the UTAUT variables does not grow significantly among the remaining potential adopters (i.e., persons aged over 50 who adopt EVs for the first time). In these age groups, the main determinant for EV adoption is assumed to be Performance and Effort Expectancy, as described earlier. Therefore, the transition toward EVs will be slower compared to the other second scenarios, and subsequently, the stabilization phase will also be reached much later.
We also found different growth patterns in the perceptions of EV legitimacy. Figure 3 suggests the Sailing Ship Effect begins later in scenario 2-1 (i.e., market segmentation by income classes) than in the other scenarios. In this respect, in scenario 2-1, the growth of EV adopters lags behind. As such, the threshold for triggering the Sailing Ship Effect is reached later. Notably, the duration and timing of the Sailing Ship Effect are rather similar in the three other scenarios in Figure 3. However, the Perceived Legitimacy in the age scenario 2-2 is rather negative for a longer period of time (i.e., around 100 months). Here, in the pre-development and take-off phases, the total number of EV adopters is experiencing the slowest growth, and therefore it takes more time to counteract the Sailing Ship Effect by increasing the visibility of EVs on the road.
Furthermore, Figure 4 illustrates the trend in the Public Charging Points in the four runs of the second scenario. Typically, the installation of charging points depends on the number of EV Adopters. As mentioned for income scenario 2-1, the number of EV adopters in the pre-development and take-off phases is lower than the other three scenarios in Figure 4. Consequently, there is less pressure to install charging points in this period. In the breakthrough phase, the growth of EV adoption is accelerated, and one can expect this phase to start earlier in the urbanization scenario than in the income and age scenarios.
Figure 5 shows the development of Facilitating Conditions Expectancy over time. It is evident that in the early period of EV development, this expectancy is significantly higher in the income scenario than in the other scenarios in Figure 5. Here, the slow progress of EV adoption in this early period requires a smaller number of charging points to meet the demands of EVs on the roads. In the underlying equations in this part of our model, the desired number of charging points is specified using a table function in which the increase of EV Adopters implies a decreasing number of desired charging points (in an exponentially decreasing trend). Accordingly, in the income scenario, a lower number of charging points is sufficient to serve EV users. Subsequently, this charging point shortfall is filled earlier, and, as a result, the Facilitating Conditions and Facilitating Conditions Expectancy in scenario 2-1 increase as well. However, in the remaining period of the transition, the number of charging points in the age scenario 2-2 grows at a decreasing rate compared to the three other scenarios in Figure 5.
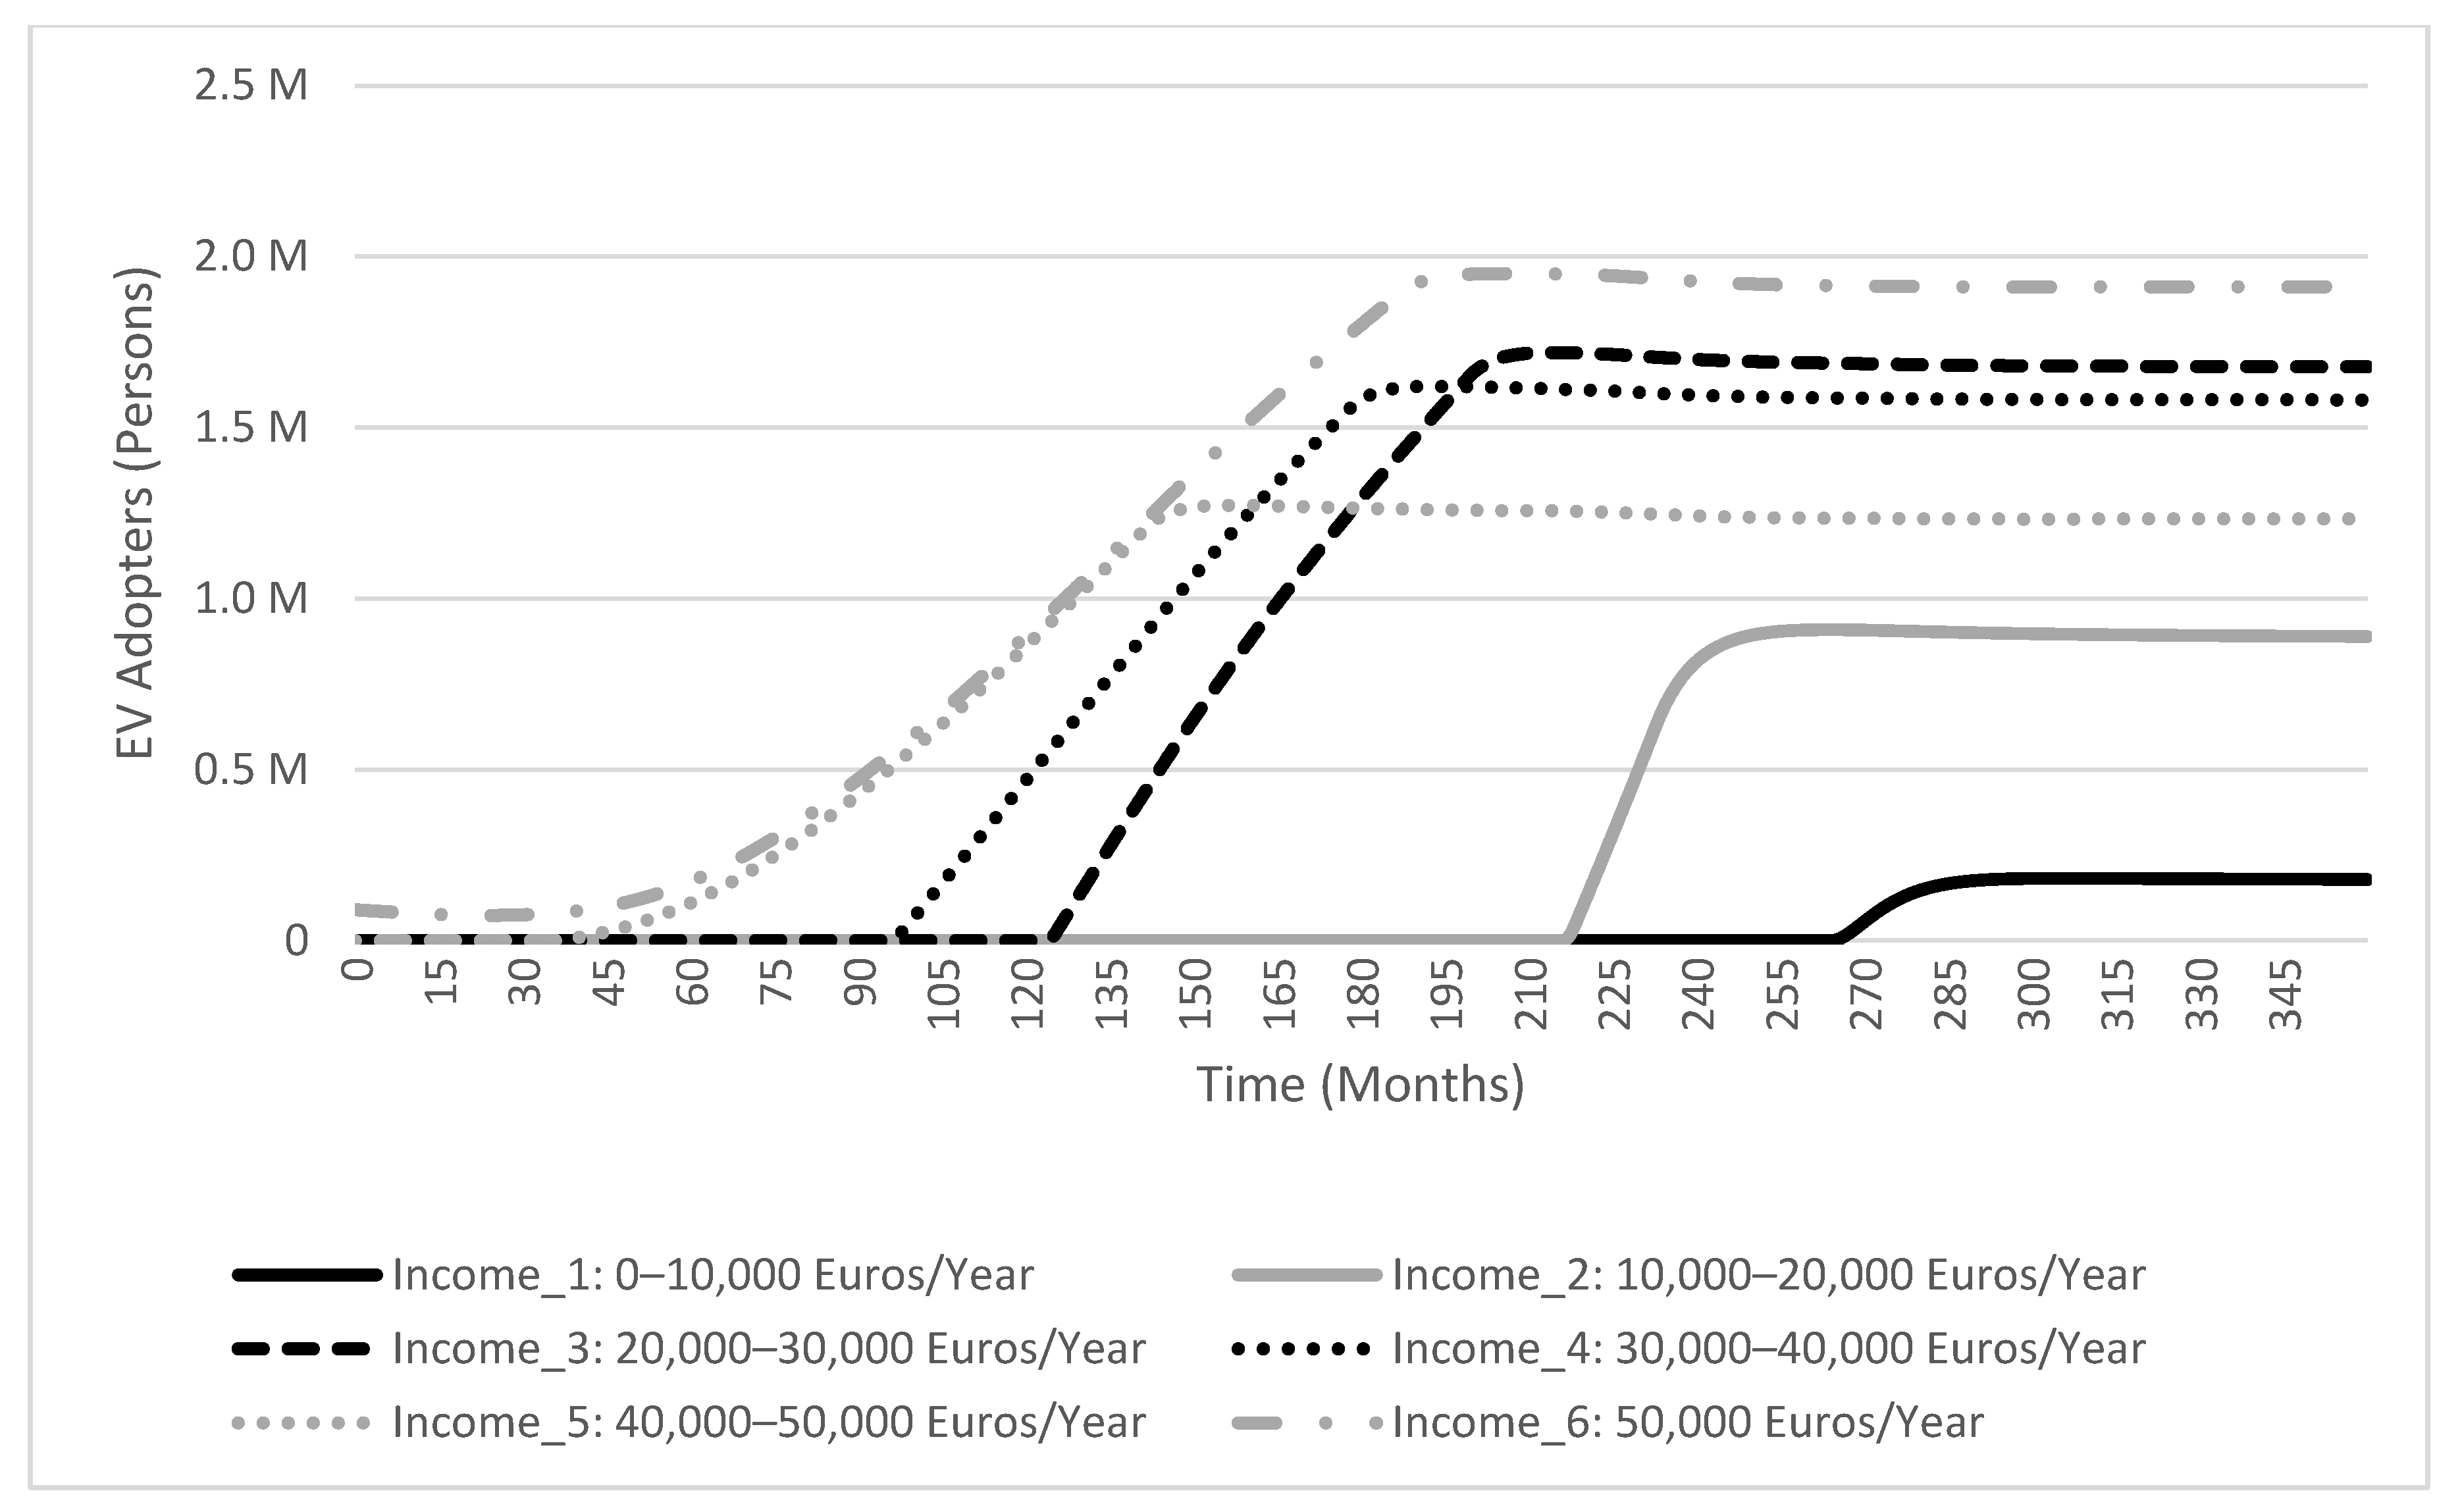
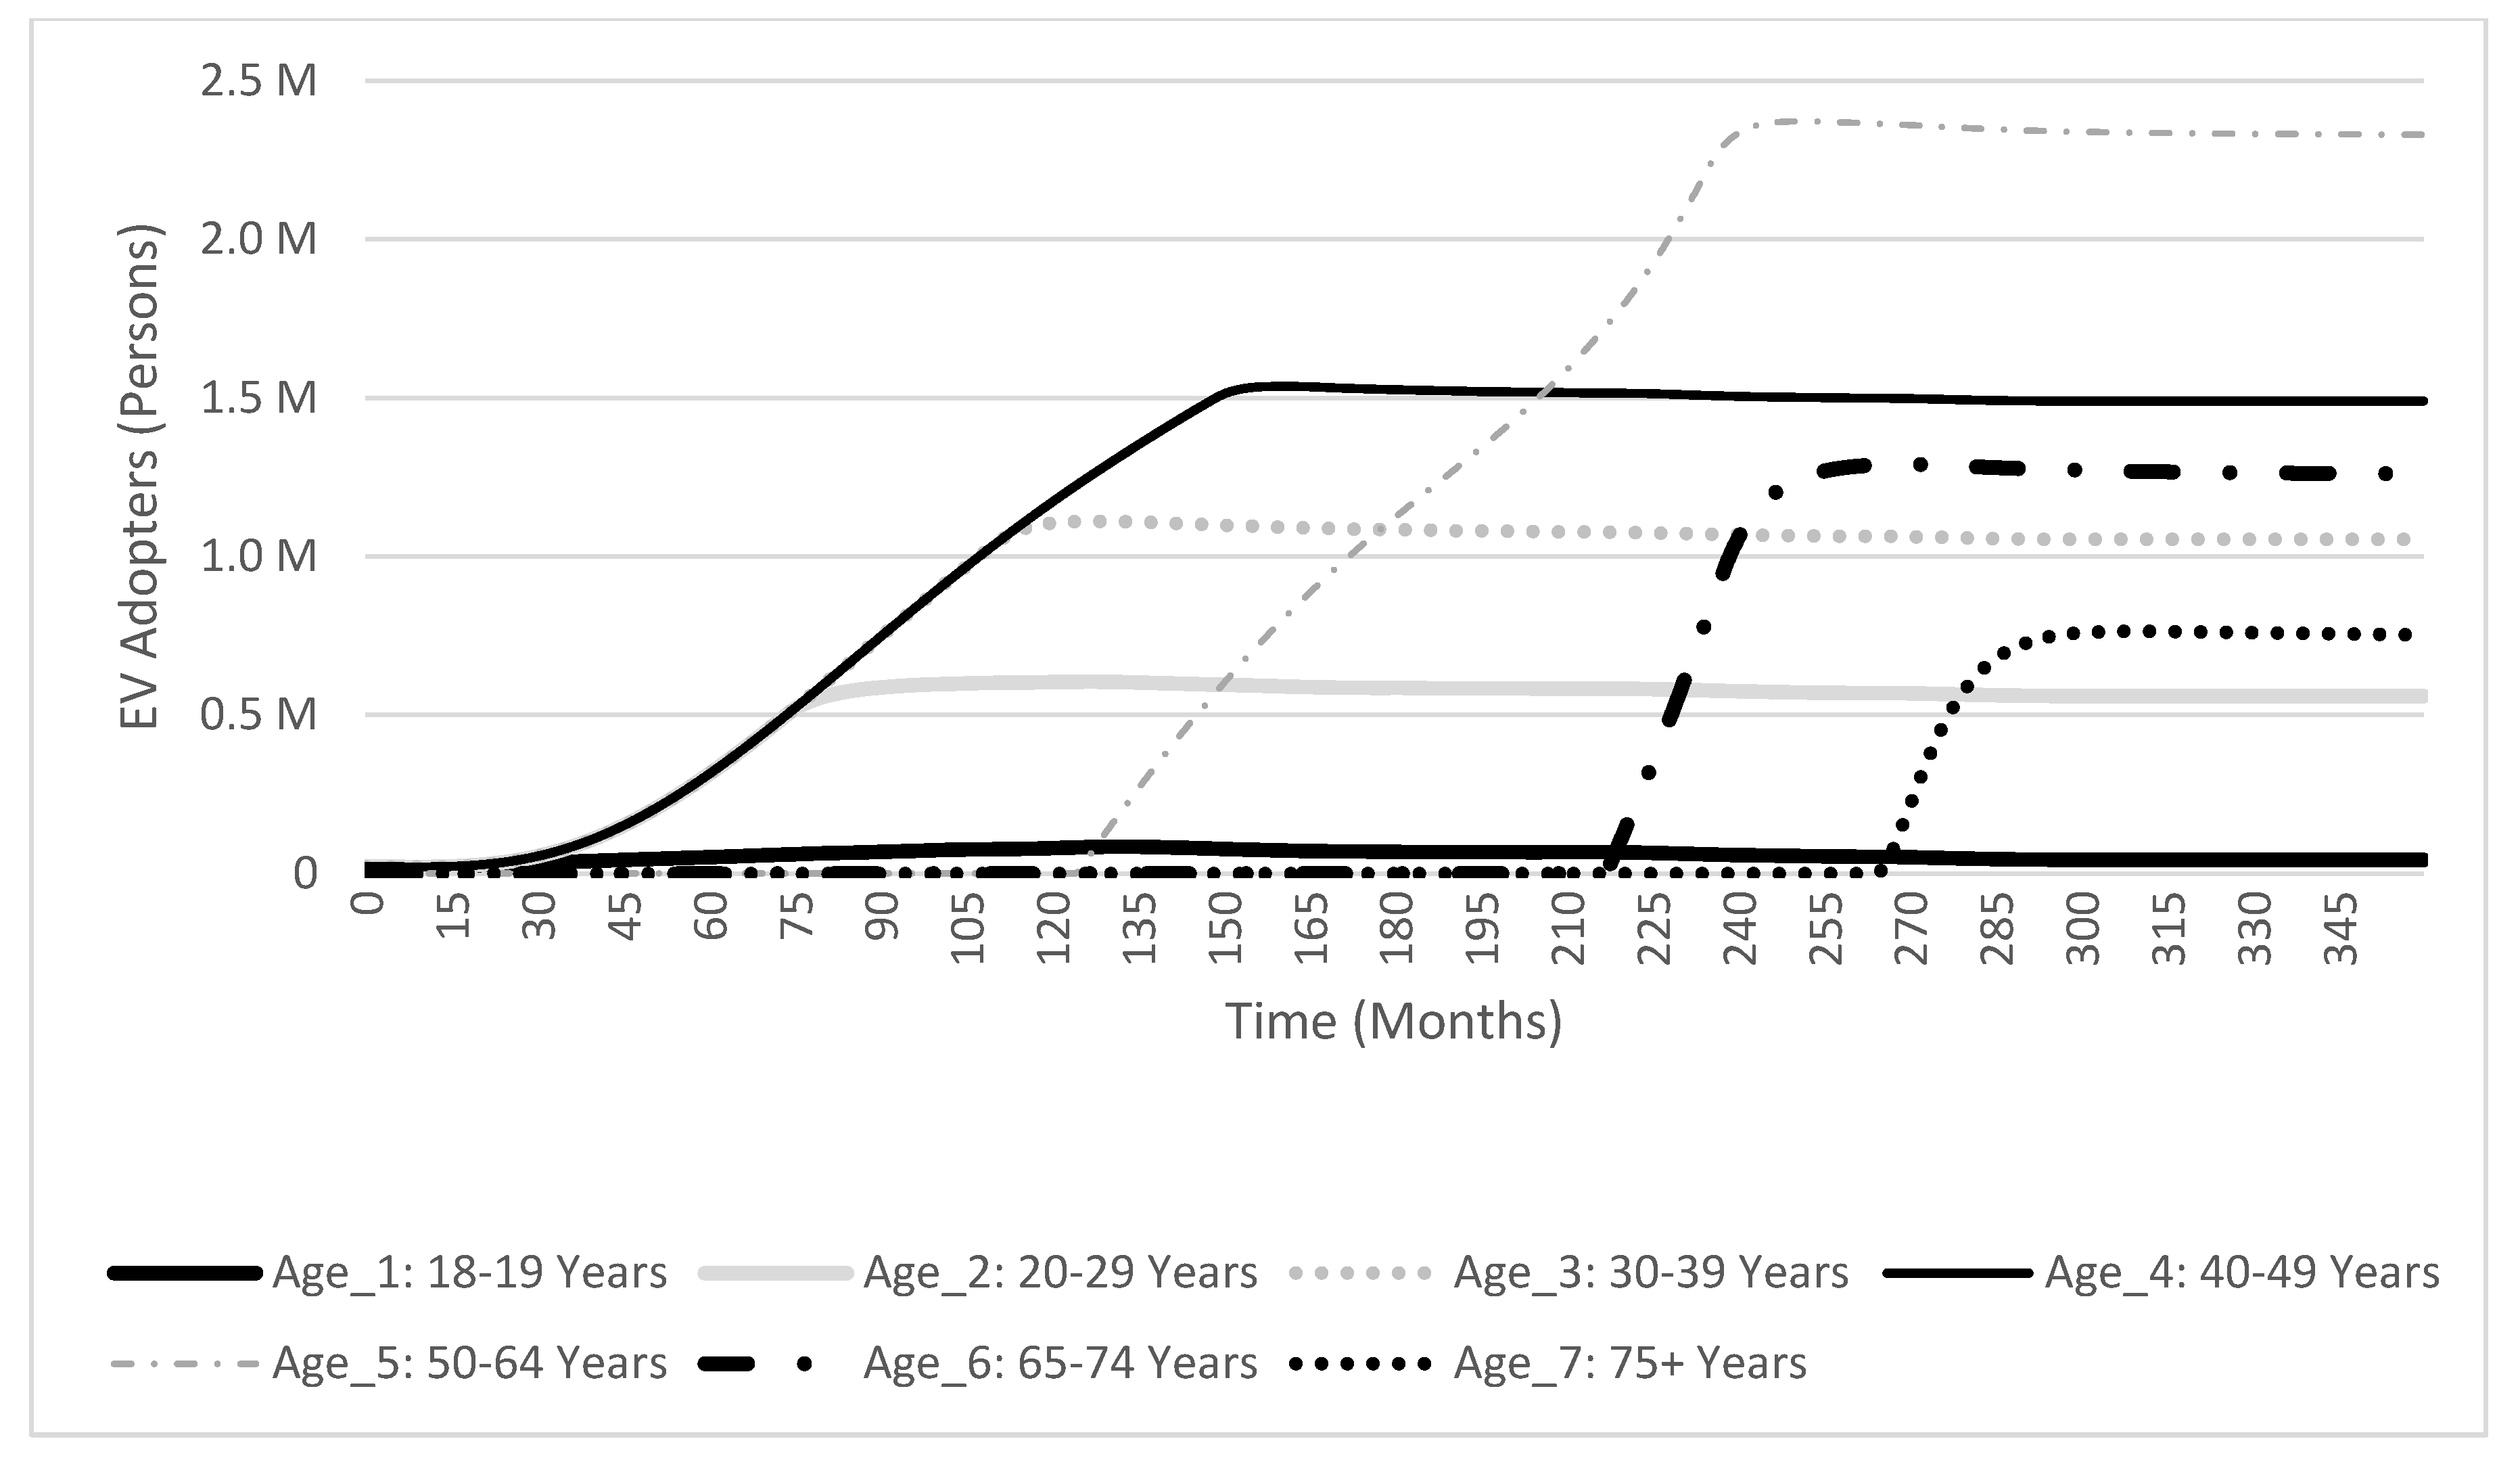
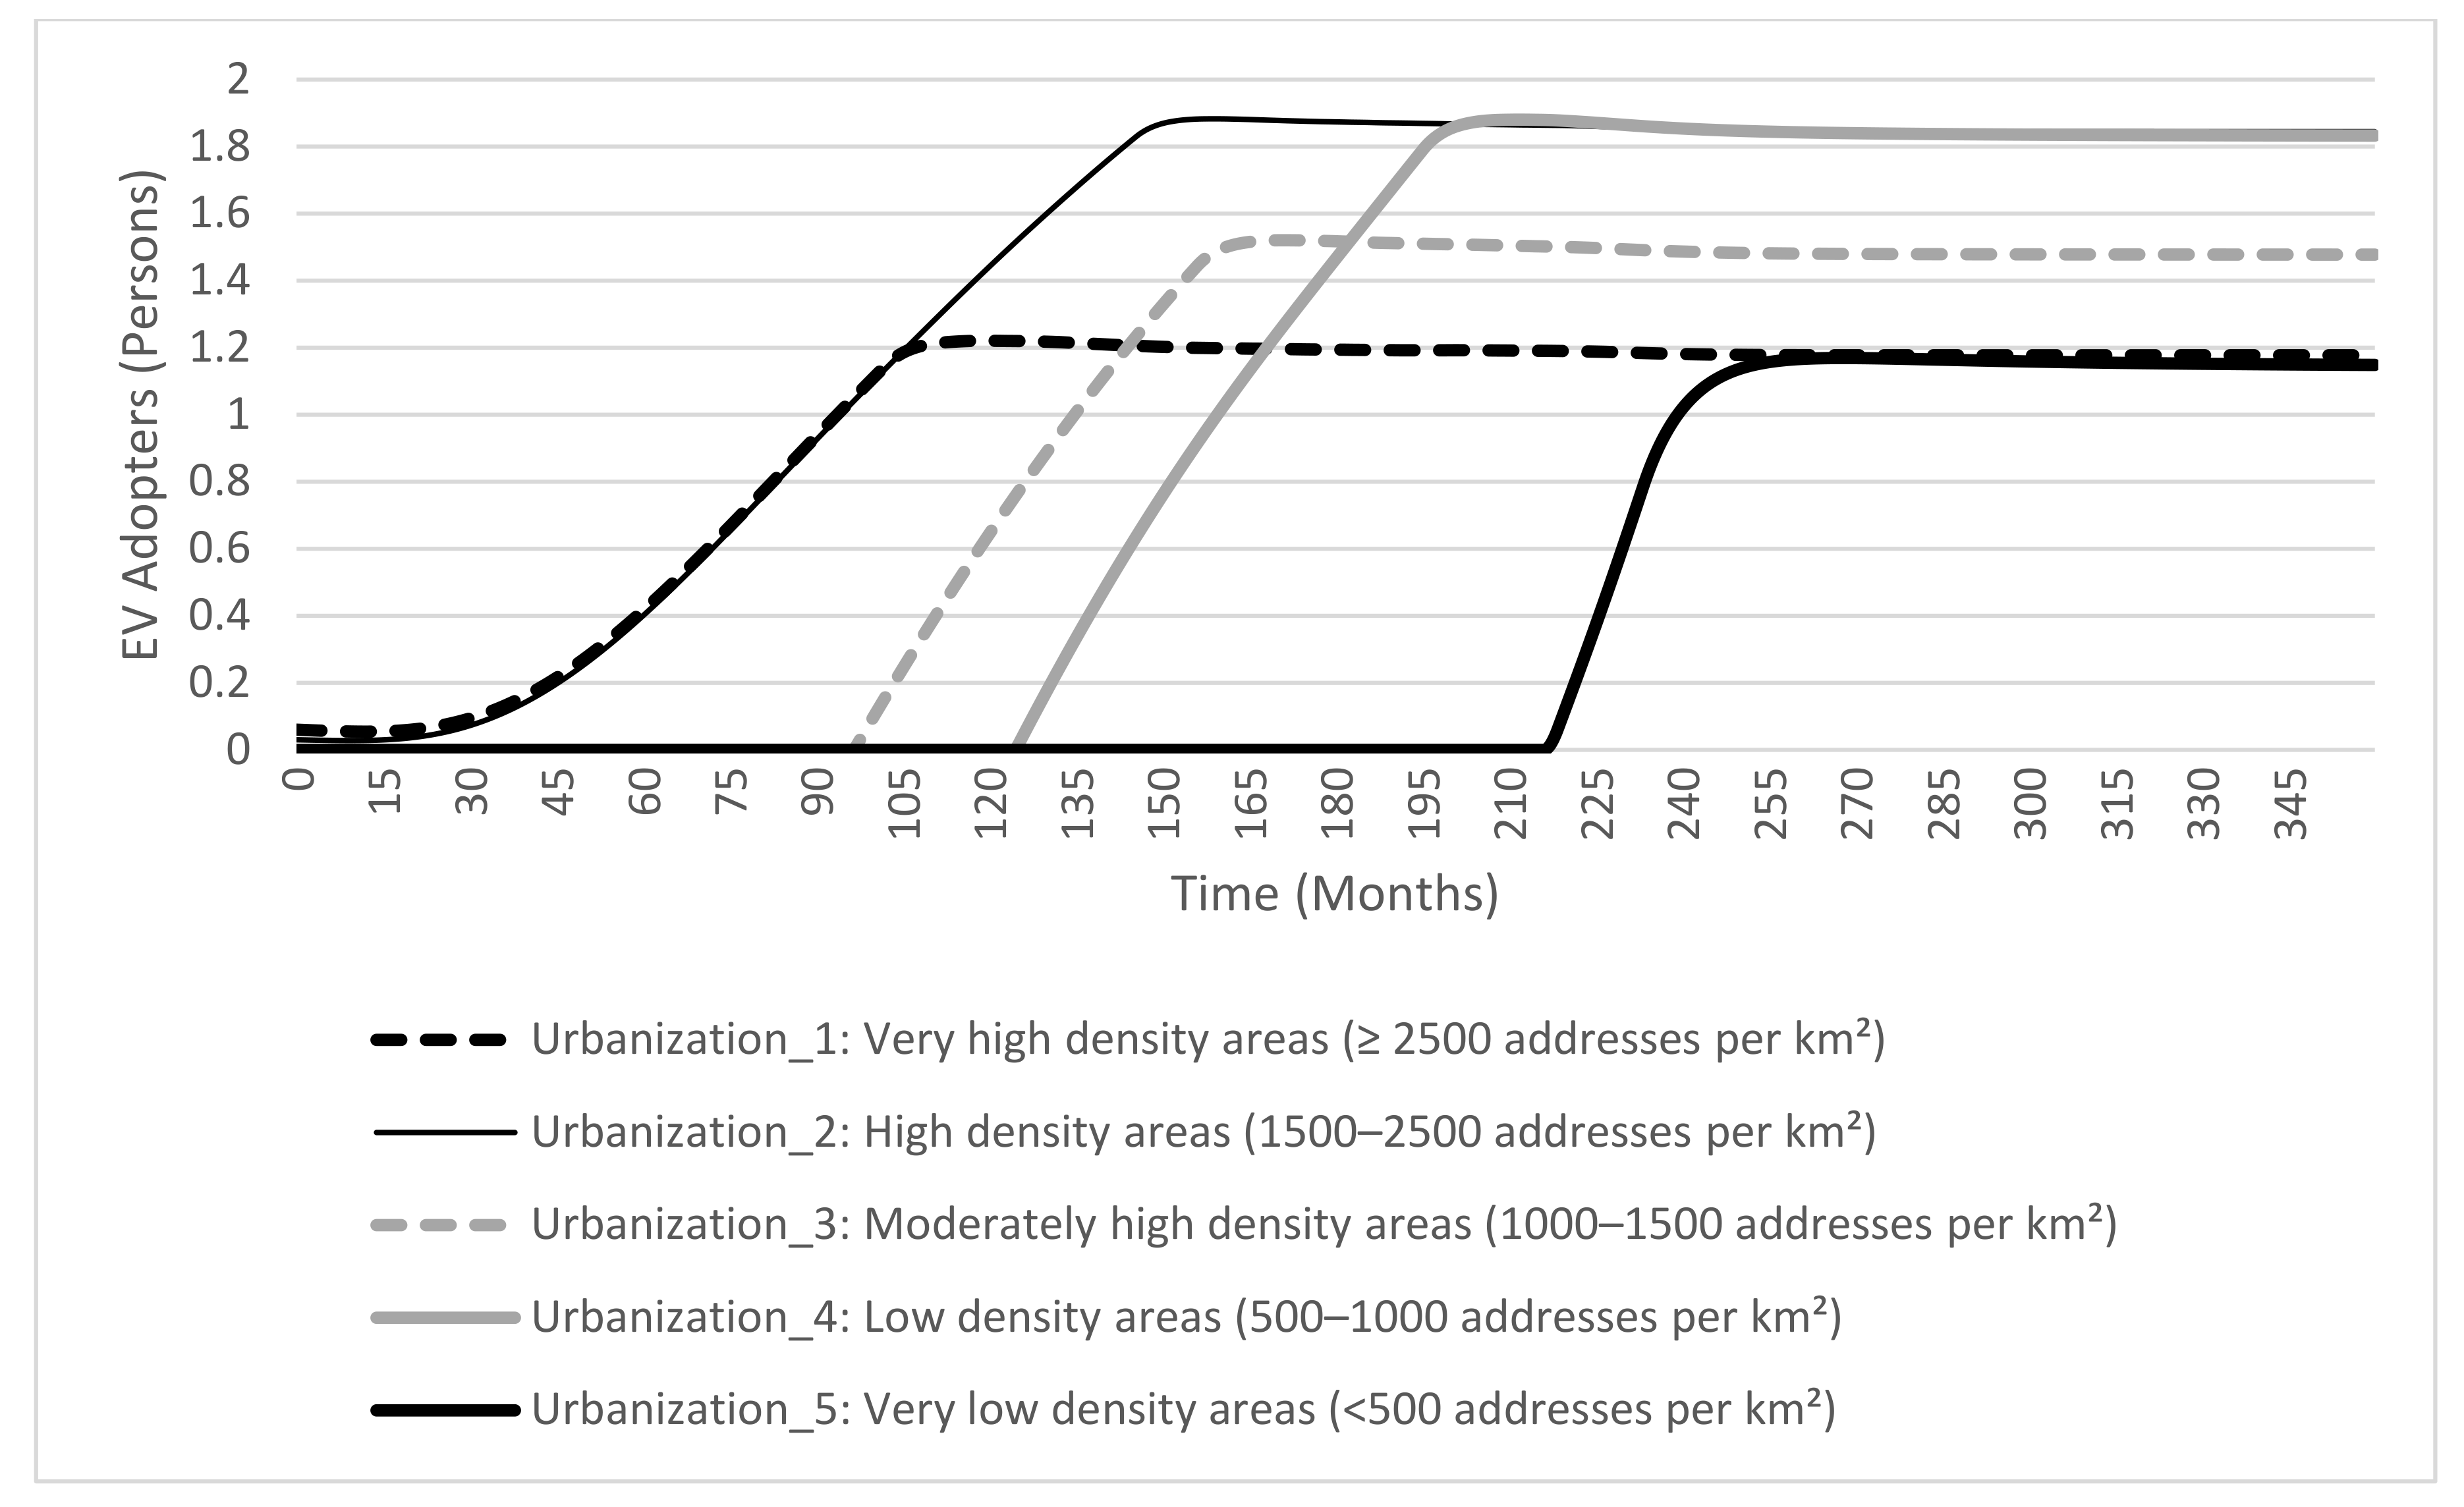
Finally, Figure 7, Figure 8 and Figure 9 depict the growth of EV Adopters for the individual groups in the second set of scenarios. These figures demonstrate that the behaviors of these groups differ primarily in the timing of the first EV adoption. Moreover, some groups arrive at the stabilization phase sooner than others due to the weights of the UTAUT variables and the size of the population. An example is scenario 2-1 in Figure 7, in which people in income_1 class (with income less than 10,000 €) are the very last to adopt EV. Another example is the age_4 category in the age scenario 2-2 in Figure 8, which involves people that are between 40 and 49 years old. Although we specified this group to be among the early EV adopters, the adoption in this group appears to take more time compared to the other groups (around 150 months). Finally, the urbanization scenario 2-3 in Figure 9 suggests that people living in areas characterized by a low level of urban density (i.e., urbanization_5) are among the last groups to adopt EVs.
These simulation runs and examples merely illustrate the added value of an entity-based SD model. More simulation data are available in S2 and S3 of the Supplementary Materials.

5. Discussion and Conclusions

The transition to e-mobility is highly complex [12,125,126,127], and, as a result, the uptake of EVs has been lower than expected in most countries [128]. In this study, we developed an entity-based system dynamics model that provides an in-depth explanation of the dynamic complexity of the e-mobility transition. In response to Holtz [67], who stated that one “cannot hope for a single, overall transition model” (p. 183), we presented a rather comprehensive but parsimonious model of the e-mobility transition. Previous models of the e-mobility transition have not addressed the mutual influence of the macro-level transformation (i.e., the innovation system) and the micro-level of socio-technical change (i.e., consumer choices) on EV adoption. Since this multi-level approach is necessary to obtain a more holistic and realistic understanding of this ongoing transition, our study sheds light on the micro-macro links by modeling the entity types and clarifying the effects of various theories in the simulation results. More specifically, we started with a model of EV adoption to subsequently consider the influence of macro-variables in TIS and the micro-theory of UTAUT. This multi-level approach helps to better understand the dynamics arising from top-down versus bottom-up processes in any transition.
Accordingly, our study serves to better understand the potential impact of innovation policies. In our case, the number of EV adopters can be explained from the dynamic interactions of e-mobility innovation functions at the macro level. On the other hand, our model also depicts the relations between EV markets and changes in e-mobility policies in terms of EV-related subsidies and resource mobilization, among others. In this respect, the vicious and virtuous cycles identified in the model can be used to analyze the impact of alternative e-mobility policies as well as serve as a learning tool for discussion and consensus-building among different stakeholders.
Our study thus contributes to the literature by building a multi-level model that is grounded in extant theories of innovation adoption and consumer choice cf., [129]. Here, our theory-guided and entity-based simulation model also extends existing models. Specifically, while other scholars adopted various modeling approaches (incl. system dynamics), also in combination with agent-based modeling, to model transition problems in the context of mobility, for example, [21,22,23], our study is among the first to present a model that considers the detailed macro-and micro-level interactions—and the complex dynamics arising from such interactions—associated with the EV transition process. Explicitly considering the multi-level nature of transition processes is important, in view of the fact that these processes operate across multiple levels [94]. While some earlier work, for example, [2] draws on models that to some extent are multi-level in nature, this article is the first to offer the opportunity to incorporate a wide range of entity-based decision-making processes. As such, the simulation modeling approach adopted here enables more in-depth studies of transition problems related to e-mobility by providing an exemplary base model that can be extended, applied, and tested in future work. In follow-up studies, this model can be extended by adding new entities or re-using the current entities in the model for related research questions.
The model developed in this paper also has several limitations. For one, the entity of EV purchasers is mainly based on the UTAUT framework, but we did not include several variables in this framework—for example, “habit” as a behavioral characteristic and moderator variables such as “education.” Future research can add these variables to this entity type. Second, we have acknowledged various characteristics of adopters in the model but have not allowed for any interactions between these individual consumers. Future work in this area may therefore seek to extend our multi-level model with an agent-based module, for example, [130]. Third, we assumed that consumers only have one characteristic (e.g., age, income) in conducting simulation runs. Here, future research can also examine e-mobility development by considering agents with compound characteristics (e.g., classes of consumers with a specific age, income, and mobility pattern).
Our findings suggest that market segmentation may serve to better understand how transition policies and strategies can target different classes of consumers. Accordingly, a more effective policy can be designed by considering EV development in each group. For instance, in the early stages of e-mobility, the main potential purchasers appear to be the young and middle-aged people with higher incomes in low-density cities. Accordingly, marketing and promotion activities should concentrate on this market segment, rather than the entire potential market.
In this study, we faced an inherent lack of empirical data for calibrating model parameters cf., [131]. Accordingly, all the experiments and insights obtained are entirely illustrative in nature, meant to show the explanatory power of the model rather than validate it based on empirical data. In this respect, the main rationale of the experimental setup used in this paper was to explore the (mutual) influence of the macro-and micro-level variables in studying the e-mobility transition. Nevertheless, the results obtained appear to replicate the incomplete data available, which provides face validity to the model settings.
In this article, we studied the ongoing e-mobility transition in the Netherlands using an entity-based SD model. Our simulation results shed light on the impact of alternative innovation policies, notably by explaining relations between EV market dynamics and changes in e-mobility policies, such as EV-related subsidies and resource mobilization. The simulation modeling approach adopted appears to enable a more in-depth study of transition problems related to e-mobility. The resulting modular model can be adjusted to other e-mobility transition problems by changing and extending the specified entities.

Supplementary Materials

The following files are available online at https://www.mdpi.com/2071-1050/13/1/38/s1, S1: Entity types and the reference variables; S2: The overall variables and equations of the model; S3: The stylized overview of the entity types; S4: Initialization of the UTAUT variables for different scenarios; S5: Credibility and quality of the model.

Author Contributions

Conceptualization by M.Z., B.W., A.G.L.R., and R.R.; method by M.Z. and B.W.; model code by M.Z.; validation by M.Z.; formal analysis by M.Z., B.W., A.G.L.R., and R.R.; investigation by M.Z.; writing—original draft preparation by M.Z.; writing—review and editing by B.W., A.G.L.R., and R.R.; visualization by M.Z. and B.W.; supervision by B.W., A.G.L.R., and R.R. All authors have read and agreed to the published version of the manuscript.

Funding

This research received no external funding.

Acknowledgments

The first author would like to acknowledge the support received by the Rushd Center of Imam Sadiq University (Tehran-Iran).

Conflicts of Interest

The authors declare they have no conflict of interest.

References

  1. European Commission. European Transport Policy for 2010: Time to Decide; White Paper; European Commission: Brussels, Belgium, 2001. [Google Scholar]
  2. Köhler, J.; Whitmarsh, L.; Nykvist, B.; Schilperoord, M.; Bergman, N.; Haxeltine, A. A Transitions model for sustainable mobility. Ecol. Econ. 2009, 68, 2985–2995. [Google Scholar] [CrossRef]
  3. European Commission. A Sustainable Europe for a Better World: A European Union Strategy for Sustainable Development; COM (2001) 264 final; European Commission: Brussels, Belgium, 2001. [Google Scholar]
  4. Holden, E.; Linnerud, K.; Banister, D. Sustainable passenger transport: Back to Brundtland. Transp. Res. Part A Policy Pract. 2013, 54, 67–77. [Google Scholar] [CrossRef] [Green Version]
  5. Banister, D. The sustainable mobility paradigm. Transp. Policy 2008, 15, 73–80. [Google Scholar] [CrossRef]
  6. Berger, G.; Feindt, P.H.; Holden, E.; Rubik, F. Sustainable Mobility—Challenges for a Complex Transition. J. Environ. Policy Plan. 2014, 16, 303–320. [Google Scholar] [CrossRef]
  7. Castillo, N.H.; Pitfield, D.E. ELASTIC—A methodological framework for identifying and selecting sustainable transport indicators. Transp. Res. Part D Transp. Environ. 2010, 15, 179–188. [Google Scholar] [CrossRef] [Green Version]
  8. Litman, T.; Burwell, D. Issues in sustainable transportation. Int. J. Glob. Environ. Issues (IJGENVI) 2006, 6, 331. [Google Scholar] [CrossRef]
  9. Høyer, K.G. The history of alternative fuels in transportation: The case of electric and hybrid cars. Util. Policy 2008, 16, 63–71. [Google Scholar] [CrossRef]
  10. Geels, F.W. A socio-technical analysis of low-carbon transitions: Introducing the multi-level perspective into transport studies. J. Transp. Geogr. 2012, 24, 471–482. [Google Scholar] [CrossRef]
  11. Dijk, M.; Orsato, R.J.; Kemp, R. The emergence of an electric mobility trajectory. Energy Policy 2013, 52, 135–145. [Google Scholar] [CrossRef]
  12. Yigitcanlar, T.; Fabian, L.; Coiacetto, E. Challenges to Urban Transport Sustainability and Smart Transport in a Tourist City: The Gold Coast, Australia. Open Transp. J. 2008, 2, 29–46. [Google Scholar] [CrossRef] [Green Version]
  13. Lipman, T.E.; Delucchi, M.A. A retail and lifecycle cost analysis of hybrid electric vehicles. Transp. Res. Part D Transp. Environ. 2006, 11, 115–132. [Google Scholar] [CrossRef]
  14. Yeh, S. An empirical analysis on the adoption of alternative fuel vehicles: The case of natural gas vehicles. Energy Policy 2007, 35, 5865–5875. [Google Scholar] [CrossRef] [Green Version]
  15. Kühne, R. Electric buses—An energy efficient urban transportation means. Energy 2010, 35, 4510–4513. [Google Scholar] [CrossRef]
  16. Tsang, F.; Pedersen, J.S.; Wooding, S.; Potoglou, D. Bringing the Electric Vehicle to the Mass Market: A Review of Barriers, Facilitators and Policy Interventions; Rand Europe: Cambridge, UK, 2012. [Google Scholar]
  17. Geels, F.W.; Kemp, R.; Dudley, G.; Lyons, G. (Eds.) Automobility in Transition? A Socio-Technical Analysis of Sustainable Transport; Routledge: New York, NY, USA, 2012. [Google Scholar]
  18. Unruh, G.C. Understanding carbon lock-in. Energy Policy 2000, 28, 817–830. [Google Scholar] [CrossRef]
  19. Elzen, B.; Wieczorek, A. Transitions towards sustainability through system innovation. Technol. Forecast. Soc. Chang. 2005, 72, 651–661. [Google Scholar] [CrossRef]
  20. Sierzchula, W.; Bakker, S.; Maat, K.; Van Wee, B. The competitive environment of electric vehicles: An analysis of prototype and production models. Environ. Innov. Soc. Transit. 2012, 2, 49–65. [Google Scholar] [CrossRef]
  21. Lewe, J.-H.; Hivin, L.; Mavris, D.N. A multi-paradigm approach to system dynamics modeling of intercity transportation. Transp. Res. Part E Logist. Transp. Rev. 2014, 71, 188–202. [Google Scholar] [CrossRef]
  22. Pasaoglu, G.; Harrison, G.; Jones, L.; Hill, A.; Beaudet, A.; Thiel, C. A system dynamics based market agent model simulating future powertrain technology transition: Scenarios in the EU light duty vehicle road transport sector. Technol. Forecast. Soc. Chang. 2016, 104, 133–146. [Google Scholar] [CrossRef]
  23. Harrison, G.; Thiel, C. An exploratory policy analysis of electric vehicle sales competition and sensitivity to infrastructure in Europe. Technol. Forecast. Soc. Chang. 2017, 114, 165–178. [Google Scholar] [CrossRef]
  24. Shepherd, S. A review of system dynamics models applied in transportation. Transp. B Transp. Dyn. 2014, 2, 83–105. [Google Scholar] [CrossRef] [Green Version]
  25. Bergek, A.; Jacobsson, S.; Carlsson, B.; Lindmark, S.; Rickne, A. Analyzing the functional dynamics of technological innovation systems: A scheme of analysis. Res. Policy 2008, 37, 407–429. [Google Scholar] [CrossRef] [Green Version]
  26. Venkatesh, V.; Thong, J.Y.L.; Xu, X. Consumer Acceptance and Use of Information Technology: Extending the Unified Theory of Acceptance and Use of Technology. MIS Q. 2012, 36, 157–178. [Google Scholar] [CrossRef] [Green Version]
  27. Markard, J.; Raven, R.; Truffer, B. Sustainability transitions: An emerging field of research and its prospects. Res. Policy 2012, 41, 955–967. [Google Scholar] [CrossRef]
  28. Köhler, J.; Raven, R.; Walrave, B. Advancing the analysis of technological innovation systems dynamics: Introduction to the special issue. Technol. Forecast. Soc. Chang. 2020, 158, 120040. [Google Scholar] [CrossRef]
  29. Markard, J.; Truffer, B. Technological innovation systems and the multi-level perspective: Towards an integrated framework. Res. Policy 2008, 37, 596–615. [Google Scholar] [CrossRef]
  30. Galli, R.; Teubal, M. Paradigmatic Shifts in National Innovation Systems. In Systems of Innovation. Technologies, Institutions and Organizations; Coombs, R., Ed.; Pinter: London, UK, 1997; pp. 342–370. [Google Scholar]
  31. Rickne, A. New Technology-Based Firms and Industrial Dynamics: Evidence from the Technological System of Biomaterials in Sweden, Ohio and Massachusetts. Ph.D. Thesis, Department of Industrial Dynamics, Chalmers University of Technology, Gothenburg, Sweden, 2000. [Google Scholar]
  32. Johnson, A.; Jacobsson, S. Inducement and Blocking Mechanisms in the Development of a New Industry: The Case of Renewable Energy Technology in Sweden. In Technology and the Market: Demand, Users and Innovation; Coombs, R., Green, K., Richards, A., Walsh, V., Eds.; Edward Elgar Pub: Cheltenham, UK, 2001. [Google Scholar]
  33. Bergek, A. Shaping and Exploiting Technological Opportunities: The Case of Renewable Energy Technology in Sweden. Ph.D. Thesis, Department of Industrial Dynamics, Chalmers University of Technology, Gothenburg, Sweden, 2000. [Google Scholar]
  34. Bergek, A.; Jacobsson, S. The emergence of a growth industry: A comparative analysis of the German, Dutch and Swedish wind turbine industries. In Change, Transformation and Development; Metcalfe, J.S., Cantner, U., Eds.; Springer Science and Business Media LLC: Heidelberg, Germany, 2003; pp. 197–227. [Google Scholar]
  35. Liu, X.; White, S. Comparing innovation systems: A framework and application to China’s transitional context. Res. Policy 2001, 30, 1091–1114. [Google Scholar] [CrossRef]
  36. Hekkert, M.; Suurs, R.; Negro, S.; Kuhlmann, S.; Smits, R. Functions of innovation systems: A new approach for analysing technological change. Technol. Forecast. Soc. Chang. 2007, 74, 413–432. [Google Scholar] [CrossRef] [Green Version]
  37. Bergek, A.; Hekkert, M.; Jacobssen, S. Functions in innovation systems: A framework for analysing energy system dynamics and identifying goals for system building activities by entrepreneurs and policymakers. In Innovation for a Low Carbon Economy: Economic, Institutional and Management Approaches; Foxon, T.J., Köhler, J., Oughton, C., Eds.; Edward Elgar: Cheltenham, UK, 2008. [Google Scholar]
  38. Weber, K.M.; Truffer, B. Moving innovation systems research to the next level: Towards an integrative agenda. Oxf. Rev. Econ. Policy 2017, 33, 101–121. [Google Scholar] [CrossRef]
  39. Bergek, A. Technological innovation systems: A review of recent findings and suggestions for future research. In Handbook of Sustainable Innovation; Boons, F., McMeekin, A., Eds.; Edward Elgar: Cheltenham, UK, 2019; Chapter 11; pp. 200–218. [Google Scholar]
  40. Suurs, R.A.A. Motors of Sustainable Innovation: Toward a Theory on the Dynamics of Technological Innovation Systems; Utrecht University: Utrecht, The Netherlands, 2009. [Google Scholar]
  41. Walrave, B.; Raven, R. Modelling the dynamics of technological innovation systems. Res. Policy 2016, 45, 1833–1844. [Google Scholar] [CrossRef]
  42. Wieczorek, A.J.; Hekkert, M.P. Systemic instruments for systemic innovation problems: A framework for policy makers and innovation scholars. Sci. Public Policy 2012, 39, 74–87. [Google Scholar] [CrossRef]
  43. Williams, M.D.; Rana, N.P.; Dwivedi, Y.K.; Lal, B. Is UTAUT really used or just cited for the sake of it? A systematic review of citations of UTAUT’s originating article. In Proceedings of the 19th European Conference on Information systems, Helsinki, Finland, 9–11 June 2011; p. 231. [Google Scholar]
  44. Taiwo, A.A.; Downe, A.G. The theory of user acceptance and use of technology (UTAUT): A meta-analytic review of empirical findings. J. Theor. Appl. Inform. Technol. 2013, 49, 48–58. [Google Scholar]
  45. Khechine, H.; Lakhal, S.; Ndjambou, P. A meta-analysis of the UTAUT model: Eleven years later. Can. J. Adm. Sci. Rev. Can. Sci. Adm. 2016, 33, 138–152. [Google Scholar] [CrossRef]
  46. Venkatesh, V.; Morris, M.G.; Davis, G.B.; Davis, F.D. User acceptance of information technology: Toward a unified view. MIS Q. 2003, 27, 425–478. [Google Scholar] [CrossRef] [Green Version]
  47. Ajzen, I.; Fishbein, M. Understanding Attitudes and Predicting Social Behavior; Prentice-Hall: Englewood Cliffs, NJ, USA, 1980. [Google Scholar]
  48. Fishbein, M.; Ajzen, I. Belief, Attitude, Intention and Behavior: An Introduction to Theory and Research; Addison-Wesley: Reading, MA, USA, 1975. [Google Scholar]
  49. Davis, F.D. Perceived usefulness, perceived ease of use, and user acceptance of information technology. MIS Q. 1989, 13, 319–339. [Google Scholar] [CrossRef] [Green Version]
  50. Davis, F.D.; Bagozzi, R.P.; Warshaw, P.R. User acceptance of computer technology: A comparison of two theoretical models. Manag. Sci. 1989, 35, 982–1003. [Google Scholar] [CrossRef] [Green Version]
  51. Ajzen, I. The theory of planned behavior. Organ. Behav. Hum. Decis. Process. 1991, 50, 179–211. [Google Scholar] [CrossRef]
  52. Taylor, S.; Todd, P. Assessing IT Usage: The Role of Prior Experience. MIS Q. 1995, 19, 561–570. [Google Scholar] [CrossRef] [Green Version]
  53. Taylor, S.; Todd, P.A. Understanding Information Technology Usage: A Test of Competing Models. Inf. Syst. Res. 1995, 6, 144–176. [Google Scholar] [CrossRef]
  54. Vallerand, R.J. Toward a Hierarchical Model of Intrinsic and Extrinsic Motivation. In Advances in Experimental Social Psychology; Zanna, M.P., Ed.; Elsevier: Amsterdam, The Netherlands, 1997; Volume 29, pp. 271–360. [Google Scholar]
  55. Venkatesh, V.; Speier, C. Computer Technology Training in the Workplace: A Longitudinal Investigation of the Effect of Mood. Organ. Behav. Hum. Decis. Process. 1999, 79, 1–28. [Google Scholar] [CrossRef] [Green Version]
  56. Triandis, H.C. Interpersonal Behavior; Brooks/Cole Publishing Company: Monterey, CA, USA, 1977. [Google Scholar]
  57. Thompson, R.L.; Higgins, C.A.; Howell, J.M. Personal computing: Toward a conceptual model of utilization. MIS Q. 1991, 15, 125–143. [Google Scholar] [CrossRef]
  58. Rogers, E.M. Diffusion of Innovations, 4th ed.; Free Press: New York, NY, USA, 1995. [Google Scholar]
  59. Bandura, A. Social Foundations of Thought and Action: A Social Cognitive Theory; Prentice-Hall, Inc.: Upper Saddle River, NJ, USA, 1986. [Google Scholar]
  60. Compeau, D.R.; Higgins, C.A. Computer Self-Efficacy: Development of a Measure and Initial Test. MIS Q. 1995, 19, 189–211. [Google Scholar] [CrossRef] [Green Version]
  61. Browne, S.A.; Venkatesh, V. Model of adoption of technology in households: A baseline model test and extension incorporating household life cycle. MIS Quarterly 2005, 29, 399–462. Available online: https://www.jstor.org/stable/25148690 (accessed on 1 May 2018).
  62. Sovacool, B.K. Experts, theories, and electric mobility transitions: Toward an integrated conceptual framework for the adoption of electric vehicles. Energy Res. Soc. Sci. 2017, 27, 78–95. [Google Scholar] [CrossRef]
  63. Bass, F.M. A New Product Growth for Model Consumer Durables. Manag. Sci. 1969, 15, 215–227. [Google Scholar] [CrossRef]
  64. Herr, P.M.; Kardes, F.R.; Kim, J. Effects of Word-of-Mouth and Product-Attribute Information on Persuasion: An Accessibility-Diagnosticity Perspective. J. Consum. Res. 1991, 17, 454–462. [Google Scholar] [CrossRef]
  65. Gärling, A.; Thøgersen, J. Marketing of electric vehicles. Bus. Strat. Environ. 2001, 10, 53–65. [Google Scholar] [CrossRef]
  66. Carley, S.; Krause, R.M.; Lane, B.W.; Graham, J.D. Intent to purchase a plug-in electric vehicle: A survey of early impressions in large US cites. Transp. Res. Part D Transp. Environ. 2013, 18, 39–45. [Google Scholar] [CrossRef]
  67. Holtz, G. Modelling transitions: An appraisal of experiences and suggestions for research. Environ. Innov. Soc. Transit. 2011, 1, 167–186. [Google Scholar] [CrossRef]
  68. Holtz, G.; Alkemade, F.; De Haan, F.; Köhler, J.; Trutnevyte, E.; Luthe, T.; Halbe, J.; Papachristos, G.; Chappin, E.; Kwakkel, J.; et al. Prospects of modelling societal transitions: Position paper of an emerging community. Environ. Innov. Soc. Transit. 2015, 17, 41–58. [Google Scholar] [CrossRef]
  69. Halbe, J.; Reusser, D.; Holtz, G.; Haasnoot, M.; Stosius, A.; Avenhaus, W.; Kwakkel, J.H. Lessons for model use in transition research: A survey and comparison with other research areas. Environ. Innov. Soc. Transit. 2015, 15, 194–210. [Google Scholar] [CrossRef] [Green Version]
  70. McDowall, W.; Geels, F.W. Ten challenges for computer models in Transitions research: Commentary on Holtz et al. Environ. Innov. Soc. Transit. 2017, 22, 41–49. [Google Scholar] [CrossRef]
  71. Köhler, J.; De Haan, F.; Holtz, G.; Kubeczko, K.; Moallemi, E.A.; Papachristos, G.; Chappin, E. Modelling Sustainability Transitions: An Assessment of Approaches and Challenges. J. Artif. Soc. Soc. Simul. 2018, 21. [Google Scholar] [CrossRef] [Green Version]
  72. Abbas, K.A.; Bell, M.G.H. System dynamics applicability to transportation modeling. Tranp. Res. Part A Policy Pract. 1994, 28, 373–390. [Google Scholar] [CrossRef]
  73. Ulli-Beer, S.; Gassmann, F.; Bosshardt, M.; Wokaun, A. Generic structure to simulate acceptance dynamics. Syst. Dyn. Rev. 2010, 26, 89–116. [Google Scholar] [CrossRef]
  74. Stepp, M.D.; Winebrake, J.J.; Hawker, J.S.; Skerlos, S.J. Greenhouse gas mitigation policies and the transportation sector: The role of feedback effects on policy effectiveness. Energy Policy 2009, 37, 2774–2787. [Google Scholar] [CrossRef]
  75. Struben, J.; Sterman, J.D. Transition challenges for alternative fuel vehicle and transportation systems. Environ. Plan. B Plan. Des. 2008, 35, 1070–1097. [Google Scholar] [CrossRef]
  76. Shepherd, S.; Bonsall, P.; Harrison, G. Factors affecting future demand for electric vehicles: A model based study. Transp. Policy 2012, 20, 62–74. [Google Scholar] [CrossRef]
  77. Kwon, T.-H. Strategic niche management of alternative fuel vehicles: A system dynamics model of the policy effect. Technol. Forecast. Soc. Chang. 2012, 79, 1672–1680. [Google Scholar] [CrossRef]
  78. Janssen, A.; Lienin, S.F.; Gassmann, F.; Wokaun, A. Model aided policy development for the market penetration of natural gas vehicles in Switzerland. Transp. Res. Part A Policy Pract. 2006, 40, 316–333. [Google Scholar] [CrossRef]
  79. Walther, G.; Wansart, J.; Kieckhäfer, K.; Schnieder, E.; Spengler, T.S. Impact assessment in the automotive industry: Mandatory market introduction of alternative powertrain technologies. Syst. Dyn. Rev. 2010, 26, 239–261. [Google Scholar] [CrossRef]
  80. Köhler, J.; Wietschel, M.; Whitmarsh, L.; Keles, D.; Schade, W. Infrastructure investment for a transition to hydrogen automobiles. Technol. Forecast. Soc. Chang. 2010, 77, 1237–1248. [Google Scholar] [CrossRef]
  81. Leaver, J.D.; Gillingham, K.T.; Leaver, L.H. Assessment of primary impacts of a hydrogen economy in New Zealand using UniSyD. Int. J. Hydrogen Energy 2009, 34, 2855–2865. [Google Scholar] [CrossRef]
  82. Meyer, P.E.; Winebrake, J.J. Modeling technology diffusion of complementary goods: The case of hydrogen vehicles and refueling infrastructure. Technovation 2009, 29, 77–91. [Google Scholar] [CrossRef]
  83. Leaver, J.; Gillingham, K.T. Economic impact of the integration of alternative vehicle technologies into the New Zealand vehicle fleet. J. Clean. Prod. 2010, 18, 908–916. [Google Scholar] [CrossRef]
  84. Park, S.Y.; Kim, J.W.; Lee, D.H. Development of a market penetration forecasting model for hydrogen fuel cell vehicles considering infrastructure and cost reduction effects. Energy Policy 2011, 39, 3307–3315. [Google Scholar] [CrossRef]
  85. Shafiei, E.; Stefansson, H.; Asgeirsson, E.I.; Davidsdottir, B.; Raberto, M. Integrated Agent-based and System Dynamics Modelling for Simulation of Sustainable Mobility. Transp. Rev. 2012, 33, 44–70. [Google Scholar] [CrossRef]
  86. Shafiei, E.; Davidsdottir, B.; Leaver, J.; Stefansson, H.; Asgeirsson, E.I. Potential impact of transition to a low-carbon transport system in Iceland. Energy Policy 2014, 69, 127–142. [Google Scholar] [CrossRef]
  87. Kieckhäfer, K.; Volling, T.; Spengler, T.S. A Hybrid Simulation Approach for Estimating the Market Share Evolution of Electric Vehicles. Transp. Sci. 2014, 48, 651–670. [Google Scholar] [CrossRef]
  88. Kieckhäfer, K.; Wachter, K.; Spengler, T.S. Analyzing manufacturers’ impact on green products’ market diffusion—The case of electric vehicles. J. Clean. Prod. 2017, 162, S11–S25. [Google Scholar] [CrossRef]
  89. Yeager, L.; Fiddaman, T.; Peterson, D. Entity-Based System Dynamics; Ventana Systems, Inc., 2014; Available online: http://www.vensim.com/wp-content/uploads/2014/08/Entity-Based-System-Dynamics-v2.pdf (accessed on 23 April 2018).
  90. Mingers, J.; Brocklesby, J. Multimethodology: Towards a framework for mixing methodologies. Omega 1997, 25, 489–509. [Google Scholar] [CrossRef]
  91. Rosenberg, N. Perspectives on Technology; Cambridge University Press: Cambridge, UK, 1976. [Google Scholar]
  92. Utterback, J.M. Mastering the Dynamics of Innovation; Harvard Business School Press: Boston, MA, USA, 1996. [Google Scholar]
  93. Schot, J.W. The usefulness of evolutionary models for explaining innovation. The case of the Netherlands in the nineteenth century. Hist. Technol. 1998, 14, 173–200. [Google Scholar] [CrossRef]
  94. Rip, A.; Kemp, R. Technological change. In Human Choice and Climate Change; Rayner, S., Malone, E.L., Eds.; Battelle Press: Columbus, OH, USA, 1998; Volume 2, pp. 327–339. [Google Scholar]
  95. Geels, F.W. Technological Transitions as evolutionary reconfiguration processes: A multi-level perspective and a case-study. Res. Policy 2002, 31, 1257–1274. [Google Scholar] [CrossRef] [Green Version]
  96. Rotmans, J.; Kemp, R.; Van Asselt, M. More evolution than revolution: Transition management in public policy. Foresight 2001, 3, 15–31. [Google Scholar] [CrossRef]
  97. Suurs, R.A.A.; Hekkert, M.P. Motors of sustainable innovation: Understanding Transit. from a technological innovation system’s perspective. In Governing the Energy Transition. Reality, Illusion or Necessity? Verbong, G.P.J., Loorbach, D., Eds.; Routledge: New York, NY, USA, 2012; pp. 152–179. [Google Scholar]
  98. Schroeder, A.; Traber, T. The economics of fast charging infrastructure for electric vehicles. Energy Policy 2012, 43, 136–144. [Google Scholar] [CrossRef]
  99. Krupa, J.S.; Rizzo, D.M.; Eppstein, M.J.; Lanute, D.B.; Gaalema, D.E.; Lakkaraju, K.; Warrender, C.E. Analysis of a consumer survey on plug-in hybrid electric vehicles. Transp. Res. Part A Policy Pract. 2014, 64, 14–31. [Google Scholar] [CrossRef]
  100. Shulock, C.; Pike, E.; Lloyd, A.; Rose, R. Task 4 Report: Complementary Policies. Vehicle Electrification Policy Study. The International Council on Clean Transportation. 2011. Available online: https://www.theicct.org/sites/default/files/publications/ICCT_VEPstudy_Mar2011_no4.pdf (accessed on 1 May 2018).
  101. Al-Alawi, B.M.; Bradley, T.H. Review of hybrid, plug-in hybrid, and electric vehicle market modeling Studies. Renew. Sustain. Energy Rev. 2013, 21, 190–203. [Google Scholar] [CrossRef]
  102. Lin, C.; Wu, T.; Ou, X.; Zhang, Q.; Zhang, X.; Zhang, X. Life-cycle private costs of hybrid electric vehicles in the current Chinese market. Energy Policy 2013, 55, 501–510. [Google Scholar] [CrossRef]
  103. Thiel, C.; Perujo, A.; Mercier, A. Cost and CO2 aspects of future vehicle options in Europe under new energy policy scenarios. Energy Policy 2010, 38, 7142–7151. [Google Scholar] [CrossRef]
  104. Anable, J.; Schuitema, G.; Stannard, J. Consumer Responses to Electric Vehicles Literature Review. Report for Energy Technology Institute Plug-in Vehicles Infrastructure Project (June 2010). Trans. Res. Lab. Publ. Proj. Rep. 2014. Available online: https://trl.co.uk/uploads/trl/documents/PPR728%20-%20Consumer%20responses%20to%20Electric%20Vehicles%20Literature%20Review.pdf (accessed on 19 December 2020).
  105. Argote, L. Organizational learning curves: Persistence, transfer and turnover. Int. J. Technol. Manag. 1996, 11, 759–769. [Google Scholar]
  106. Lant, T.K.; Argote, L. Organizational Learning: Creating, Retaining and Transferring Knowledge, 2nd ed.; Springer: New York, NY, USA, 2013. [Google Scholar]
  107. Morrison, J.B. Putting the learning curve in context. J. Bus. Res. 2008, 61, 1182–1190. [Google Scholar] [CrossRef]
  108. Bandhold, H.; Wallner, J.C.; Lindgren, M.; Bergman, S. Plug in Road 2020. Report Based on Consumer Surveys, Interviews and Seminars. Plug in Road 2020. Rapport Baserad på Konsumentundersökning, Intervjuer och Seminarium. Elforsk Rapport 09:40, Stockholm. 2009. Available online: https://energiforsk.se (accessed on 1 May 2018).
  109. Bjerkan, K.Y.; Nørbech, T.E.; Nordtømme, M.E. Incentives for promoting Battery Electric Vehicle (BEV) adoption in Norway. Transp. Res. Part D Transp. Environ. 2016, 43, 169–180. [Google Scholar] [CrossRef] [Green Version]
  110. Berger, J.; Milkman, K.L. What makes online content viral? J. Mark. Res. 2012, 49, 192–205. [Google Scholar] [CrossRef] [Green Version]
  111. East, R.; Hammond, K.; Lomax, W. Measuring the impact of positive and negative word of mouth on brand purchase probability. Int. J. Res. Mark. 2008, 25, 215–224. [Google Scholar] [CrossRef]
  112. Fiedler, K. (Ed.) Social Communication: Introduction and Overview; Psychology Press: New York, NY, USA, 2007. [Google Scholar]
  113. Mizerski, R.W. An Attribution Explanation of the Disproportionate Influence of Unfavorable Information. J. Consum. Res. 1982, 9, 301–310. [Google Scholar] [CrossRef]
  114. Park, C.; Lee, T.M. Antecedents of Online Reviews’ Usage and Purchase Influence: An Empirical Comparison of U.S. and Korean Consumers. J. Interact. Mark. 2009, 23, 332–340. [Google Scholar] [CrossRef]
  115. Yi, S.; Ahn, J.-H. Managing initial expectations when word-of-mouth matters: Effects of product value and consumer heterogeneity. Eur. J. Mark. 2017, 51, 123–156. [Google Scholar] [CrossRef]
  116. Linder, S.; Wirges, J. Spatial diffusion of electric vehicles in the German metropolitan region of Stuttgart. In Proceedings of the 51st Congress of the European Regional Science Association: New Challenges for European Regions and Urban Areas in a Globalised World, Barcelona, Spain, 30 August–3 September 2011; pp. 1–27. [Google Scholar]
  117. Curtin, R.; Shrago, Y.; Mikkelsen, J. Plug-in Hybrid Electric Vehicles. University of Michigan. 2009. Available online: http://ns.umich.edu/Releases/2009/Oct09/PHEV_Curtin.pdf (accessed on 22 April 2018).
  118. Ozaki, R.; Sevastyanova, K. Going hybrid: An analysis of consumer purchase motivations. Energy Policy 2011, 39, 2217–2227. [Google Scholar] [CrossRef]
  119. Hidrue, M.K.; Parsons, G.; Kempton, W.; Gardner, M.P. Willingness to pay for electric vehicles and their attributes. Resour. Energy Econ. 2011, 33, 686–705. [Google Scholar] [CrossRef] [Green Version]
  120. Plötz, P.; Schneider, U.; Globisch, J.; Dütschke, E. Who will buy electric vehicles? Identifying early adopters in Germany. Transp. Res. Part A Policy Pract. 2014, 67, 96–109. [Google Scholar] [CrossRef]
  121. Lane, B.; Potter, S. The adoption of cleaner vehicles in the UK: Exploring the consumer attitude–action gap. J. Clean. Prod. 2007, 15, 1085–1092. [Google Scholar] [CrossRef]
  122. Figures Electrical Transport (Cijfers Elektrisch Vervoer). Available online: https://www.rvo.nl/onderwerpen/duurzaam-ondernemen/energie-en-milieu-innovaties/elektrisch-rijden/stand-van-zaken/cijfers (accessed on 28 August 2020).
  123. Fisher, J.; Pry, R. A simple substitution model of technological change. Technol. Forecast. Soc. Chang. 1971, 3, 75–88. [Google Scholar] [CrossRef]
  124. Rotmans, J.; Kemp, R. Managing Societal Transitions-Dilemmas and Uncertainties: The Dutch Energy Case-Study. In OECD Workshop on the Benefits of Climate Policy: Improving Information for Policy Makers; 2003; Available online: http://www.oecd.org/environment/cc/2483769.pdf (accessed on 1 May 2018).
  125. King, J. Part 1: The Potential for CO2 Reduction. The King Review of Low Carbon Cars. 2007. Available online: http://webarchive.nationalarchives.gov.uk/+/http:/www.hm-treasury.gov.uk/d/pbr_csr07_king840.pdf (accessed on 15 May 2018).
  126. Sperling, D.; Gordon, D. Advanced passenger transport technologies. Annu. Rev. Environ. Resour. 2008, 33, 63–84. [Google Scholar] [CrossRef]
  127. McKinsey & Company. A Portfolio of Powertrains for EUROPE: A Fact-Based Analysis. 2010. Available online: http://www.fch.europa.eu/sites/default/files/Power_trains_for_Europe_0.pdf (accessed on 15 May 2018).
  128. Williander, M.; Stålstad, C. Four Business Models for a Fast Commercialization of Plug-in Cars. In Electric Vehicle Business Models; Beeton, D., Meyer, G., Eds.; Springer: Cham, Switzerland, 2015. [Google Scholar]
  129. Zolfagharian, M.; Walrave, B.; Raven, R.; Romme, A.G.L. Studying transitions: Past, present, and future. Res. Policy 2019, 48, 103788. [Google Scholar] [CrossRef]
  130. Zolfagharian, M.; Romme, A.G.L.; Walrave, B. Why, when, and how to combine system dynamics with other methods: Towards an evidence-based framework. J. Simul. 2018, 12, 98–114. [Google Scholar] [CrossRef]
  131. Geels, F.W.; Berkhout, F.; Van Vuuren, D.P. Bridging analytical approaches for low-carbon transitions. Nat. Clim. Chang. 2016, 6, 576–583. [Google Scholar] [CrossRef] [Green Version]
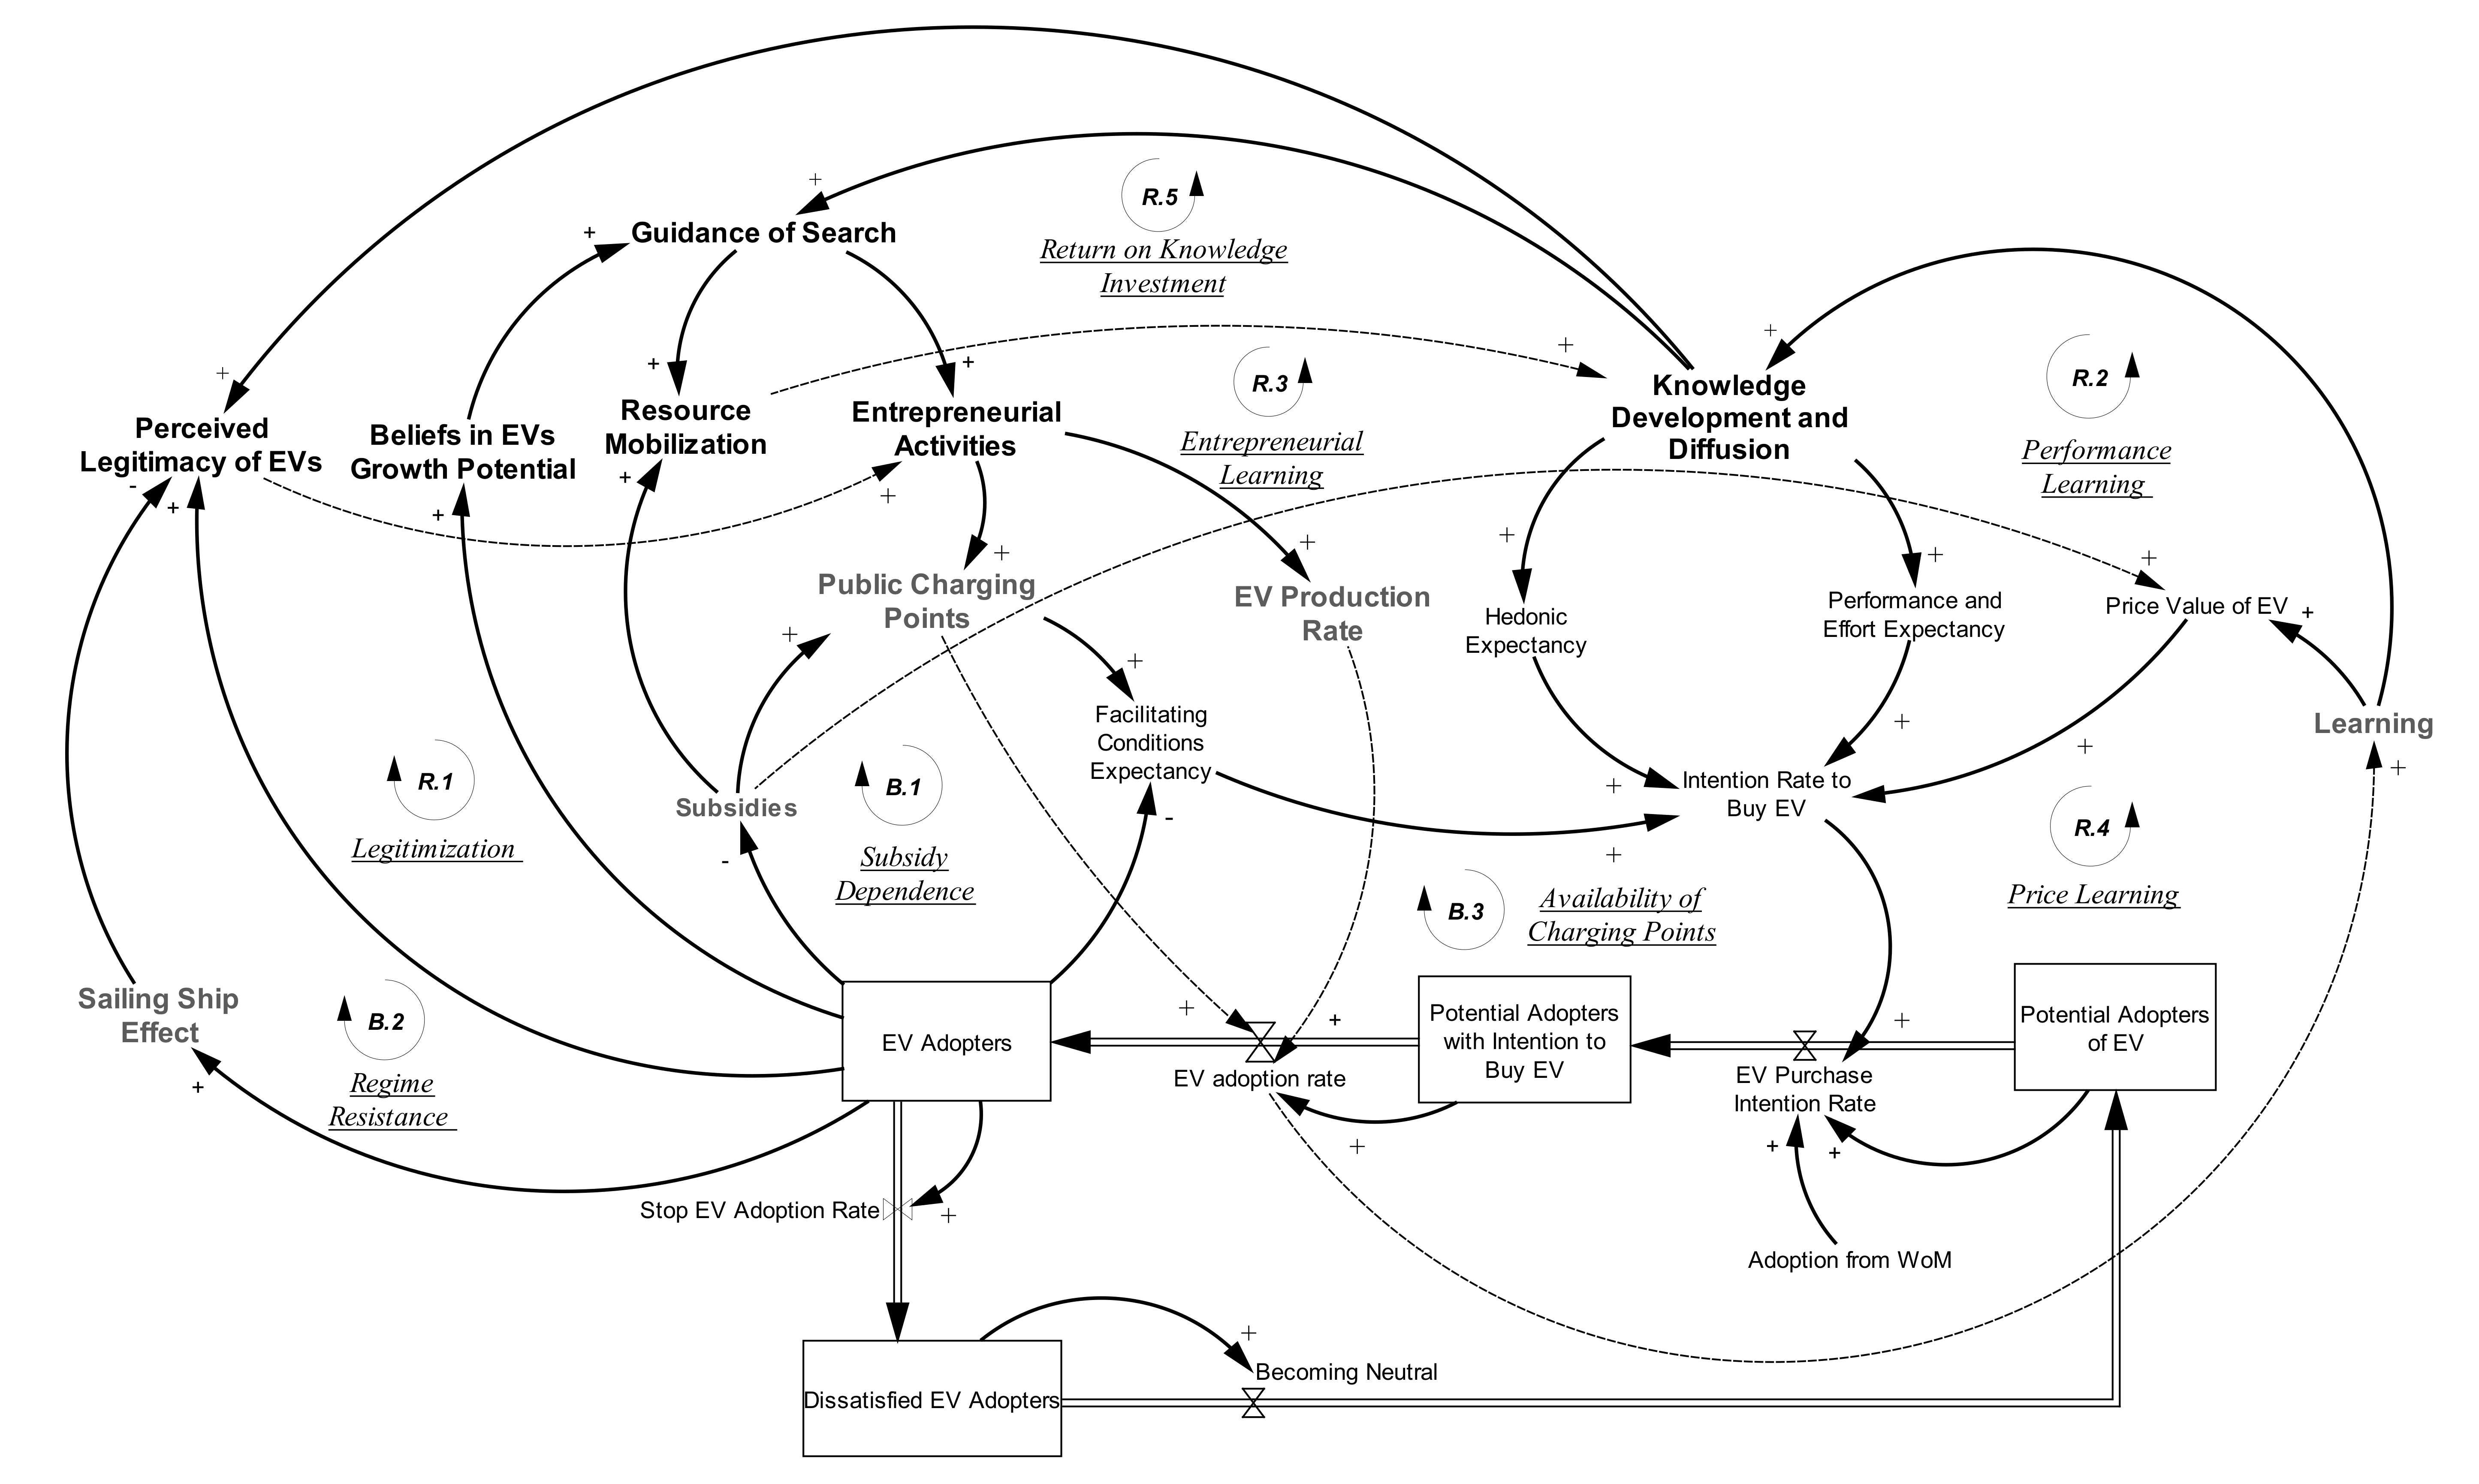
Figure 1. The stylized structure of the e-mobility system model (notably, bold fonts denote the macro-level variables).
Sustainability 13 00038 g001
Figure 2. The dynamic behavior of the total number of EV Adopters: the base run and scenarios 1 and 2.
Sustainability 13 00038 g002
Figure 3. Development of Perceived Legitimacy of EVs in different scenarios.
Sustainability 13 00038 g003
Figure 4. The development of Public Charging Points in different scenarios.
Sustainability 13 00038 g004
Figure 5. Development of Facilitating Conditions Expectancy in different scenarios.
Sustainability 13 00038 g005
Figure 6. The development of the total number of EV Adopters in different scenarios.
Sustainability 13 00038 g006
Figure 7. The development of EV Adopters in scenario 2-1 (income scenario).
Sustainability 13 00038 g007
Figure 8. The development of EV Adopters in scenario 2-2 (age scenario).
Sustainability 13 00038 g008
Figure 9. The development of EV Adopters in scenario 2-3 (urbanization scenario).
Sustainability 13 00038 g009
Table 1. Overview of the base run and the various scenarios.
Inclusion of E-Mobility Innovation SystemInclusion of UTAUT VariablesAll EV Purchasers Follow the Same Decision RuleAll EV Purchasers Are Considered as Early Adopters
Base caseNoNoNANA
Scenario 1YesNoNANA
Scenario 2YesYesYesYes
Scenario 2-1YesYesNoNo
Income ScenarioThe rules are different for each income classVarious timings for the first adoptions of different income classes
Scenario 2-2YesYesNoNo
Age ScenarioThe rules are different for each age groupVarious timings for the first adoptions of different age groups
Scenario 2-3YesYesNoNo
Urbanization ScenarioThe rules are different based on the urbanization level in which EV purchasers are livingVarious timings for the first adoptions of different groups living in different urbanization levels
Table 2. The assumed weights of UTAUT variables in different scenarios (NB: the weights follow from the logic described for each scenario).
ScenarioClass of EV PurchasersDefinitionPerformance and Effort WeightHedonic WeightPrice
Weight
Facilitating Conditions
Weight
Scenario 2Aggregated purchasers0.2750.0250.40.3
Scenario 2-1Income_10–10,000 € 0.290.050.350.31
Income_210,000–20,000 € 0.30.0750.30.325
Income_320,000–30,000 €0.3150.10.250.335
Income_430,000–40,000 €0.40.150.10.35
Income_540,000–50,000 €0.60.200.2
Income_650,000+ €0.2750.0250.40.3
Scenario 2-2Age_118–190.250.20.250.3
Age_220–290.30.1750.250.275
Age_330–390.350.150.250.25
Age_440–490.40.1250.250.225
Age_550–640.450.10.250.2
Age_665–740.50.0750.250.175
Age_775+0.550.050.250.15
Scenario 2-3Urbanization_1 Very high density0.20.030.570.2
Urbanization_2High density0.2250.050.50.225
Urbanization_3 Moderately high density0.280.070.40.25
Urbanization_4 Low density0.30.10.30.3
Urbanization_5 Very low density0.330.120.20.35
Publisher’s Note: MDPI stays neutral with regard to jurisdictional claims in published maps and institutional affiliations.