Abstract
Nowadays, following the increased interest and need for the issue of sustainability, tourist destinations are called upon to promote sustainable tourism development through the implementation of investments and initiatives. Despite the investments by the destinations, how are these perceived by tourists and residents? Based on this, this paper aims to assess the perception of sustainable investments in a coastal area located in Tuscany, through the administration of a questionnaire among 750 people, including both tourists and house owners. The study adopted statistical logit and probit models to detect the perception of sustainable initiatives in relation to beach satisfaction. Moreover, this research developed a model for understanding if there are substantial differences in perception between Italian and foreign beach users and at the same time between residents/house owners and tourists. The findings reveal that those who perceive investments in sustainability are more than satisfied with beach and facilities. The model shows that foreigners and residents/house owners perceive sustainable investments implemented in the destination more than tourists and Italian respondents. This research can provide support to local operators and policymakers in defining the destination image in relation to sustainability.
1. Introduction
Tourism is an important economic driver for the Mediterranean region, which is one of the main tourist destinations in the world [1]. Beach tourism is the most popular type of tourism in the Mediterranean [2], representing a growing business and predominant source of revenue, growth and jobs [3,4]. Tourist arrivals represent almost one-third of all worldwide arrivals [1]. This remarkable growth is in danger of being jeopardized by several factors, such as severe anthropic impacts and environmental risks, tourism pressure on territories, worsening conditions of seawater and overexploitation of the environment [5]. For decades, destinations in the Mediterranean have supported the model based on “sun, sea and sand” factors; however, the need to preserve natural and cultural resources and improve the competitiveness of destinations has led to adopting sustainable development strategies [6,7].
Tourism offers are based on natural, environmental and historical resources used to create experiences and services requested by tourists [8]. Considering the continuous expansion that has occurred in the tourism sector, it is advisable that tourism activities conceive the destination’s resources as limited. For this reason, sustainability, understood as the capacity to conserve resources by protecting and improving opportunities for the future [9,10], has become a focus of academic, policymakers’ and local operators’ attention.
Tourist destinations play a key role in adopting and promoting sustainable tourism with the aim of reducing tourism impacts on the environment. Given the growing attention of tourists toward sustainability [11], and considering the role it plays in national and international policies [5,12], sustainability becomes a strategic tool for destination promotion.
Empirical and theoretical studies have outlined users’ perceptions of sustainable beach management [13,14] and the role played by certification programs in destination management [15]. However, there is limited research on users’ perception in relation to sustainable initiatives adopted by coastal destinations.
Based on this, this study aims to analyze the perception of sustainable initiatives undertaken in marine tourism destinations in relation to beach satisfaction and the sociodemographic characteristics of respondents. This research focused on analyzing tourism sustainability in coastal destinations considering tourists’ and residents’ perspectives to detect how the sustainability promoted by territories is perceived. Furthermore, this research explored if a positive relationship exists between tourist satisfaction and its perception of sustainable investments adopted by the destination. Data were collected through a survey in the coastal destination of Versilia, located in the Tuscany Region of Italy. A statistical model has been applied to explore the relationship among the sustainable initiatives, beach satisfaction and sociodemographic characteristics of respondents.
2. Research Background
Beach tourism in Mediterranean destinations is characterized by a strong seasonality, mainly related to climatic factors, such as temperature, sunshine hours and the absence of rain [16]. On the other hand, the Mediterranean area is per se characterized by a high population density, intense maritime traffic and a high request of water for different uses (urban, industrial, agricultural) during the touristic season. In addition, the strong presence of tourists concentrated during summer months leads to the overcrowding of destinations and beaches, contributing to the exploitation of already-scarce resources [17]. Ongoing climatic changes are leading to a further increase of tourists, and the limited extension of the Mediterranean area, at the interface between African desert areas and central European temperate regions, makes it more prone to the dramatic worsening of the summer climate, with higher temperatures, longer dry periods and the increasing risk of wildfires. According to Alves et al. [3], the high number of people on beaches during the high season is problematic and causes unpleasant consequences, such as an inadequate number of beach facilities and the accumulation of litter.
Nowadays, the behavior of tourists is changing, tending to be more responsible [18,19]. Sustainability is a factor considered by tourists in their destination choice, and for this reason, it is crucial to adopt sustainable strategies and communicate them to consumers [20]. Understanding how the tourism offer is designed and how a destination is perceived can play an important role for destinations, as communication and the perception of a destination image influence tourist behavior and destination success [21]. The literature has developed the concept of destination image to analyze the psychological forces that motivate the traveler and influence destination choice since the mid-1960s. Researchers have examined the concept and developed several definitions [22,23,24,25]. However, image is usually defined as the sum of beliefs, ideas and impressions that a person has on a tourist destination [22,26,27,28,29]. There is consensus about the fact that the image of a destination includes three components: cognitive (beliefs and knowledge of the physical attributes of the destination), affective (emotions and feelings that a place evokes in tourists) and conative (behavioral intentions, influenced by cognitive and affective components) [27,30].
At the end of the 1990s, the concept of destination branding was introduced, and its academic interest had significantly grown since 2009. Ruiz-Real et al. [31], in a recent study, provided state-of-the-art review on destination branding as an important element regarding destination positioning. They highlighted the importance of planning a strategy on medium and long term destination branding, focusing on an authentic and experiential tourism offer which differentiates it from other destinations, allowing it to reach high customer-based brand equity.
Some authors have investigated the perception and satisfaction of beaches to provide useful information to support public and private sustainable beach management. Some studies have highlighted that despite the great efforts made by destinations to improve sustainable strategies, in some cases, these are not correctly perceived by tourists and residents [13]. The Blue Flag, which is one of the most recognized ecolabels for beaches, marinas and sustainable boating tourism operators in the world, represents one example of poor perception by users [2] and, in some cases, poor promotion in terms of brand image by municipalities and operators [15]. In fact, it is not enough to only adopt sustainable policies, and it is necessary to develop strategies that increase the awareness and responsibility of tourists and residents [32].
Dodds [33] highlighted the need to involve different stakeholders for the success of sustainable tourism policy implementation. A destination image unanimously shared by the stakeholders helps produce more competitive planning and communication [34]. Previous research on destination sustainability [35,36] highlighted that the perception of sustainable economic, social, cultural and environmental dimensions plays an important role for residents, which, in turn, impacts their perceived quality of life [37].
3. Research Method and Data Collection
This study adopts a quantitative approach to allow a deep investigation on sustainable initiatives adopted by institutions and how they are perceived by users. In order to achieve this aim, a survey was carried out on tourists and local residents in the Versilia area (Italy).
Versilia stretches along the Northern Tuscan coast, overlooking the Mediterranean Sea for over 20 kilometers, and includes 4 homogeneous municipalities (Camaiore, Forte dei Marmi, Pietrasanta and Viareggio). This area was chosen due to its involvement as a test site in the project “Models of Integrated Tourism in the Mediterranean - MITOMED+” (Interreg Mediterranean Programme). More precisely, Versilia was involved in Pilot Action 1, which included the observation and monitoring of tourism data indicators to measure the sustainability of tourism in several European Maritime & Coastal tourism destinations [38].
Given its proximity to big cities and densely populated areas of central-northern Italy and the presence of long beaches, Versilia developed as a marine resort since the beginning of the 20th century. In the sixties and seventies of the same century, reflecting the popularity of real estate investments, Versilia saw the growth of second homes, often rented to other visitors when not occupied by the owners. As in many other Mediterranean areas, the construction of hotels and second homes was often encouraged by the local administration as a motor for the local economy [39] and caused environmental problems and landscape modification, as evidenced elsewhere [40], in a time when environmental consciousness was still scarce.
According to Amelung and Viner [16], the Mediterranean tourism sector is characterized by a strong difference in occupancy rates between winter and summer, generating seasonality in destinations located along the coast. In Versilia, the highest occupancy rate is recorded in the peak season, with large differences in occupancy rates between winter and summer (Figure 1).
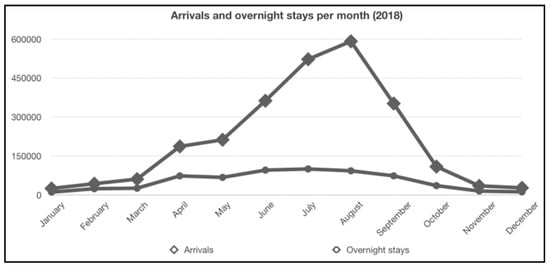
Figure 1.
Arrival and overnight stays per month (2018).
According to the official data of the Tuscany Region statistical office [41], the average length of tourists staying in the destination was about 4 days in 2018. The number of overnight stays in commercial and noncommercial accommodation for 2018 was 2,549,693, and the number of tourist arrivals was 630,381. In 2018, 57.5% of tourist arrivals and 56.2% of overnight stays were related to Italian nationals (domestic tourism). The occupancy rate in 2018 was 23.5%. The lowest occupancy rate was in January (2.4%) and the highest in August (60.7%) and July (56.5%).
The survey carried out in Versilia was created in the framework of the MITOMED+ project and took into consideration literature [13,42,43] and the questionnaire “Visitor Survey” suggested by the “European Tourism Indicators System, 2016” [44]. The questionnaire was administered with the aim of investigating aspects of coastal destinations, with particular reference to sustainability and the level of beach satisfaction. For this reason, the survey comprised the following sections: (i) the first part for the collection of general information about the respondents; (ii) the second part to detect the general level of tourists’ destination perceptions; (iii) the third part to assess the level of beach satisfaction. The questions were of the closed-ended type with the possibility to mark one or more answers. A Likert-type scale from 1 (extremely dissatisfied) to 5 (very satisfied) was used for each of the items related to detecting destination and beach satisfaction.
The questionnaires were administered in July and August, 2018, both in Italian and English, by trained interviewers. A total of 750 questionnaires were collected. The face-to-face survey allowed us to contextualize the aim of the questionnaire and, at the same time, this method allowed us to collect questionnaires without missing data or response bias. Data were calculated using R software.
This research comprised three main stages: (i) analysis of respondents’ profile and characteristics; (ii) analysis of beach satisfaction level; (iii) analysis, through logit and probit models [45], of the perception of sustainable initiatives invested in the destination in relation to beach satisfaction and social variables.
4. Results and Discussion
The first step of the study focused on the analysis of the sociodemographic characteristics of beach users. Table 1 reports the absolute and relative frequencies of responses with regard to gender, age group, country of residents and type of user.

Table 1.
Characteristics of the sample.
The sample interviewed comprised 44.4% of females and 55.6% of males. Most of the respondents were aged between 25 and 34 years (26%), followed by 23.9% from the 15–24 age group. The majority of the sample (69.5%) were Italian respondents. In total, 19.6% of the respondents were Europeans (EU) who came mainly from France (9.2%), the Netherlands (4.4%) and Belgium (2%). As for non-EU tourists, for Extra EU (10.9%), the most representative markets are those from Albania (3.1%), Switzerland (2.8%) and China (2.7%).
The most common type of interviewee could be classified as a tourist (50.4%), which is a person with an overnight stay [47], followed by a house owner (30.3%). Only 0.4% of respondents were local residents and 6.9% daily excursionists. In total, 45.2% of respondents were in the Versilia area with their family and 44% with a group of friends. The length of stay reported is five nights (24.7%), followed by a longer stay of >7 nights (21.7%). This result is in line with the statistical data of the Tuscany Region, in which the average length of stay in July was five days and in August was six days.
The second phase of the research focused on the understanding of beach satisfaction by respondents. The constant monitoring of tourists’ satisfaction represents one of the most important indicators of a destination’s success [14,48]. Figure 2 shows a heatmap of the beach users’ response frequency for the items of the analysis.
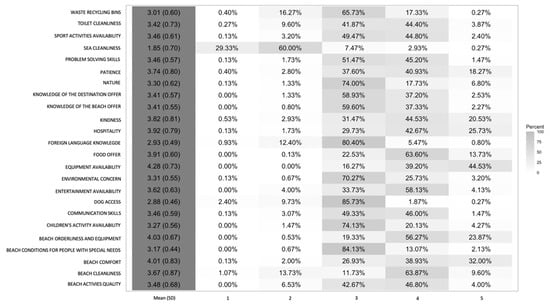
Figure 2.
Likert heatmap of response frequency. On the x-axis, the mean, standard deviation (SD) and Likert scale (from 1, very dissatisfied, to 5, very satisfied) are represented. The y-axis shows the items analyzed related to beach satisfaction (alphabetical order). N = 750.
Items included in the questionnaire to detect beach satisfaction have been categorized into three main homogenous variables, defined as: (i) satisfaction with the beach and facilities; (ii) satisfaction with beach activities; (iii) satisfaction with beach employees.
Satisfaction with the beach and facilities was used to detect visitor satisfaction with the beach, which included equipment availability, beach orderliness, toilet cleanliness, beach cleanliness, beach comfort, sea cleanliness, beach condition for people with disabilities, waste recycling bins, nature, environmental concern, dog access and food. The reliability coefficient (Cronbach’s alpha) was 0.717. Figure 3 shows the level of satisfaction and dissatisfaction from survey responses to questions on the beach and facilities. Five items (out of 12) show a high level of satisfaction (more than 70% satisfied). More than 80% of respondents were neither satisfied nor dissatisfied when questioned on dog access and beach conditions for people with special needs. The lowest values reflected dissatisfaction with sea cleanliness (89%). This result aligns with those reported in the study conducted by Marin et al. [13] in six coastal municipalities in the neighbor Liguria Region (Italy), in which the uncleanliness of the sea was considered as a disturbance factor by interviewees. Despite the high percentage of dissatisfied respondents with sea cleanliness, 72.9% of those were satisfied with beach cleanliness, as a factor on which beach operators have stricter control. Furthermore, it emerged that 61.8% of those dissatisfied with sea cleanliness had already previously visited Versilia, giving evidence to the fact that different factors impact the choice to visit a destination.
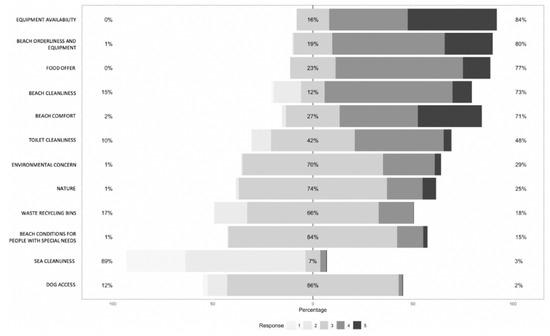
Figure 3.
Bar plot satisfaction with beach and facilities. The percentages of respondents who were very satisfied (5) and satisfied (4) are shown on the right of the zero line. The percentage of respondents who were very dissatisfied (1) and dissatisfied (2) are shown on the left. The percentage of respondents who were neither satisfied nor dissatisfied are split down the middle and shown in a neutral color. N = 750.
Satisfaction with beach activities included: sports activities, entertainment, children’s activities and the quality of beach activities. The reliability coefficient (Cronbach’s alpha) was 0.686. Figure 4 shows a low percentage of dissatisfaction with beach activities. Respondents were on average satisfied with the activities offered on the beach, except 74% of respondents, who were neither satisfied nor dissatisfied with children’s activity availability.
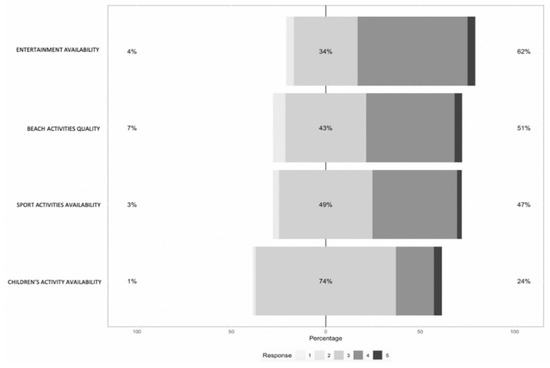
Figure 4.
Bar plot satisfaction with beach activities. The percentages of respondents who were very satisfied (5) and satisfied (4) are shown on the right of the zero line. The percentage of respondents who were very dissatisfied (1) and dissatisfied (2) are shown on the left. The percentage of respondents who were neither satisfied nor dissatisfied are split down the middle and shown in a neutral color. N = 750.
Satisfaction with beach employees included items such as beach employees’ ability in problem-solving skills, kindness, patience, hospitality, communication skills, destination offer knowledge, beach offers’ knowledge and foreign language knowledge. The reliability coefficient (Cronbach’s alpha) was 0.880. Figure 5 shows a high level of satisfaction with beach employees. Foreign language knowledge was the only item representing 80% of respondents who were neither satisfied nor dissatisfied, with 13% of respondents dissatisfied. The result of those who were neither satisfied nor dissatisfied is in line with the percentage of Italian respondents, which is around 70%, who, therefore, provided a neutral evaluation, as they most likely did not interact in a foreign language with the beach staff.
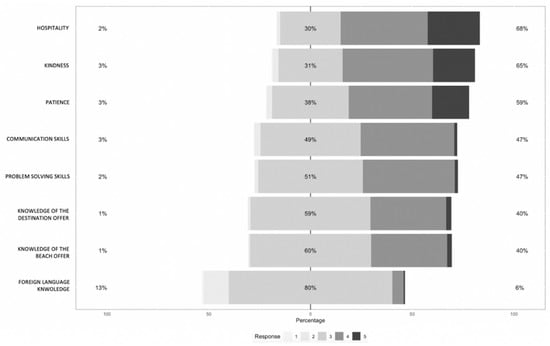
Figure 5.
Bar plot satisfaction with beach employees. The percentages of respondents who were very satisfied (5) and satisfied (4) are shown on the right of the zero line. The percentage of respondents who were very dissatisfied (1) and dissatisfied (2) are shown on the left. The percentage of respondents who were neither satisfied nor dissatisfied are split down the middle and shown in a neutral color. N = 750.
Beach facilities, beach activities and beach employees are the three main categories analyzed to monitor the satisfaction level of beaches in Versilia. Many destinations use the indicator related to user satisfaction for planning tourism destination management [14]. For our analysis, we identified three categories, including several items that contribute to the definition of the coastal tourist offer. For this reason, we include beach categories in the statistical model estimated to explore the relationship between these and sustainable initiatives made in Versilia.
Logit and probit models were adopted, in the third step of the study, to understand the perception of investments on sustainable initiatives by understanding the variance examined through respondents’ characteristics and beach satisfaction (Table 2). The dependent variable of the model is related to a specific question on the sustainable initiatives: “Do you think that the sustainable initiatives are sufficiently invested in?”. Here, the possible answer was yes (Code: 1) or no (Code: 0). The independent variables of the model suggested are related to: (i) sociodemographic characteristics, such as country (Italian or foreign), gender (male or female), type of user (resident/house owner or tourist), age and type of traveler (family, group of friends, partner, alone); (ii) beach satisfaction categories, such as satisfaction with beach and facilities, satisfaction with beach activities and satisfaction with beach employees.
Table 2.
Perception of sustainable initiatives: logit and probit models.
The gender variable was found to have no significant effect on the model, which is in line with the findings of Dodds and Holmes [49]. The nationality (Italian or foreign), type of user and type of travelers had a significant effect.
Foreigners seem to be more sensitive than Italian respondents to investments in sustainability. According to the model, being a foreigner increases the probability of answering positively to the question about initiatives on sustainability by 24.14%. This is contrary to the findings of Bernini et al. [50], who found no significant differences between Italian and foreign tourists about this topic. Other authors have observed a clear difference between international tourists, choosing their destination on the basis of environmental quality and cultural value, and domestic tourists, driven mainly by beach length [51] or social interactions and recreation [52].
Residents and house owners perceive sustainable investments implemented in the destination more than tourists. According to the model, being a resident and a house owner increases the probability of answering positively to the question about sustainable initiatives investments by 30.90%. In line with previous studies [53,54], this finding could reflect that people who are more attached to their territory tend to positively perceive investments in the destination and pay more attention to the environment. More precisely, in this case, residents and house owners living and knowing the destination perceive investments more than tourists who “live” in the destination only for a short period. The attachment to the destination by a second homeowner has been evidenced by several authors: the decision to buy or build a second home comes after a long frequentation, as a tourist seeks a closer relationship with one specific place [55] and a second home-owners visit their second homes regularly [56]. The vacation residence can be seen as the expression of a longing for roots and identity in a place [57], and owners have been shown to have social relationships with other owners, returning tourists and local residents. These relationships, that build a common gaze toward local problems, are substantially lacking for occasional tourists [57]. These data are partially confirmed also by the knowledge of the Blue Flag mark for beaches. In 2018, despite that each municipality of our analysis had beaches certified as Blue Flag, only 30% of tourists claimed to be aware of the certification. At the same time, only 1% of tourists interviewed stated that the Blue Flag certification influenced the destination choice. These results align with previous studies reporting a lack of knowledge and perception of Blue Flag certification [2].
Furthermore, the model shows that those who travel alone are more sensitive to sustainable investments than those who travel with family, partners or a group of friends. On the one hand, this result could be related to the fact that traveling in groups is correlated to the reason for travel choice. For example, we can assume that those who travel in groups are more attentive to entertainment and less to sustainability. On the other hand, in a previous study, Arana and León [58] showed that traveling in groups increases the level of CO2 emissions compared to those traveling alone, upholding the evident gap between personal and group decisions.
Results of the prediction model show differences between the three variables related to the satisfaction of “beach and facilities,” “beach activities” and “beach employees.”
Satisfaction with “beach and facilities” has a significant positive effect, predicting that respondents assess that sustainable initiatives have been made in the destination. More precisely, the findings show that the more satisfied the respondents are, the more it is possible that they answer “yes” to questions regarding investments in sustainability. This prediction remains valid even considering sociodemographic components.
Instead, the more satisfied the respondents are with “beach activities” and “beach employees,” the more it is possible that they answer “no” to questions regarding sustainable investment. The perception of satisfaction to activities (such as sports activities, entertainment, children activity and beach activity quality) and employees (such as kindness, patience, hospitality, communication skills, problem-solving skills, destination offer knowledge, beach offer knowledge and foreign language knowledge) are inversely correlated with the perception of how much destination has invested in sustainability initiatives.
The findings reveal that those who perceive sustainable investments are more satisfied with the “beach and facilities” (such as equipment availability, toilet cleanliness, beach cleanliness, beach comfort, beach conditions for people with disabilities, waste recycling bins). Dodds and Holmes [49], in their study, confirmed that satisfaction with the beach and facilities are the strongest predictors of beachgoer satisfaction.
5. Conclusions
In recent years, destinations have paid increasing attention to sustainability initiatives, according to the growing tourist interest in sustainable holiday experiences. Previous studies showed that despite positive attitudes toward sustainable tourism, only few tourists choose to buy sustainable products/services [59]. This study aims to contribute to the research on the perception of sustainability initiatives in coastal areas by helping to clarify whether, and in what way, users really perceive the efforts made by destinations to implement and develop sustainable strategies. The research analyzed the perception of Italians and foreigners but also considered separately the point of view of residents/house owners and tourists with the aim of understanding the role that house owners play in the perception of sustainability, which impacts their quality of life.
The results of the research could provide support to policymakers and local operators in decisions relating to communication and defining destination image, with particular reference to the issue of sustainability, offering additional information with respect to official statistical data. The study shows that there is a correlation between satisfaction with beach facilities and the perception that sustainable investments have been made in the destination. For a destination that wants to make investments in sustainability and at the same time promote them toward tourists, the high attention gained by investments oriented to beach facilities should be considered.
Future research is needed to overcome the limitations of this study, and only the comparison of Versilia with other coastal destinations could allow verifying the possibility of generalizing our results, not only in Italy but also abroad, to clarify how beach users’ perception in relation to sustainable initiatives changes from county to country. One limitation of the study is represented by the variables included in the questionnaire. It included social variables such as gender, country of residence, type of user or type of traveler, but it did not include, for example, socioeconomic variables, such as level of education or employment. These variables would allow us to analyze more in depth the influence of environmental awareness of beach users.
Moreover, it would be interesting to analyze the online communications used to transmit sustainable initiatives set up in Versilia by operators and institutions. Official destination websites are the main channels communicating sustainability issues to consumers [60]. For this reason, the image of the sustainable destination communicated through websites can influence tourists’ behavior, making them also more aware of sustainable initiatives and strategies adopted by destinations. This would further allow us to verify more in detail if policymakers and local operators’ efforts are correctly perceived by tourists and residents.
Author Contributions
Conceptualization, V.M.; Data curation, V.M. and F.M.; Formal analysis, V.M.; Funding acquisition, A.R.; Investigation, V.M., A.R. and F.M.; Methodology, V.M., A.R. and F.M.; Validation, V.M., A.R. and F.M.; Writing—original draft, V.M.; Writing—review & editing, A.R. and F.M. All authors have read and agreed to the published version of the manuscript.
Funding
This research was carried out within the project Interreg Mediterranean “Models of integrated tourism in the Mediterranean Plus—MITOMED+” (1MED15-3.1-M23- 295).
Conflicts of Interest
The authors declare no conflict of interest. The funders had no role in the design of the study; in the collection, analyses, or interpretation of data; in the writing of the manuscript, or in the decision to publish the results.
References
- UNWTO—World Tourism Organization. Tourism in the Mediterranean, 2015 Edition. Available online: https://www.e-unwto.org/doi/pdf/10.18111/9789284416929 (accessed on 29 September 2020).
- Dodds, R.; Holmes, M.R. Beach tourists; what factors satisfy them and drive them to return. Ocean Coast. Manag. 2019, 168, 158–166. [Google Scholar] [CrossRef]
- Alves, B.; Benavente, J.; Ferreira, Ó. Beach users’ profile, perceptions and willingness to pay for beach management in Cadiz (SW Spain). J. Coast. Res. 2014, 70, 521–526. [Google Scholar] [CrossRef]
- Gao, J.; Xu, W.; Zhang, L. Tourism, economic growth, and tourism-induced EKC hypothesis: Evidence from the Mediterranean region. Empir. Econ. 2019, 1–23. [Google Scholar] [CrossRef]
- UNEP—United Nations Environment Programme; UNWTO World Tourism Organization. Making Tourism More Sustainable: A Guide for Policy Makers. 2005. Available online: https://wedocs.unep.org/handle/20.500.11822/8741 (accessed on 29 September 2020).
- Apostolopoulos, Y.; Sönmez, S. New directions in Mediterranean tourism: Restructuring and cooperative marketing in the era of globalization. Thunderbird Int. Bus. Rev. 2000, 42, 381–392. [Google Scholar] [CrossRef][Green Version]
- Cameron, C.M.; Gatewood, J.B. Beyond sun, sand and sea: The emergent tourism programme in the Turks and Caicos Islands. J. Herit. Tour. 2008, 3, 55–73. [Google Scholar] [CrossRef]
- World Tourism Organization; European Travel Commission. Handbook on Tourism Product Development; World Tourism Organization: Madrid, Spain, 2011. [Google Scholar]
- McIntyre, G.; Hetherington, A.; Inskeep, E. Sustainable Tourism Development: Guide for Local Planners, 1st ed.; World Tourism Organization: Madrid, Spain, 1993. [Google Scholar]
- Butler, R.W. Sustainable tourism: A state-of-the-art review. Tour. Geogr. 1999, 1, 7–25. [Google Scholar] [CrossRef]
- Edgell, D.L., Sr. Managing Sustainable Tourism: A Legacy for the Future, 1st ed.; Haworth Press: New York, NY, USA, 2019. [Google Scholar]
- UNWTO—World Tourism Organization. Tourism and the Sustainable Development Goals. 2015. Available online: https://www.e-unwto.org/doi/pdf/10.18111/9789284417254 (accessed on 29 September 2020).
- Marin, V.; Palmisani, F.; Ivaldi, R.; Dursi, R.; Fabiano, M. Users’ perception analysis for sustainable beach management in Italy. Ocean Coast. Manag. 2009, 52, 268–277. [Google Scholar] [CrossRef]
- Brščić, K.; Šugar, T. Users’ perceptions and satisfaction as indicators for sustainable beach management. Tour. Hosp. Manag. 2020, 26, 33–48. [Google Scholar] [CrossRef]
- Pencarelli, T.; Splendiani, S.; Fraboni, C. Enhancement of the “Blue Flag” Eco-label in Italy: An empirical analysis. Anatolia 2016, 27, 28–37. [Google Scholar] [CrossRef]
- Amelung, B.; Viner, D. Mediterranean tourism: Exploring the future with the tourism climatic index. J. Sustain. Tour. 2006, 14, 349–366. [Google Scholar] [CrossRef]
- Roca, E.; Riera, C.; Villares, M.; Fragell, R.; Junyent, R. A combined assessment of beach occupancy and public perceptions of beach quality: A case study in the Costa Brava, Spain. Ocean Coast. Manag. 2008, 51, 839–846. [Google Scholar] [CrossRef]
- Wehrli, R.; Egli, H.; Lutzenberger, D.; Pfister, J.; Scwarz, J.; Steettler, J. Is There Demand for Sustainable Tourism? Study for the World Tourism Forum Lucerne 2011; ITW Working Papers Series Tourism 001/2011; Lucerne University of Applied Sciences and Arts: Luzern, Switzerland, 2011. [Google Scholar]
- Kucukusta, D.; Mak, A.; Chan, X. Corporate social responsibility practices in four and five-star hotels: Perspectives from Hong Kong visitors. Int. J. Hosp. Manag. 2013, 34, 19–30. [Google Scholar] [CrossRef]
- Buhalis, D. Marketing the competitive destination of the future. Tour. Manag. 2000, 21, 97–116. [Google Scholar] [CrossRef]
- Tasci, A.D.; Gartner, W.C. Destination image and its functional relationships. J. Travel Res. 2007, 45, 413–425. [Google Scholar] [CrossRef]
- Crompton, J.L. An assessment of the image of Mexico as a vacation destination and the influence of geographical location upon that image. J. Travel Res. 1979, 17, 18–23. [Google Scholar] [CrossRef]
- Dichter, E. What’s in an image. J. Consum. Mark. 1985, 2, 75–81. [Google Scholar] [CrossRef]
- Fakeye, P.C.; Crompton, J.L. Image differences between prospective, first-time, and repeat visitors to the Lower Rio Grande Valley. J. Travel Res. 1991, 30, 10–16. [Google Scholar] [CrossRef]
- Gallarza, M.G.; Saura, I.G.; García, H.C. Destination image: Towards a conceptual framework. Ann. Tour. Res. 2002, 29, 56–78. [Google Scholar] [CrossRef]
- Kotler, P.; Bowens, J.; Makens, J. Marketing for Hospitality and Tourism, 2nd ed.; Prentice Hall: Upper Saddle River, NJ, USA, 1996. [Google Scholar]
- Baloglu, S.; McCleary, K.W. A model of destination image formation. Ann. Tour. Res. 1999, 26, 868–897. [Google Scholar] [CrossRef]
- Kim, D.; Perdue, R.R. The influence of image on destination attractiveness. J. Travel Tour. Mark. 2011, 28, 225–239. [Google Scholar] [CrossRef]
- Assaker, G.; Hallak, R. Moderating effects of tourists’ novelty-seeking tendencies on destination image, visitor satisfaction, and short-and long-term revisit intentions. J. Travel Res. 2013, 52, 600–613. [Google Scholar] [CrossRef]
- Gartner, W.C. Image formation process. J. Travel Tour. Mark. 1994, 2, 191–216. [Google Scholar] [CrossRef]
- Ruiz-Real, J.L.; Uribe-Toril, J.; Gázquez-Abad, J.C. Destination branding: Opportunities and new challenges. J. Destin. Mark. Manag. 2020, 17, 100453. [Google Scholar]
- Pulido-Fernández, J.I.; López-Sánchez, Y. Perception of sustainability of a tourism destination: Analysis from tourist expectations. Int. Bus. Econ. Res. J. (IBER) 2014, 13, 1587–1598. [Google Scholar] [CrossRef][Green Version]
- Dodds, R. Sustainable tourism and policy implementation: Lessons from the case of Calvia, Spain. Curr. Issues Tour. 2007, 10, 296–322. [Google Scholar] [CrossRef]
- Kong, W.H.; du Cros, H.; Ong, C.E. Tourism destination image development: A lesson from Macau. Int. J. Tour. Cities 2015, 1, 1–17. [Google Scholar] [CrossRef]
- Purvis, B.; Mao, Y.; Robinson, D. Three pillars of sustainability: In search of conceptual origins. Sustain. Sci. 2019, 14, 681–695. [Google Scholar] [CrossRef]
- Ghanem, M.; Elgammal, I. Communicating sustainability through a destination’s website: A checklist to inform, motivate, and engage stakeholders. J. Travel Tour. Mark. 2017, 34, 793–805. [Google Scholar] [CrossRef]
- Mathew, P.V.; Sreejesh, S. Impact of responsible tourism on destination sustainability and quality of life of community in tourism destinations. J. Hosp. Tour. Manag. 2017, 31, 83–89. [Google Scholar] [CrossRef]
- Brščić, K.; Prats Planaguma, L.; Raschi, A.; Marchi, V.; Šugar, T.; Lovrečić, K.; Poljuha, D. Can indicators for sustainable tourism improve tourism planning in the coastal destinations? Empirical evidence from Catalonia, Istrian Region and Tuscany Region. Tour. Int. Interdiscip. J. 2020, 68, 144–155. [Google Scholar] [CrossRef]
- Rebollo, J.F.V.; Baidal, J.A.I. Perceptions and Policy Responses in Torrevieja, Spain. In Coastal Mass Tourism: Diversification and Sustainable Development in Southern Europe; Bramwell, B., Ed.; Channel View Pubblication: Clevedon, UK, 2004; Volume 12, pp. 176–200. [Google Scholar]
- Mathieson, A.; Wall, G. Tourism, Economic, Physical and Social Impacts; Longman: London, UK, 1982. [Google Scholar]
- Tuscany Region. Tourism Statistics. Movimento Turisti Nelle Strutture Ricettive e Struttura Dell’offerta: Dati 2018. Available online: https://www.regione.toscana.it/-/movimento-turisti-nelle-strutture-ricettive-e-struttura-dell-offerta-dati-2018 (accessed on 10 October 2020).
- Cervantes, O.; Espejel, I.; Arellano, E.; Delhumeau, S. Users’ Perception as a Tool to Improve Urban Beach Planning and Management. Environ. Manag. 2008, 42, 249–264. [Google Scholar] [CrossRef] [PubMed]
- Lozoya, J.P.; Sardá, R.; Jiménez, J.A. Users expectations and the need for differential beach management frameworks along the Costa Brava: Urban vs. natural protected beaches. Land Use Policy 2014, 38, 397–414. [Google Scholar] [CrossRef]
- ETIS—European Tourism Indicators System for Sustainable Destination Management, ETIS Survey. Available online: https://ec.europa.eu/docsroom/documents/15849 (accessed on 10 October 2020).
- Stock, J.H.; Watson, M.W. Introduzione All’econometria, 1st ed.; Pearson Education Italia Srl: Milan, Italy, 2005; pp. 293–318. [Google Scholar]
- European Unione. The 27 Member Countries of EU. Available online: https://europa.eu/european-union/about-eu/countries_en (accessed on 21 April 2020).
- UNWTO—World Tourism Organization. Glossary of Tourism Terms. Available online: https://www.unwto.org/glossary-tourism-terms (accessed on 29 September 2020).
- Soldić Frleta, D. Shifts in tourists’ attitudes towards the destination offering. Tour. Hosp. Manag. 2018, 24, 257–270. [Google Scholar] [CrossRef]
- Dodds, R.; Holmes, M.R. Education and certification for beach management: Is there a difference between residents versus visitors? Ocean Coast. Manag. 2018, 160, 124–132. [Google Scholar] [CrossRef]
- Bernini, C.; Urbinati, E.; Vici, L. Visitor expectations and perceptions of sustainability in a mass tourism destination. In Proceedings of the 3rd International Scientific Conference Tourism in Southern and Eastern Europe, Opatija, Croatia, 14–16 May 2015; University of Rijeka, Faculty of Tourism and Hospitality Mangement: Rijeka, Croatia, 2015; Volume 3, pp. 1–17. [Google Scholar]
- Onofri, L.; Nunes, P.A.L.D. Beach ‘lovers’ and ‘greens’: A worldwide empirical analysis of coastal tourism. Ecol. Econ. 2013, 88, 49–56. [Google Scholar] [CrossRef]
- Awaritefe, O.D. Destination environment quality and tourists’ spatial behaviour in Nigeria: A case study of third world tropical Africa. Int. J. Tour. Res. 2003, 5, 251–268. [Google Scholar] [CrossRef]
- Bonaiuto, M.; Breakwell, G.M.; Cano, I. Identity processes and environmental threat: The effects of nationalism and local identity upon perception of beach pollution. J. Community Appl. Soc. Psychol. 1996, 6, 157–175. [Google Scholar] [CrossRef]
- Roca, E.; Villares, M.; Ortego, M.I. Assessing public perceptions on beach quality according to beach users’ profile: A case study in the Costa Brava (Spain). Tour. Manag. 2009, 30, 598–607. [Google Scholar] [CrossRef]
- Tuulentie, S. Settled Tourists: Second Homes as a Part of Tourist Life Stories. Scand. J. Hosp. Tour. 2007, 7, 281–300. [Google Scholar] [CrossRef]
- Müller, D.K. Second home ownership and sustainable development in Northern Sweden. Tour. Hosp. Res. 2002, 3, 343–355. [Google Scholar] [CrossRef]
- Aronsson, L. Place Attachment of Vacation Residents: Between tourists and permanent residents. In Tourism, Mobility, and Second Homes: Between Elite Landscape and Common Ground Channel View; Hall, C.M., Müller, D.K., Eds.; Channel View Publications: Clavedon, UK, 2004; Volume 15, pp. 75–86. [Google Scholar]
- Arana, J.E.; León, C.J. Are tourists animal spirits? Evidence from a field experiment exploring the use of non-market based interventions advocating sustainable tourism. J. Sustain. Tour. 2016, 24, 430–445. [Google Scholar] [CrossRef]
- Budeanu, A. Sustainable tourist behavior—A discussion of opportunities for change. Int. J. Consum. Stud. 2007, 31, 499–508. [Google Scholar] [CrossRef]
- Tölkes, C. The role of sustainability communication in the attitude–behaviour gap of sustainable tourism. Tour. Hosp. Res. 2020, 20, 117–128. [Google Scholar] [CrossRef]


Publisher’s Note: MDPI stays neutral with regard to jurisdictional claims in published maps and institutional affiliations. |
© 2020 by the authors. Licensee MDPI, Basel, Switzerland. This article is an open access article distributed under the terms and conditions of the Creative Commons Attribution (CC BY) license (http://creativecommons.org/licenses/by/4.0/).