2.1. Study 1
The first study aimed to develop a psychological analysis tool designed identify the degree of parental alienation in children who have been subjected to dysfunctional relationships with their parents [
13], in relation with eight criteria (a campaign of denigration of one of the parents; weak, absurd, or frivolous rationalizations for the deprecation; lack of ambivalence; “the independent thinker” phenomenon; reflexive support of the alienating parent in the parental conflict; absence of guilt over cruelty to and/or exploitation of the alienated parent; the presence of borrowed scenarios; and the spread of animosity to the friends and/or extended family of the alienated parent), depending on the three stages of PAS: Mild, moderate, and severe PA [
16].
Procedure. A number of five Romanian experts, four females (75%) and one male (25%), with an average age of 43.5 years old and an average professional seniority for 16 years, all clinical psychologists, with a specialization level varying from specialist to consultant, participated in this phase.
These eight criteria were in fact the elements upon which the questionnaire was developed: The campaign of denigration of the rejected/target parent, the child’s unconvincing arguments, the absence of the child’s ambivalence towards the rejected/target parent, the “independent thinker” phenomenon, the unconditional support of the preferred/denigrating parent, the absence of guilt, the borrowed scenarios, and the extension of animosity upon the rejected parent’s family [
17]. The tool was designed as a behaviorally anchored rating scale, depending on the frequency of the occurrence of such behavior (where 0 refers to the absence of behavior and 4 refers to the highest frequency of such behavior): Absent-0, Rare (1–3 times)-1, Moderate (3–6 times)-2, Often (6–8 times)-3, All the time (over 10 times)-4. After defining the criteria that are characteristic for parental alienation [
17], 119 items were designed to cover all the aforementioned eight areas.
These items were submitted for analysis to the group of experts in order for them to carry out a qualitative analysis. The task assigned to the experts was to analyze the extent to which the content of these items reflects the criteria and dimensions that have been put forward, using an assessment scale from 1 to 10, where 1 represents the total lack of relevance of the item for the criterion/dimension that was developed, and 10 represents the absolute relevance of the item for the respective criterion/dimension.
Results. Only the items that received an average score of 8 to10 points were considered significant and were kept to the final form of the questionnaire. Following the analysis conducted by the experts, the number of items was reduced from 119 to 101, a number of 18 items being thus eliminated, as they scored less than 8 points. We named the instrument of 101 items resulting from Study 1 the Parental Alienation Questionnaire (PAQ).
2.3. Study 3
The third study was concerned with optimizing PAQ in order to explore and confirm its theoretical structure.
Procedure. A number of 267 subjects of Romanian origin, i.e., 157 boys (58.80%) and 110 girls (41.20%), aged from 3 to 18 years old (girls’ average age: 10.94; boys’ average grade: 10.45, and overall average age: 10.74 years, SD = 3.94), who came from divorced/separated families and/or families undergoing divorce/separation proceedings, attended this stage. Their cases were analyzed using PAQ by clinical psychologists specialized in assessing the child and the divorce circumstances, as well as by clinical psychologists/psychotherapists specialized in psychological interventions in children. All these assessments or psychological interventions took place within the context of certain procedures required for determining and setting the custody or residence of the child, upon the order of a law court, the police, or the prosecutor’s office.
Results. One of the main objectives of the study was to determine the internal attributes that underlie the aforementioned items of PA and that influence evolution thereof. To do this, we employed the SPSS 20 program, using the principal axis factor analysis to extract the common factors. Prior to implementing this analysis, we analyzed the applicability of the method in relation to the set of data we considered. Therefore, the overall result for the Kaiser–Meyer–Olkin test was 0.97, all individual results being also higher than 0.9. According to Field (2000) these values are excellent so that one may conclude that the sample is eligible for the application of the factor analysis. To verify the extent to which we are dealing with an identity matrix, the Bartlett’s test of Sphericity was applied. The statistically significant result (p < 0.0005) of this test also indicated that it is possible to apply the factor analysis. As the applicability of this method was successfully verified, the analysis was applied onto the 101-item questionnaire that quantified the characteristics of parental alienation for 267 respondents.
We obtained the factorial solution after the completion of the principal axis factoring and the Direct Oblimin oblique rotation. This type of rotation was chosen because, according to the theoretical model that has been outlined, we expected to find correlations between factors. Twenty-four items with a saturation over 0.50 were selected and a second factor analysis was applied to obtain the final solution for them. The degree of commonality for each item was then analyzed; subject to analysis was also the saturation of each factor that has been extracted.
The degree of communality of the variables is highlighted in
Table 2. For all items, the communality presented values that were higher than 0.50; so, these values indicate that each of these items was largely influenced by the factors that have been extracted.
Table 3 highlights the total variance obtained by principal axis factoring. The result is saturated items in eight factors that, taken all together, account for 92.47% of the total dispersion of the items. Each factor influences 76.4%, 4.91%, 3.65%, 2.08%, 1.63%, 1.45%, 1.29%, and 1.07% of the total variance, respectively.
As can be noticed from
Table 3, the factor analysis shows as the most significant factor, covering 76.38% of the variance, the unconvincing arguments that a child brings in order to explain the reasons of rejecting the meetings with the parent. The second main factor covering 4.90% of the variance refers to extended animosity related to the parent’s extended family members. The factor correlations in the rotated solution are presented in
Table 4. As can be seen, factor correlations are acceptable for the oblique rotation. Taking into consideration the theoretical model of eight factors that guided the construction of the behavioral anchor scale and also the value of correlation coefficients for the items (
Table 5) we focused on a model with two main factors and six subsidiary ones.
The final factor loading is outlined by
Table 5.
The content analysis indicates that three items are related to factor one and highlight the child’s unconvincing arguments regarding the rejection of the alienated parent. When giving these arguments, the child is staring with an accusing look, at the same time with a convincing but yet tense and defensive attitude. Thus, the factor one may be labelled as “unconvincing arguments”. This is the main factor that is explaining most of the scale. The high importance of this factor explains the need of systematic observation of the situations that generated the child’s arguments. This is one of the two main factors of the model, the second being animosity towards parents’ close relatives.
Three other items are related to the second factor and express the extension of the child’s animosity upon the rejected parent’s friends or extended family. The animosity is manifested by gestures and face grimaces of depreciation and scorn, by a defensive bodily attitude, and the avoidance of or no eye contact when talking about them. This factor may be labelled as “animosity expansion”.
Three items saturate the third factor, and they are focused on the denigration of the rejected parent. The children affected in this direction are using insulting names in respect to this parent, they criticize him/her and have a sharp tone when talking about him/her. Thus, factor three may be called “denigration of the rejected parent.”
The absence of the child’s ambivalence towards the rejected parent is manifested by the sharp way of bringing up counterarguments but also by the lack of spontaneous or challenge-based verbalization as well as the lack of the positive experiences shared with this parent. Items describing these issues are loaded into factor four, which may be titled as the “absence of ambivalence”.
The three items related to the factor five are focused on the unconditional support of the preferred parent. The children who were subject to this criterion are verbally approving the alienating parent’s negative attitude towards the other parent, they even justify it and find arguments to support it. Therefore, this factor may be called “unconditional support”.
Factor six, due to the items it usually loads, seems to be closely linked to the fact that the child states that the parent’s rejection is a personal rejection based on his/her own opinions and, at the same time, he/she is building several scenarios to support this. This factor may be called “the independent thinker phenomenon”.
Three other items reflect the lack of guilt towards the rejected parent, which is manifested not only by biased statements regarding the fact that the parent deserves to be punished this way but also by verbalizations, which substantiate the fact that this behavior towards the alienated parent is normal. The seventh factor to which these items are loaded may be labeled as “guilt-free” factor.
The eighth factor is related to the items that describe the defensive posture, the convincing tone, and the direct, sustained contact of the child when using negative terms and words to the alienated parent. This factor may be called as the “borrowed scenarios” factor.
Therefore, we can say that the interpretation of the data is consistent with the characteristics of parental alienation for whose measurement the questionnaire was developed; furthermore, the factors “unconvincing arguments”, “extension of animosity”, “denigration of the rejected parent”, “absence of ambivalence”, “unconditional support”, “independent thinker phenomenon”, “guilt-free” and “borrowed scenarios” have high loads (
Table 5).
The internal consistency of the factors was verified using the Cronbach’s alpha coefficient on a sample of 267 participants 157 boys (58.80%) and 110 girls (41.20%), overall average age: 10.74 years, SD = 3.94). As one may see from
Table 6, all eight factors have internal consistency, the alpha coefficients varying from 0.94 to 0.98, a fact that demonstrates a strong reliability.
The statistics afferent to every sub-scale are outlined in
Table 7.
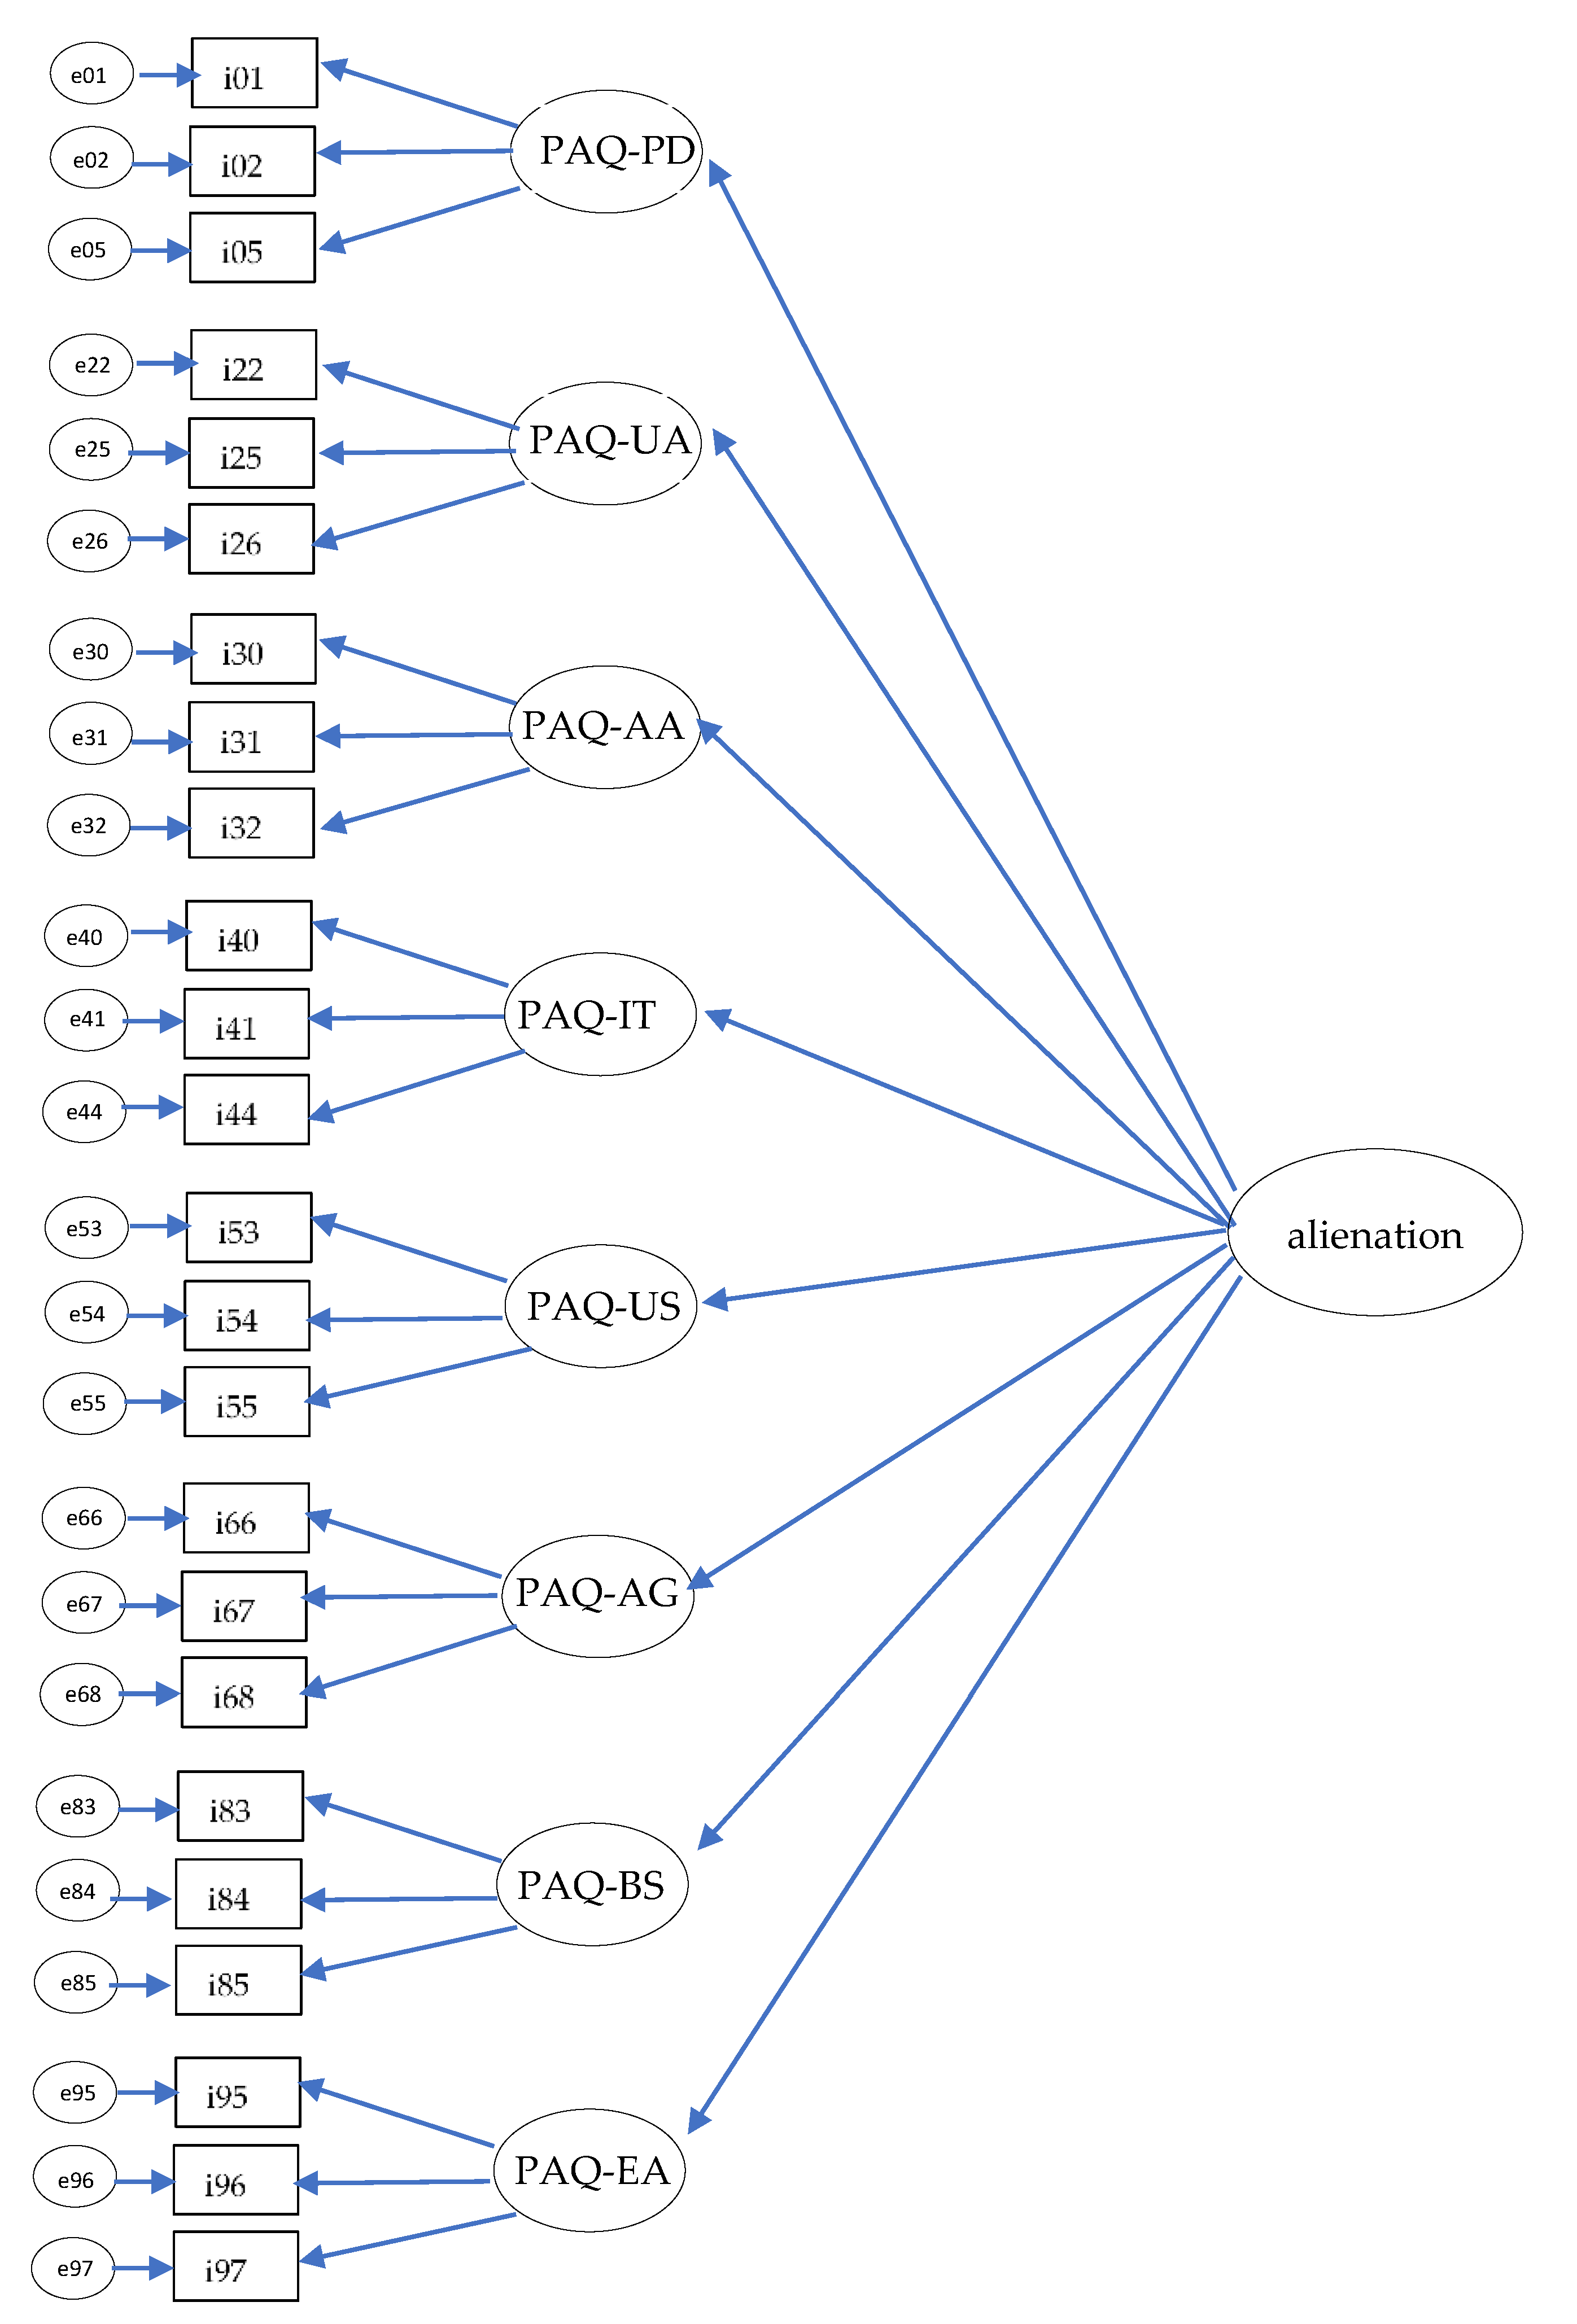
After completing the exploratory factor analysis, confirmatory factor analysis was used to test the hypotheses. Four different models were specified and subsequently tested using a hierarchical factor solution. The first model outlined a single-factor structure that included all 24 items of the scale while the all other three models had an eight-factor structure containing three items. Therefore, the structure of the second specified model included eight uncorrelated factors, the structure of the third model included the eight correlated factors, and the structure of the fourth model contained eight uncorrelated factors and a second-order factor. Consequently,
Figure 1 graphically represents the hierarchical factor solution with eight uncorrelated primary factors and a second-order factor.
The criterion was verified for each of these models [
18] and it has been found that each model is testable.
The actual testing of the models was carried out by using the lavaan version-0.6-5 in the R Core Team, 2014. One may notice that χ
2, which indicates the matching degree, is statistically significant for all the models we have considered. Knowing that this indicator is sensitive to the volume of the sample and taking into account the large number of data that has been analyzed (N = 267), this result was interpreted with caution and other indicators were further analyzed. For both the one-factor model and the eight uncorrelated factor model, the indicators show a weak matching. However, a better match was obtained for the model with eight correlated factors and for the model with eight uncorrelated factors and a second-order factor, but without having the indicators reaching the optimal values. It has also been noticed that these two models are comparable in terms of their index values, the latter model having the advantage that it is much simpler. Therefore, in order to obtain an optimized model, the latter model was considered, and it has been subject to the application of the index modification procedure. Following this approach, the fifth model was obtained with a structure with eight factors, of which two factors (factor 4 and factor 5, factor 5 and factor 6) and four items (i31-i32; i40-i41; i66-i67; i84-i85) were correlated, and a second-order factor. The results we have obtained were summarized in
Table 8.
We noticed that the best match was reached by the solution involving eight factors with two factors and four correlated items and a second-order factor. For this model, all indices have reached the optimal values. This model was compared to the previous models and it was found that ∆χ
2 was statistically significant for each and every of these comparisons, a fact that confirms its superiority over them. Therefore, it seems that the latest model is the most representative solution. Furthermore, the questionnaire shows gender invariance (∆CFI < 0.10), so it may be applied to both girls and boys. More detailed results of Multi-group Confirmatory Factor Analysis (MGCFA) are presented in
Table 9.
To test configural invariance, we conducted a Multi-group Confirmatory Factor Analysis (MGCFA), to check whether responses from both genders supported the obtained model structure. The goodness-of-fit indices (see
Table 8) suggest an acceptable fit to the data (
χ2 (480) = 1229.08,
p < 0.001, CFI = 0.93, RMSEA = 0.08, SRMR = 0.05), with all items loading significantly on their specific factors and all item scores significantly loaded on the factors they were supposed to load on. Therefore, the model has the exact number of factors and configuration of item loadings across gender. MGCFA was then conducted to test metric invariance. The results of the analysis indicate an acceptable fit of the model to the data (
χ2 (503) = 1293.29,
p < 0.001, CFI = 0.92, RMSEA = 0.09, SRMR = 0.07). Δ CFI is smaller than 0.01 suggesting that items have identical saturation/loadings in factors across gender. To assess scalar invariance, an additional constraint to the item intercepts was included, followed by another MGCFA. The fit indices are, again, acceptable (
χ2 (518) = 1303.89,
p < 0.001, CFI = 0.92, RMSEA = 0.08, SRMR = 0.08), with ΔCFI smaller than. Thus, the intercept levels of the items are similar across gender. MGCFA was again conducted to test strict invariance, by additionally constraining the residual error variances of the items. Data showed almost acceptable fit indices (
χ2 (546) = 1398.31,
p < 0.001, CFI = 0.92, RMSEA = 0.09, SRMR = 0.09) with a Δ CFI of 0.01. Residual errors are, therefore, similar across respondents’ gender. Overall, these results suggest that the scale can be used invariant of gender.
2.4. Study 4
The purpose of the fourth study was to analyze the psychometric qualities of the PAQ.
Procedure. This stage was attended by a number of 200 cases of Romanian children, boys (51.50%) and girls (48.50%) aged 8 to 18 years (the boys’ average age being 11.45; the girls’ average age obeying 11.41 years, and the general average age being 11.43 years), who came from divorced/separated families and/or families pending divorce/separation proceedings.
The testing-retesting phase was completed for a number of 40 cases, subjects of Romanian origin, i.e., 23 boys (57.5%) and 17 girls (42.5%), with an average age of 11.17 years for boys, 11.65 years for girls, and with a general average age of 11.37 years. There were two weeks between the test and retest. Ten clinical psychologists (seven women and three men) with an average age of 37.2 and 11.9 years of experience in the field of clinical psychology have completed PAQ twice for the same four children each. Besides the PAQ, two other questionnaires—The Behavior Rating Index for Children (BRIC) [
19] and the Spence Scale of Anxiety for Children [
20,
21]—were also applied. The questionnaires were administered by clinical psychologists specialized in assessing the child and the divorce circumstances, upon the order of a law court, the police, and the prosecutor’s office, and by clinical psychologists/psychotherapists specialized in psychological intervention in children.
Results. Predictive validity was determined using the Pearson correlations between the Parental Alienation Questionnaire and The Behavior Rating Index for Children and the Spence Scale of Anxiety for Children, respectively. Most of these correlations were statistically significant with a medium to large effect size. The values of these correlations ranged from r = 0.31,
p < 0.01, r
2 = 0.09 (the association between social phobia and the independent thinker phenomenon) to r = 0.53,
p < 0.01, r
2 = 0.28 (the association between obsessive compulsive symptoms and the extension of animosity). The only exceptions were represented by the correlations obtained between the Spence Anxiety Separation Anxiety Scale for Children and the unconditional support subscales (r = 0.11,
p > 0.05, r
2 = 0.01) and the borrowed scenarios (r = 0.11,
p > 0.05, r
2 = 0.01) of the Parental Alienation Questionnaire for which the correlations were statistically insignificant. Also, the Anxiety Separation Sub-Scale of the Childhood Anxiety Scale has made a significant correlation with the rest of the Parental Alienation Questionnaire subscales, but the effect size was small. The values of these correlations ranged from r = 0.14,
p < 0.05, r
2 = 0.01 (the association between separation anxiety and the independent thinker phenomenon, respectively from the separation anxiety and the unconvincing arguments) to r = 0.17,
p < 0.05, r
2 = 0.02 (the association between separation anxiety and lack of ambivalence). Consequently, as we have anticipated, the PAQ has significantly predicted the presence of anxiety in children as well as the existence of behavioral issues. The results of these analyzes are highlighted in
Table 10.
Testing-retesting reliability was determined by calculating the Pearson correlation between the scores obtained after the two successive administrations of the PAQ. The result obtained was statistically significant with a large effect size (r = 0.84,
p < 0.01, r
2 = 0.7). The results of test-retest reliability with a two-week interval on 40 subjects are presented in
Table 11. The final version of the questionnaire as well as the scoring method are described in the
Appendix A.
Test-retest reliability at two weeks on 40 cases rated by the same clinicians showed the fact that overall, the results of PAQ are consistent over time. The highest reliability is shown for the whole instrument as a measure of Parental Alienation, the interclass correlation being higher than 0.90, which proves an excellent stability. The scales show good reliability all the coefficients being over 0.70 except for scale Spread of animosity that has a value of 0.60 that is in the area of questionable reliability, but not poor. In this regard, we recommend that the ratters focus for evaluation and interpretation to be on PAQ total score and on the scales with high reliability.


 and
and 
