Abstract
Tourism eco-efficiency is an important indicator that has often been applied to measure the quality of green tourism development. This paper takes the 31 provinces of China as examples to analyze regional tourism eco-efficiency. By constructing multiple input and output indicator systems for regional tourism, we estimated the eco-efficiency of 31 provinces in 1997–2016 using an undesirable output model of a slack-based model (undesirable-SBM) for data envelopment analysis (DEA). Then, we analyzed the spatial–temporal evolutionary trends and patterns of the eco-efficiency over 20 years by using the Hot Spot Model and Spatial Center of Gravity Model. Finally, we explored the driving forces internal and external to the tourism eco-economic system using the Panel Tobit Regression Model and Geodetector Model, respectively. The results show that: In the last 20 years, the tourism eco-efficiency of provinces in China declined, though tourism has experienced rapid but extensive development. The western regions of China, which have better eco-environmental conditions, and the southeastern coastal regions, which have higher levels of economic development, have higher tourism eco-efficiency. Regions with lower tourism eco-efficiency show diffusion trends, while regions with higher tourism eco-efficiency are characterized by a lack of obvious space spillover effects. Technology is the core driving force of regional tourism eco-efficiency, while traffic conditions and social civilization levels are key external influence factors leading to improvement of tourism eco-efficiency. The research results reveal the great significance of laws for sustainable green tourism development with different economic levels in the different regions. Our work could provide a reference for similar countries and regions in the world with the rapid growth of tourism or obvious spatial differentiation in socioeconomic development.
1. Introduction
Tourism exerts profound impacts on global sustainable development. In the Sustainable Development Goals (SDGs) written in the report of “The 2030 Agenda for Sustainable Development” issued by the United Nations in 2015 [1], tourism development is directly relevant to achieving the goals of eliminating poverty, decent work and economic growth, sustainable cities and communities, industry, innovation, and infrastructure, sustainable consumption and production, and gender equality. Indeed, the direct contribution of tourism to the global economy in 2018 encompassed 10.4%, up to 8.8 trillion dollars. Tourism provided more than 319 million jobs around the world in 2018, about 10% of all employed people globally [2]. Data show that in the last 20 years, the tourism economy in China has consistently outpaced gross domestic product (GDP) growth. In 2018, the combined contributions of tourism to Chinese GDP encompassed 9.94 trillion yuan, equivalent to 11.04% of the national total. The relevant population employed in tourism has reached 79.91 million people [3]. However, at the same time, the impact of the rapid development of tourism on the eco-environment cannot be ignored—for example, the much higher carbon emissions from tourism [4,5,6,7], and the higher energy consumption by tourists [8,9,10,11], and even the great ecological risk [12,13,14]. Lenzen published an article in Nature Climate Change in 2018, in which it was found that the growth rate of carbon emissions due to global tourism is higher than that of economic growth [4]. This is due to the neglect of the eco-environmental impact of tourism. Therefore, tourism development needs to follow a green and sustainable development path with a more consideration of its influence on the eco-environment [15,16], incorporating the use of appropriate tools to measure and guide tourism development [17,18]. Research of the past has shown that eco-efficiency analysis can improve the sustainable development capacity of regions [19,20,21,22,23], industries [24,25,26,27,28], and enterprises [29,30,31,32,33], as this approach encompasses economic growth as well as impact on the eco-environment [34].
Tourism eco-efficiency analysis integrates two kinds of variables: eco-environmental impact and economic income [18,35,36]. This approach enables tourism to achieve the goal of minimizing eco-environmental impact while sustaining economic growth [37,38]. Therefore, this approach is an effective tool for addressing the development of low-carbon green tourism [39]. Previous research on tourism eco-efficiency has mainly focused on specific sectors—for example, a few researchers focus on scenic spots, as the tourism destinations that usually receive more attention to their eco-environment and eco-efficiency. Tiziana analyzed the efficiency of cultural heritage on the United Nations Educational Scientific and Cultural Organization (UNESCO) World Heritage List in Italian regions, and found that UNESCO sites exert opposite effects on the performance of these sites of cultural heritage [40]. Peng analyzed the eco-efficiency of Huangshan National Park in China based on a data envelopment analysis model, and found that eco-efficiency has improved continuously since 1980 [35]; moreover, the industrial structure and technical level have significantly positive impacts on eco-efficiency. Li analyzed the carbon footprint and eco-efficiency value of scenic spots in Jiangsu province of China, and found that the eco-efficiency of accommodation was the largest, followed by catering, activities, and transportation [41]. The accommodation sector has also drawn much more attention to its eco-efficiency [42,43,44,45,46]. The study of eco-efficiency mainly emphasizes the eco-efficiency improvements in energy utilization and resource recycling in accommodation enterprises [47,48]. Maria analyzed the relationships between hotel and restaurant electricity consumption and tourism, and found an increasing relationship between them [49]. Pace analyzed the energy-saving measures of hotels in Malta and found that energy efficiency can be improved through different energy technologies and combinations of measures [50]. Tourism transportation, as the largest sector related to tourism, contributes much greater carbon emissions [51,52,53,54]. The environmental issues of tourism transportation have received more attention from researchers, and their eco-efficiency analyses are usually based on carbon emissions [55,56]. The methods for assessing tourism eco-efficiency have mainly included the economy–ecology single-ratio method and the use of methods and models of indicator systems. The single-ratio method mainly applies the ratio of tourism income to carbon emissions, energy consumption, carbon footprint, ecological footprint, and other environmental indicators to calculate tourism eco-efficiency [37,54,57]. As model analysis has gradually matured as a method in eco-efficiency research, model analysis of tourism eco-efficiency has also increased. These applications mainly include the input–output method [58,59], stochastic frontier analysis, and data envelopment analysis (DEA) models [13,60]. The DEA model has recently been widely applied; based on a combination of the non-convex metafrontier model and DEA, Zha measured the changes in the eco-efficiency and eco-productivity of China’s provincial tourism industries in the period 2005–2015 [18]. Irem applied DEA to estimate the role of benchmarking and tourism management information systems of urban tourism development in Europe [61].
The study of tourism eco-efficiency has made some progress both in research methods and contents over recent years. However, in these studies, tourism eco-efficiency research has been largely based on the assessment of a single point in time or on a single dimension (i.e., single production sector) [62], while the study on the spatiotemporal evolution of the combination of multiple dimensions (i.e., multiple production sectors) on a long time series is not enough. Most previous research has emphasized econometric analysis and has ignored various driving forces under spatial differentiation laws. Because tourism services and products have spatial flow characteristics, it is of great significance to analyze driving factors under spatial distribution laws.
This research applied an undesirable output model of a slack-based model (undesirable-SBM) of DEA to estimate the tourism eco-efficiency included star-rated hotels, travel agencies, and scenic spots as the core tourism sectors. It applied the Hot Spot and Spatial Center of Gravity Model to analyze the spatial pattern and temporal trends of the tourism eco-efficiency of the 31 provinces in China. Then, we utilized the Panel Tobit Regression Model and Geodetector to explore the driving forces and influencing factors of spatial–temporal differentiation of tourism eco-efficiency. The research results would be provided a reference for similar regions or countries in the world with the rapid growth of tourism or obvious spatial differentiation of regional economic and social development.
This paper is organized as follows: Section 2 describes Materials and Methods, including the methods of assessment on eco-efficiency, the model of spatiotemporal, and driving forces analysis. Indicators and data are contained in Section 3. Results are presented in Section 4. Finally, Section 5 presents the conclusions. (Figure 1)
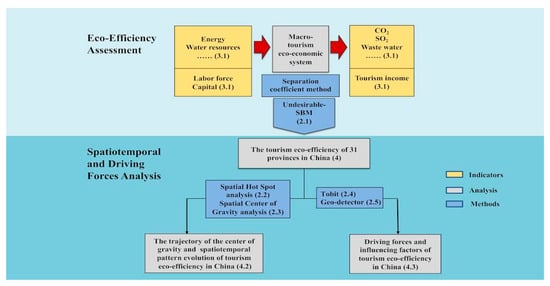
Figure 1.
The technical route applied for macro-regional tourism eco-efficiency research.
2. Materials and Methods
Energy and water resources were selected as input indicators for the eco-environment, while SO2, wastewater, domestic waste, and carbon emissions were selected as undesirable output indicators. Eco-environment indicators were then treated using the tourism separation coefficient method. Thus, constructing an undesirable-SBM model, we were able to evaluate the tourism eco-efficiency of 31 provinces in China. We used Spatial Hot Spot and Spatial Gravity Center analyses to assess the moving track, spatiotemporal evolutionary patterns, and spatial agglomeration characteristics of tourism eco-efficiency. The Panel Tobit Regression Model was then used to identify the spatial differentiation of regional tourism eco-efficiency’s internal driving forces. This enabled us to reveal the main driving factors for improving the internal operating efficiency of the tourism eco-economics system. Thus, the external influencing factors of regional tourism eco-economics were identified as Geodetector.
The research boundaries of regional tourism applied in this paper include three sectors, star hotels, travel agencies, and scenic spots. These sectors are the direct production departments of tourism as the core of this system. They also correspond with the main consumption of tourists at destinations. The definition of tourism is smaller than those defined by the National Tourism Administration and the National Bureau of Statistics. Considering data continuity between these sectors and the relative independence of production in each case, those tourism products and services are calculated repeatedly using larger boundaries. This approach enabled us more accurately reflect the objective situation in operation within the tourism eco-economic system. Therefore, this research mainly takes star hotels, travel agencies, and scenic spots as boundaries and industry research objects for tourism eco-efficiency.
2.1. Data Envelope Analysis
We measured the regional tourism eco-efficiency due to construction by applying an Undesirable-SBM. In this model, each spatial unit includes three factors, specifically inputs, desirable outputs, and undesirable outputs, expressed as , , . We, therefore, defined a matrix X, and as follows, , , X > 0, > 0, > 0. Thus, the production possibility set P can be expressed as follows: . This means that the undesirable-SBM can be expressed as follows [63,64,65]:
In this expression, s denotes the slack variable of input and output, while denotes the weight vector. The objective function strictly decreases with respect to s-, sg, and sb, so . In terms of specific units of space, when and s- = sg =sb = 0, the eco-efficiency of a specific DMU will be effective. In contrast, when < 1 or s- ≠ 0, sg ≠ 0 or sb ≠ 0, the eco-efficiency of a specific DMU will be inefficient and it will be necessary to improve input–output variables. This approach enabled us to assess the tourism eco-efficiency level in each region of China.
2.2. Hot Spot Analysis
The Getis–Ord (Gi*) index, proposed by Getis and Ord, can be assessed in the areas of sub-regions whose attribute values are significantly different from those of others. This index is expressed as follows:
In this expression, denotes the attribute value of element j, φi,j is the spatial weight between element i and j, and n is the total number of elements. The Gi* index displays the spatial location of high (hot spot) or low value (cold spot) clusters. These hot and cold spots of tourism eco-efficiency around China respectively represent regions with high and low levels of eco-efficiency.
2.3. Spatial Center of Gravity Analysis
We used the Spatial Center of Gravity analysis to research the trajectory of tourism eco-efficiency center of mass and the spatial evolutionary law underlying this phenomenon. This was expressed as follows:
In this expression, pi(xi,yi) denotes the barycenter coordinate of the eco-efficiency of region i, while eei represents the tourism eco-efficiency level in region i.
2.4. Panel Tobit Regression Analysis
The Panel Tobit Regression Model was proposed by Tobin [66,67] and mainly addressed the construction problem of limited or truncated dependent variables [68]. Thus, the eco-efficiency measured by the undesirable-SBM in this study is a cutoff value between 0 and 1, so a Panel Tobit Regression Model can be used to identify the driving factors that affect spatial differentiation of regional tourism eco-efficiency [17,69,70]. This model was expressed as follows:
In this expression, i denotes the 31 provinces of China, while t represents different years, xit is an independent variable, while β is a regression parameter, and represents the disturbance term.
2.5. Geodetector Model
The Geodetector Model was used to analyze the external influencing factors of regional tourism eco-efficiency. This detects the possible causal relationships between two variables by verifying the consistency of their spatial distributions. This approach has been widely used for analyzing the evolution of geographic element patterns and regional spatial differentiation [71]. Thus, applying the Geodetector principle, this paper introduces the index q of spatial differentiation determining force on tourism eco-efficiency. We assume that tourism eco-efficiency in the study region i is y; thus, if we assume that A denotes a set of factors that may influence the spatial differentiation of tourism eco-efficiency, then h = 1, 2, …, L. Similarly, L denotes the classification number of factors and Ah represents different types of factor A. It follows that a type h corresponds to one or more spatial regions. To detect the spatial correlation between factor A and tourism eco-efficiency y, a tourism eco-efficiency y layer was overlapped onto factor A layer. In the h type of factor A, the discrete variance of y was recorded as σh2. This means that the determining force of factor A on tourism eco-efficiency y can be expressed as follows [72]:
In this expression, nh denotes the number of samples in type h of factor A (corresponding to one or more sub-regions), while n is the number of all sample areas of study. The value interval of q is (0,1) and thus the larger the value, the stronger the explanatory ability of this factor to changes in regional tourism eco-efficiency.
3. Indicators and Data
3.1. Eco-Efficiency Indicators
The evaluation indicator system for tourism eco-efficiency used here includes input indicators, desirable output indicators, and undesirable output indicators. There are currently no unified measurement indicators for the selection of input and output factors. Thus, based on actual input and output processes of tourism development, we selected specific measurement indicators. (Table 1)

Table 1.
Input–output indicators values of regional tourism eco-efficiency.
Input indicators. These variables mainly include labor and capital in traditional economic systems, as well as energy and water resources in ecosystems. Specifically, the labor force is the sum of the number of employees in star hotels, travel agencies, and scenic spots, while the capital indicator is the sum of the original value of these entities’ fixed assets. Energy input is calculated using the standard coal consumption per unit GDP of each industry in each region’s energy balance sheet, and then the energy consumption levels of star hotels, travel agencies, and scenic spots are summed. The input of water resources is calculated by multiplying the per capita domestic water consumption in each region by the number of tourists received by star hotels, travel agencies, and scenic spots. Four indicators were finally selected, the number of tourism employees, the original value of fixed assets of tourism, the energy consumption of tourism, and the water consumption of tourism.
Desirable output indicators. Output values of the traditional economic system were selected as the measurement indicators in this case. This mainly includes the sum of the income of star hotels, travel agencies, and scenic spots.
Undesirable output indicators. These variables include wastewater disposal, garbage discharge, SO2, and carbon emissions. The calculation method used for these indicators is the same as that used for water resource inputs. Carbon emissions were calculated using energy data following IPCC international standards.
Fixed asset investments and the income of the tourism were disposed of by constant fixed asset prices index and consumer price index based on 1997 values, respectively.
3.2. The Panel Tobit Regression Model Indicators
Tourism is a typical eco-economic system; the internal driving forces can include the industry scale, the eco-environment protection technology, the capital for running the system, and the internal tourism structure. This paper selects several indicators of encompassing scale, structure, capital, and technology effects to verify the underlying tourism eco-efficiency driving forces.
Scale-driven effect. This effect is mainly expressed in the form of total tourism income (TI) and the total number of tourists (TP). Tourism income and the total number of tourists represented the whole, including the star hotels, travel agencies, and scenic spots and included transportation, shopping, entertainment, and other relevant economic sectors. Moreover, compared with research boundaries of tourism eco-efficiency, total tourism income, and the total number of tourists within a larger boundary can more reasonably reflect the total operation of regional tourism eco-economic systems. This approach can also comprehensively reflect the impact of the overall scale on the input–output relationship seen within the tourism eco-economic system. Thus, if the boundary is still small, duplication phenomena that may occur in system operation will be ignored, leading to scale effects. Therefore, we analyze scale-driven effects of tourism eco-efficiency using larger boundary tourism income and the number of tourists.
Structure-driven effect. This effect is mainly measured using the income share of star hotels (HS). This effect mainly considers the proportional relationship of core economic entities within the tourism eco-economic system. In terms of the general law of tourism development, the proportion of the core economic entities in different stages of development can be changed. This means that in different development stages, the structure of different sectors might impact the tourism eco-economic system. Therefore, we used the proportion of star hotels income to total revenue to express the structure effects of tourism eco-efficiency.
Capital-driven effect. This effect is mainly measured based on the amount of capital investment per unit of tourism revenue (RI). Thus, as the economic system, the impact of capital input on tourism is apparent. However, the direction of the capital impact on the tourism eco-economic system is not sure. Whether higher capital input cloud improves, the tourism eco-efficiency needs to be further verified. We mainly use the original value of fixed capital per unit income in this analysis to measure the capital-driven effects of capital investments.
Technology-driven effect. This effect is mainly measured values of energy input (EI) and domestic water consumption (WI) per unit of tourism income. This technology-driven effect should also incorporate the technical level of eco-environmental protection in eco-economic tourism operations. The energy input can comprehensively reflect the technical efficiency level of unit capital, indirectly reflecting carbon emissions efficiency level. Water consumption per unit capital can reflect the unconventional economic behavior and technical efficiency of tourism in terms of ecological resource use.
3.3. The Geodetector Model Indicators
The influencing factors of tourism eco-efficiency are attributed to the influence and disturbance from the outside of the tourism eco-economic system. We can analyze the socioeconomic environment that is closely related to the tourism eco-economic system, including levels of economic development, the degree of industrial structure optimization, urbanization, natural resources, low-carbon production, environmental protection, degree of opening up, scientific and technological development, and the degree of social civilization and traffic conditions.
The level of economic development is mainly expressed in terms of per capita GDP (yuan), the degree of industrial structure optimization is mainly expressed by the proportion of tertiary industry (%), the level of urbanization is expressed by the proportion of the urban population (%), the level of natural resources is expressed based on per capita water resources (tons), the level of low-carbon production is expressed via energy consumption per unit GDP, and the level of environmental protection is expressed based on SO2 emissions per unit GDP. Similarly, the degree of social civilization is expressed via the number of students in ordinary colleges and universities (unit: 10,000), traffic conditions are expressed via highway mileage (unit: 10,000 km), degree of opening up is expressed via the total amount of foreign-invested enterprise at year-end (unit: million US dollars), and the level of scientific and technological development is expressed via the total amount of postal and telecommunications business per capital (yuan). The per capita GDP, energy consumption per unit GDP, SO2 emissions per unit GDP, and total post and telecommunications business per capital were disposed of by constant consumer price index based on 1997 values. The regional tourism eco-efficiency was analyzed using a level lattice, and the factors were divided into ten classes using the natural breakpoint method. Take 2016 as an example—shown in Figure 2.
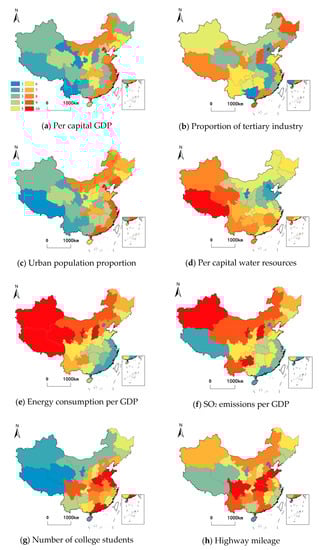
Figure 2.
The spatial distribution of geographic exploration factors for tourism eco-efficiency in 2016.
3.4. Data Sources
The income of tourism sectors, number of employees, original values of fixed assets, per capital stays for international tourists, rental rates for star hotels, number of tourist attractions, number of international tourists with travel agencies, and the number of domestic tourists with travel agencies were all based on values taken from the China Tourism Statistical Yearbook from 1998 to 2017. Similarly, data for per capita water consumption, the total energy and added value of other industries, and the added value of wholesale and retail accommodation catering industries and total energy of wholesale and retail accommodation catering industries, per capita wastewater discharge, per capita garbage discharge, and per capita SO2 emissions were all extracted from China Statistical Yearbook and China Environmental Statistics Yearbook from 1998 to 2017.
4. Results
4.1. The Overall Evolution of Regional Tourism Eco-Efficiency of China
We calculated the tourism eco-efficiency of 31 provinces in China in the period 1997–2016 using undesirable-SBM. Results show in the last 20 years, the tourism eco-efficiency in China has decreased. (Figure 3) The spatial variation coefficient was about 0.4, remaining relatively stable, while the spatial difference in 2010 revealed a significantly higher trend. This means that the 2008 Olympic Games also impacted the spatial differentiation of regional tourism eco-efficiency. Indeed, in the last 20 years, as a new growth pole to stimulate the economy and expand domestic demand, tourism has attained a rapid development with a growth rate of about 20%. However, tourism eco-efficiency has tended to follow a general downward trend. This shows that the input–output efficiency of the tourism eco-economic system is decreasing, and environment and ecology elements are not reasonably allocated. The rapid economic growth led to a worse impact on the eco-environment. Moreover, the influence on the eco-environment has intensified annually, leading to a declining trend in eco-efficiency.
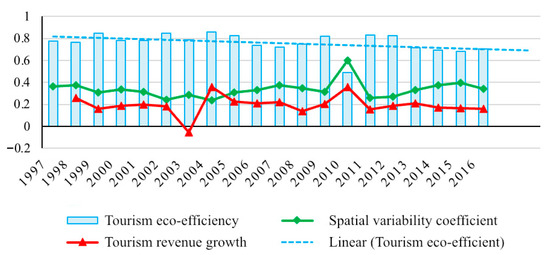
Figure 3.
Evolution and spatial variation in tourism eco-efficiency from 1997 to 2016.
4.2. Spatial Patterns on Regional Tourism Eco-Efficiency
4.2.1. Characteristics
The tourism eco-efficiency of each province in China was divided into five levels from low to high. Thus, 0.00 < tourism eco-efficiency (TE) < 0.40 denotes an inefficiency area, 0.41 < TE< 0.60 denotes a low efficiency area, 0.61 < TE< 0.80 denotes an area to be improved, 0.81 < TE< 0.99 denotes a relatively high efficiency area, and TE = 1 denotes a high efficiency area.
High eco-efficiency regions for tourism are generally distributed in regions with good eco-environmental backgrounds or high levels of economic development. (Figure 4) From 1997 to 2016, provinces with higher tourism eco-efficiency values appeared in the western regions where the eco-environment background is better, and in the southeastern coastal area where the economic developmental level is higher. Qinghai, Tibet, Ningxia, and Chongqing were the highest efficiency areas in the last 20 years, while Beijing, Shanghai, Guangdong, and some southeastern coastal areas also have certain advantages with relatively high efficiency, and Sichuan and Yunnan were advantageous regions for tourism development, as their eco-efficiency were relatively high. The remaining areas occur in low eco-efficiency regions. Overall, the spatial tourism eco-efficiency conforms to a high-efficiency belt in some western and southeastern coastal regions, a medium efficiency belt in central and western regions, and a low-efficiency zone in northern China.
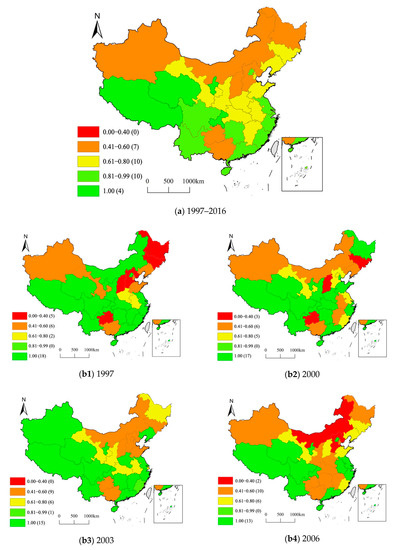
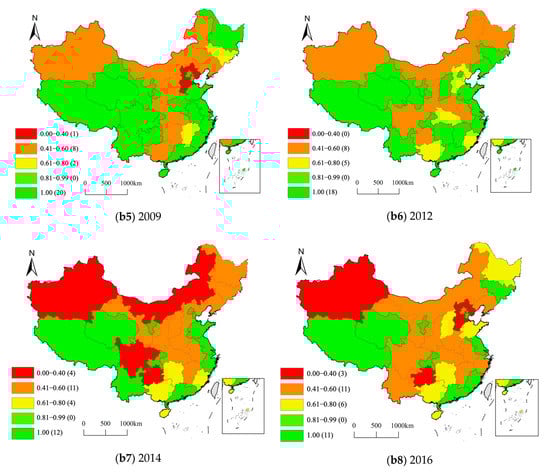
Figure 4.
Spatial patterns of tourism eco-efficiency of 31 provinces in China.
The spatial distribution characteristics of tourism eco-efficiency of 31 provinces in China were analyzed for 1997, 2000, 2003, 2006, 2009, 2012, 2014, and 2016. In the last 20 years, results show that areas with high and relative efficiency values for tourism have gradually decreased, while areas of low efficiency and completely inefficient have increased and gradually spread from the north into central and western regions. Four types of evolutionary tracks characterize different provinces, an efficiency improvement type (e.g., Jilin Province), an efficiency decline type (e.g., Sichuan Province), an inverted U-type that rises first and then falls (e.g., Gansu Province), and a positive U-type that falls first and then rises (e.g., Fujian Province).
4.2.2. Spatial Hot Spot Analysis
We have introduced the Gi* index to analyze spatial patterns in tourism eco-efficiency. Thus, based on the analysis of the average tourism eco-efficiency level from 1997 to 2016, the Gi* index results are divided into seven categories according to the significant level of spatial positive and negative correlation. These include three kinds of cold spot regions with negative correlation significance of 0.01, 0.05, and 0.1, the region with insignificant correlation, and the hot spot regions with positive correlation significance of 0.01, 0.05, and 0.1, respectively.
Based on average levels calculated from 1997 to 2016, the only hot spot region in Qinghai Province where significance passes 0.05, while cold spot regions include Jilin and Liaoning provinces and Inner Mongolia. (Figure 5) These regions that the cold spots with significance levels pass the 0.05 test or 0.1 test. The other provinces are not significant. Thus, from a temporal evolutionary perspective, the cold spot provinces tend to be mainly concentrated in Northeast China and Inner Mongolia. It shows that hot spots have shifted from Southwest China to Northwest Qinghai Province, and both cold and hot spots’ spatial significance has decreased annually. Further, there are no significant hot or cold spots that remained in China by 2012. This result means that the overall average value of tourism eco-efficiency is declining and there are no obvious areas of either advantage or disadvantage. This result also shows that tourism low eco-efficiency has spread nationwide and that there is a certain trend towards balanced development related to the fact that this eco-economic system is essentially open and mobile. Various factors frequently flow within this eco-economic system in different scales of the space; as tourism has developed in recent years, investment in transportation infrastructure has also increased, especially in railway transportation construction. Flows of people, logistics, and capital circulate all over the country. Tourism has greatly developed in all parts of China and is no longer concentrated in a few provinces with the advantages of tourism resources. Provinces with obvious eco-efficiency advantages also tend to be mediocre in terms of their operation of tourism eco-economic systems.
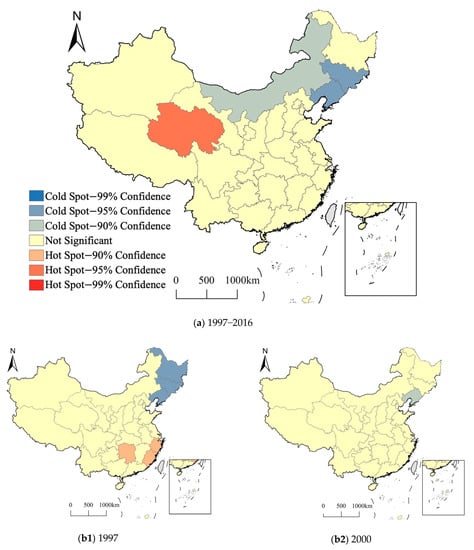
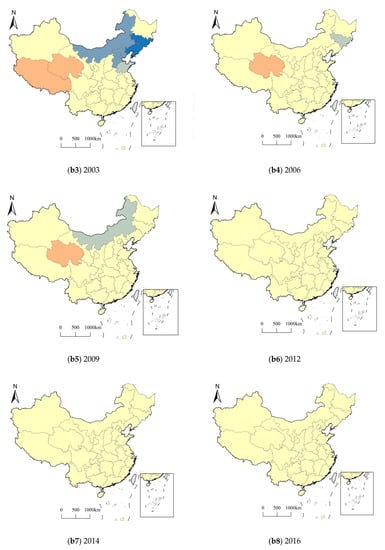
Figure 5.
Tourism eco-efficiency spatial hot spot distribution from 1997 to 2016.
4.2.3. Spatial Center of Gravity Analysis
From Formula (3), the spatial gravity center trajectory for China’s tourism eco-efficiency from 1997 to 2016 can be calculated. This trajectory reflected the spatial distribution of input–output rationalization within the tourism eco-economic system and enabled us to analyze China’s spatial evolution. It has a certain guiding significance for the rational allocation of factors of the tourism eco-economic system.
From 1997 to 2016, the changing range of tourism eco-efficiency center of provinces encompasses Henan, Shaanxi, and Hubei provinces in China. (Figure 6) The trajectory is characterized by a shock transfer from southwest to northeast; the overall movement range is about 250 km in this case, with north to south amplitude larger than east to west. It shows that, in terms of tourism eco-efficiency, the difference between the north and south in China is greater than the difference between east and west. This has also led to an obvious north to south shift on the gravity center of tourism eco-efficiency. Indeed, from the perspective of trajectory transfer, the tourism eco-efficiency in the northeast in China has improved in the last 20 years and has exerted a strong effect on the center. While in the west, Tibet, Qinghai, Ningxia, and other high-efficiency areas have exerted less effect on the center. It shows that high efficiencies in the west have tended to exert no impacts on surrounding areas. Thus, high eco-efficiency areas for tourism, relying on the eco-environment background, is difficult to drive the development of surrounding areas. One effective path to steadily improve the regional tourism eco-efficiency is to develop the tourism economy and reduce the impact on the eco-environment.
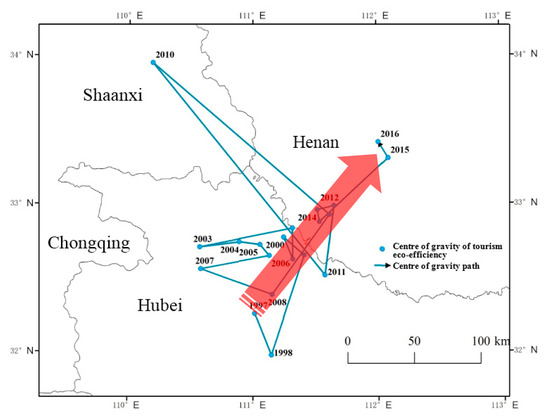
Figure 6.
Characteristics of eco-efficiency center of gravity transfer within the tourism from 1997 to 2016.
4.3. Analysis of the Driving Forces of the Regional Tourism Eco-Efficiency
The driving mechanism of tourism eco-efficiency is dependent on heterogeneous spatial factors of regional eco-efficiency, including internal driving forces and external influencing factors. Internal driving forces exert direct influence on regional tourism eco-efficiency; they can reflect the input–output relationship of the tourism eco-efficiency. We used a Panel Tobit Regression Model to recognize the forces driving tourism eco-efficiency. We have shown that external influencing factors indirectly affect the tourism eco-efficiency, embodied in the social and economic influences and changes outside of regional tourism operations, and these exert fuzzy and indistinguishable influences on tourism eco-efficiency. The Geodetector Model was used to identify the factors causing differences in regional tourism eco-efficiency.
4.3.1. Analysis of Internal Driving Forces: A Panel Tobit Regression Model
Internal driving forces controlling regional eco-efficiency include scale, structure, capital, technology, population, and environmental policy effects [35,73]. Thus, using a Panel Tobit Regression Model, we have been able to verify the impact of the eight indicators for four factors (i.e., scale economics, industrial structure, capital, and technological effects) on the spatial differentiation of the dependent variable—tourism eco-efficiency (TE). Based on Environmental Kuznets Theory [74], as social income increases, the eco-environment will deteriorate, which will not improve until the economy reaches a higher level. Thus, in order to determine the relationship between tourism economic development and eco-efficiency, the quadratic term of total tourism revenue was incorporated into our Tobit Model [75]. Tourism revenue was used based on 1997 values, and a fixed price strategy was applied according to the consumer price index (CPI) for all provinces. In order to avoid non-stationarity caused by different data dimensions in parameter estimation and preserve panel data characteristics, we take the natural logarithm of the relevant variables. Statistical information about variables is presented in Table 2.
Table 2.
Statistical characteristics of driving variables.
The Panel Tobit Model used in this research is as follows:
Model 1:
Model 2:
Regression results are presented in Table 3.
Table 3.
Tobit Regression results for internal driving forces controlling regional tourism eco-efficiency.
First, total tourism revenue and related quadratic terms did not pass a significance test. This indicates that total tourism revenue and associated quadratic terms exert an insignificant scale-driven effect on tourism eco-efficiency. Meanwhile, coefficients reveal that the curve of the relationship between total tourism revenue and tourism eco-efficiency conforms to an inverted U-shape, inconsistent with environmental Kuznets’s theory. Previous research on regional eco-efficiencies has shown that the relationship between eco-efficiency level and economic scale in regional economic and social development tends to conform to a typical U-shaped curve. This conforms within Environmental Kuznets Theory. The results presented here regarding tourism eco-efficiency are different from general analyses of regional eco-efficiency. This difference also explains why tourism is different from the general law of economy and society operation. The inverted U-shaped curve generated here shows that the eco-efficiency level of tourism increases in concert with tourism income while decreases to a certain extent as this variable goes up. This is consistent with the results of Lenzen (2018) [4], which shows that as affluence increases, so do the tourism carbon emissions and tourism carbon emissions grow faster than the tourism growth in the section overall. This further explains why some economically under-developed regions like Tibet, Qinghai, and Ningxia also have high eco-efficiency levels and further explain the declining eco-efficiency in light of the rapid development of tourism for 20 years. This relationship also indicates that the impact of tourism on the eco-environment will gradually increase. Therefore, it is very urgent to explore green tourism development. This insignificant relationship in terms of measurement also states that the developing law of regional tourism in China is different and that many uncertain factors in the relationship between tourism and the eco-environment. According to the different development stages, laws governing tourism development are complex; a tourism green developmental model should be further explored.
Second, the total number of tourists is another indicator reflecting scale-driven effects. Based on regression results from our two models, the relationship between the total number of tourists and the tourism eco-efficiency conforms to a significantly negative correlation. According to model 1, as the total number of tourists increases by 1%, the level of eco-efficiency for this sector falls by 0.066%. This further verifies that scale development of tourism harms eco-efficiency.
Third, the income proportion of star hotels representing the structure driving effect has an insignificant influence on tourism eco-efficiency.
Fourth, immobilizations of per unit tourism income represent a capital-driven effect and exert a significant and negative impact on eco-efficiency. Data shows that each 1% increase in capital investment causes a decrease of 0.114% in eco-efficiency, greater than the impact of the total number of tourists. This shows that capital investment in tourism does not play a positive role in the operation of the eco-economic system. In other words, tourism investment plays no guiding role in sustainable development, and this investment structure is badly in need of optimization. Changing the negative effect of tourism investment on the tourism eco-efficiency and improving the level of tourism green financial services are the key points of sustainable development of tourism.
Fifth, data shows that energy input and water consumption per unit of tourism income represent technology-driven effects and are all negative indicators. Thus, the higher the values for energy and water consumption, the higher the technical indicator will be, while the lower the indicators are, the higher the technical level. The regression model presented here shows that the relationship between the two indicators and tourism eco-efficiency is negative; thus, the higher the eco-environment protection level, the higher the tourism eco-efficiency. Results show that with technology improved, the research and development (R&D) and the introduction of energy-saving and emission reduction technologies in tourism products and services should be strengthened. The positive impacts of technology R&D on tourism eco-efficiency should also be expanded.
Based on the Panel Tobit Regression analysis, the forces driving tourism eco-efficiency can be divided into positive driven technology effect, negative driven scale effect, and capital effect. This also highlights the fact that improvements in technology mainly realize internal driving factors. Technology enhancements can reduce the negative impacts of capital and scale effects.
4.3.2. Analysis of External Influencing Factors: A Geodetector Model
External factor coefficients of regional tourism were calculated using the Geodetector Model (Table 4).
Table 4.
Geodetector q statistics of external factors affecting the eco-efficiency of the tourism industry.
Geodetector analysis results allow several key conclusions.
First, from the perspective of average contribution level over the past 20 years, the Geodetector q statistics of tourism eco-efficiency of the highway mileage, the number of college students, and the proportion of tertiary industries are relatively high, respectively showing 0.6487, 0.5600, and 0.5028. It shows that the traffic conditions, degree of social civilization, and industrial structure represented by the above three variables are the three main external factors that influence tourism eco-efficiency.
Second, regarding the impact of various factors, the economic development level indicator’s impact reached the maximum in 2004, however, with the overall trend of decline. The indicator curve for the influence of industrial structure is U-shaped, and the optimization of the industrial structure has a positive effect on tourism eco-efficiency. The positive effect of urbanization on the tourism eco-efficiency has also increased over time, while the effect of natural resources remains insignificant but has increased. The impact of low carbon production level on the tourism eco-efficiency reached a peak of 0.7648 in 2010, fluctuating overall, while the impact of environmental protection level also fluctuates, reaching a peak of 0.6936 in 2008. Social civilization degree and traffic conditions have been playing obvious growing positive effects on tourism eco-efficiency. The influence of the degree of opening up to the outside world was not significant, however, and has also fluctuated over time, reaching a peak of 0.7792 in 2005. The impact of science and technology development level on tourism eco-efficiency has not been significant and has also fluctuated, reaching a peak of 0.8604 in 2016.
Third, traffic conditions and the degree of social civilization have been key factors leading to improvements in tourism eco-efficiency. Indeed, in recent years, industrial structure has significantly impacted tourism eco-efficiency while economic development has not played a significant role but remains important. Scientific and technological developments also have great potentials to enhance tourism eco-efficiency, as does urbanization level. Additional external factors have been less significant regarding the ecological efficiencies of tourism. Future research should focus on promoting interactions between tourism and key influencing factors, improving the comprehensive utilization of these variables on tourism, and further promoting this eco-economic system’s sustainable operation and development.
5. Conclusions
This paper has analyzed the tourism eco-efficiency of the 31 provinces in China from a macro-regional perspective of the 20 years from 1997 to 2016. We have systematically analyzed the spatial distribution, hot spots, and center of gravity of Chinese regional tourism eco-efficiency. We have also analyzed the internal driving forces and external influencing factors on tourism eco-efficiency. This research leads to several key outcomes.
Over the period from 1997 to 2016, the overall tourism eco-efficiency of 31 provinces in China has trended downward. The rapid development of tourism has not made up for impacts on the eco-environment. Results show that tourism remains in a stage of extensive and rapid development. Tourism eco-efficiency shows an inverted U-shaped development trend that has increased and then decreased in concert with increases in tourism income. The results are similar to Maria’s conclusion that there is always a positive correlation between accommodation and catering electricity consumption in 11 European countries, tourism is different from other industries in the eco-environment law, and the Tourism Kuznets Curve hypothesis is not supported [49]. Compared with the other industries, tourism belonged to the low energy consumption and green low-carbon industry [76].
Provinces with higher tourism eco-efficiency tend to occur in China’s southwestern regions where the eco-environment is enhanced and in the southeast coastal regions where the economic development level is higher. The center of gravity fluctuates from southwest to northeast, and the improvements in tourism eco-efficiency in the northeastern and north coastal areas of China greatly impact the pattern of national tourism sustainable development. Provinces that once had obvious advantages have gradually tended to more medium levels in terms of their operation of tourism eco-economic systems. It is difficult to form industrial agglomeration in the tourism industry, so it is hard to improve eco-efficiency through industry agglomeration in space, and the spatial effect is difficult to engage with. Therefore, high-efficiency areas tend to have no spatial spillover effects, especially in the high-efficiency areas of the Yangtze River Basin; the tourism eco-efficiency generally declined in recent years, which is consistent with the existing research results on the eco-efficiency of tourism in the Yangtze River Basin [17]. However, low-efficiency areas such as Hebei and Inner Mongolia have some spillover effects into surrounding areas.
In the case of regions that have experienced rapid and extensive development in tourism, it will be necessary to develop a sustainable development model with technology at its core. These models will also require the constant optimization of capital and scale as well as continuous improvements in social civilization and traffic conditions. Capital effects can change the function and direction of regional tourism eco-efficiencies via capital support, resource allocation, and enterprise. Technological effects can drive the regional tourism eco-efficiency by reducing energy consumption, while traffic conditions and social civilization degrees influence the regional tourism eco-efficiency. Thus, it will be necessary to systematically build a green financial system for tourism, change the current investment structure, optimize investment direction, and promote capital so that it plays a positive role in tourism eco-efficiency. Realizing the reduction of energy consumption in tourism through technological innovation and technological progress is the core way to improve the regional tourism eco-efficiency, applied modern information technology to improve the level of destination ecological management [61]. A range of countermeasures should be implemented for people at different consumption levels. Thus, in the case of mass tourism consumption-oriented scenic spots, the design of low-carbon products, as well as services and the rational layout of tour routes, are two main approaches to improve eco-efficiency [16]. Improvements in the social civilization level can also enhance coordination in the human–land relationship, realizing humanity and nature’s harmonious development. We should enhance the tourist flow efficiency through the improvement of traffic conditions by reducing energy consumption levels, and increasing capital accessibility. It will also be crucial to enhance the regional tourism eco-efficiency via technology and capital effects.
China is the world’s largest tourism source and the world’s top-largest destination. The rapid development of China’s tourism industry with the huge scale of interregional tourism activities reflects the characteristics and driving factors of eco-efficiency comprehensively and typically. At present, global tourism is still in the stage of rapid development. The comparable developed countries and regions, especially those with the rapid growth of tourism, are facing the same problem of eco-efficiency optimization and control. The technical route and control measures of this study can provide a useful reference for comparable countries and regions around the world. This work would be useful to help the tourism managers and practitioners of these countries and regions to evaluate the eco-efficiency of the tourism industry more clearly. We hope this work has some real value for developing tourism become a real, sustainable industry and contribute more to the SDGs.
Author Contributions
B.X., S.D., and D.B. conceived and designed the experiments; R.W., Y.L., Z.L. and W.Z. collected and processed the data; B.X. and R.W. analyzed the data; B.X. and R.W. wrote the paper. All authors have read and agreed to the published version of the manuscript.
Funding
This work was funded by the Chinese Academy of Sciences (XDA20030203), Science & Technology Basic Resources Investigation Program of China (2017FY101304), and Key Deployment Project of Chinese Academy of Sciences (ZDRWZS201812).
Institutional Review Board Statement
Not applicable.
Informed Consent Statement
Not applicable.
Acknowledgments
The authors would like to thank the editor and reviewers for their insightful comments and suggestions.
Conflicts of Interest
The authors declare no conflict of interest.
References
- Nations, U. Transforming Our World: The 2030 Agenda for Sustainable Development; United Nations: New York, NY, USA, 2015. [Google Scholar]
- Organiztion, W.T. UNWTO Annual Report 2019; UNWTO: Madrid, Spain, 2019. [Google Scholar]
- Ministry of Culture and Tourism of the People’s Republic of China. Statistical Bulletin of Culture and Tourism Development in 2018; Ministry of Culture and Tourism: Beijing, China, 2019.
- Lenzen, M.; Sun, Y.-Y.; Faturay, F.; Ting, Y.-P.; Geschke, A.; Malik, A. The carbon footprint of global tourism. Nat. Clim. Chang. 2018, 8, 522–528. [Google Scholar] [CrossRef]
- Tang, Z.; Shang, J.; Shi, C.; Liu, Z.; Bi, K. Decoupling indicators of CO2 emissions from the tourism industry in China: 1990–2012. Ecol. Indic. 2014, 46, 390–397. [Google Scholar] [CrossRef]
- Zhang, J.; Zhang, Y. Carbon tax, tourism CO2 emissions and economic welfare. Ann. Tour. Res. 2018, 69, 18–30. [Google Scholar] [CrossRef]
- Luo, F.; Moyle, B.D.; Moyle, C.-L.J.; Zhong, Y.; Shi, S. Drivers of carbon emissions in China’s tourism industry. J. Sustain. Tour. 2020, 28, 747–770. [Google Scholar] [CrossRef]
- Yang, L.; Yang, Y. Evaluation of eco-efficiency in China from 1978 to 2016: Based on a modified ecological footprint model. Sci. Total. Environ. 2019, 662, 581–590. [Google Scholar] [CrossRef]
- Katircioglu, S.T.; Feridun, M.; Kilinc, C. Estimating tourism-induced energy consumption and CO2 emissions: The case of Cyprus. Renew. Sustain. Energy Rev. 2014, 29, 634–640. [Google Scholar] [CrossRef]
- Zhang, L.; Gao, J. Exploring the effects of international tourism on China’s economic growth, energy consumption and environmental pollution: Evidence from a regional panel analysis. Renew. Sustain. Energy Rev. 2016, 53, 225–234. [Google Scholar] [CrossRef]
- Zheng, J.; Hu, Y.; Dong, S.; Li, Y. The Spatiotemporal Pattern of Decoupling Transport CO2 Emissions from Economic Growth across 30 Provinces in China. Sustainability 2019, 11, 2564. [Google Scholar] [CrossRef]
- Ahmad, F.; Draz, M.U.; Su, L.; Ozturk, I.; Rauf, A. Tourism and Environmental Pollution: Evidence from the One Belt One Road Provinces of Western China. Sustainability 2018, 10, 3520. [Google Scholar] [CrossRef]
- Ruan, W.-Q.; Li, Y.-Q.; Zhang, S.; Liu, C.-H. Evaluation and drive mechanism of tourism ecological security based on the DPSIR-DEA model. Tour. Manag. 2019, 75, 609–625. [Google Scholar] [CrossRef]
- Zha, J.; Zhu, Y.; He, D.; Tan, T.; Yang, X. Sources of tourism growth in Mainland China: An extended data envelopment analysis-based decomposition analysis. Int. J. Tour. Res. 2020, 22, 54–70. [Google Scholar] [CrossRef]
- Sun, Y.-Y.; Drakeman, D. Measuring the carbon footprint of wine tourism and cellar door sales. J. Clean. Prod. 2020, 266, 121937. [Google Scholar] [CrossRef]
- Paiano, A.; Crovella, T.; Lagioia, G. Managing sustainable practices in cruise tourism: The assessment of carbon footprint and waste of water and beverage packaging. Tour. Manag. 2020, 77, 104016. [Google Scholar] [CrossRef]
- Sun, Y.; Hou, G.; Huang, Z.; Zhong, Y. Spatial-Temporal Differences and Influencing Factors of Tourism Eco-Efficiency in China’s Three Major Urban Agglomerations Based on the Super-EBM Model. Sustainability 2020, 12, 4156. [Google Scholar] [CrossRef]
- Zha, J.; Yuan, W.; Dai, J.; Tan, T.; He, L. Eco-efficiency, eco-productivity and tourism growth in China: A non-convex metafrontier DEA-based decomposition model. J. Sustain. Tour. 2020, 28, 663–685. [Google Scholar] [CrossRef]
- Peng, B.; Wang, Y.; Wei, G. Energy eco-efficiency: Is there any spatial correlation between different regions? Energy Policy 2020, 140, 111404. [Google Scholar] [CrossRef]
- Sun, H.; Kporsu, A.K.; Taghizadeh-Hesary, F.; Edziah, B.K. Estimating environmental efficiency and convergence: 1980 to 2016. Energy 2020, 208, 118224. [Google Scholar] [CrossRef]
- Wei, Y.; Li, Y.; Wu, M.; Li, Y. The decomposition of total-factor CO2 emission efficiency of 97 contracting countries in Paris Agreement. Energy Econ. 2019, 78, 365–378. [Google Scholar] [CrossRef]
- Ouyang, W.; Yang, J.-B. The network energy and environment efficiency analysis of 27 OECD countries: A multiplicative network DEA model. Energy 2020, 197, 117161. [Google Scholar] [CrossRef]
- Yu, S.; Liu, J.; Li, L. Evaluating provincial eco-efficiency in China: An improved network data envelopment analysis model with undesirable output. Environ. Sci. Pollut. Res. 2020, 27, 6886–6903. [Google Scholar] [CrossRef]
- Jiang, Y.; Chen, X.; Valdmanis, V.G.; Baležentis, T. Evaluating Economic and Environmental Performance of the Chinese Industry Sector. Sustainability 2019, 11, 6804. [Google Scholar] [CrossRef]
- Baum, R.; Bieńkowski, J. Eco-Efficiency in Measuring the Sustainable Production of Agricultural Crops. Sustainability 2020, 12, 1418. [Google Scholar] [CrossRef]
- Ezici, B.; Eğilmez, G.; Gedik, R. Assessing the eco-efficiency of U.S. manufacturing industries with a focus on renewable vs. non-renewable energy use: An integrated time series MRIO and DEA approach. J. Clean. Prod. 2020, 253, 119630. [Google Scholar] [CrossRef]
- Feng, M.; Li, X. Evaluating the efficiency of industrial environmental regulation in China: A three-stage data envelopment analysis approach. J. Clean. Prod. 2020, 242, 13. [Google Scholar] [CrossRef]
- Li, W.; Wang, J.; Chen, R.; Xi, Y.; Liu, S.Q.; Wu, F.; Masoud, M.; Wu, X. Innovation-driven industrial green development: The moderating role of regional factors. J. Clean. Prod. 2019, 222, 344–354. [Google Scholar] [CrossRef]
- Masuda, K. Eco-Efficiency Assessment of Intensive Rice Production in Japan: Joint Application of Life Cycle Assessment and Data Envelopment Analysis. Sustainability 2019, 11, 5368. [Google Scholar] [CrossRef]
- Li, H.L.; Zhu, X.H.; Chen, J.Y.; Jiang, F.T. Environmental regulations, environmental governance efficiency and the green transformation of China’s iron and steel enterprises. Ecol. Econ. 2019, 165, 14. [Google Scholar] [CrossRef]
- Prashar, A. Towards sustainable development in industrial small and Medium-sized Enterprises: An energy sustainability approach. J. Clean. Prod. 2019, 235, 977–996. [Google Scholar] [CrossRef]
- Trianni, A.; Cagno, E.; Neri, A.; Howard, M. Measuring industrial sustainability performance: Empirical evidence from Italian and German manufacturing small and medium enterprises. J. Clean. Prod. 2019, 229, 1355–1376. [Google Scholar] [CrossRef]
- Wang, X.; Chen, L.; Liu, C.; Zhang, Y.; Li, K. Optimal production efficiency of Chinese coal enterprises under the background of de-capacity—Investigation on the data of coal enterprises in Shandong Province. J. Clean. Prod. 2019, 227, 355–365. [Google Scholar] [CrossRef]
- Yu, Y.; Huang, J.; Zhang, N. Modeling the eco-efficiency of Chinese prefecture-level cities with regional heterogeneities: A comparative perspective. Ecol. Model. 2019, 402, 1–17. [Google Scholar] [CrossRef]
- Peng, H.; Zhanga, J.; Lu, L.; Tang, G.; Yan, B.; Xiao, X.; Han, Y. Eco-efficiency and its determinants at a tourism destination: A case study of Huangshan National Park, China. Tour. Manag. 2017, 60, 201–211. [Google Scholar] [CrossRef]
- Qiu, X.; Fang, Y.; Yang, X.; Zhu, F. Tourism Eco-Efficiency Measurement, Characteristics, and Its Influence Factors in China. Sustainability 2017, 9, 1634. [Google Scholar] [CrossRef]
- Gössling, S.; Peeters, P.; Ceron, J.-P.; Dubois, G.; Patterson, T.; Richardson, R.B. The eco-efficiency of tourism. Ecol. Econ. 2005, 54, 417–434. [Google Scholar] [CrossRef]
- Tang, C.; Wan, Z.; Ng, P.; Dai, X.; Sheng, Q.; Chen, D. Temporal and Spatial Evolution of Carbon Emissions and Their Influencing Factors for Tourist Attractions at Heritage Tourist Destinations. Sustainability 2019, 11, 5944. [Google Scholar] [CrossRef]
- Sun, Y.-Y.; Cadarso, M.A.; Driml, S. Tourism carbon footprint inventories: A review of the environmentally extended input-output approach. Ann. Tour. Res. 2020, 82, 13. [Google Scholar] [CrossRef]
- Cuccia, T.; Guccio, C.; Rizzo, I. The effects of UNESCO World Heritage List inscription on tourism destinations performance in Italian regions. Econ. Model. 2016, 53, 494–508. [Google Scholar] [CrossRef]
- Li, Y.; Zhang, L. Ecological efficiency management of tourism scenic spots based on carbon footprint analysis. Int. J. Low-Carbon Technol. 2020, 15, 550–554. [Google Scholar] [CrossRef]
- Gössling, S.; Hansson, C.B.; Hörstmeier, O.; Saggel, S. Ecological footprint analysis as a tool to assess tourism sustainability. Ecol. Econ. 2002, 43, 199–211. [Google Scholar] [CrossRef]
- Kuo, N.-W.; Chen, P.-H. Quantifying energy use, carbon dioxide emission, and other environmental loads from island tourism based on a life cycle assessment approach. J. Clean. Prod. 2009, 17, 1324–1330. [Google Scholar] [CrossRef]
- Peeters, P.; Dubois, G. Tourism travel under climate change mitigation constraints. J. Transp. Geogr. 2010, 18, 447–457. [Google Scholar] [CrossRef]
- Dwyer, L.; Forsyth, P.; Spurr, R.; Hoque, S. Estimating the carbon footprint of Australian tourism. J. Sustain. Tour. 2010, 18, 355–376. [Google Scholar] [CrossRef]
- Munday, M.; Turner, K.; Jones, C. Accounting for the carbon associated with regional tourism consumption. Tour. Manag. 2013, 36, 35–44. [Google Scholar] [CrossRef]
- Tsai, K.-T.; Lin, T.-P.; Hwang, R.-L.; Huang, Y.-J. Carbon dioxide emissions generated by energy consumption of hotels and homestay facilities in Taiwan. Tour. Manag. 2014, 42, 13–21. [Google Scholar] [CrossRef]
- Radovanov, B.; Dudić, B.; Gregus, M.; Horvat, A.M.; Karovič, V. Using a Two-Stage DEA Model to Measure Tourism Potentials of EU Countries and Western Balkan Countries: An Approach to Sustainable Development. Sustainability 2020, 12, 4903. [Google Scholar] [CrossRef]
- Pablo-Romero, M.P.; Sánchez-Braza, A.; Sánchez-Rivas, J. Relationships between Hotel and Restaurant Electricity Consumption and Tourism in 11 European Union Countries. Sustainability 2017, 9, 2109. [Google Scholar] [CrossRef]
- Pace, L.A. How do tourism firms innovate for sustainable energy consumption? A capabilities perspective on the adoption of energy efficiency in tourism accommodation establishments. J. Clean. Prod. 2016, 111, 409–420. [Google Scholar] [CrossRef]
- Huang, Z.; Cao, F.; Jin, C.; Yu, Z.-Y.; Huang, R. Carbon emission flow from self-driving tours and its spatial relationship with scenic spots—A traffic-related big data method. J. Clean. Prod. 2017, 142, 946–955. [Google Scholar] [CrossRef]
- Cadarso, M.A.; Gomez, N.; Lopez, L.A.; Tobarra, M.A. Calculating tourism’s carbon footprint: Measuring the impact of investments. J. Clean Prod. 2016, 111, 529–537. [Google Scholar] [CrossRef]
- El Hanandeh, A. Quantifying the carbon footprint of religious tourism: The case of Hajj. J. Clean. Prod. 2013, 52, 53–60. [Google Scholar] [CrossRef]
- Pereira, R.P.T.; Ribeiro, G.M.; Filimonau, V. The carbon footprint appraisal of local visitor travel in Brazil: A case of the Rio de Janeiro-São Paulo itinerary. J. Clean. Prod. 2017, 141, 256–266. [Google Scholar] [CrossRef]
- Becken, S.; Simmons, D.G.; Frampton, C. Energy use associated with different travel choices. Tour. Manag. 2003, 24, 267–277. [Google Scholar] [CrossRef]
- Zaman, K.; Abd-el Moemen, M.; Islam, T. Dynamic linkages between tourism transportation expenditures, carbon dioxide emission, energy consumption and growth factors: Evidence from the transition economies. Curr. Issues Tour. 2017, 20, 1720–1735. [Google Scholar] [CrossRef]
- Scheepens, A.; Vogtlander, J.G.; Brezet, J. Two life cycle assessment (LCA) based methods to analysis and design complex (regional) circular economy systems. Case: Making water tourism more sustainable. J. Clean. Prod. 2016, 114, 257–268. [Google Scholar] [CrossRef]
- Kytzia, S.; Walz, A.; Wegmann, M. How can tourism use land more efficiently? A model-based approach to land-use efficiency for tourist destinations. Tour. Manag. 2011, 32, 629–640. [Google Scholar] [CrossRef]
- Sun, Y.-Y. Decomposition of tourism greenhouse gas emissions: Revealing the dynamics between tourism economic growth, technological efficiency, and carbon emissions. Tour. Manag. 2016, 55, 326–336. [Google Scholar] [CrossRef]
- Huang, Y.; Coelho, V.R. Sustainability performance assessment focusing on coral reef protection by the tourism industry in the Coral Triangle region. Tour. Manag. 2017, 59, 510–527. [Google Scholar] [CrossRef]
- Oender, I.; Wober, K.; Zekan, B. Towards a sustainable urban tourism development in Europe: The role of benchmarking and tourism management information systems—A partial model of destination competitiveness. Tour. Econ. 2017, 23, 243–259. [Google Scholar] [CrossRef]
- Wang, S.; Hu, Y.; He, H.; Wang, G. Progress and Prospects for Tourism Footprint Research. Sustainability 2017, 9, 1847. [Google Scholar] [CrossRef]
- Cooper, W.W.; Tone, K.; Seiford, L.M. Data Envelopment Analysis: A Comprehensive Text with Models, Applications References, and DEA-Solver Software with Cdrom; Kluwer Academic Publishers: Dordrecht, The Netherlands, 1999; pp. 145–156. [Google Scholar]
- Zhou, Y.; Kong, Y.; Zhang, T. The spatial and temporal evolution of provincial eco-efficiency in China based on SBM modified three-stage data envelopment analysis. Environ. Sci. Pollut. Res. 2020, 27, 8557–8569. [Google Scholar] [CrossRef]
- Guo, S.-D.; Li, H.; Zhao, R.; Zhou, X. Industrial environmental efficiency assessment for China’s western regions by using a SBM-based DEA. Environ. Sci. Pollut. Res. 2019, 26, 27542–27550. [Google Scholar] [CrossRef] [PubMed]
- Díaz-Villavicencio, G.; Didonet, S.R.; Dodd, A. Influencing factors of eco-efficient urban waste management: Evidence from Spanish municipalities. J. Clean. Prod. 2017, 164, 1486–1496. [Google Scholar] [CrossRef]
- Li, B.; Shi, Z.; Tian, C. Spatio-temporal Difference and Influencing Factors of Environmental Adaptability Measurement of Human-sea Economic System in Liaoning Coastal Area. Chin. Geogr. Sci. 2018, 28, 313–324. [Google Scholar] [CrossRef]
- Zhang, J.; Wang, S.; Yang, P.; Fan, F.; Wang, X. Analysis of Scale Factors on China’s Sustainable Development Efficiency Based on Three-Stage DEA and a Double Threshold Test. Sustainability 2020, 12, 2225. [Google Scholar] [CrossRef]
- Xu, X.; Sun, Y.; Krishnamoorthy, S.; Chandran, K. An Empirical Analysis of Green Technology Innovation and Ecological Efficiency Based on a Greenhouse Evolutionary Ventilation Algorithm Fuzzy-Model. Sustainability 2020, 12, 3886. [Google Scholar] [CrossRef]
- Xu, K.; Loh, L.; Chen, A.Q. Sustainable Innovation Governance: An Analysis of Regional Innovation with a Super Efficiency Slack-Based Measure Model. Sustainability 2020, 12, 3008. [Google Scholar] [CrossRef]
- Adejumo, A.V. Environmental quality vs economic growth in a developing economy: Complements or conflicts. Environ. Sci. Pollut. Res. 2019, 27, 6163–6179. [Google Scholar] [CrossRef]
- Wang, J.; Chengdong, X.U. Geodetector: Principle and prospective. Acta Geogr. Sin. 2017, 72, 116–134. [Google Scholar]
- Bian, Y.; Dong, L.; Liu, Z.; Zhang, L. A Sectoral Eco-Efficiency Analysis on Urban-Industrial Symbiosis. Sustainability 2020, 12, 3650. [Google Scholar] [CrossRef]
- Grossman, G.M.; Krueger, A.B. Environmental Impacts of a North American Free Trade Agreement. Soc. Sci. Electron. Publ. 1991, 8, 223–250. [Google Scholar]
- Chen, N.; Xu, L.; Chen, Z. Environmental efficiency analysis of the Yangtze River Economic Zone using super efficiency data envelopment analysis (SEDEA) and tobit models. Energy 2017, 134, 659–671. [Google Scholar] [CrossRef]
- Tang, C.; Zhong, L.; Jiang, Q. Energy efficiency and carbon efficiency of tourism industry in destination. Energy Effic. 2018, 11, 539–558. [Google Scholar] [CrossRef]
Publisher’s Note: MDPI stays neutral with regard to jurisdictional claims in published maps and institutional affiliations. |
© 2020 by the authors. Licensee MDPI, Basel, Switzerland. This article is an open access article distributed under the terms and conditions of the Creative Commons Attribution (CC BY) license (http://creativecommons.org/licenses/by/4.0/).