1. Introduction
Global plastics consumption rates have been increasing steadily since the 1950s [
1]. In 2015, global plastics production had reached 380 million metric tons with around 40% used for packaging [
2]. Packaging is recognized as the dominant type of single-use plastic in the market with around 60% of all plastic packaging used for the food and beverage market [
3]. Further still, the consumption of plastic packaging is on the rise [
2].
Geyer et al. calculated that, in 2015, around 6300 MT of plastic waste had been generated, from which only 9% was recycled, 12% incinerated, and 79% was accumulated in landfills or the natural environment [
4]. These authors presumed that this linear waste management trend can lead to roughly 12,000 MT of plastic waste entering the natural environment and landfills by the year 2050.
Single-use plastics have potential to cause a negative impact on the environment through littering and accumulation, as well as landfilling and incineration. Inappropriate disposal, inadequate management of plastics and the linear single-use plastic consumption model can become a source of leakage to the natural environment leading to pollution in many forms [
2], and negative environmental effects on natural habitats [
1,
5]. Every year from 5 to 13 million tons of plastic are estimated to end up in the ocean, and plastic pollution reaches even the most remote areas of the planet [
6]. Single-use plastics make up 86% of all single-use items found on beaches. Beverage cups are one of the top ten single-use items found there [
7]. As single-use plastics are designed to be used once, this leads to the loss of this valuable material, which plays an important role in our economy.
To reduce environmental damage, efforts are now needed to significantly increase the recycling rates of packaging plastics [
8]. The latest report by the European Court of Auditors reveals that new calculation methods for the actual share of plastic packaging being recycled could drop the value down from 42% to 30% across EU member states [
9]. In some cases, waste collection is missing or is difficult to implement, and consequently, waste recycling performances are low; this is the case of the festivals. Industry research showed that only 32% of single-use PET (polyethylene terephthalate) cups used in UK festivals are recycled [
10].
The European Commission has reviewed Directive 94/62/EC to reinforce the mandatory essential requirements for packaging to be allowed on the EU market with a focus on reduction of packaging and packaging waste through waste prevention measures and design for reuse and recyclability of packaging [
11]. A new Circular Economy Action Plan, represented by the European Commission in 2020, also aims to accelerate the transition from materials recycling to waste prevention and reuse strategies [
12,
13]. The Plan gives incentives that pursue the transformation of current packaging systems to more circular and sustainable ones [
12,
14]. The Single-Use Plastics Directive that entered into force on 2 July 2019 is another significant step forward to urge the transition from single-use plastics towards reusable products and systems [
15]. The directive foresees certain policy measures, such as market restriction, new product design requirements, extended producer responsibility (EPR) schemes, awareness-raising measures, consumption reduction, improved collection and labeling requirements as the key elements to move away from single-use plastic products [
8,
16].
Relatively limited use and application of reusable packaging reuse systems today might be the result of the global drift from reusable packaging to single-use packaging during the past decades [
17]. Nevertheless, Coelho et al. (2020) claim that packaging reuse is not new in both B2B (business to business), and B2C (business to consumer) segments, where the application of different forms of reusable packaging solutions have been established for primary and secondary, to tertiary (transportation) packaging [
18]. Mahmoudi and Parviziomran (2020) point out that even reuse practices are not new, but primary packaging, that has direct contact with the product, is recognized to be a newer concept in comparison to secondary and tertiary packaging reusability. Additionally, changes in packaging ownership have been observed—the authors state that there is a clear move from packaging owning to renting services [
18]. This could have a significant impact on our consumption patterns. Coelho et al. (2020) see the growth of acceptance for service systems, instead of ownership in the reusable packaging market. This ownership transformation has both some evidential advantages and challenges for the decision-makers. As the authors have noted, reusable packaging return systems may increase customers’ loyalty to retailers through refund schemes. The authors identify advantages for the reusable returnable packaging consumers, which are cost reduction through discounts, as well as the reduction in waste amounts [
17].
Economic incentives can play a big part in reducing the consumption of single-use plastic [
15]. There is strong evidence that charges have a better performance than discounts in reducing the use of single-use disposable beverage cups. A review carried out by the University of Cardiff revealed that a minimum charge of £0.20 would be needed to change the behavior of 49% of the population [
19]. Moreover, social marketing tools and information campaigns can contribute to the success of the charges [
19]. Increased and improved information and raising consumer awareness go hand-in-hand with the regulatory measures to reduce consumption, redesign products and contribute to ending plastic pollution [
15].
Festivals and events in a short period of time (from a few hours to a few days) generate huge amounts of single-use packaging that become one of the dominant waste streams at these events due to a large number of people, intensive activities, and location characteristics [
20,
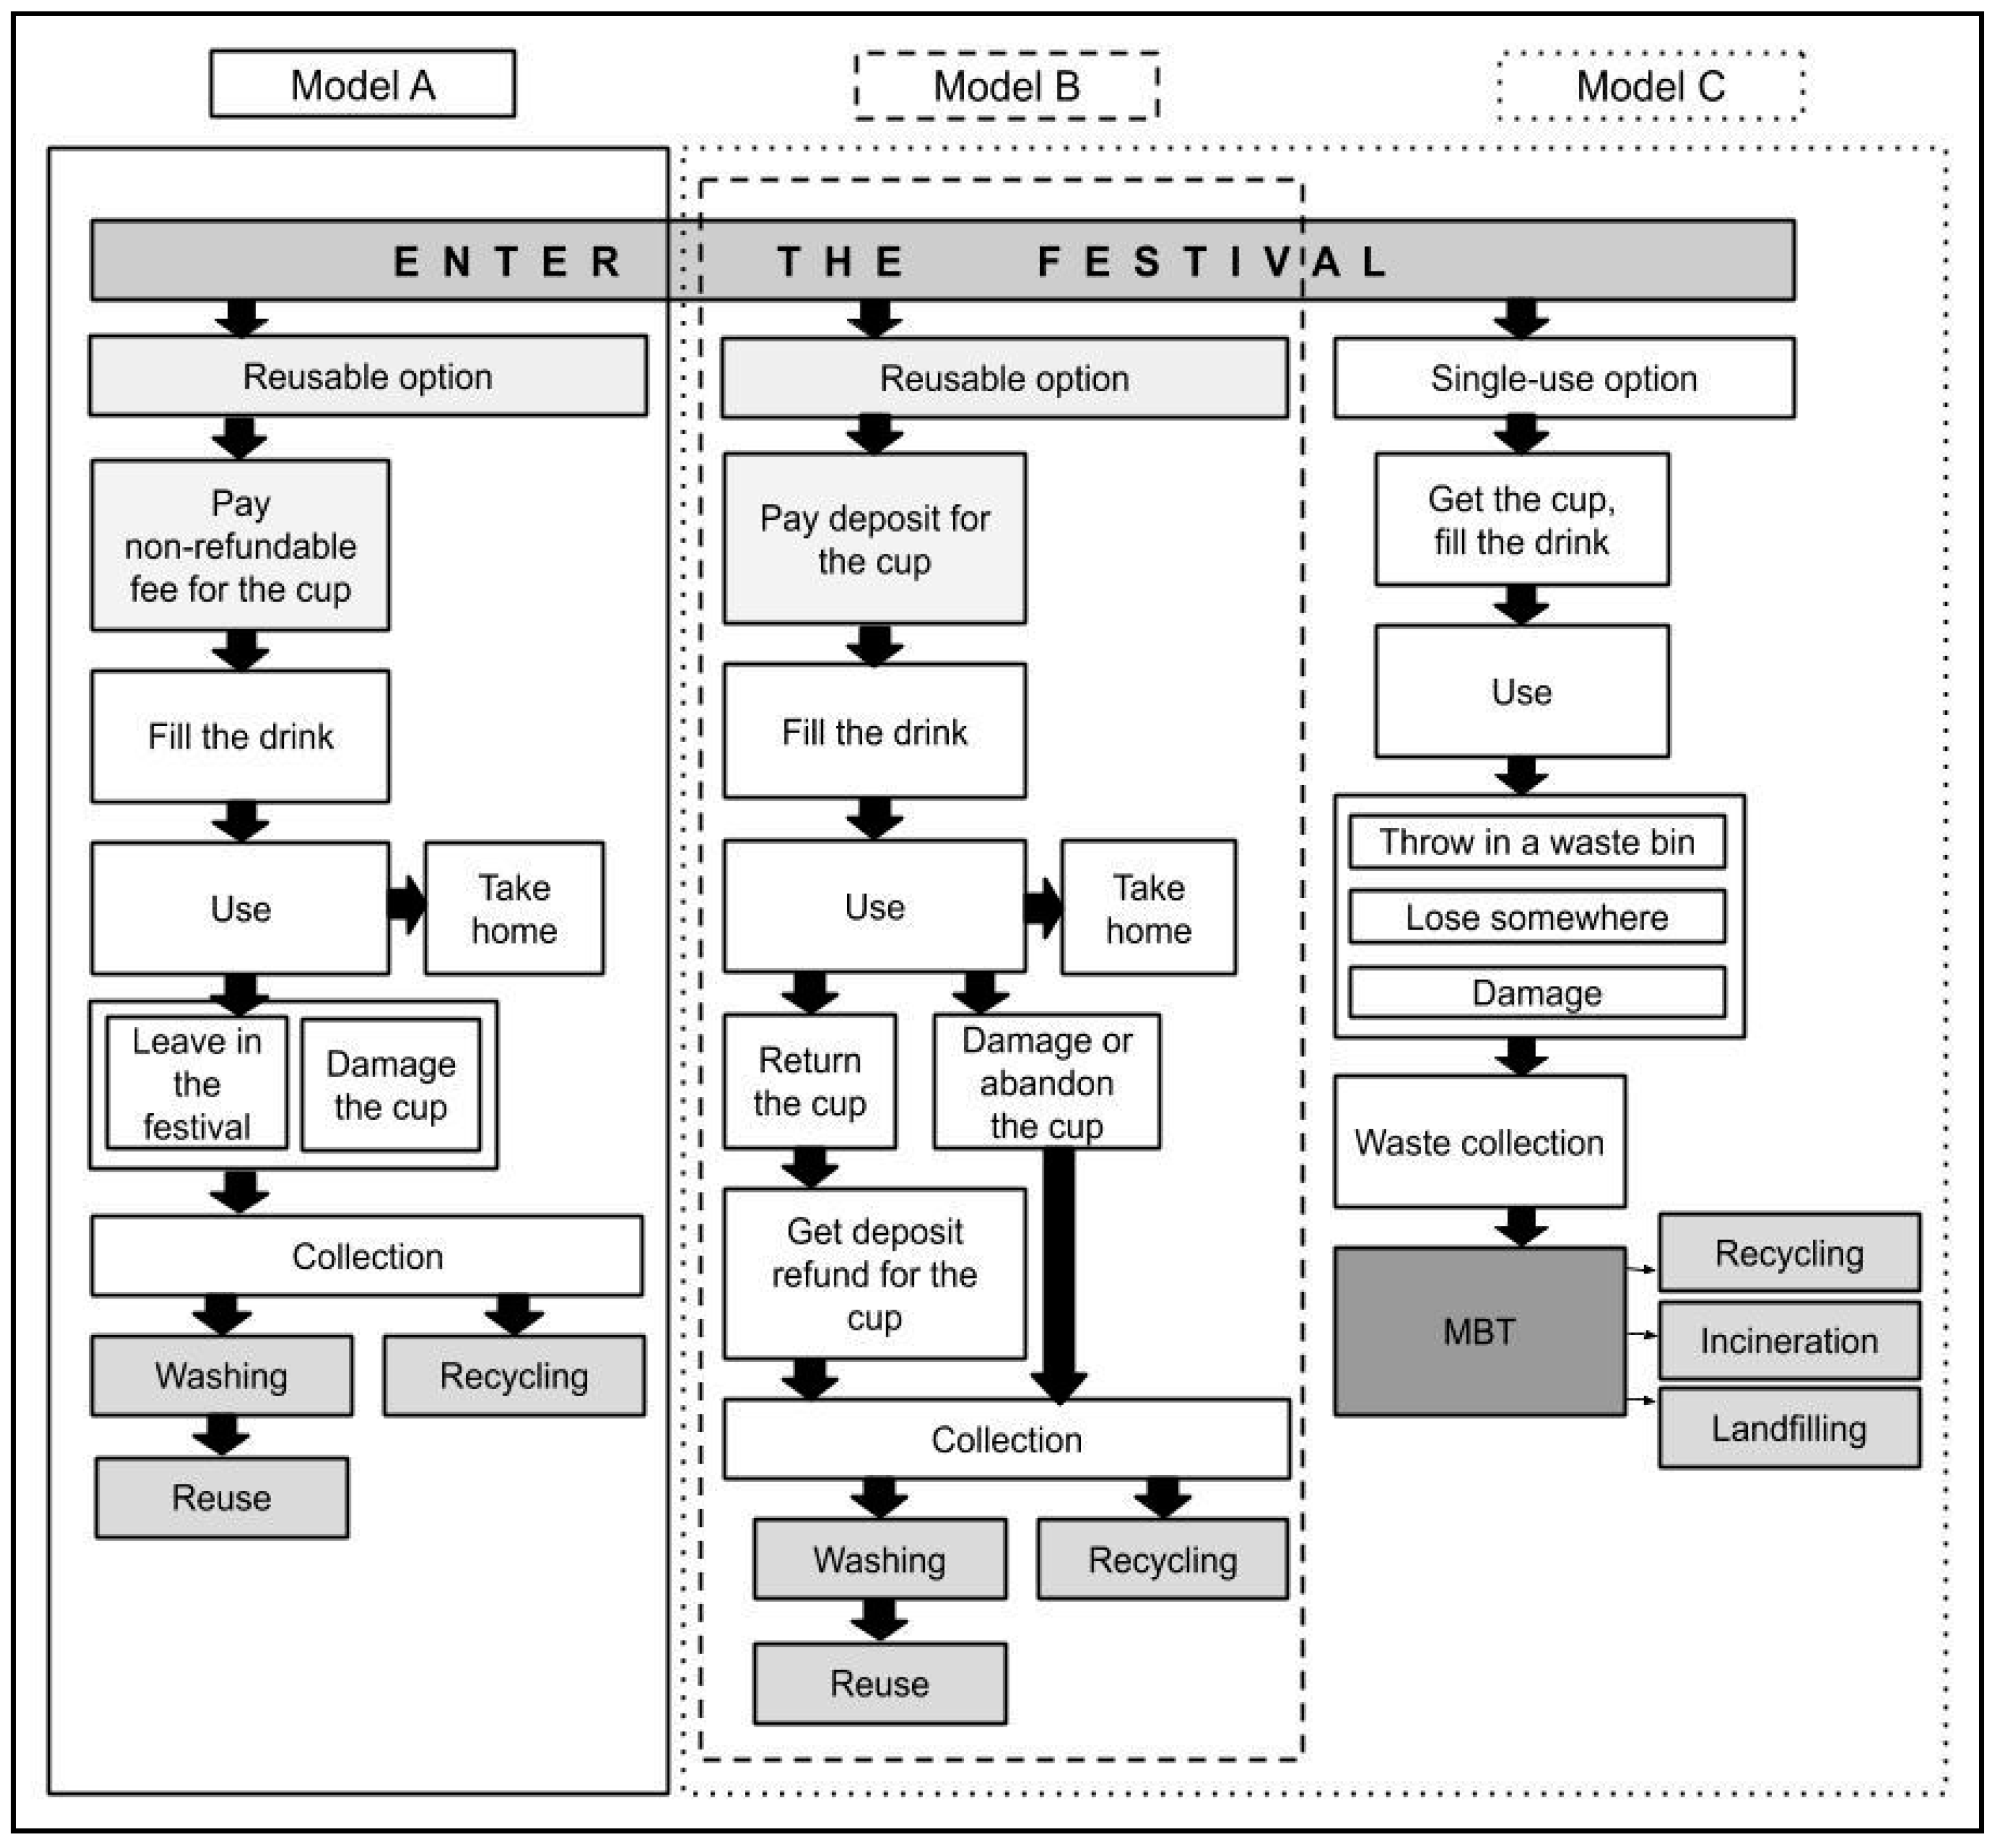
21]. The waste hierarchy concept shows that waste prevention and minimization is the most efficient and effective means of resource management. Therefore, different waste prevention measures are being implemented at different festivals worldwide to tackle the problem of single-use packaging, beverage cups included. The most popular waste prevention measures applied by green-minded festivals are reusable packaging deposit-refund models, package-free alternatives, festival rules for the participants to carry their own dishes, and special requirements (guidelines) for the vendors to provide certain types of packaging or alternative packaging systems at the festival venue [
22].
In 2017, Linder et al. presented three levels of circularity where different activities can be applied in order to empower the transition to circular economy: micro level (individual companies and consumers), meso level (eco-industrial parks), and macro level (city, province, region, and nation) [
23]. Festivals can be seen as micro-level closed systems, where material inputs and outputs can be measured and easily controlled. Maintaining the value of products, materials, and resources for as long as possible is the fundamental goal of circular economy, and the reuse of packaging can help achieve this. It is recognized that deposit-refund schemes help to manage and control resource recovery from the consumers.
The majority of authors agree that reuse of packaging has a huge potential for environmental impact reduction through the decreased need of materials, especially virgin or primary materials, when the reuse systems are well developed and function sustainably [
17,
24].
A comprehensive comparative life cycle analysis of different cup systems for selling of drinks at events performed by Pladerer et al. (2020) revealed that reusable cup models have lower environmental burden compared to disposable cup models, despite the fact that life cycle assessments (LCA) for reusable cups were always based on the most disadvantageous scenario compared to disposable cups [
25]. According to the Realising Another World (RAW) Foundation [
26], a reusable cup is the better environmental option compared to a disposable polyethylene terephthalate (PET) cup, after more than 3 uses in many cases, and after around 9–14 uses compared to cardboard. Another analysis showed that after 10 uses of reusable polypropylene (PP) cup, it generates less environmental impact compared to single-use polypropylene cups [
27].
Nevertheless, reuse packaging systems may have a higher environmental footprint compared to single-use packaging if the reuse systems are not being managed carefully in a sustainable way. Most of the negative impacts of reusable packaging reuse systems have the potential to occur through certain aspects such as inappropriate packaging design, complex logistics, containers’ service life, cleaning, food safety, etc. [
17,
18]. Coelho et al. (2020) agree that economics, as well as environmental impacts of reuse systems, strongly depend on several factors like logistics, reusable packaging return rates, cleaning, labor costs, and market size. The authors note that more studies of life cycle costing have to be made to compare the costs of single-use and reusable packaging systems.
A total of 29 festivals and festival-like events were organized during the 2019 summer season in Lithuania where standard linear “take-make-dispose” model of disposable single-use beverage cups was applied. No clear measures have been made in order to minimize the use of disposable beverage cups and reduce the waste of single-use plastics within the events. Until then, event organizers had no alternative to disposable beverage cups. Several events used reusable cup deposit systems in the past, but the cups for these events had promotional attributes and were therefore used as souvenirs. Single-use plastic beverage cups remain the most popular packaging choice for cold drinks like beer, cider, and cocktails in Lithuanian open-air festivals. However, such a choice significantly increases waste treatment costs for the festival organizers due to a big volume of waste, additional labor, and time needed for the clean-up of the area after the festival. A more resource-efficient and circular approach needs to be realized.
The objective of our work was to assess the environmental benefits of cup reuse models in open summer festivals on material circularity and the avoidance of disposable plastic. The paper describes the performance of service systems implemented in Lithuanian festivals with the aim to identify which models (and market-based instruments) can optimize the use of reusable cups and minimize losses and damages. The aim of this work was achieved by answering three research questions (RQs):
How many cups will be used, lost, and damaged during the festivals when different reusable cup reuse models are applied (RQ1)?
What impact do reusable cup reuse models make on material circularity compared to the use of single-use beverage cups at the festivals (RQ2)?
How many single-use plastic cups were avoided by applying reusable beverage cup reuse models at the festivals (RQ3)?
3. Results and Discussion
Case studies at seven festivals have revealed the peculiarities, advantages and disadvantages of different reuse models for reusable cups.
3.1. Material Flow Analysis Results
Material flow analyses showed that each reuse model, and even smaller reuse categories (A1, A2, B1, B2, C) have relatively different cup loss, damage, and return for reuse rates, where certain patterns can be identified. B2 reuse model was chosen for data verification because it covered three different events.
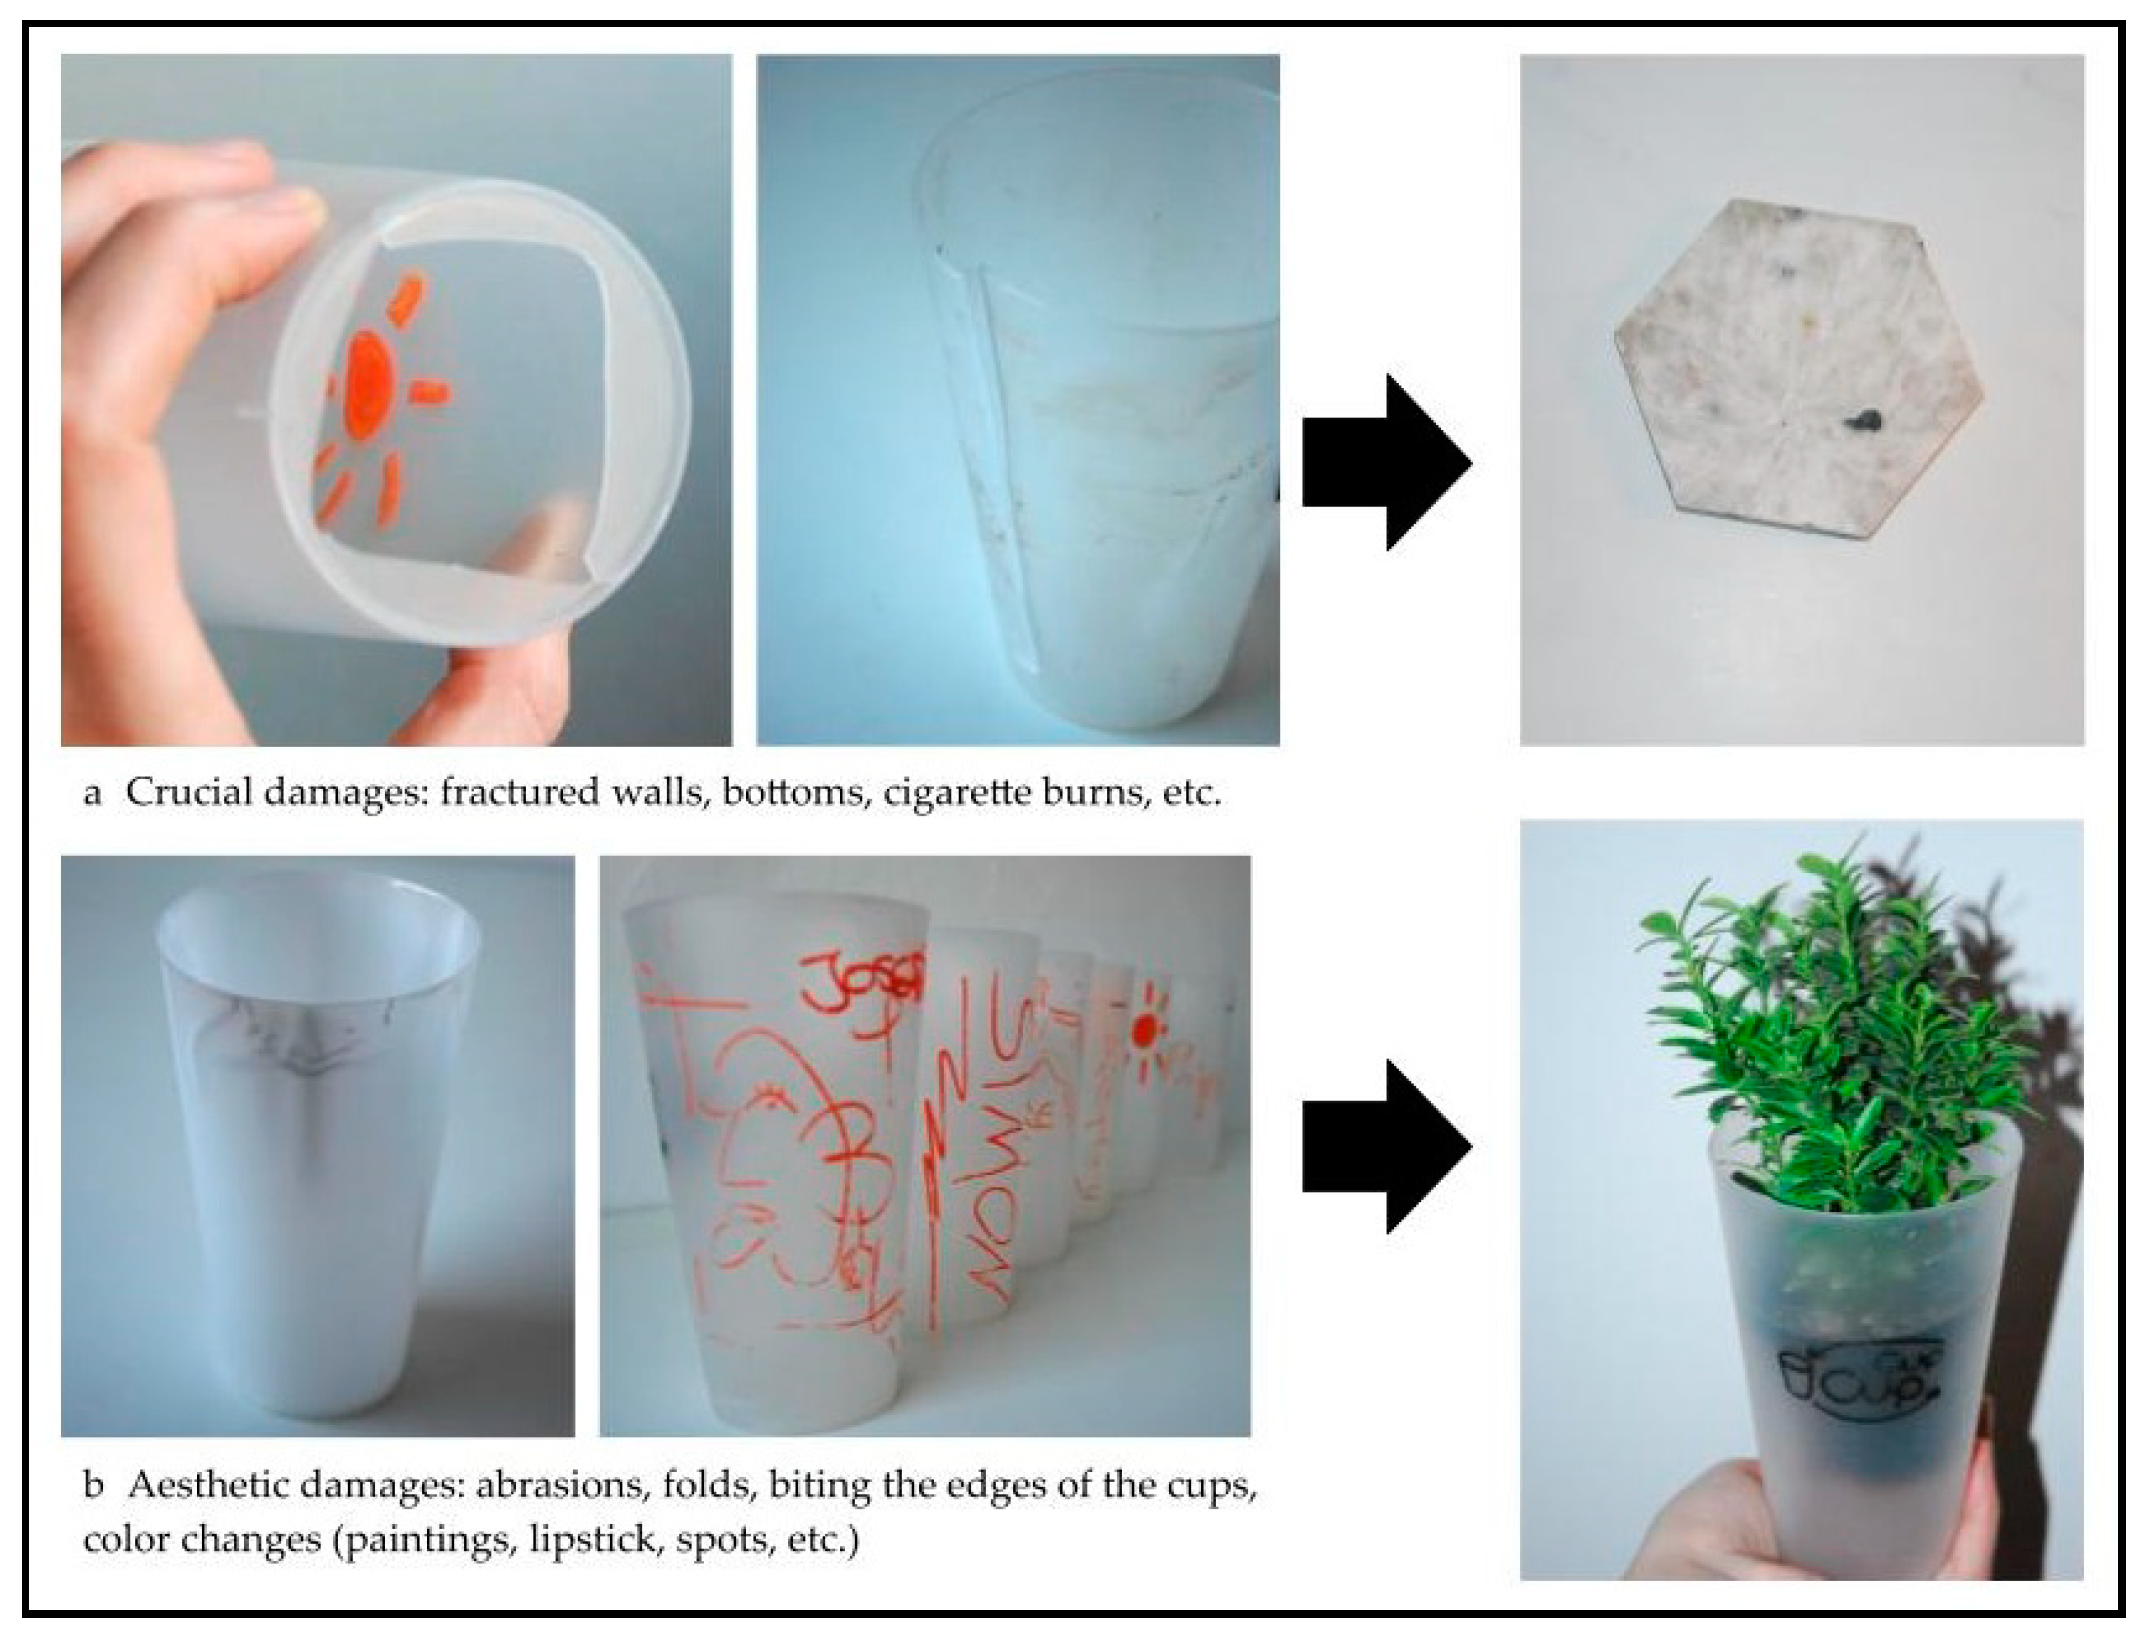
Damaged cups were recycled to make pads for coffee cups in partnership with the Precious Plastic Lithuania initiative, and some of the cups with shape deformations and color changes were repurposed to souvenir pots for plants. Washing and cleaning of used cups took place at the washing center, where industrial washing equipment was used and detergents were applied for disinfection and proper cleaning of reusable cups. The loss was associated with taking cups home, or in some cases, with throwing them away with mixed waste, especially when no economic incentives for return were applied.
3.1.1. Material Flow Analysis of Different Reuse Models (A1, A2, B1, B2, C)
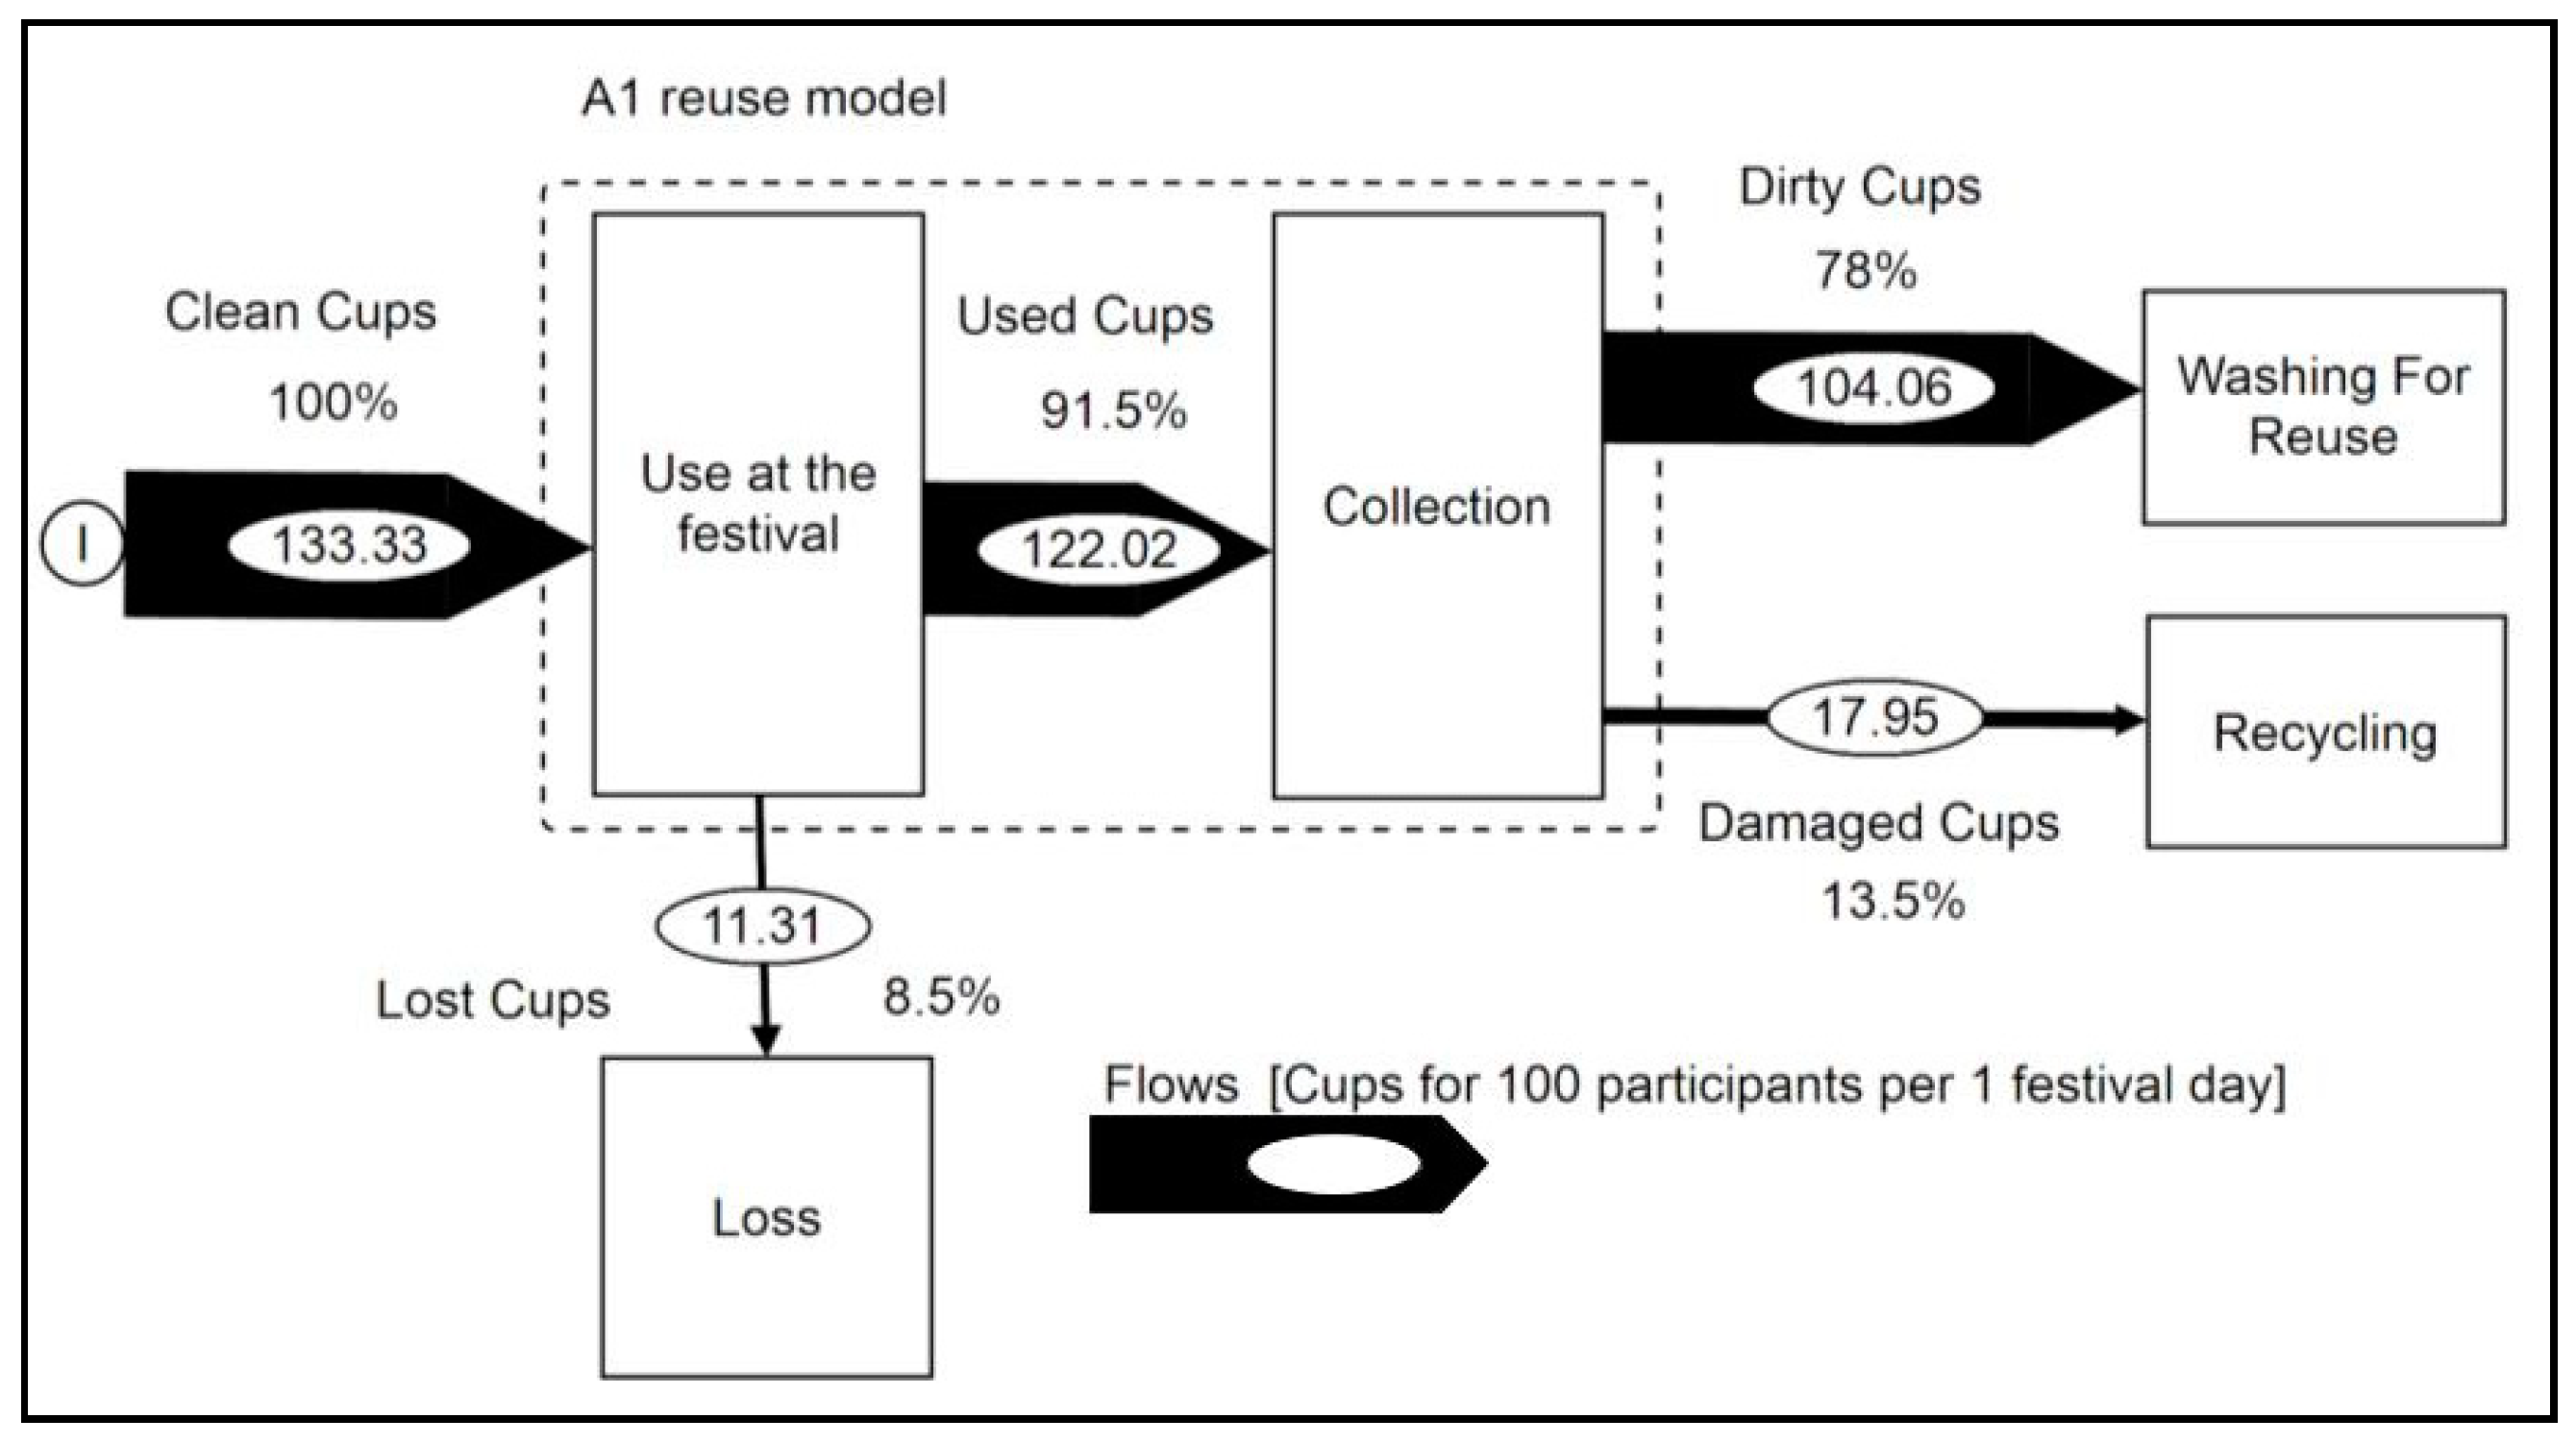
Reuse model A (both A1 and A2) had no economic incentives to return the cups after use; only a single-use fee was applied. The first type of event with reuse model A1 had no financial motivation for attendees to return and take care of the cups, and the second type of event with reuse model A2 had a small penalty for the loss of the cup, but no financial motivation for attendees to return the cups at the end of the festival. The results of reuse model A1 revealed a relatively high rate of total cup loss (22%) compared to the B and C models, but it was lower than for the A2 reuse model, for which the rate of total cup loss was 22.9% (see
Figure 3) Reuse model A1 had the highest consumption rate of cups used for 100 participants per one festival day. Such a high consumption rate is associated with the model specifications like each drink being served in a new cup because most of the drinks were cocktails. Additionally, there was no need for taking care of your own cup—no penalties for lost cups were applied and most of the cups were left in the territory, at the bars and in special collection boxes that were spread throughout the territory. Reuse model A1 was the most intensive in consumption of beverages and was similar to single-use or disposable model with the principle “take-make-dispose (leave)”. Nevertheless, several key factors led to the recovery of the cups: good cup collection from the territory by volunteers during the whole event; small, closed and well-defined festival area; large number of cup collection boxes spread through the territory; good communication with participants—the organizers informed the participants about the system just before the event and showed an attractive video.
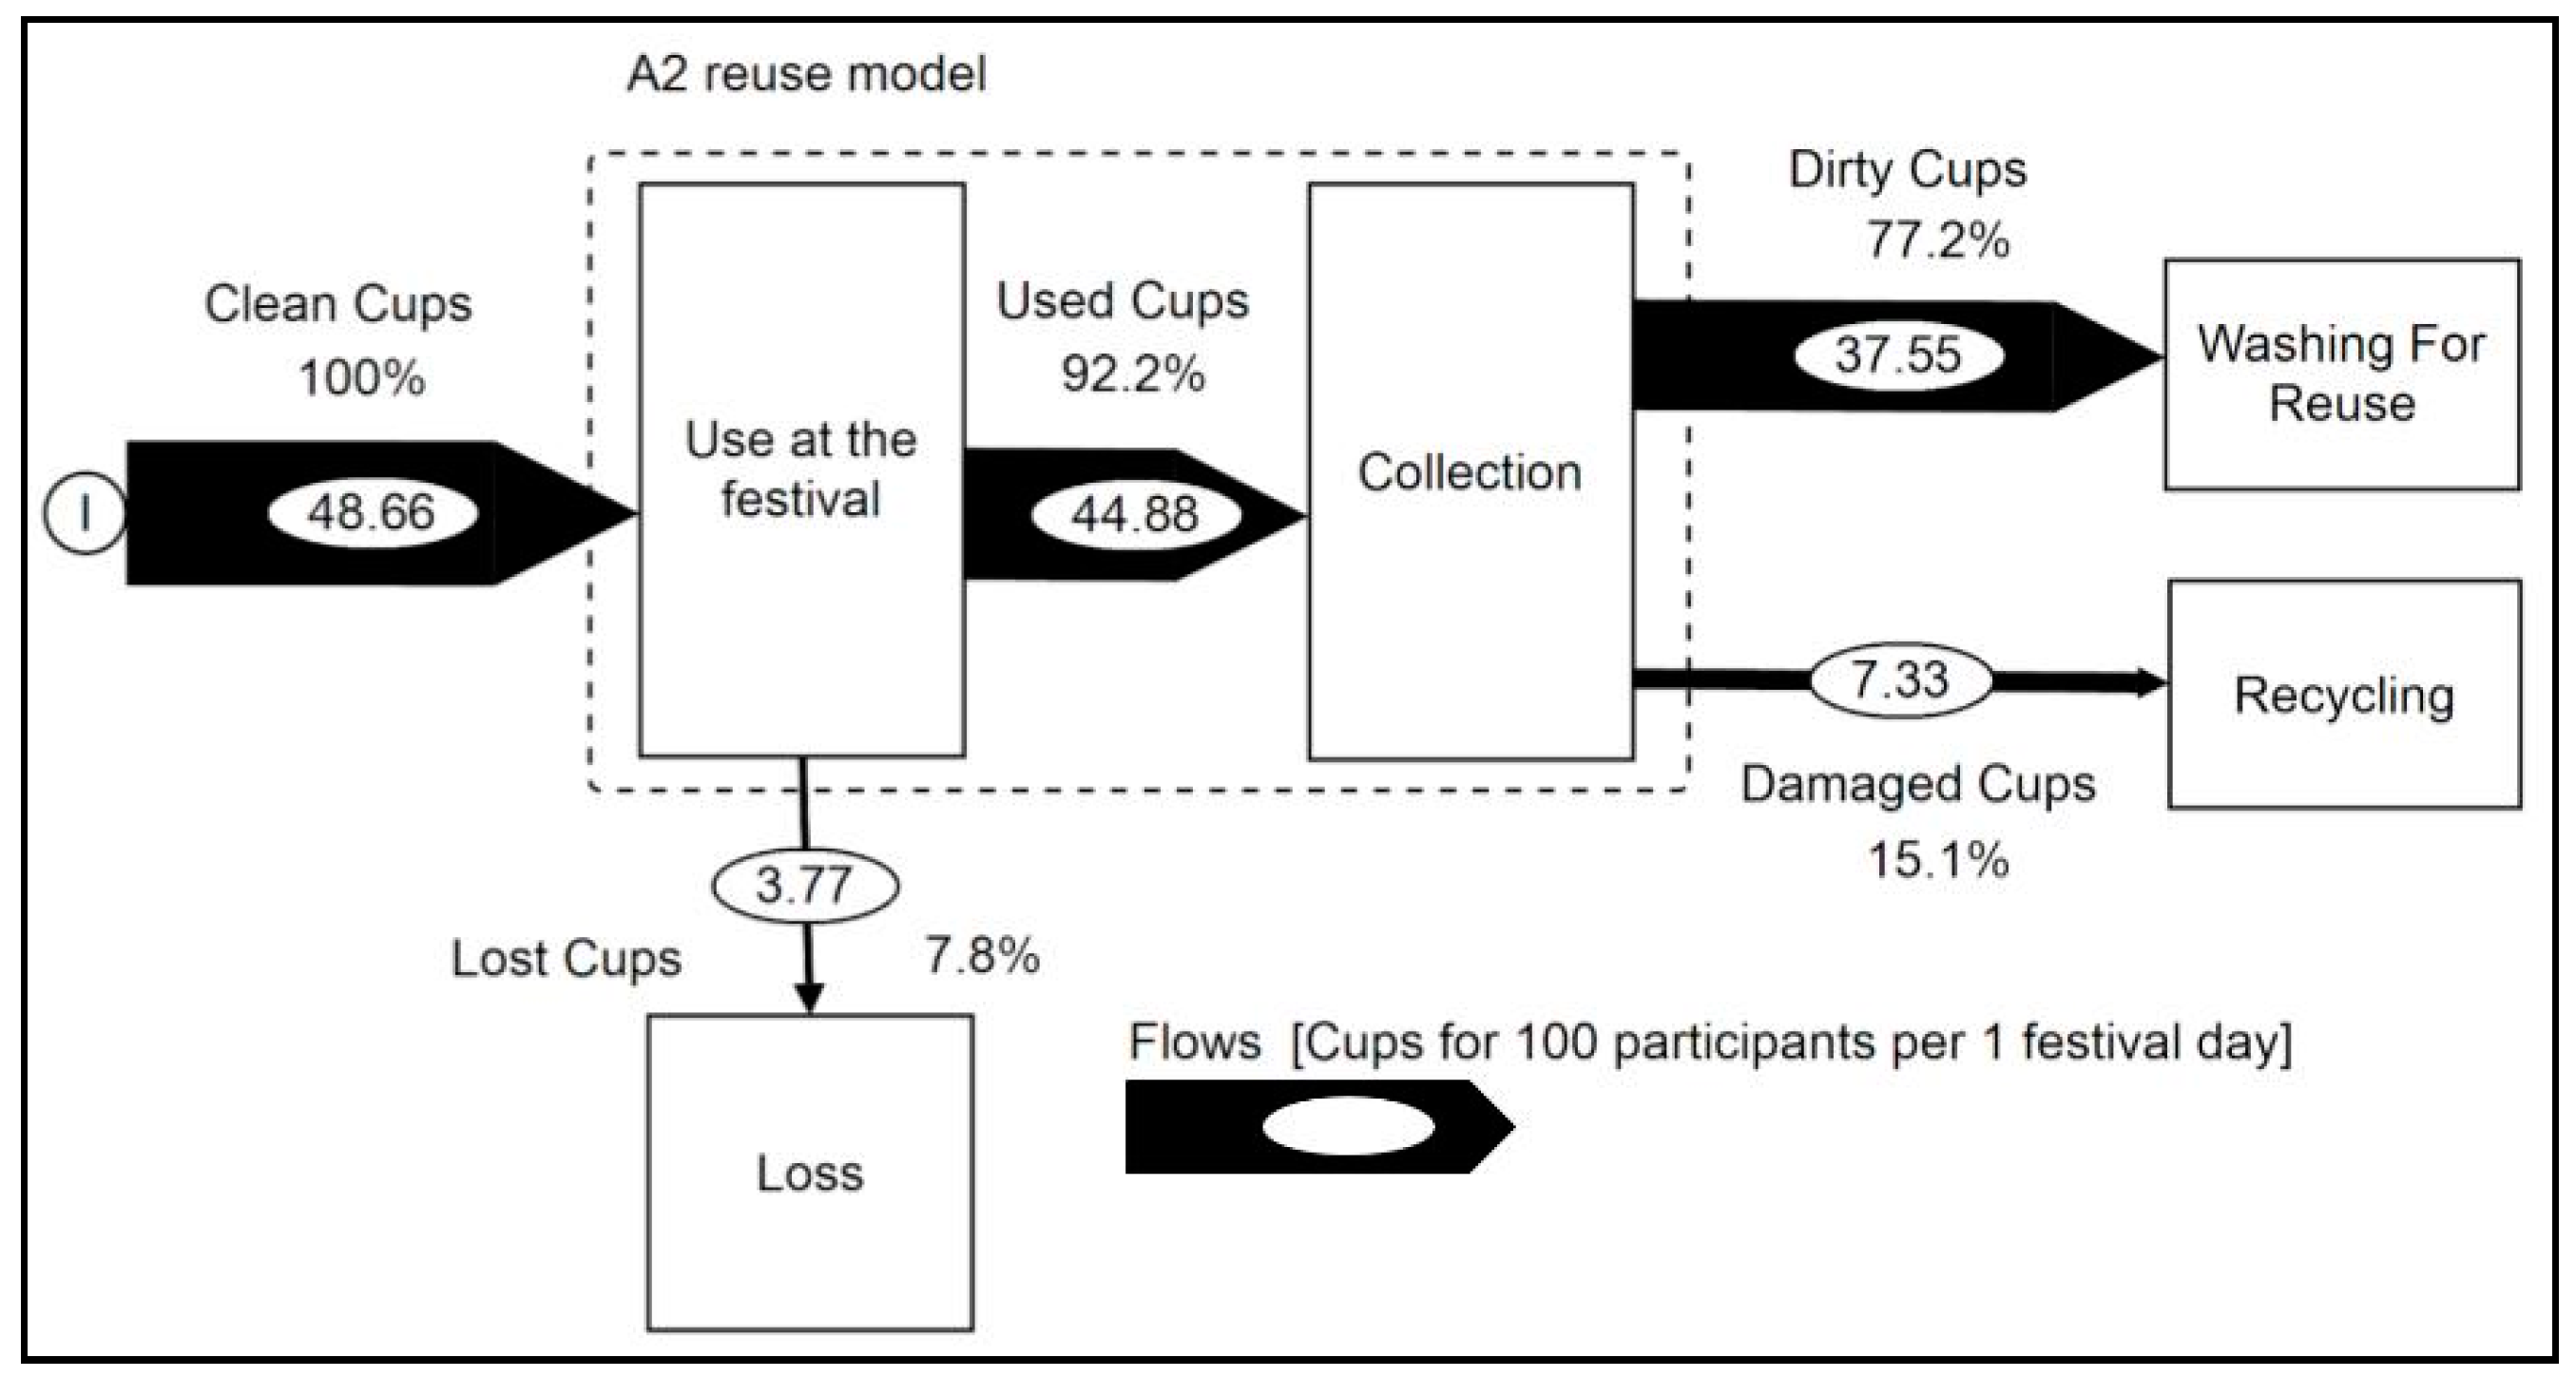
Reuse model A2 showed the highest rate of total cup loss—22.9% (see
Figure 4). This can be explained by participants taking cups home as souvenirs, bearing in mind that more than half of the participants in this festival were foreigners. Cups lost in the festival territory were collected by the volunteers during the whole event. Most of the cup damage observed in this festival was aesthetic; that is to say, cups were colored, painted, or applied with stickers. However, in reuse model A1, most of the damage was crucial, consisting of cigarette burns and breaks, etc.
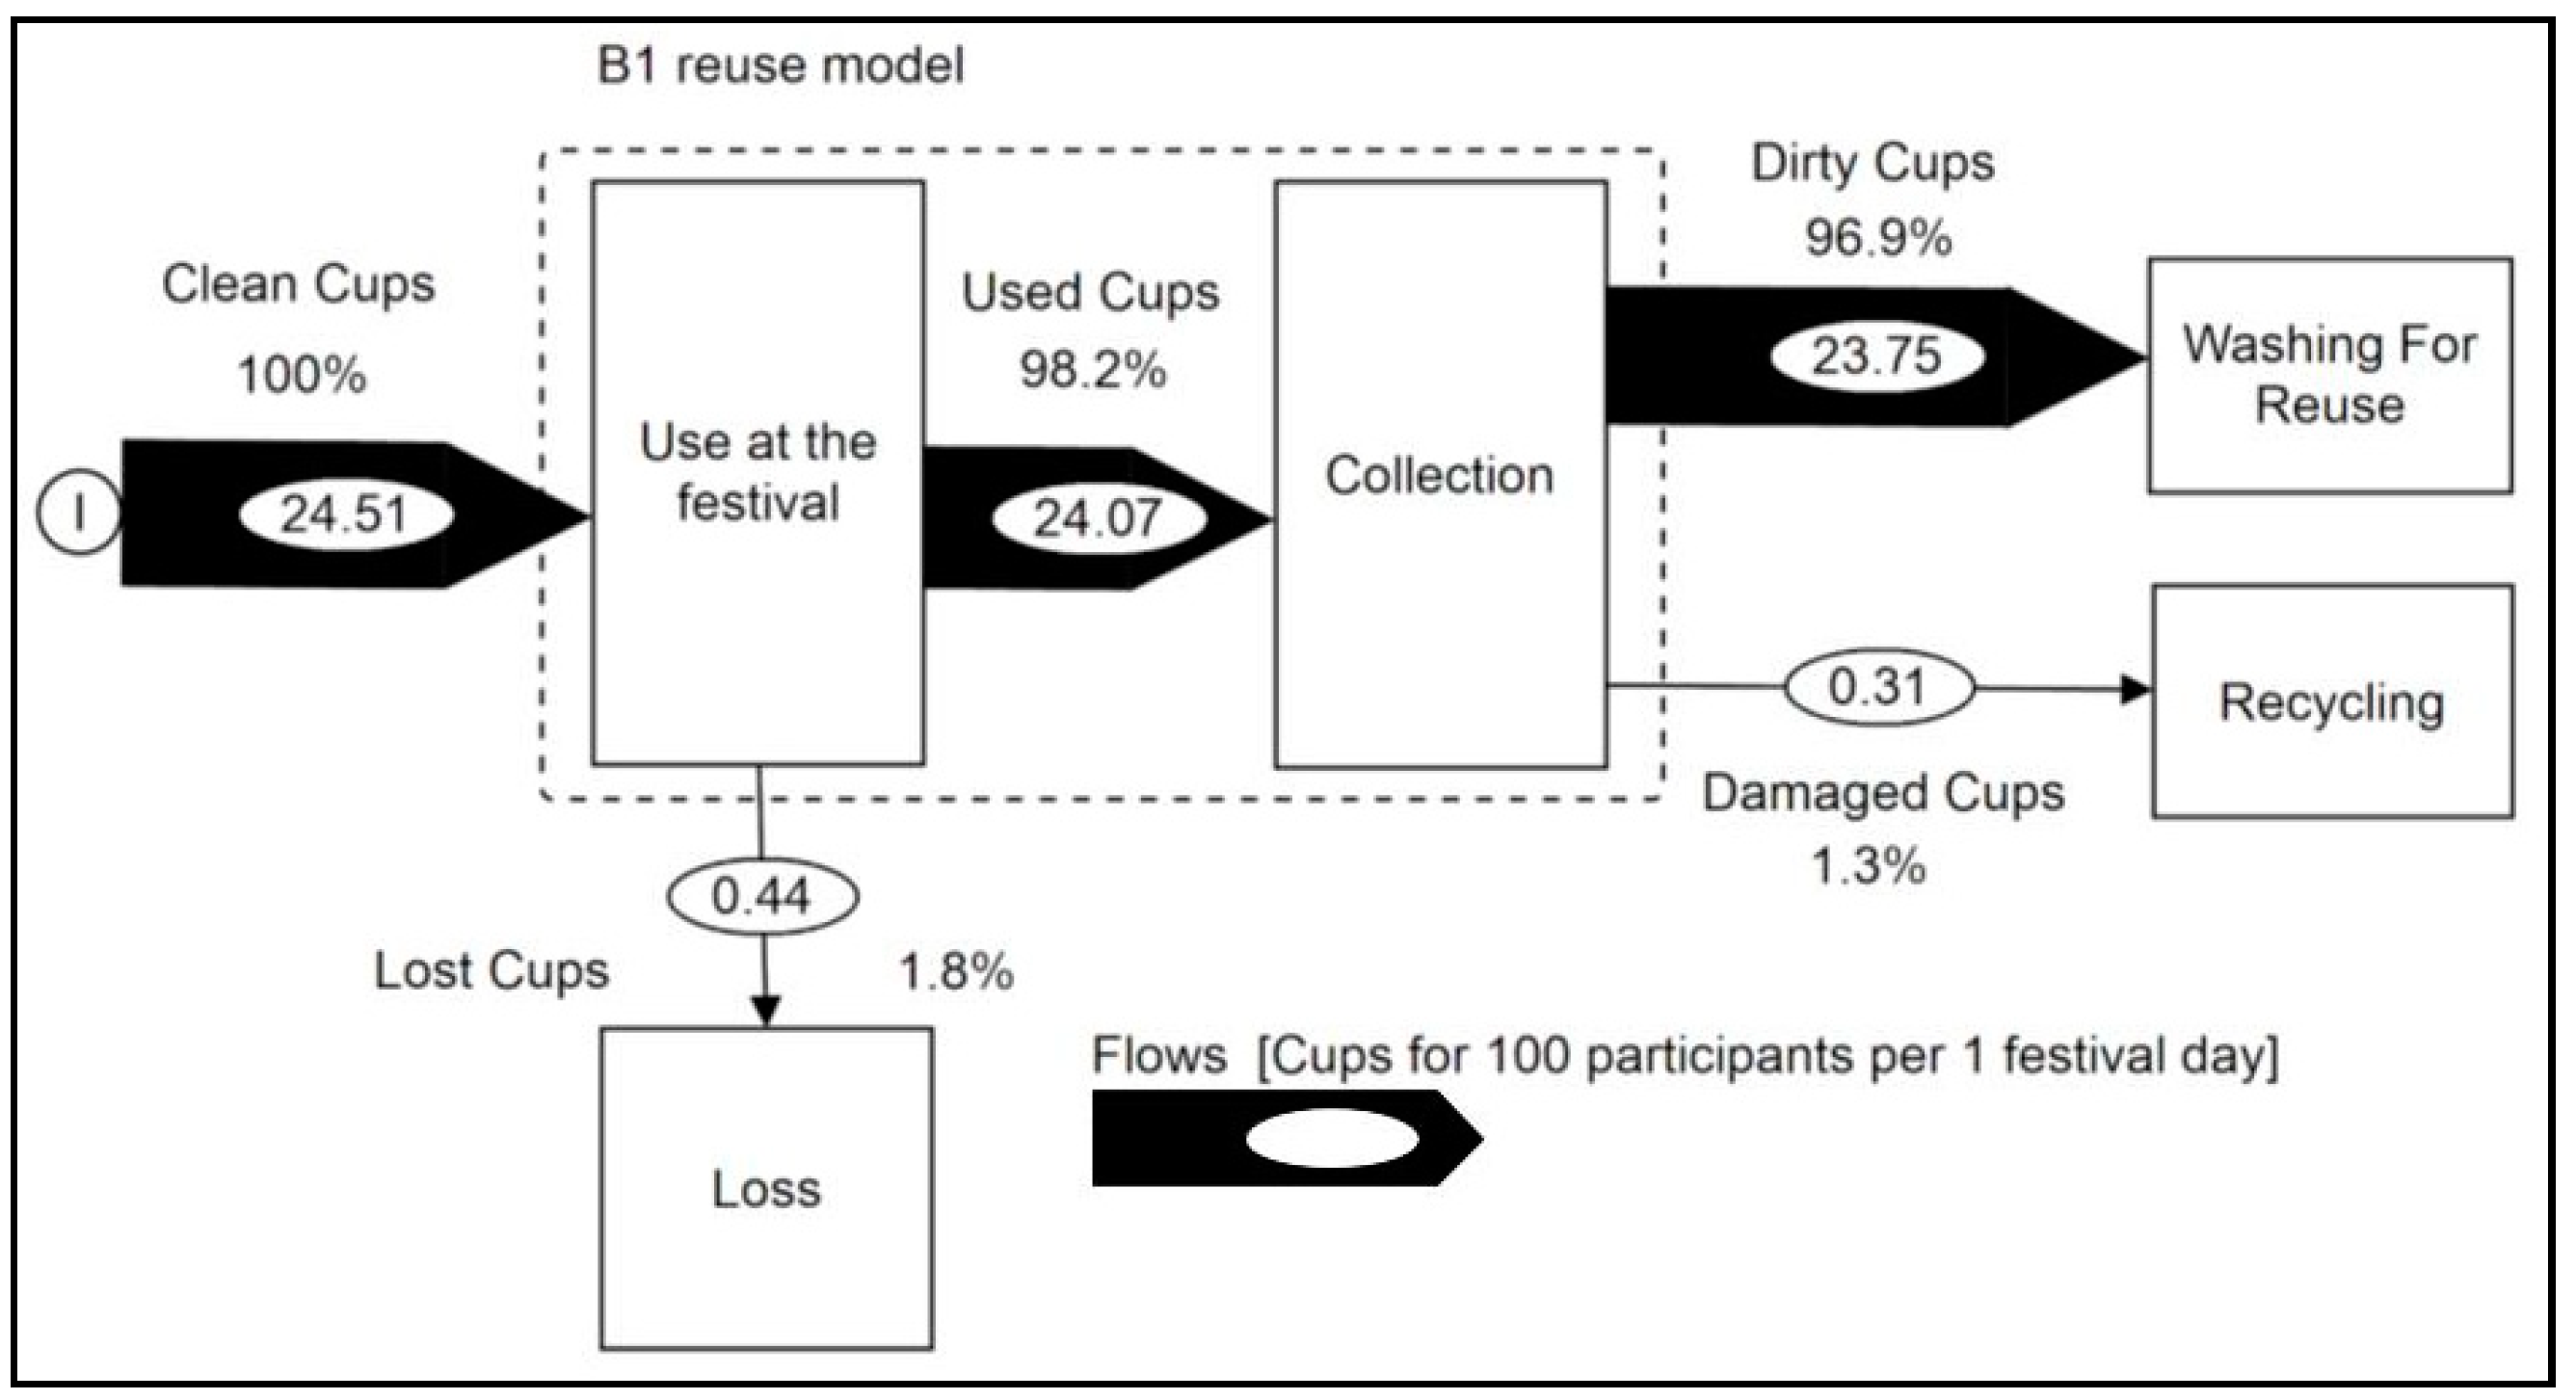
Reuse model B (both B1 and B2) had economic incentives to return the cups. This model motivated the participants not to break and not to lose the cups. If one participant lost their cup in the festival territory, someone else could return their cup to the eco-point or to the bar to get refunded.
The success of reuse model B1 is presumed to be due to the full refund of the deposit and to the dominant age group of the participants being over 30 years. Moreover, this festival was supported by the municipality, which insisted that organizers use reusable solutions instead of single-use plastics. The results show that the total loss of reusable cups was 3.1%, which is 11.9% lower than for reuse model B2 (see
Figure 5).
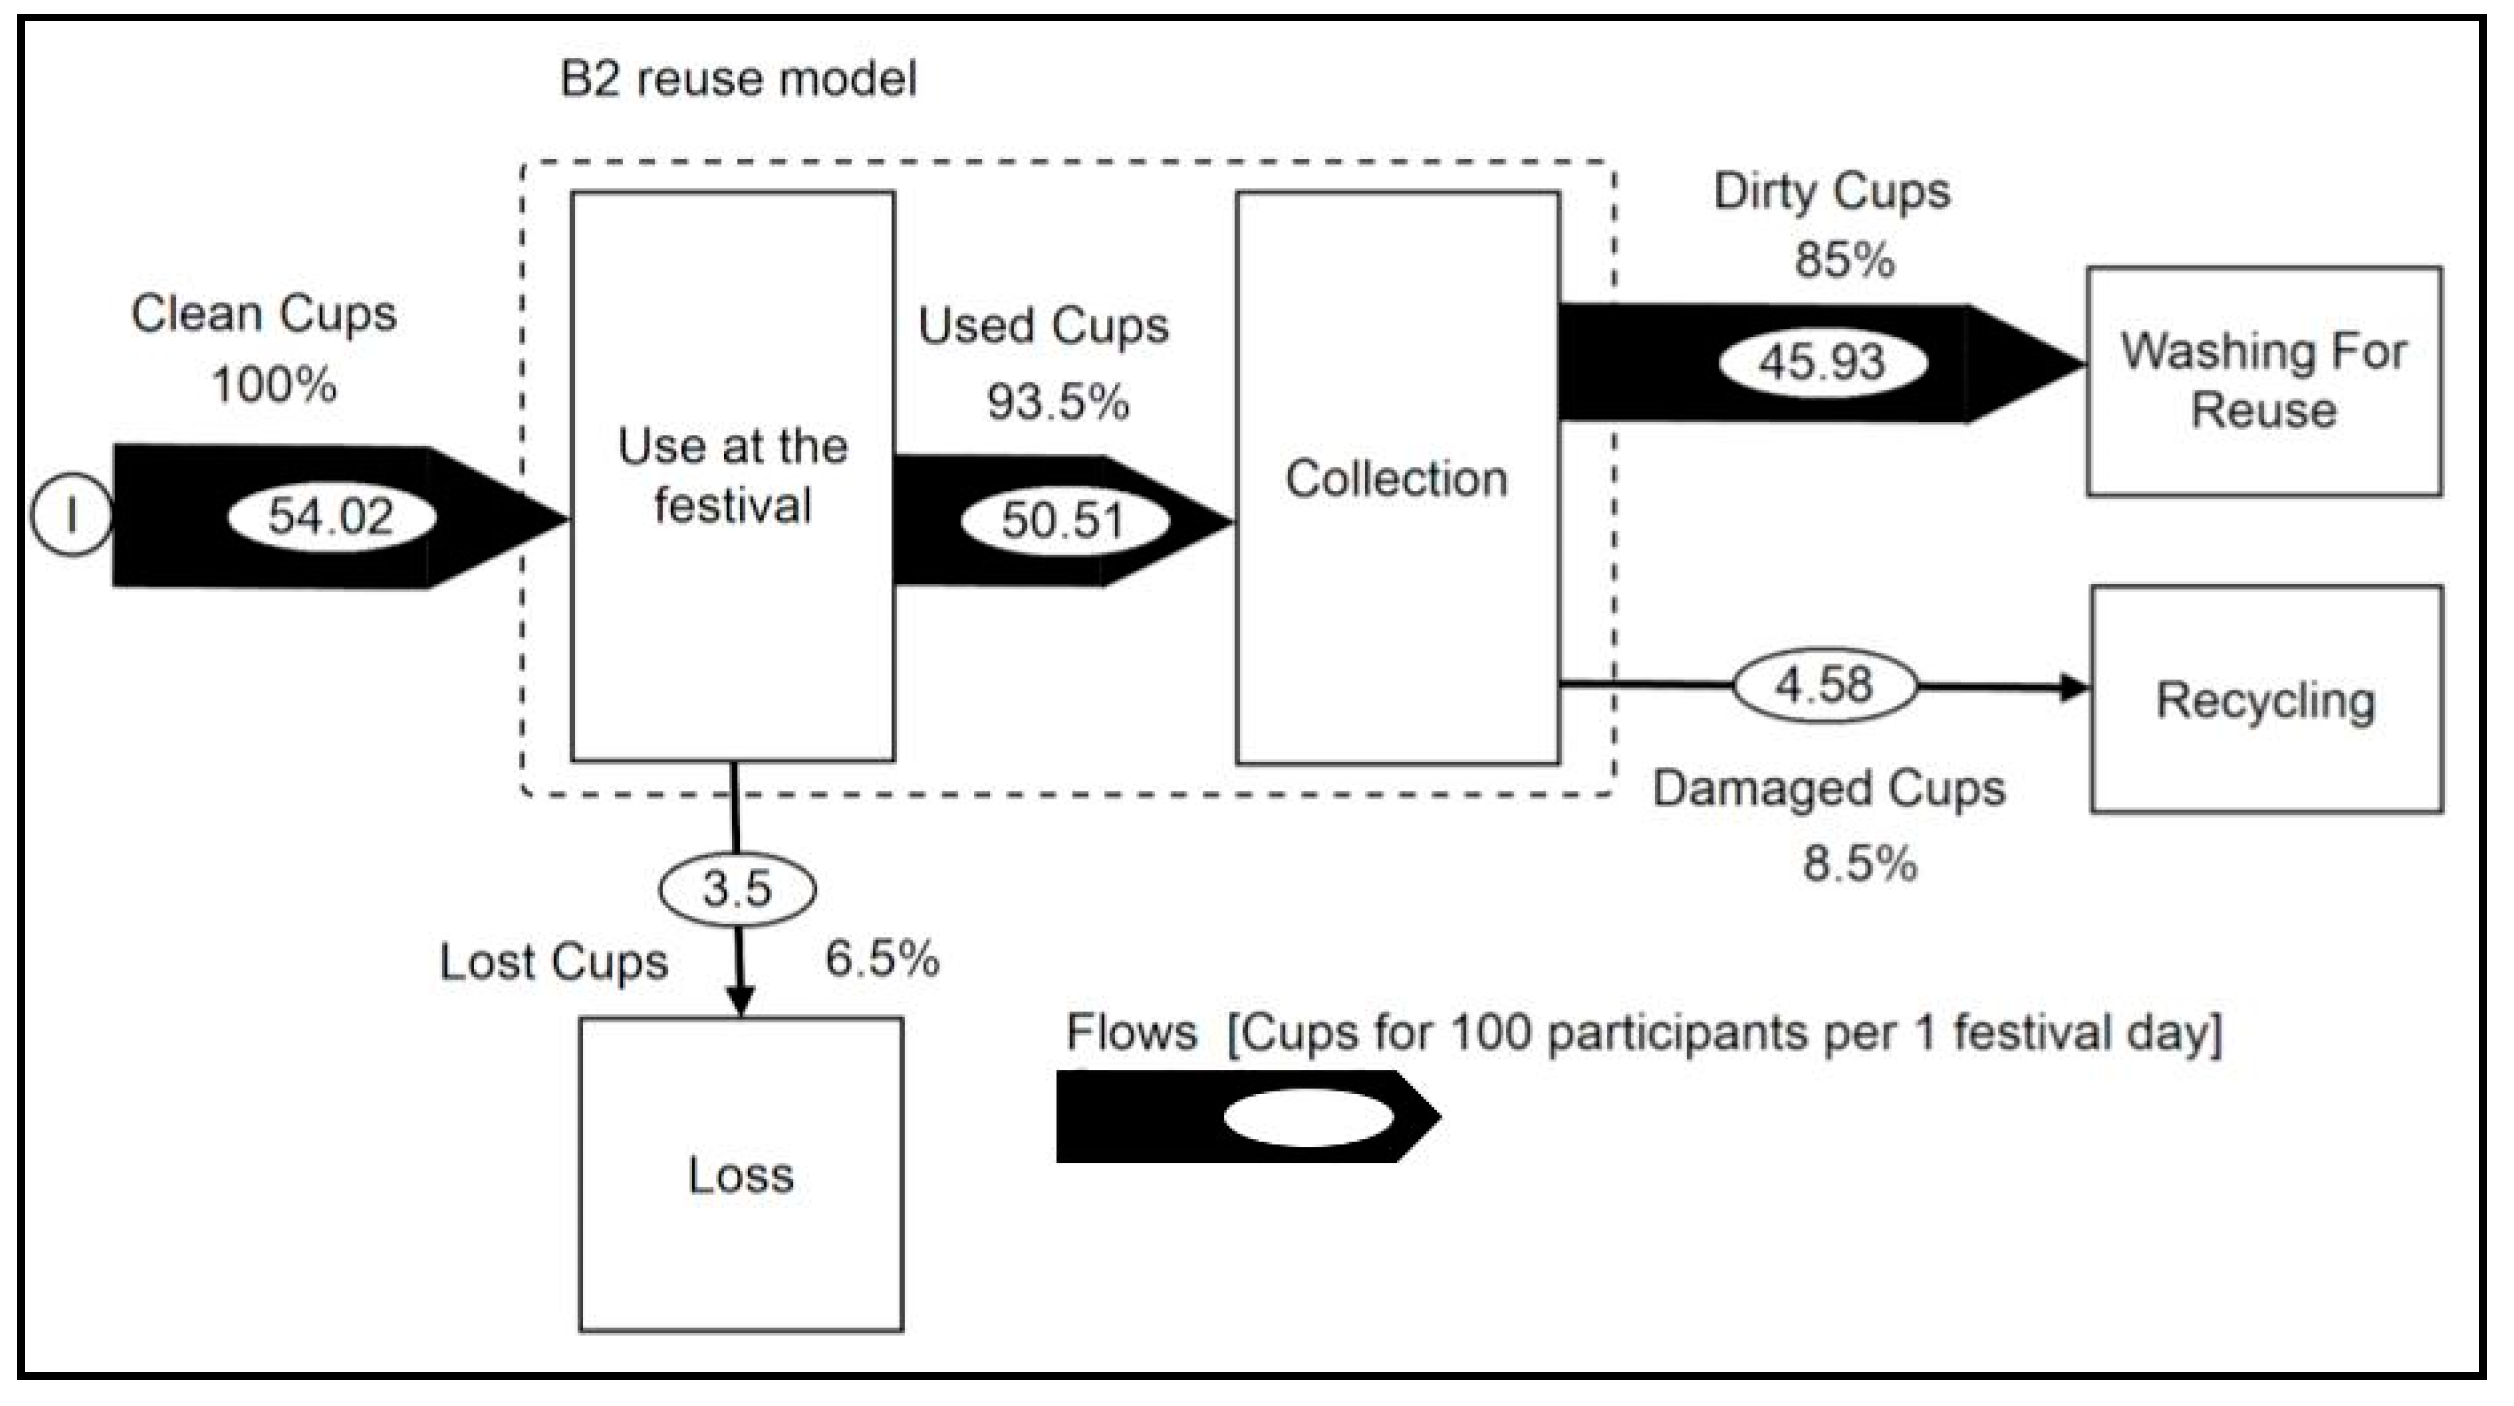
Reuse model B2 was partly refundable. Participants paid a refundable deposit, and half of the sum was refunded when the cup was returned without damage. This type of refund model is as effective as the fully refundable type of event. However, it is hard to apply this model for every event, especially for one-day events or city markets, where people are visiting episodically. It is also hard to apply when there are no defined boundaries of the event. In that case, the movement of people is chaotic, and the time spent at the event is relatively short—from 30 min to one day. This presumes that an extra fee for cup service would be an undesirable investment for the participant. In this case, event organizers would have to cover cup service fees, so the B1 refund model would have to be applied. Reuse model B2 was applied for three festivals, so this model was used for data verification. The average total loss of reusable cups in this model was 15% (see
Figure 6).
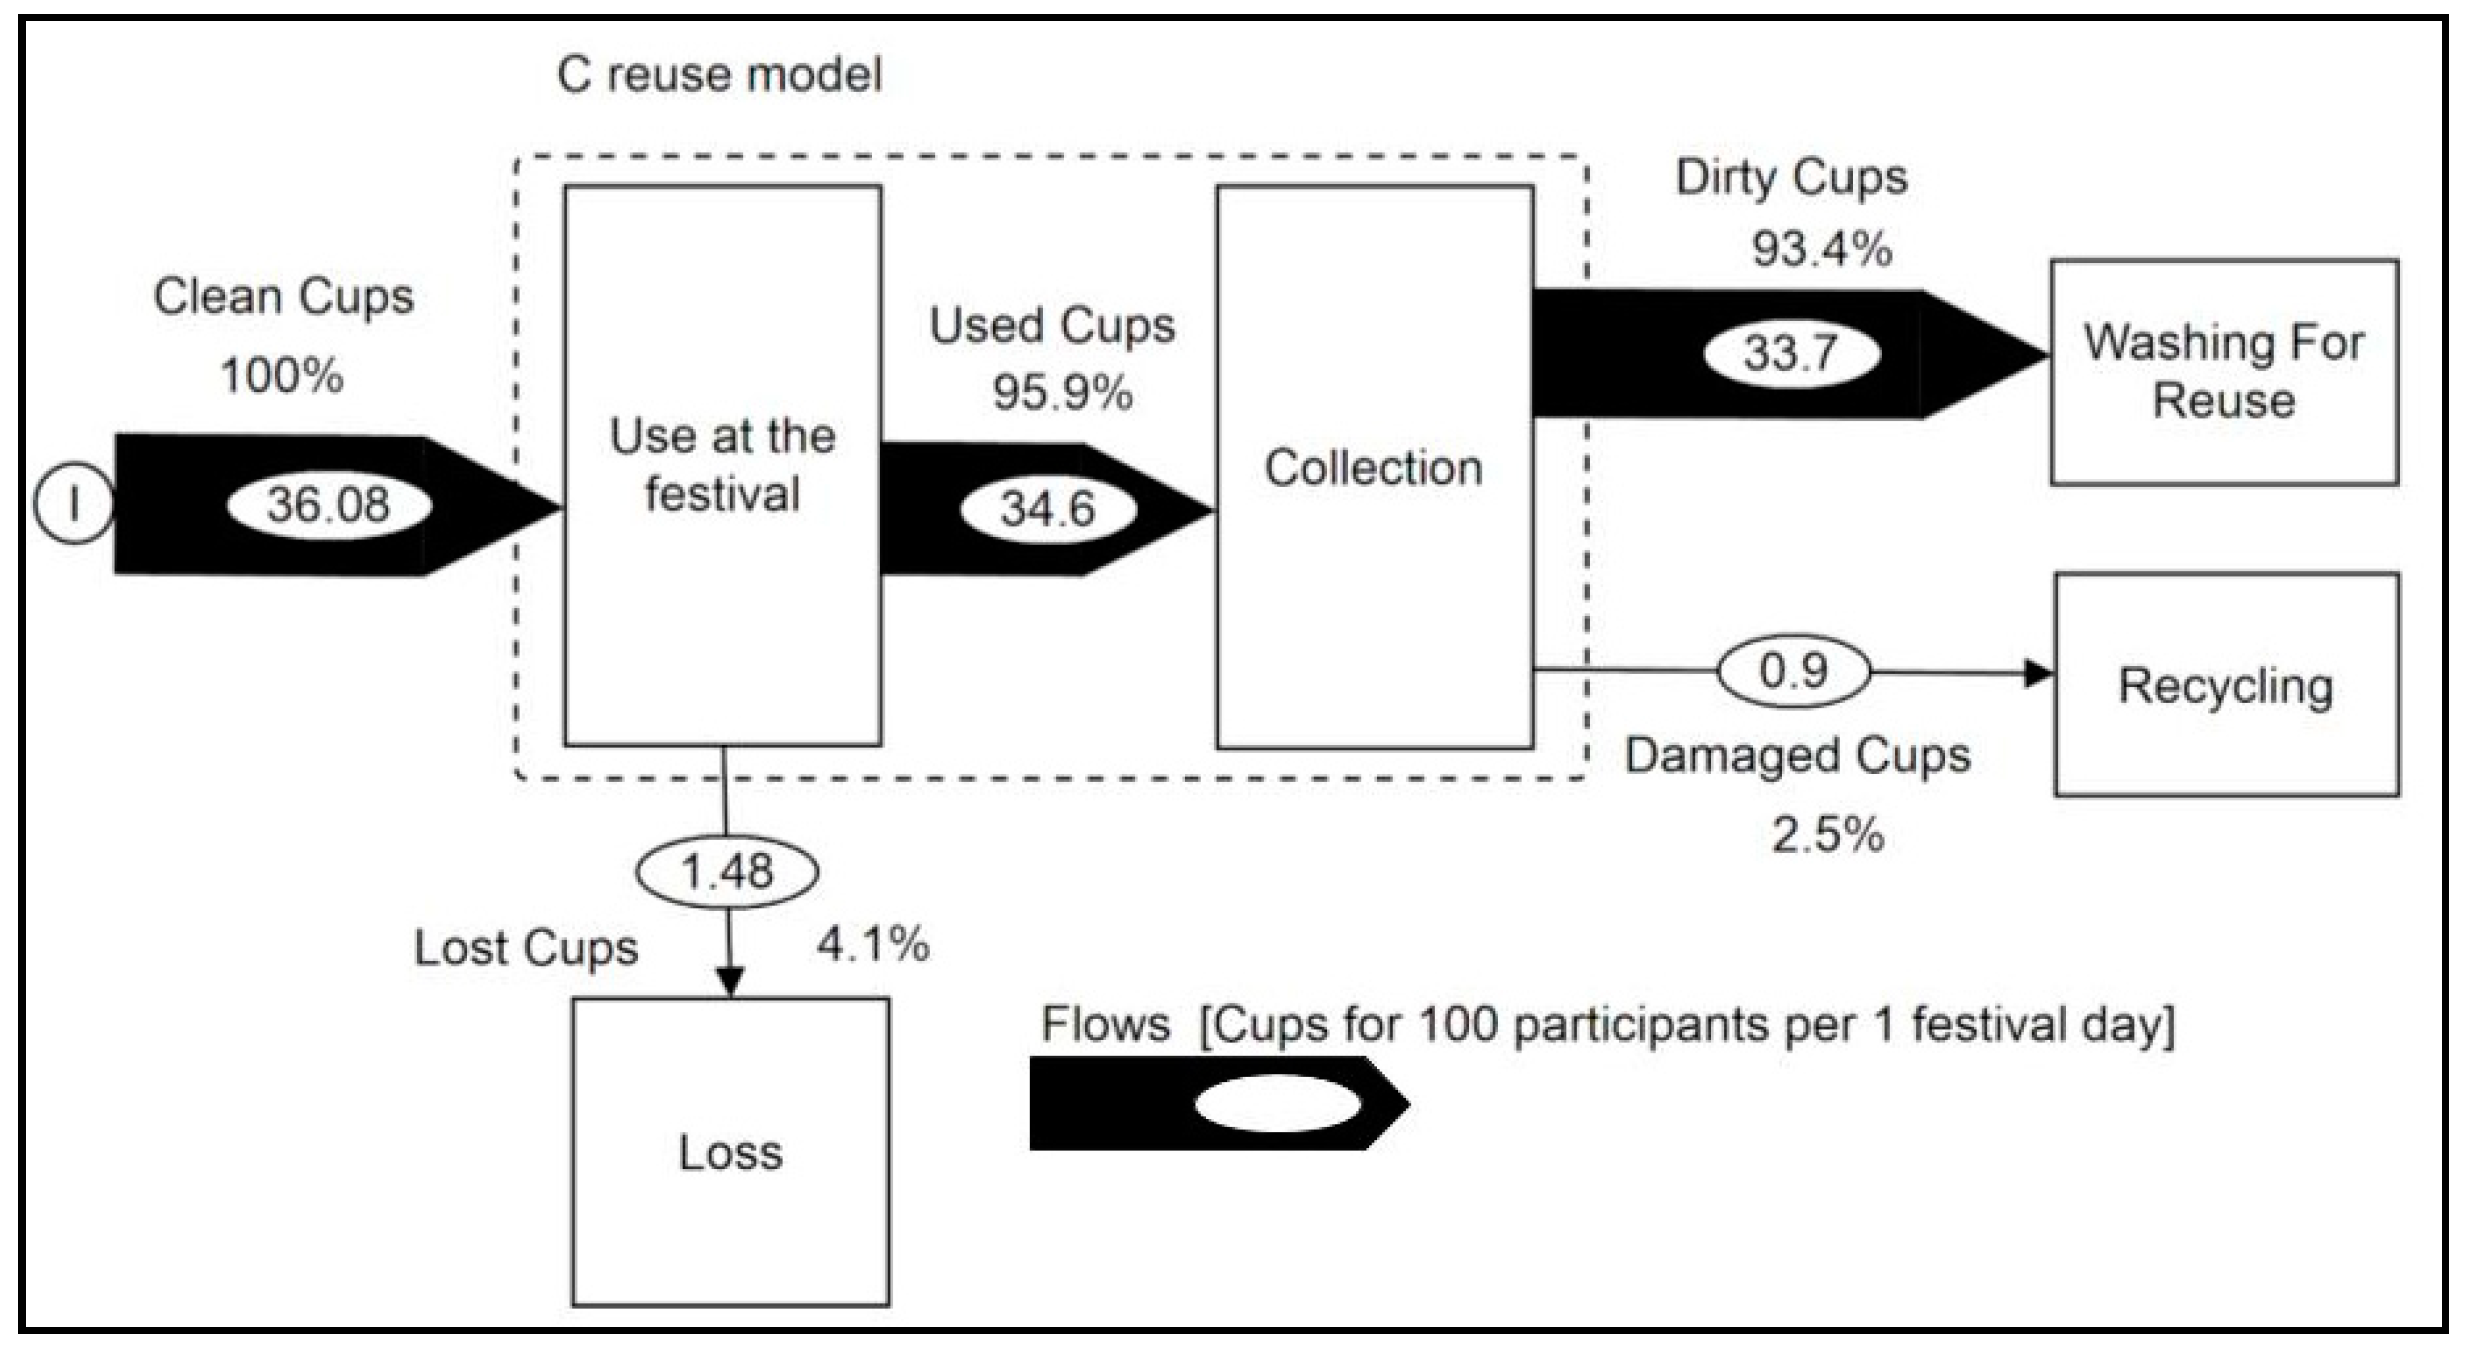
Reuse model C was partly refundable, as was reuse model B2. The only difference among these two models was that the B2 model had only a reusable solution for the participants, while the C model had both single-use and reusable choices. In this type of festival, participants were allowed to choose between single-use and reusable systems, so this model was chosen only by conscientious and motivated participants who felt responsible for the environment. For this reuse model, communication was a key success factor to reach more participants and increase the reuse rate. From 6000 participants, 2000 participants chose the reusable “CupCup” alternative, which accounts for one third of the total festival attendees. This reuse model had a relatively low total damage rate—2.5%, and total loss of reusable cups in this model was 6.6% (see
Figure 7), which is associated with the consciousness and motivation of people who chose this alternative.
3.1.2. Cup Loss, Damage, and Return
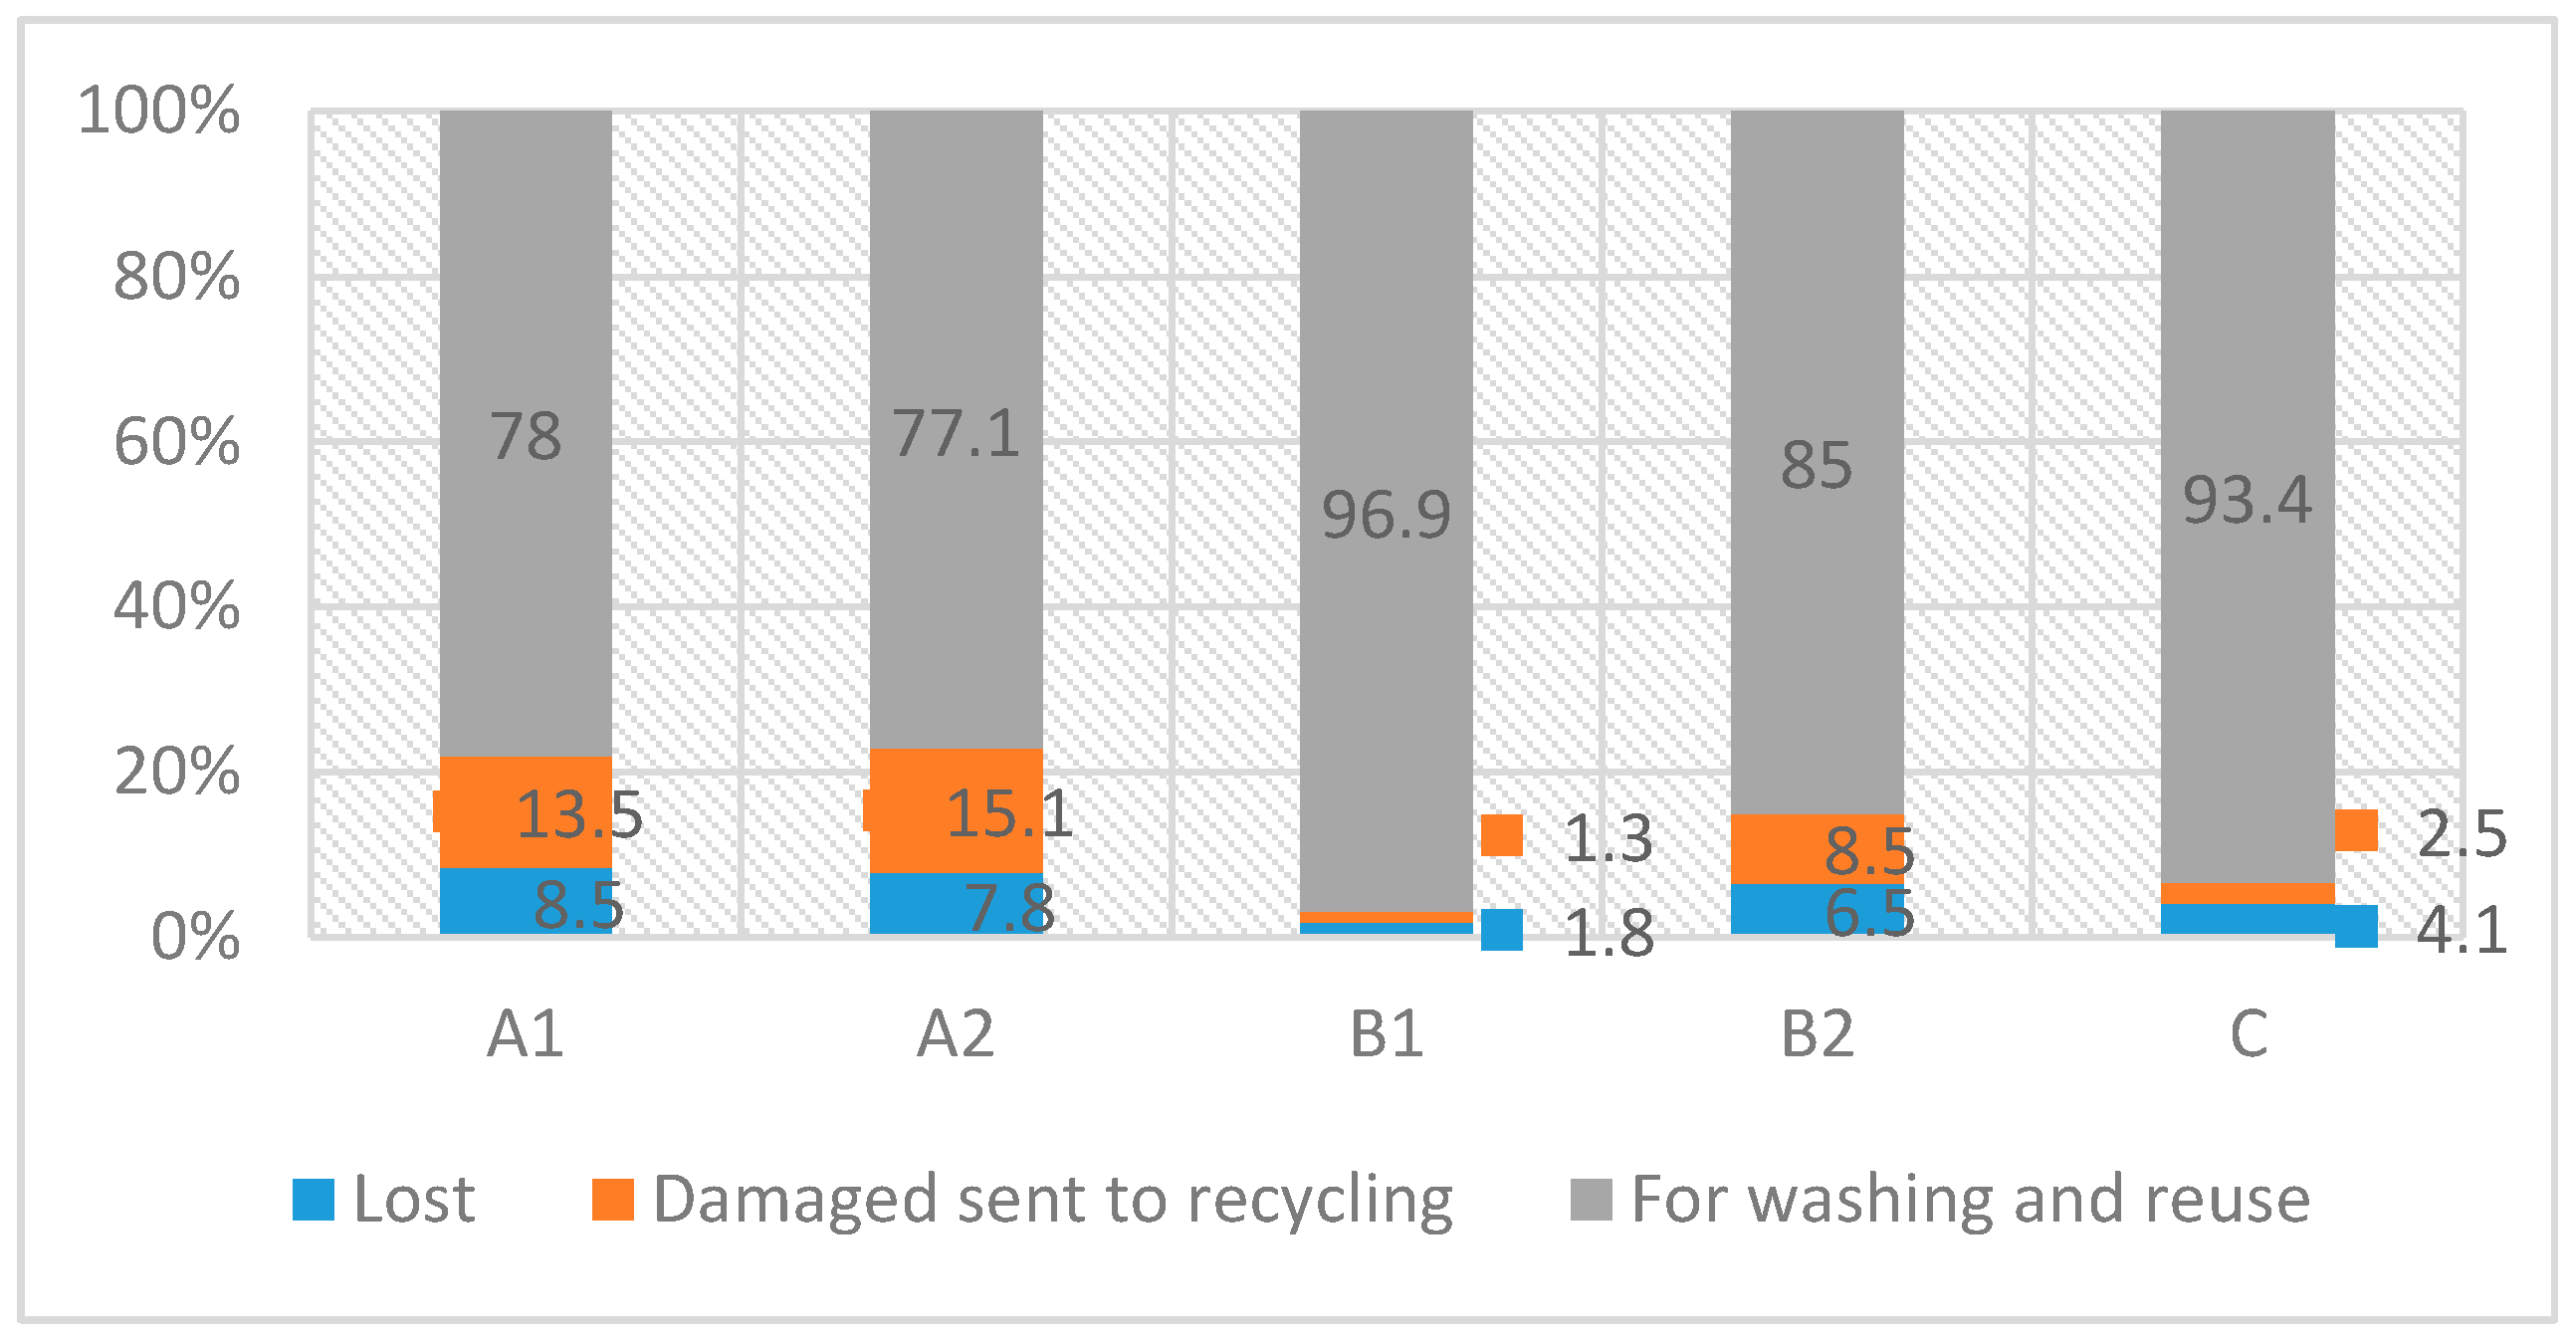
Taken as a whole for all festivals, the total loss (damaged and lost) of reusable cups was 13.92%, of which 8.18% were damaged and sent to recycling, and 5.74% were lost (not returned) (see
Figure 8). Deposit-refund models (B, C) had lower rates of damaged and lost cups compared to the model when no refund scheme was applied (A) (see
Figure 1 and
Figure 8). The lowest loss rate was observed in reuse model B1, which was explained by a good combination of economic incentives (fully refundable deposit), governmental support for the reusable solutions in the festival, and good communication strategy. Reuse model C had the second lowest loss rate in comparison with other models, which is explained by the fact that the choice to take a reusable cup was a deliberate action by motivated participants, and a clear message about the reuse model was delivered to the festival participants before the event.
Cup loss depends on several factors. An important influence on the results is the number of cups that are taken home [
20]. The UK music festival “Shambala” chose to brand 15% of cups, to balance the desire for souvenirs whilst maximizing the reuse to realize environmental benefits [
21]. Given the fact that “CupCup” reusable cups had no branding or festival attributes, it did not perform as a souvenir for the participants. Customers’ behavior and cooperation level can have a significant impact on the economics of reusable packaging, and are an optimal strategy choice [
18]. Reusable packaging damage mainly depends on package design (material used, color, shape, surface texture, etc.), users’ behavior, communication strategy, and economic incentives. In this research, the loss of the reusable cups was considered when people took the cups home or threw them out as waste. Most of the cups were lost due to taking them home, and some of the cups lost as waste in the waste bins, especially in the not refundable reuse models (A1, A2). In this research, two types of damage were distinguished: crucial damage and aesthetic damage (see
Figure 9). Damage is crucial when the cups cannot perform their function any longer, such as when they are broken into parts or burnt with cigarettes (see
Figure 9a). Aesthetic damage occurs when cups lose visual properties like color, get scratched, bent, or have long-lasting paint or lipstick applied (see
Figure 9b). The importance of design, as well as environmental and economic feasibility are presented by Mahmoudi and Parviziomran (2020) as the key measures that have to be addressed to adopt reuse systems. According to Coelho et al. (2020), design can become a limiting factor for reusable packaging system efficiency and sustainability through certain aspects such as system convenience for the customer, material choice, and application of measures for the reduction of product damages and losses.
3.1.3. Data Verification
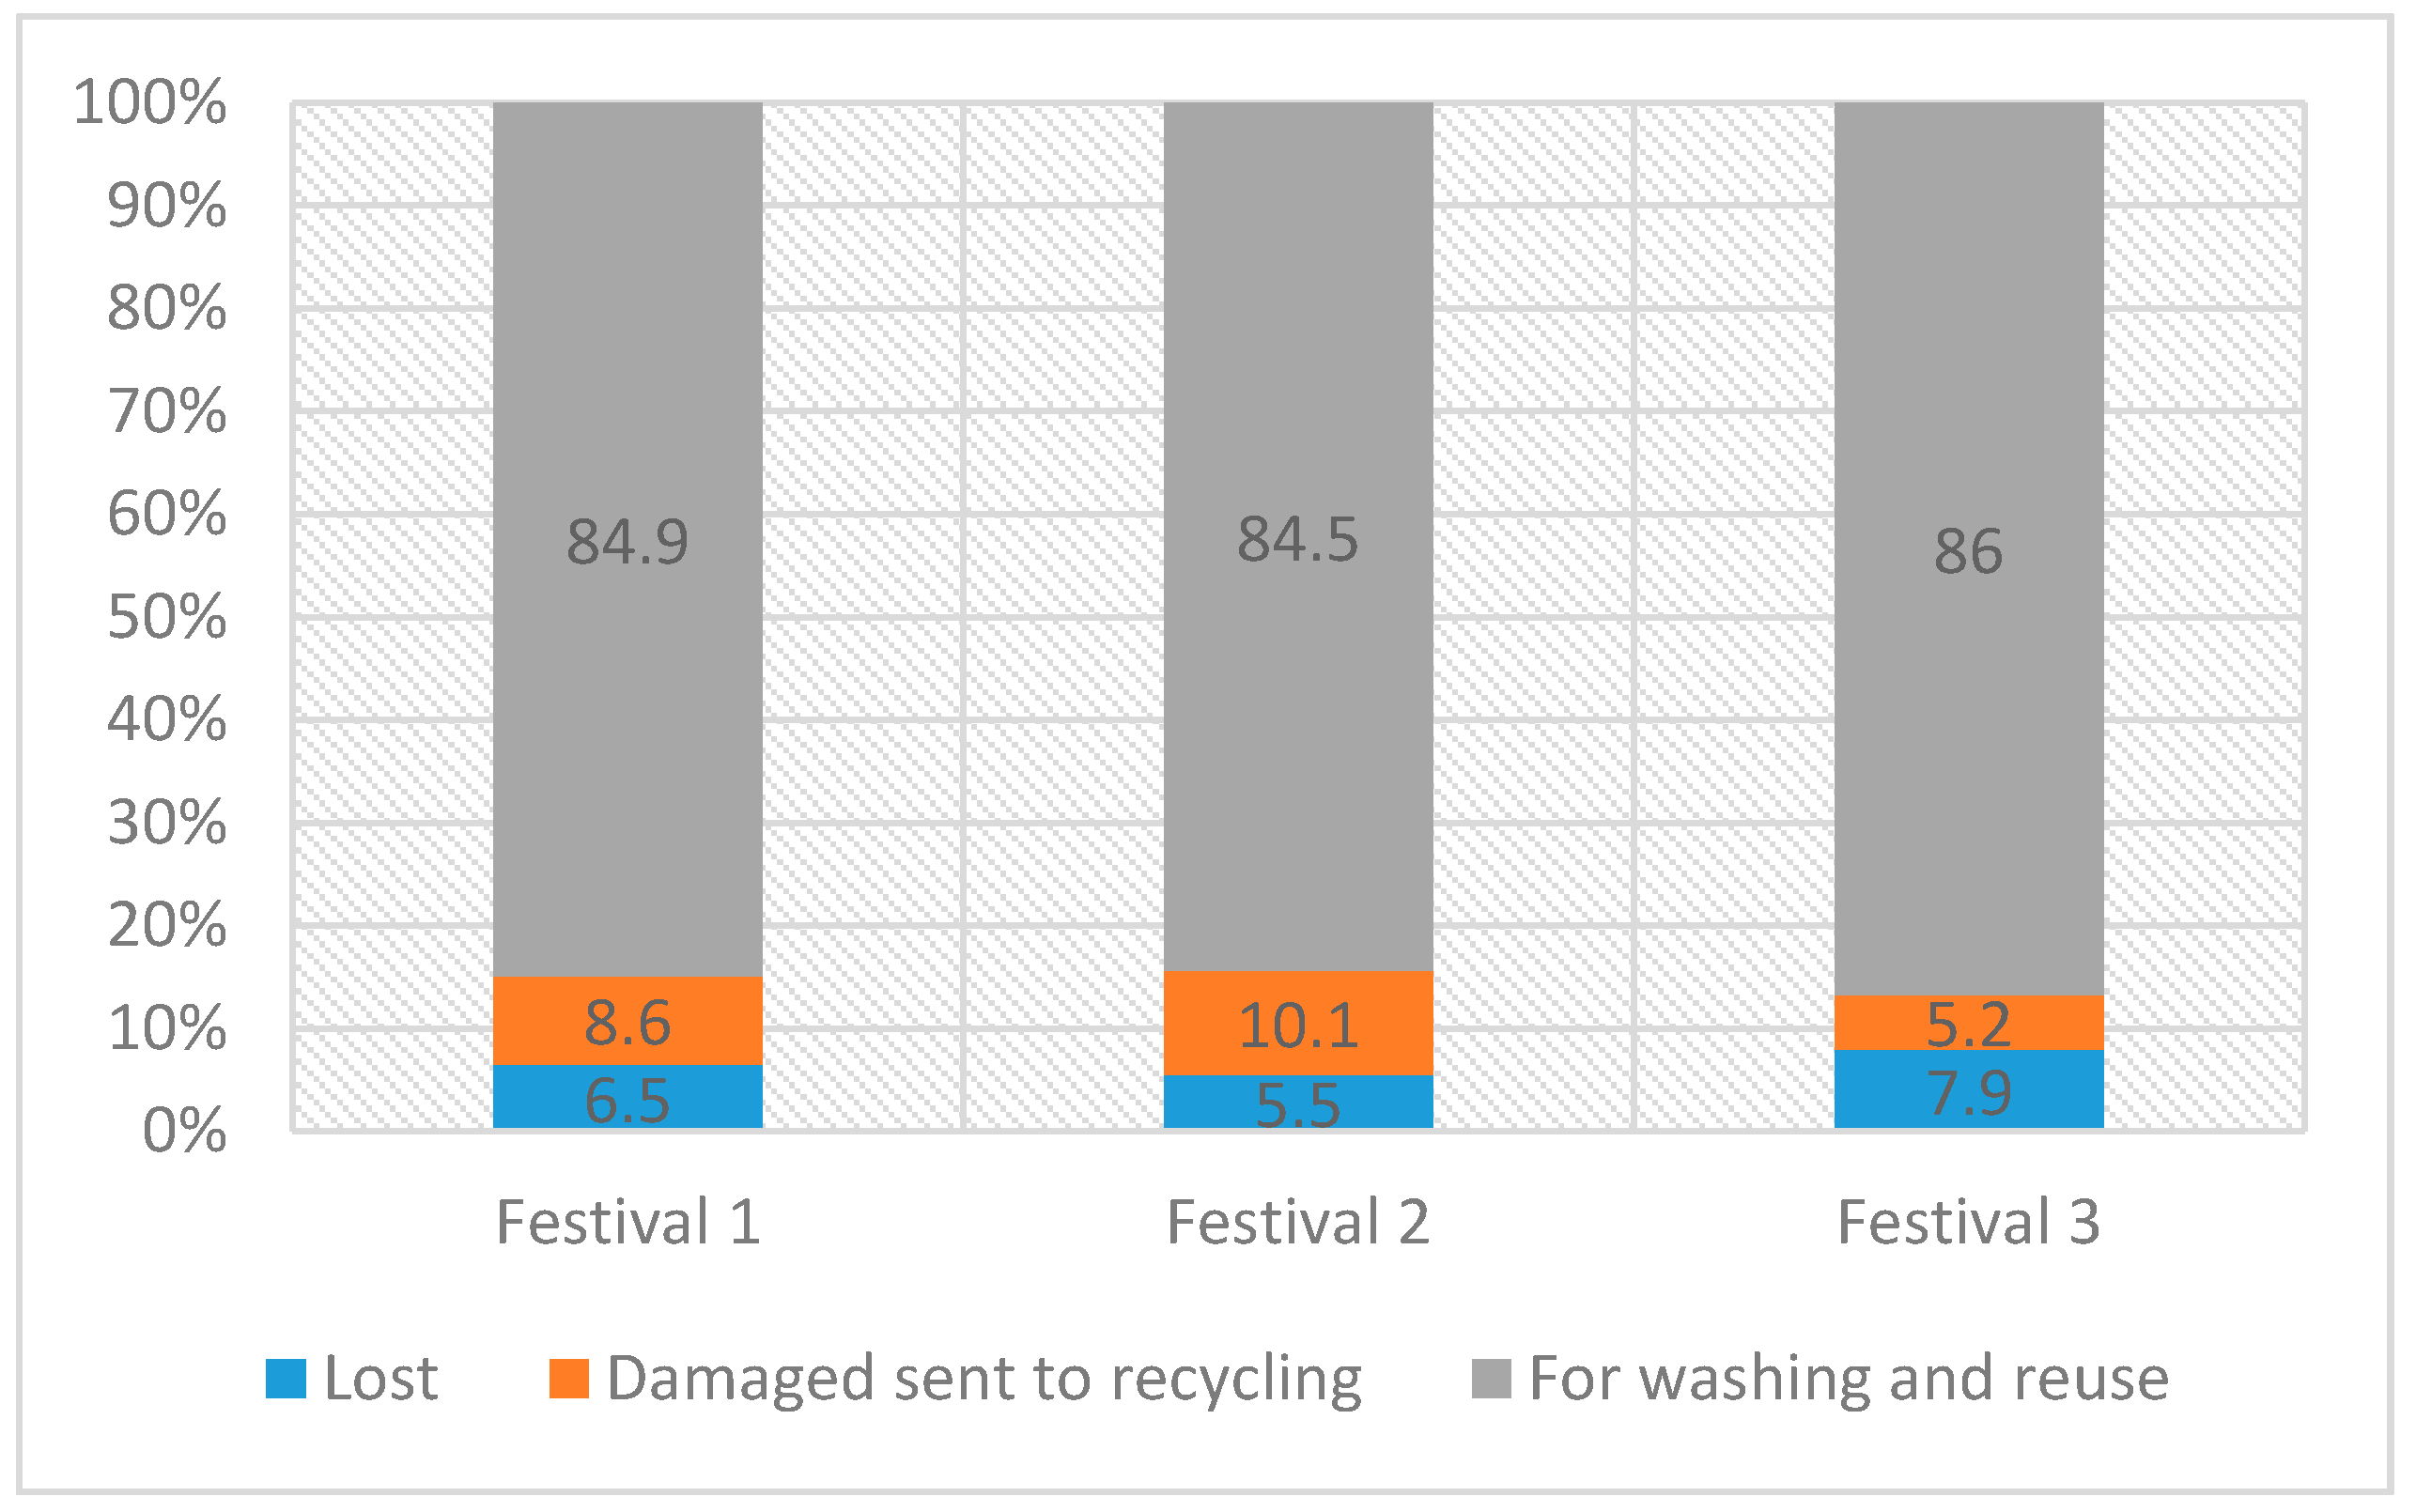
The B2 reuse model was chosen for data verification due to its application for three different events. The verification results show that there is a slight difference in cup loss, damage and return for reuse rates among the three different events where the B2 reuse model was applied, but the differences are not significant (see
Figure 10). The data show that total average loss of reusable cups (damaged and lost) for the three festivals was 14.6%, and the average return rate was 85.1%.
3.2. Single-Use Cups Avoided from the Festivals
The amount of eliminated single-use cups from the festivals was measured by multiplying reusable cups used by the average number of drinks consumed by one person per one festival day. The presumption was made that one person consumes 3.5 drinks per one festival day.
Figure 11 gives an overview of potential single-use plastic cups avoided from all seven festivals. The results revealed that the total amount of avoided single-use plastic cups from the festivals is 98,280 units. This number corresponds to 786.2 kg of polypropylene waste. Polypropylene is a dominant material for currently used single-use plastic cups for the cold beverages. It was presumed that the collection rate of single-use cups from the festivals was 99%, and used single-use plastic cups are thrown into mixed waste containers and delivered to regional mechanical biological treatment plants (MBTs) together with mixed municipal waste. Lithuania has a regional waste management system with 10 regional waste treatment centers where MBT plants are constructed. All mixed municipal waste is transported to regional MBTs, where sorting is performed in order to separate biological material, solid recovered fuel (fraction for incineration), the fraction suitable for recycling, and the fraction that is only suitable for landfilling.
The assumption was made that 69% of single-use plastic cups delivered to MBTs are incinerated together with the combustible waste fraction due to impurities or poor quality. This makes up 537 kg of polypropylene waste, and 30% (241.3 kg) of such plastic waste could be recycled to other products (see
Figure 11). The assumption was made based on general statistical information on plastic waste recycling rates that only 30% of plastic packaging is being recycled [
9,
10]. Packaging waste is collected in two different ways: together with mixed municipal waste (when no sorting is applied); and together with secondary waste (using packaging sorting infrastructure). In the festivals and events, no sorting was performed or only so-called “emotional” sorting was used to demonstrate environmental awareness and responsibility, and therefore, packaging waste such as single-use plastic beverage cups enter mixed municipal waste bins.
Secondary waste that is sorted and collected separately as a part of the EPR (extended producers’ responsibility) scheme, is delivered straight to specialized waste sorting centers without entering MBTs. Another assumption was made that 1% of single-use plastic cups are being lost in the environment, and this percentage depends mainly on cleanup quality of the festival area, and participants’ behavior.
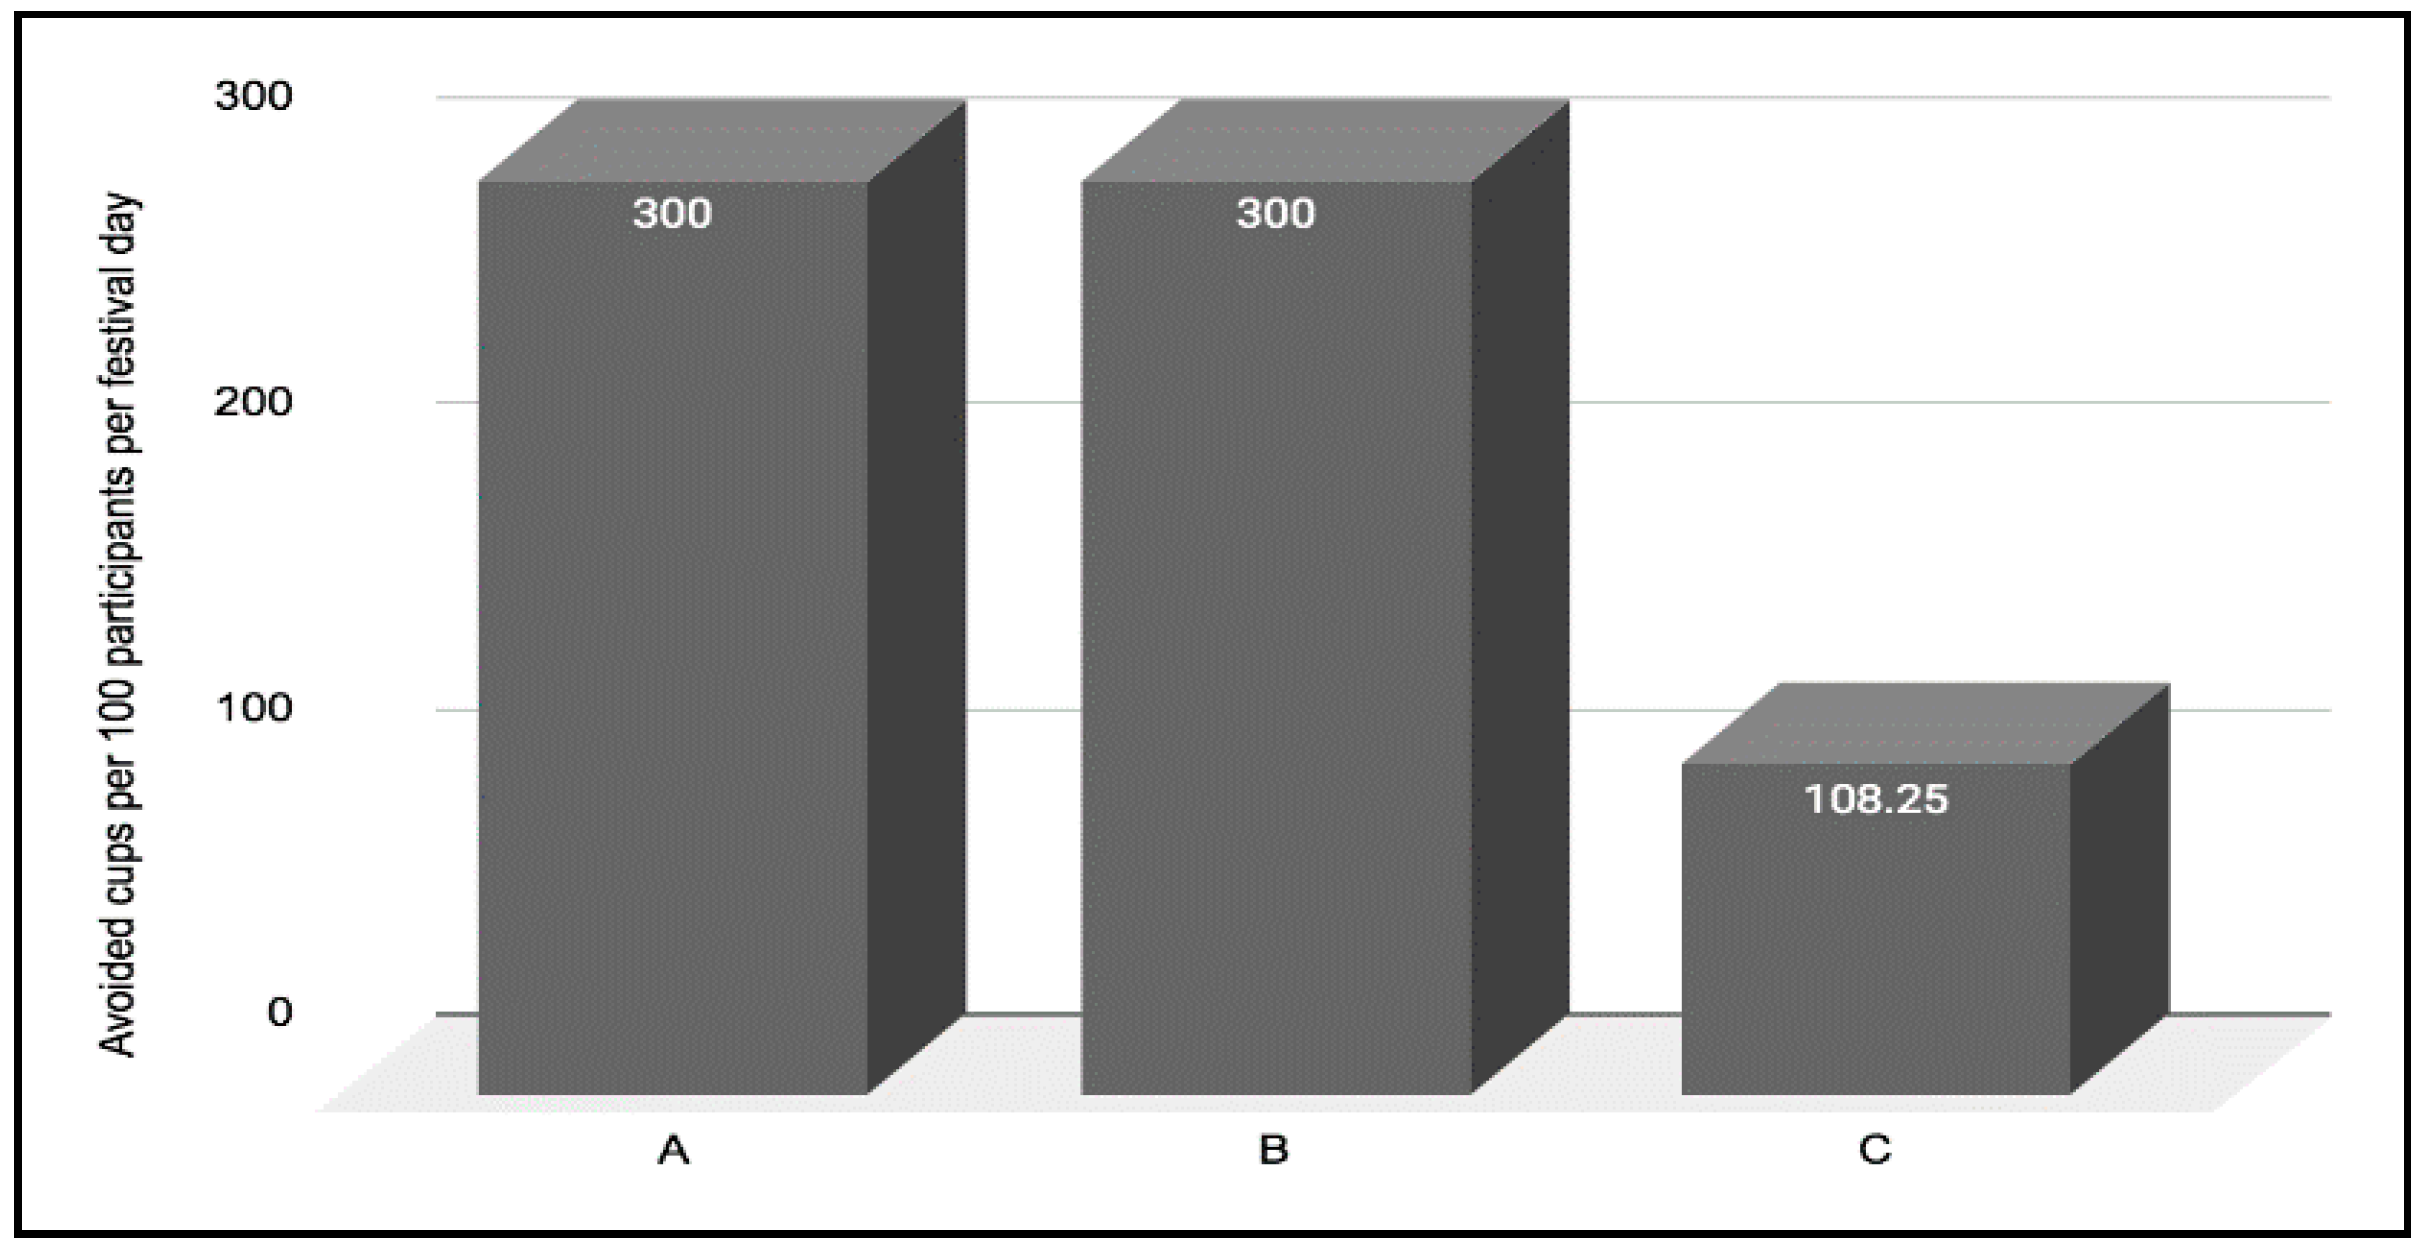
The findings indicated that 300 cups per 100 participants per one festival day were being avoided in the case of models with the use of reusable cups only (models A, and B); while a mixed reuse model with the usage of both reusable and single-use cups resulted in an avoidance of 108.25 cups per 100 participants per one festival day (model C) (see
Figure 12). The numbers show that fully reusable reuse models like models A and B have higher single-use cup elimination potential than any other mixed systems where both reusable, and single-use options are provided for the customers. Only fully reusable reuse models can achieve material circulation and material savings at a higher rate.
3.3. Material Circularity Indicator Results
The results revealed that single-use polypropylene cups with the current waste treatment scenario, where 99% of single-use cups were being collected and treated by recycling or incineration processes, had lower Material Circularity Indicator values compared to reusable cup reuse models. All three reuse models were summarized into one comparable reuse model.
3.3.1. Virgin Feedstock
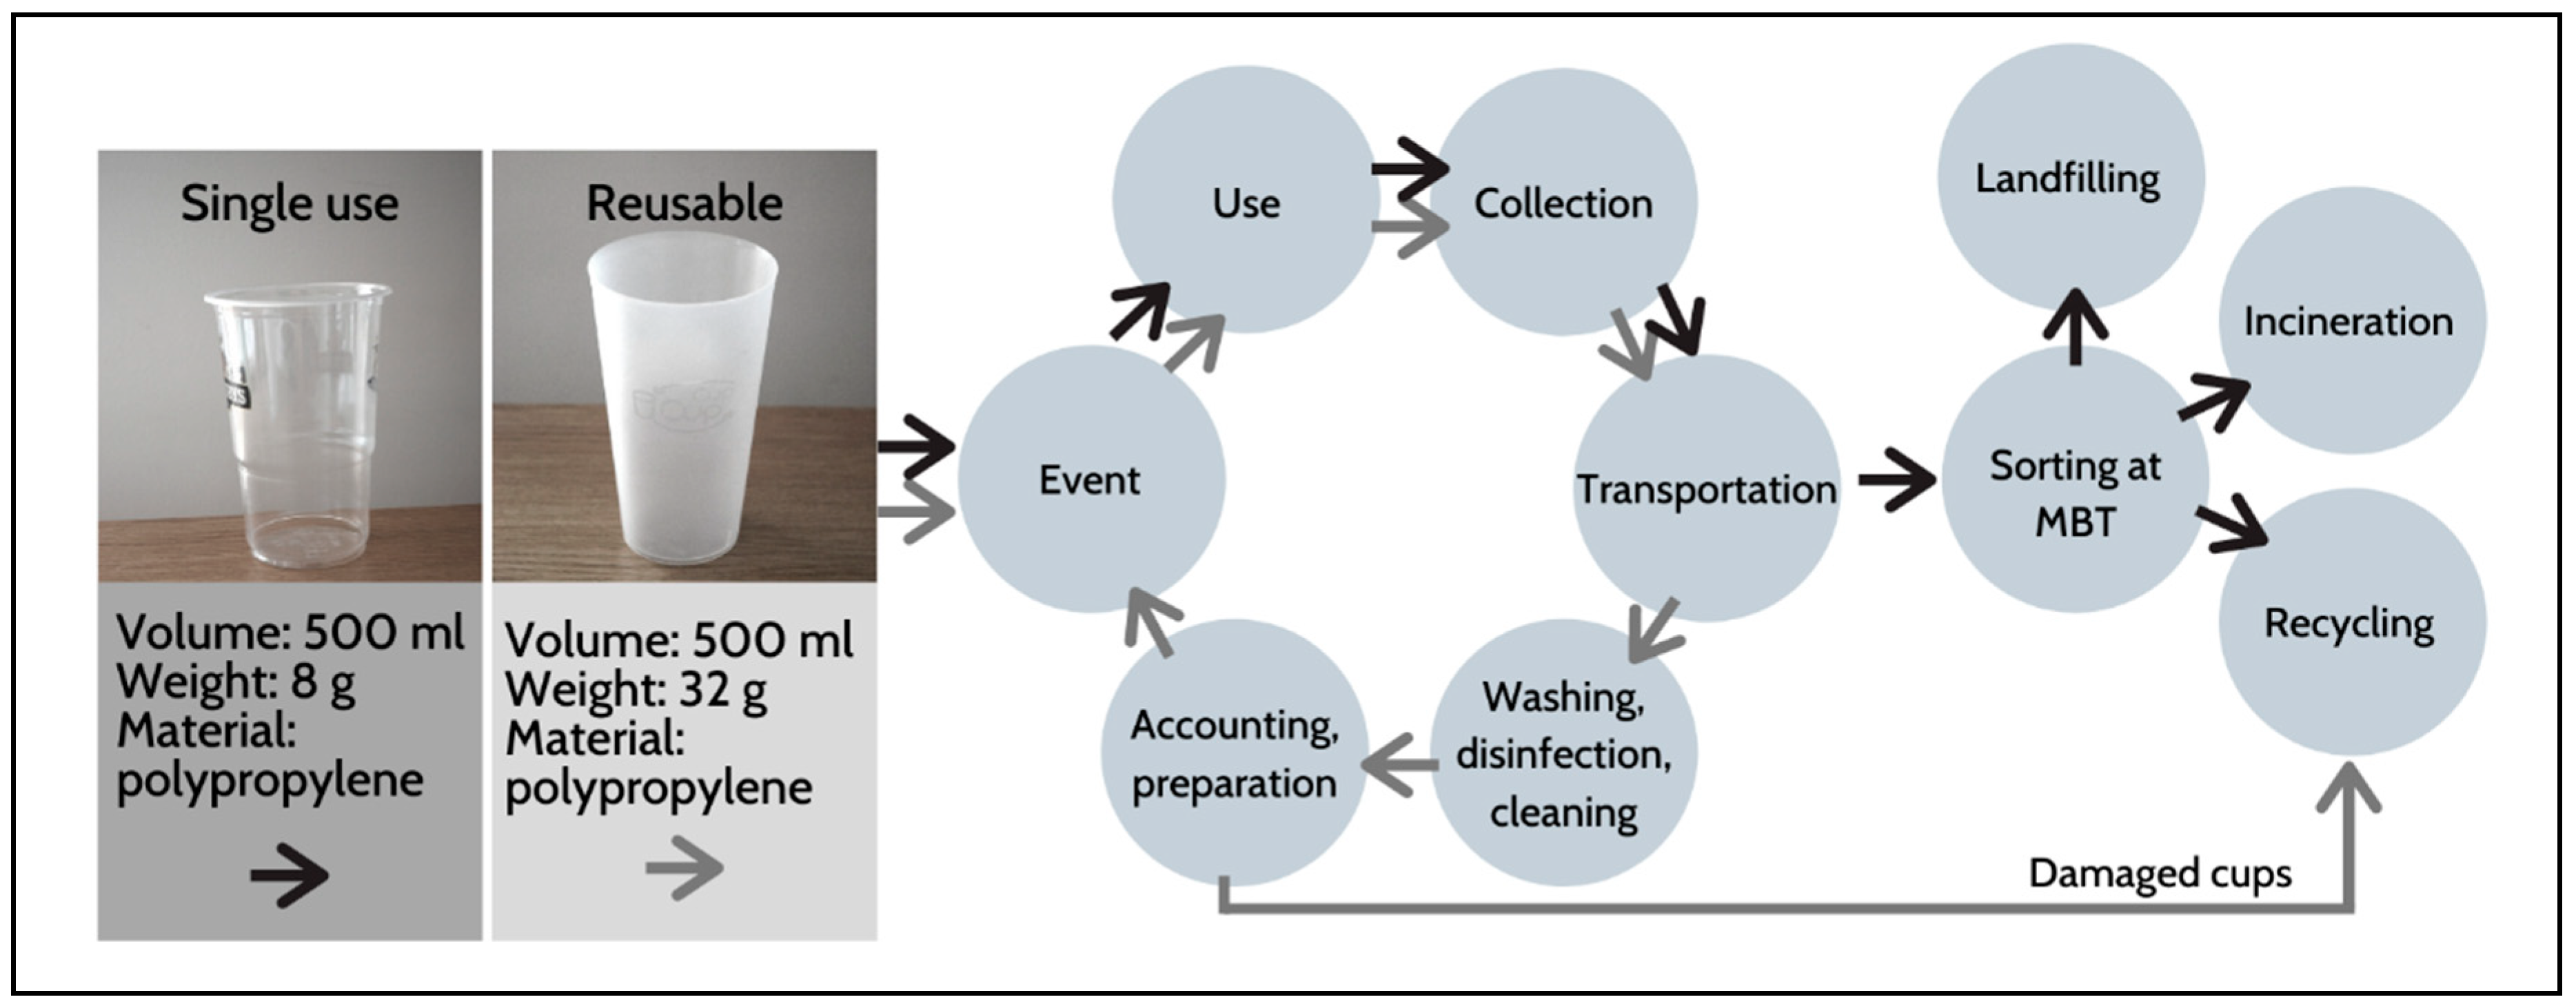
The mass of virgin material (V) was calculated according to Equation (3). The mass (M) of single-use cups is 8 g, while a reusable cup weights 32 g. Both single-use, and reusable cups are produced from 100% virgin source polypropylene, and no recycled content is used for both products (FR = 0). The reusable cup reuse rate is 93% (FU = 0.93), while the single-use cup reuse rate is 0% (FU = 0). The mass of virgin material is therefore: V (reusable cup) = 2.24 g; V (single-use cup) = 8 g.
3.3.2. Unrecoverable Waste
The mass of unrecoverable waste (W) was calculated according to Equation (4). It is assumed that 100% of damaged reusable cups are being recycled (C
R = 1), and 30% of disposed single-use cups are being recycled (C
R = 0.3). The assumption of disposable single-use plastic cup recycling rate (30%) was made according to the currently available statistical data [
9,
10]. There is no accurate and reliable statistical information on how many single-use plastic packaging is being collected and recycled from festivals and events. A disposable cup recycling rate of 30% was chosen according to some data provided in the Introduction [
9,
10]. The recycling efficiency rate for polypropylene is assumed to be 99%. The recycling efficiency rate for single-use and reusable cups is E
C = E
F = 0.99. The amount of waste generated at the time of collection is: W
0 (reusable cup) = 0.32; W
0 (single-use cup) = 0.08. The quantity of waste generated in recycling process is: W
C (reusable cup) = 0.2976; W
C (single-use cup) = 0.024. The waste generated to produce the recycled content (W
F) is zero. The total amount of unrecoverable waste is: W (reusable cup) = 0.4688; W (single-use cup) = 0.092.
3.3.3. Linear Flow Index (LFI)
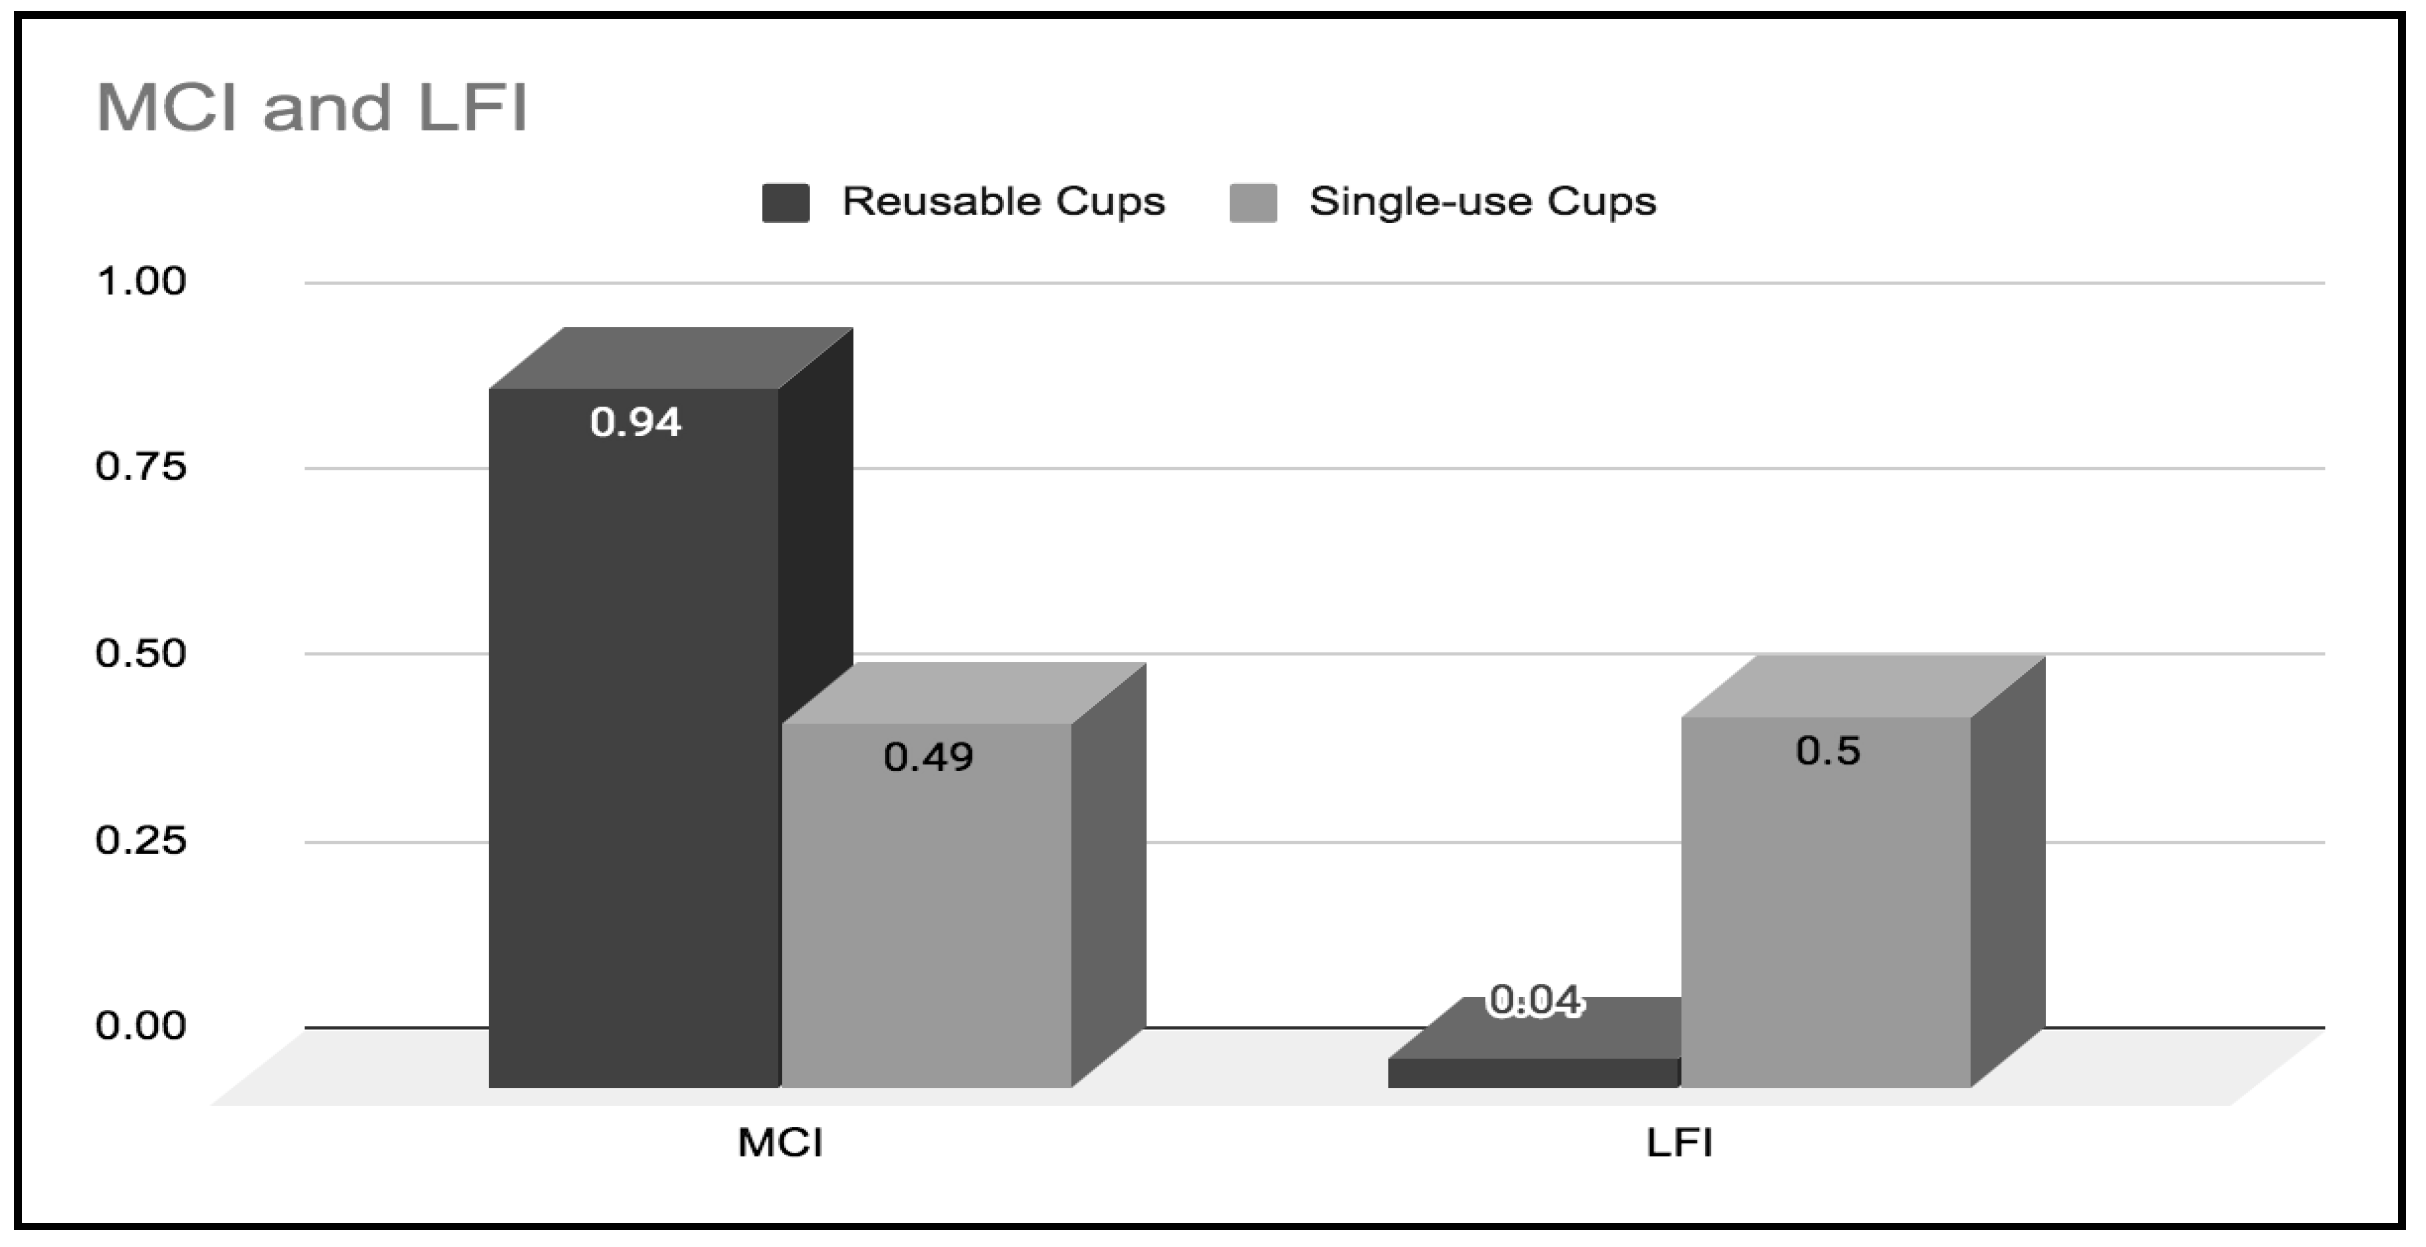
The LFI was measured according to Equation (2). Linear flow indices for reusable and single-use cups are: LFI (reusable cup) = 0.0423; LFI (single-use cup) = 0.5057. The results show that the reusable cup linear flow index (LFI) is lower than the single-use cup value, which indicates higher reusability and recyclability of reusable cups.
3.3.4. Utility
The utility X was calculated by Equation (5). Average reusable cups were used 105 times (L), Lav was around 107 times, U = 1, Uav = 1; average single-use cups are used 1 time (L), Lav is 1 time, U = 1, Uav = 1. The utility X of both reusable and single-use cups are as follows: X (reusable cup) = 0.83; X (single-use cup) = 1.
3.3.5. Material Circularity Indicator (MCI)
The MCI was calculated according to Equation (1). The MCI of reusable polypropylene cups was 0.94 and the single-use polypropylene cup MCI was 0.49 (see
Figure 13). The calculations show that PP cup reuse has higher MCI than single-use PP cup recycling with 99% collection rate and 30% of recycling rate.
3.4. Overview and Discussion
Each festival differed in size, time, location, type of drinks served (canned drinks, cocktails, tap drinks), as well as social aspects like average age, education, and dominant social class of attendees. Additionally, all events were affected by some unpredictable circumstances like weather conditions. All of these circumstances can influence the number of cups used, lost, damaged, and returned. Consumers’ motivation and awareness are key elements that have a significant impact on the circularity of the packaging.
Waste management at the event or festival is an important factor that determines the overall impact on the environment. It is known that in Lithuania each festival and event is based on linear waste management models. Only a small portion of the events take responsibility and collect waste separately into recycling bins. Sorting is mostly performed due to emotional reasons, and the efficiency of it is questionable. Lithuania has a single-use beverage packaging deposit refund scheme which helps to manage the waste at festivals and reduce the amount of waste. The rest of the waste from take-away food packaging and single-use beverage cups is being thrown away as regular mixed waste. There is a trend in Lithuania to refuse single-use plastic packaging in municipal events and exchange them for the commonly used alternatives—single-use paper-based cups with polyethylene lining as a barrier or bio-based single-use alternatives like paper cups with bioplastic lining or single-use beverage cups from bioplastics, usually from polylactic acid (PLA). These commercially popular biodegradable alternatives require industrial composting equipment which is not available in the Lithuanian market. Thus, this type of single-use paper-based packaging cannot be recycled in Lithuania due to the barrier lining. Most of these single-use plastic alternatives become additional waste and go to MBT plants with the regular mixed waste stream.
Another challenging single-use packaging waste management aspect at the festivals and outdoor events is attendees’ behavior, which is hard to influence and control. Sorting skills, knowledge, understanding and awareness level are personal features that have to be developed through societal change over a long period of time. Other factors like package labeling, communication, infrastructure of the recycling stations or sorting bins are also recognized as key aspects to ensure good quality of recovered packaging material and high collection rates.
On the other hand, there is no clear comparative data for how festivals manage their single-use items, and how many of the single-use packages are being recycled. Moreover, a lack of disposable beverage cup waste treatment methods is another issue that needs further study.
Taking into account reusable cup losses, it was noticed that losses depend on several factors and is mainly associated with people taking cups home as souvenirs. Branding of cups can reduce the overall reuse rate and increase environmental impact. Reusable packaging damage mainly depends on package design (material used, color, shape, surface texture, etc.), users’ behavior, communication strategy, and economic incentives (
Section 3.1.2).
The results are summarized in
Table 2.
4. Conclusions
A study of different models of reusable cup services used during open-air summer festivals to avoid disposable plastic entering the environment demonstrated the difference in achieving results when different models are applied. The three models applied and their two variations reveal the deposit being an important incentive to return more cups while fewer cups are lost or damaged. Still, even in the absence of a deposit, 77.2–78% of the cups were destined for washing and could be reused. The biggest share of cups was returned for reuse under the fully refundable deposit system, almost 97%. Still, such a model has the feature that the costs of providing the service have to be covered by the festival organizers, which is not always possible. With the return of the deposit partially, the problem of financing the service is eliminated and the achieved percentage of reuse of the cups is 85%. A very large proportion of the cups, 93.4%, were returned to reuse when applying the model where festival participants were able to choose between reusable and disposable cups. Still, the overall result of such a model to avoid disposable plastic use is questionable, as only the most conscientious participants chose reusable cups, while others stayed with disposable ones.
There is a lack of studies and information about reusable cup damage and losses during the events, therefore, it is important to compare the study data, and evaluate the efficiency of reusable cup reuse models. The case studies showed that success of the event reuse rate mainly depends on reuse model and communication with festival participants. The research revealed that economic measures have a positive impact on the return rates and preservation of reusable packaging led to higher return rates, and lower damage rates (B, C models). There is a need for a deeper understanding of single-use polypropylene (PP) cup recycling and waste treatment technologies along with methods in the Baltic states region in order to compare single-use and reusable cup systems more precisely. Material and product circularity measurement metrics need development and adaptation to packaging materials and systems. Additionally, it would be useful to include circularity measurements in life cycle assessment metrics. However, in order to assess the full situation and compare reusable models with single-use options, environmental life cycle assessment (LCA) could be used. In addition to LCA, LCC (life cycle costing) may be performed to assess the economic sustainability of reusable cup models vs. single-use cups models.


