Abstract
This study quantified the improvement in energy efficiency following passive renovation of the thermal envelope in highly inefficient residential complexes on the outskirts of the city of Madrid. A case study was conducted of a single-family terrace housing, representative of the smallest size subsidized dwellings built in Spain for workers in the nineteen fifties and sixties. Two units of similar characteristics, one in its original state and the other renovated, were analyzed in detail against their urban setting with an experimental method proposed hereunder for simplified, minimal monitoring. The dwellings were compared on the grounds of indoor environment quality parameters recorded over a period covering both winter and summer months. That information was supplemented with an analysis of the energy consumption metered. The result was a low-cost, reasonably accurate measure of the improvements gained in the renovated unit. The monitoring output data were entered in a theoretical energy efficiency model for the entire neighborhood to obtain an estimate of the potential for energy savings if the entire urban complex were renovated.
1. Introduction
EU Directive 844 requires countries to ‘establish a long-term renovation strategy to support the renovation of the national stock of residential and non-residential buildings […] into a highly energy efficient and decarbonized building stock by 2050′ with the primary goal of hastening cost-effective building renovation [1,2,3]
Each Member State shall establish a long-term renovation strategy to support the renovation of the national stock of residential and non-residential buildings, both public and private, […] facilitating the cost-effective transformation of existing buildings into nearly zero-energy buildings.(European Parliament and EU Council, 2010)
The EU’s Green Deal [4] also addresses building energy renovation as essential to reaching its decarbonization objectives, which include a clean and fair energy system for all citizens, to the exclusion of none. The ‘renovation wave’ initiative aims to optimize large-scale building renovation, furthering investment and cost-effectiveness as vectors for economic growth [5].
Spain’s long-term strategy for building sector energy renovation (Spanish initials, ERESEE; [6,7,8], the transposition to national legislation of the aforementioned directives, aims to support the energy renovation of existing buildings and the establishment of a highly energy-efficient, decarbonized building stock by 2050. In southern Europe, despite mild climate conditions, social dwellings are in discomfort and unhealthy conditions during the winter [9]. Improvements on housing construction have a positive impact on comfort and health aspects [10,11].
Based on a study of the existing stock in Spain [12,13], the ERESEE prioritizes action in buildings constructed before the 1979 entry into effect of legislation on thermal conditions in buildings [14], where energy performance is much lower than presently required [15]. Residential energy inefficiency is therefore largely attributable to building envelopes lacking the thermal insulation called for by the legislation presently in effect, as observed in studies conducted on samples of buildings in a number of Spanish cities [16,17]. As a result of the high energy demand generated, minimum comfort standards can only be met with likewise high consumption. Studies conducted in the city of Madrid [18,19,20] have confirmed that the concomitant energy vulnerability creates a risk of fuel poverty among the occupants of such units.
The building stock is, then, in urgent need of energy renovation, in which passive improvements should be prioritized. Such improvements lower building energy demand directly and while calling for substantial initial investment, can also potentially reduce energy consumption [21] and occupant vulnerability [22,23,24].
Simulation model (predictive process) assessments of the potential savings in Spain’s obsolete building stock based on energy demand calculations have identified pockets of inefficiency and opportunities for savings [25,26,27]. Those methods have proven to be useful to quantify the energy supply required to meet consumers’ basic needs and its pre- and post-renovation affordability [28]. Demand models have been shown to be useful tools for establishing the minimum energy demand necessary to define the values guaranteeing the basic right to energy [29]. Nonetheless, as far as proposals for action in specific buildings or communities are concerned, such methods entail simplifications that introduce considerable uncertainty in the estimates of possible savings [28,29,30]. The literature identifies a need to develop methods combining predictive processes with empirical measurement and verification [29,30].
One approach to lowering the uncertainty inherent in predictive models involves implementing measurement and verification methods (M + V processes) [30]. Procedures that can supplement such information with ‘bottom up’ scientific evidence based on empirical data for specific cases are needed to formulate effective policies and design realistic financial instruments [31]. The experimental monitoring of energy-renovated buildings is consequently a priority both to calibrate renovation scenarios and to determine the impact of renovation policies through objective indicators. Such data could then be replicated to support more appropriate public policies [8].
The impact of passive improvements in envelopes has been assessed experimentally by the authors with test modules in studies such as the REFAVIV project [32]. In prior research, the present authors proposed exhaustive methods for monitoring energy consumption and comfort in existing buildings [33], which served to accurately predict the improvements delivered by energy renovation. Other earlier studies included in situ measurement to determine the so-called performance gap between estimated and actual consumption, comparing a renovated dwelling to a unit in its original state [34]. Whilst such studies, which carry high monitoring costs, can be used for detailed scientific analysis of a few specific cases, general, urban-scale renovation calls for low-cost methods to monitor large caseloads with the smallest possible number of variables. Drawing from existing knowledge and to respond to the needs that would be generated with large-scale energy renovation as proposed under the ‘renovation wave’ [5], minimal, low-cost monitoring methods must be pursued, for the ultimate aim is to assess considerable numbers of buildings and propose renovation operations for whole neighborhoods in keeping with measured and verified findings.
2. Objectives
The present study was conducted to respond to the need to assess the results of incipient passive energy renovation experiences underway in Madrid, presumably to be followed by others in the near future. More specifically, it aimed to empirically and accurately quantify the actual impact of improvements in existing building envelopes. It consequently analyzed the potential for improvement in a residential complex comprising inefficient single-family homes of acknowledged architectural and heritage value.
The potential for savings in the complex as a whole was calibrated by monitoring two real-life terrace (attached) units, both presently occupied. These minimum size dwellings, known in Spain as ‘hotelitos’ and commonly found on the outskirts of Madrid, are characteristic of the so-called ‘poblados dirigidos’ or planned communities, a type of subsidized post-war housing built in Spain in the nineteen fifties. This study measured energy efficiency in two very similar terrace houses with practically the same architecture and orientation and located in separate but analogous rows in the same residential development. One stood as originally built whereas the other had been recently upgraded with external insulation and new windows.
The aims were to supplement the information on residential energy needs as calculated with theoretical demand models via experimental assessment and determine the potential for improvement by calibrating existing models. In the understanding that such calibration would involve large-scale monitoring, a minimal monitoring protocol was applied to advance toward simplified methodologies that would shed light on the actual level of thermal comfort prevailing in the residential sector and its cost in terms of energy consumption.
The protocol was designed to assess habitability and environmental comfort defined in terms of temperature, humidity, and air quality by monitoring with minimal resources. The information gathered in the two units studied was compared to the electricity and natural gas consumption metered in the same period and itemized on the respective energy bills.
3. Case Study
The housing analyzed is located in a planned community in Madrid’s Fuencarral district, one of the best conserved examples of developments constructed in the city in the nineteen fifties (Figure 1 and Figure 2). These developments were among the first in Spain to design inexpensive housing to Modernist ideals. The complex at issue, authored by José Luis Romany in 1958 and built in 1959–1960, stood as proof that the city could accommodate new, rationalist, low-cost architecture:
Romany was entrusted with the design and construction of this planned community, located adjacent to two prior developments, Fuencarral A and B, designed respectively by Francisco Javier Sáenz de Oíza and Alejandro de la Sota. The idea was to build a neighborhood with a blend of low rises and single-family terrace units.[35]
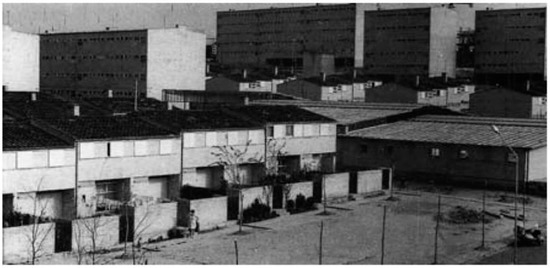
Figure 1.
Original complex (source: [35]).
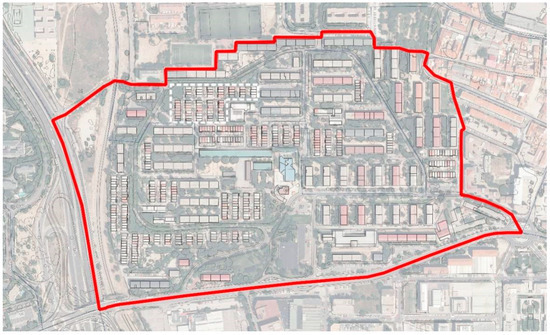
Figure 2.
Complex in its present state (delimited by the authors).
Further to that mixed development approach, the community consists of two-storey single-family homes and low-rise detached apartment buildings. The two building types specifically envisaged were two-storey terrace units with a yard and four-storey low rises. DOCOMOMO (Documentation and Conservation of Buildings, Sites and Neighborhoods of the Modernist Movement) has listed the complex as ‘the modern dwelling’ in acknowledgement of its architectural and heritage value [36].
This study analyzed the single-family units in the complex (Figure 3). The original design stretched the space available to the limit to fit a third bedroom on the upper storey. The ground storey houses the kitchen, living-dining room, and a small vestibule, whilst three bedrooms and the bathroom are located on the upper storey. The original materials, brick for the bearing walls and (uninsulated) enclosures, concrete joists for the structural ceiling/floor, and fiber-cement for the double-pitched roof, have been replaced in some of the homes in the complex.
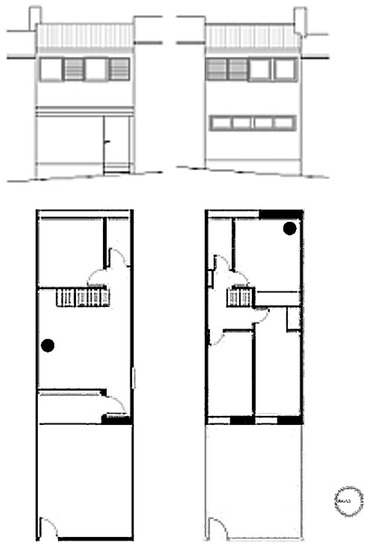
Figure 3.
Plan and elevation views of original proposal (source: [37]). Location of the sensors.
Two single-family terrace units (dwellings A and B) were monitored. One (dwelling A—DWG A) had undergone no variation since it was originally built. The other (dwelling B—DWG B), in contrast, had been upgraded with passive improvements in the envelope consisting in thermally insulating the opaque areas and replacing the glazing and frames in the openings (Figure 4). Both units are located at the northern edge of the respective row with façades facing east and west. In other words, both have three façades in contact with the outdoor air and a party wall in contact with the adjacent dwelling, assumed to be adiabatic in the energy model. Two dwellings in the same position and with the same orientation and urban characteristics were chosen to ensure comparability and reduce to a minimum the number of variables affecting their energy performance. Both are supplied with electricity as well as natural gas, which powers a boiler providing domestic hot water and heating. This study did not address the changes in indoor layout, focusing rather on the composition of the thermal envelope.
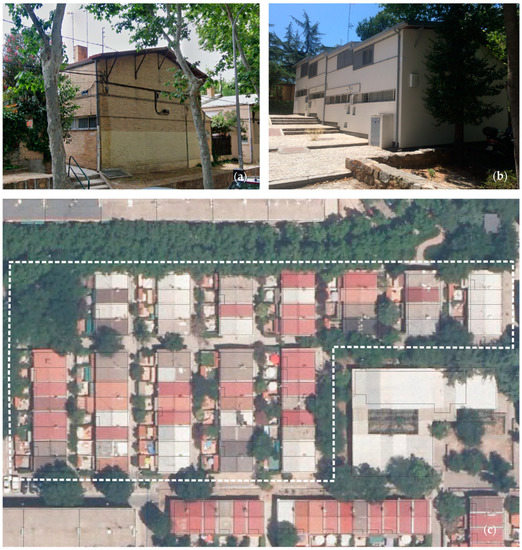
Figure 4.
From left to right: (a) Housing as originally built (DWG A), (b) renovated housing (DWG B), and (c) complex analyzed (authors’ formulation).
Dwelling A has undergone no substantial change that might affect passive thermal performance. It has no thermal insulation in any of the envelope elements. It is fitted with electrically-powered air conditioning both in the ground storey living room and the master bedroom on the upper storey.
Dwelling B has recently been upgraded via passive energy renovation consisting in the installation, in July and August 2018, of insulation on all four terrace houses on the row where it is located. Post-renovation monitoring was conducted here to determine the energy factors affecting the quality of the indoor environment in the two units. Dwelling B retrofitting consisted in the following:
- application of an external thermal insulation composite system (ETICS) to the façades, including 100 mm thick rock wool thermal insulation with thermal resistance λ = 0.036 W/mK;
- replacement of (fiber cement) roofing with (unspecified) 100 mm thermal insulation sandwiched between steel panels;
- replacement of window frames with new aluminum joinery featuring a thermal break;
- installation of low emissivity, 4/16/4 glazing with thermal transmittance (U-value), 1.1 W/m2K, and solar factor (g) 42.8 %.
The thermal specifications affecting the units’ passive energy performance, including thermal envelope geometry and construction, are summarized in Table 1.

Table 1.
Variables affecting energy performance of original and retrofitted housing (authors’ formulation).
4. Methodology
The two aforementioned similar dwellings (dwellings A, original condition; and B, retrofitted) were chosen for study and comparison. The working method deployed consisted in the following three stages.
- The occupants were surveyed to determine their energy habits and define the monitoring strategy.
- Data were collected in situ, including:
- a monitoring campaign to establish the quality of the indoor environment in the two dwellings, conducted under the same outdoor weather conditions in the same months, which covered both the heating and the cooling seasons.
- energy consumption data as metered.
- The final stage consisted in comparing consumption as estimated by a simulation model for the urban complex to the data gathered in situ from the dwellings studied. The urban model used was based on estimated heating demand and a certain amount of energy for ‘other purposes’ (DHW, cooling, kitchen, lightning, and appliances). It was calibrated as proposed here, i.e., on the grounds of the consumption data recorded and a critical analysis of the habitability monitoring records.
Determining the quality of the indoor environment, the energy consumption recorded by the meters and the estimates delivered by a theoretical model involved analysis of the items listed in Table 2.
Table 2.
Outline of methodology deployed.
The data were processed with software written in Python downloaded under an open access licence from the Python Software Foundation website. The data processing flow consisted, in synthesis, in:
- downloading information;
- information cleansing and standardization;
- data visualization.
4.1. User Survey
In their critical review of the methods deployed to assess passive energy renovation of occupied residential buildings, [38] advised of the difficulties inherent in separating the effects of renovation from other factors, such as indoor environment quality, building characteristics, weather conditions, and user-related issues [39]. The users of the two dwellings chosen for the case study were surveyed to determine the factors relating energy consumption to dwelling characteristics and use [40], including:
- data on the dwelling: floor area and age, ownership, and general questions about construction and window type;
- data on the household: number of inhabitants, mean occupancy, ventilation habits, and heating element use; winter- and summer-time comfort in the home; improvements and dwelling-scale energy saving measures adopted;
- data on DHW, heating and cooling, energy sources, and respective facilities;
- data from electricity and gas bills, request for one electricity and one gas bill for each dwelling to determine the uniform network supply point code (Spanish initials, CUPS);
- compilation of technical information on dwelling B energy renovation.
This qualitative information was instrumental to designing quantitative data collection (indoor environmental data and energy consumption) and analyzing the findings [41].
4.2. Indoor Environment Quality Monitoring
The quality of the indoor environment was determined by monitoring and analyzing the temperature (°C), relative humidity (%), and CO2 concentration (ppm) over approximately 9 months (Table 3). Indoor CO2 concentration over and above the outdoor value is widely used to assess the air quality perceived [42,43,44]. Standards ISO 17772, EN 16798, EN 15251, ASHRAE 62.1, and ISHRAE 10 0 01 recommend different CO2 ceilings relative to the environmental level [38]. Here, the criterion used to assess air quality in the dwellings monitored was as set out in Spanish legislation on residential buildings [45]: “Habitable rooms in dwellings must be provided a sufficient flow of outside air to ensure that the mean yearly CO2 concentration is under 900 ppm and the cumulative yearly concentration in excess of 1600 ppm is less than 500,000 ppm·h”.
Table 3.
Technical specifications of the datalogger used (source: [46]).
The dwellings were monitored from 26/11/2018 to 08/08/2019, deeming as full months 01/12/2018 to 31/07/2019. Readings were taken every 30 min and averaged hourly to ensure reading uniformity throughout. The four Wöhler CDL 210 compact infrared dataloggers used recorded temperature, relative humidity, and CO2 concentration.
The same two rooms were monitored in dwellings A and B: the ground storey living-dining room and the largest of the upper storey bedrooms. The location of the sensors has been indicated in Figure 3.
4.3. Energy Consumption Quantification
According to the literature, lowering residential consumption may reduce nationwide carbon emissions significantly [47]. Analyses of final residential sector energy demand suggest that the determinants are primarily associated with household characteristics (socio-economic circumstances) and dwelling energy efficiency (building specifications). The former impact electric power consumption directly and the latter largely determine heating energy consumption [48]. Inasmuch as the starting hypothesis for this study was that passive envelope renovation improves energy efficiency, inducing substantially lowering energy consumption for heating, the two factors were analyzed separately.
Energy consumption was determined from the information recorded in the smart meters installed in the two dwellings and compared to energy use reported by occupants in their replies to the surveys. To reduce the number of variables affecting energy behavior, the criterion for choosing the units studied consisted in ensuring that they used the same type of energy (natural gas/electricity) and heating facility. In this study, the information on energy consumption was drawn from natural gas bills, associated with heating, and electricity bills, for all other purposes. Monthly records on electricity consumption were available for 07/2017 to 01/2020 and on natural gas for 12/2017 to 02/2020.
The units’ consumption histories could be accessed with their respective uniform network supply point codes (CUPS), although as that information is confidential, its release is subject to the consent of invoice recipients. Details of the methodology used are described in an earlier paper [49].
Consumption was established in kWh with variable (approximately monthly) start and end dates as follows.
- Consumption was distributed uniformly across the number of days specified on the invoice.
- Those values were then summed and regrouped monthly.
- The first and last periods were disregarded, for they did not normally consist in full months.
- Mean monthly and yearly values were computed for each dwelling.
Pre- and post-renovation energy consumption was found for dwelling B and compared to outdoor temperatures during each period, bearing in mind that indoor environment quality was monitored in the months following renovation.
4.4. Weather Data
The mean monthly outdoor temperatures (°C) for the years 2015 to 2019 were downloaded from the Retiro-Madrid meteo station website (http://www.aemet.es).
Other weather data for areas closer to the dwellings were also used, such as the information gathered from the Habita_RES project meteo station (FroggitWH3000) which kept records on the microclimate in the vicinity [50]. Whilst that meteo station recorded temperature every 10 min since 10/01/2019, the data from that date through the end of the monitoring period were averaged hourly.
4.5. Data for the Urban Analysis
This section describes a theoretical model (calibrated with the empirical data recorded for the dwellings monitored) for estimating the potential energy savings associated with passive renovation of the entire complex.
The theoretical estimates applied were found with a model that predicted demand in the urban complex by processing cadastral data on envelope geometry, orientation, and construction characteristics [51]. The model was based on the simplified calculation of heating energy demand in each building in the complex as set out in international standard [52]. The information on the mean energy consumed per dwelling for purposes ‘other than’ heating was drawn from official estimates for the average dwelling located in regions of Spain with a continental Mediterranean climate [53,54].
The theoretical consumption model was (coarsely) calibrated with data metered in the two case studies (original state dwg A and retrofitted dwg B), assuming similar energy patterns for the rest of the dwellings in the complex. The findings on consumption in the complex as a whole were generalized to define two scenarios: present and retrofitted.
Consumption was matched to the habitability data monitored (verification). The results of that procedure served as grounds for a series of considerations around comfort standards and indoor environment quality and their effect on energy consumption.
The data for the residential complex where the monitored dwellings are located were drawn from the following sources:
- digital aerial ortho-photographs forming part of the National Geographic Institute’s Plan for Land Use Observation [55];
- digital cartography published by the Cadastre’s virtual office [56];
- ‘Metodología de Evaluación de Pérdidas Energéticas’ [methodology for assessing energy loss (Spanish initials, MEPEC)], a tool for estimating heating energy demand developed under the Habita_RES project [51];
- monitoring data records and consumption metered in the two units.
5. Results and Discussion
The findings for the two dwellings studied are described below, including the information collected with the surveys, the indoor environment monitoring records, and the energy consumption data metered. That description is followed by a discussion of the results delivered by the predictive model for the complex as a whole and of the subsequent extrapolation of the case study findings, likewise to the complex.
5.1. User Surveys
The information obtained from the surveys answered by dwelling occupants prior to monitoring are summarized in Table 4. Some of the data required to implement monitoring were drawn from these surveys. In both units, heating and domestic hot water were sourced from a dwelling-specific, natural gas-powered boiler, whilst electricity was used for all other purposes.
Table 4.
Survey information.
5.2. Indoor Environment Quality
The findings for the variables monitored (T, H, and CO2) are given on three scales: for the entire period monitored, for two representative weeks (one in winter and the other in summer), and mean daily profiles.
5.2.1. Environmental Comfort: Temperature (T °C)
All the temperatures recorded during the monitoring period are graphed in Figure 5: by the half-hour (thin grey lines) showing variation in outdoor T throughout the day and daily indoor mean values (thicker red and blue lines). The pie charts illustrate the percentage of time temperatures lay within the comfort ranges defined in Spanish legislation [15]: in winter 20 to 17 °C and in summer 27 to 25 °C. Dwelling B (retrofitted) remained within the comfort zone for a higher percentage of the time in winter, dipping below 17 °C in just 5% of the hours, compared to the nearly 30% monitored in dwelling A (original). The conditions recorded in the summer months were similar for the two units, with temperatures over 27 °C 5% of the time in the retrofitted and 6% in the non-renovated dwelling.
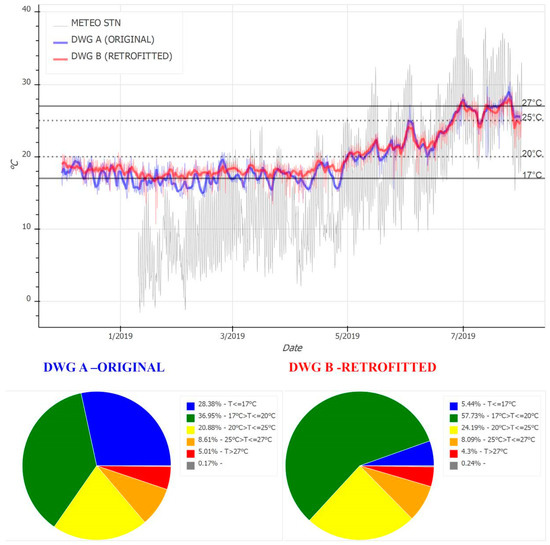
Figure 5.
Mean daily indoor and half-hourly outdoor temperatures (°C) for the entire monitoring period and percentage of readings in dwellings A and B within the reference temperature ranges set out in Spanish legislation.
The temperatures graphed in Figure 6 for a winter week (Monday through Sunday, 21/01/2019 to 28/01/2019) show narrower variation in the retrofitted dwelling, as expected, given its thermally insulated envelope. In addition, the declines in temperature occasioned in all likelihood by ventilation were quickly reversed in the retrofitted dwelling, probably due to the release into the indoor environment of the heat stored in the building’s thermal mass.
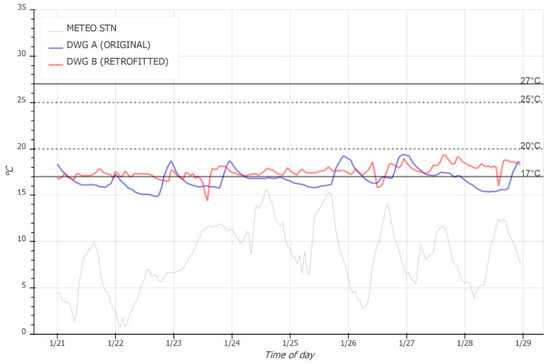
Figure 6.
Mean hourly indoor and outdoor temperatures (°C) in a winter week (Monday through Sunday, 21/01/2019–28/01/2019).
Monitoring summer performance is also important to study the overheating risk [40]. According to the temperatures recorded in a summertime week (Monday through Sunday, 15/07/2019 to 22/07/2019; Figure 7), the decline in indoor temperature in dwelling A induced by cooling was quickly reversed when the units were switched off. The data also attest to overnight ventilation-induced lower temperatures in retrofitted dwelling B, where despite the lack of air conditioning, the temperatures were generally lower than in dwelling A [57].
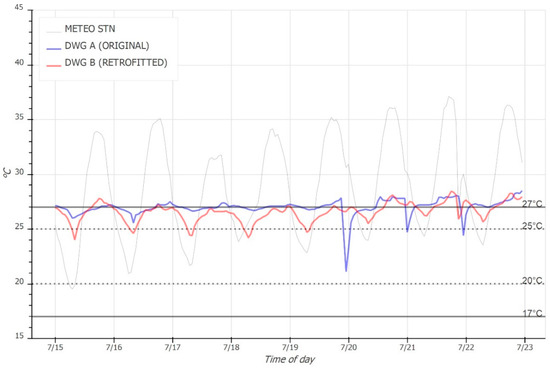
Figure 7.
Mean hourly outdoor and indoor temperatures (°C) in a summer week (Monday through Sunday, 15/07/2019–22/07/2019).
Figure 8, in turn, graphs the mean hour-by-hour temperatures in winter and summer. The mean values lay within the comfort limit all day in the renovated dwelling, whereas in the original state unit the night time temperature dropped to <17 °C and remained below that lower limit until early afternoon.
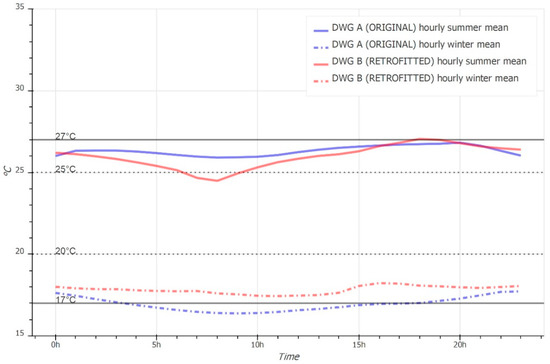
Figure 8.
Winter time and summer time temperature profiles (hourly means).
The summertime curves were nearly identical with the exception of the hours from 1:00 and 6:00 a.m., when the retrofitted dwelling benefited from ventilation. In winter, the temperature was over 1 °C lower in the original than the renovated dwelling, even though the target temperature was 1.5 °C higher in the former (20 °C) than in the latter (18.5 °C).
5.2.2. Environmental Comfort: Relative Humidity (%)
All the relative humidity records are graphed in Figure 9: outdoor RH by the half-hour (thin grey lines) and indoor monitored values by the hour (thicker red and blue lines). The legal upper and lower limits, 70% in winter and 30% in summer, are likewise indicated (horizontal lines). Relative humidity was higher in retrofitted dwelling B than in original state dwelling A throughout most of the period monitored in both summer and winter.
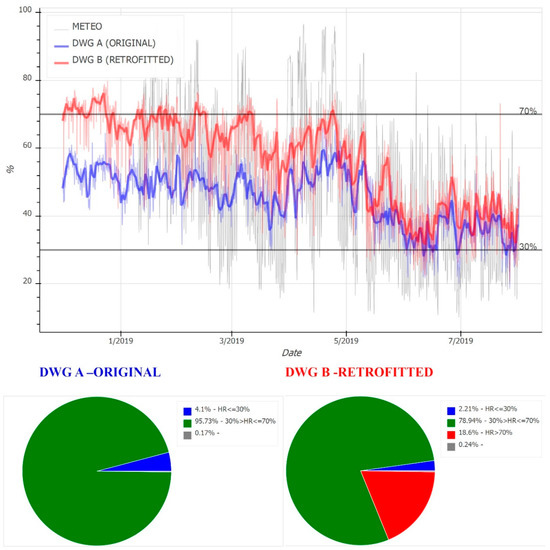
Figure 9.
Mean daily indoor and half-hourly outdoor relative humidity (%) readings for the entire monitoring period and percentage of readings within the relative humidity ranges set out in Spanish legislation.
The relative humidity values measured in the two dwellings lay within the recommended limits practically throughout, although the retrofitted unit had more wintertime episodes of HR higher than the 70% ceiling, very likely as a result of greater post-renovation window air-tightness.
5.2.3. Air Quality
The CO2 readings are plotted in Figure 10, with the outdoor half-hour values in grey and daily indoor means in red and blue. The legal reference values are also shown (horizontal dotted and solid lines). The data in Table 5 refer to the entire 8-month monitoring period (12/2018–07/2019).
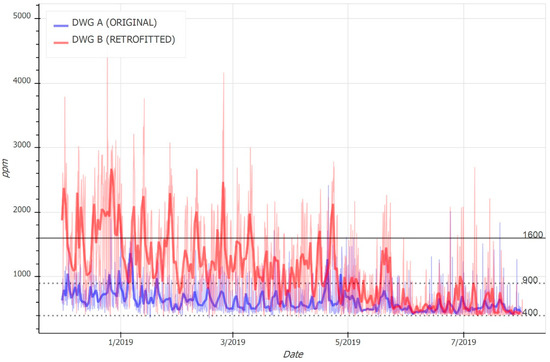
Figure 10.
Mean daily CO2 (ppm) data for the entire monitoring period.
Table 5.
CO2 findings for the period monitored.
Mean hourly air quality data (CO2 ppm) for a winter week (Monday through Sunday, 21/01/2019–28/01/2019) are graphed in Figure 11 and for a summer week (15/07/2019–22/07/2019) in Figure 12. The daily air quality (CO2 ppm) profiles in summer and winter are plotted in Figure 13.
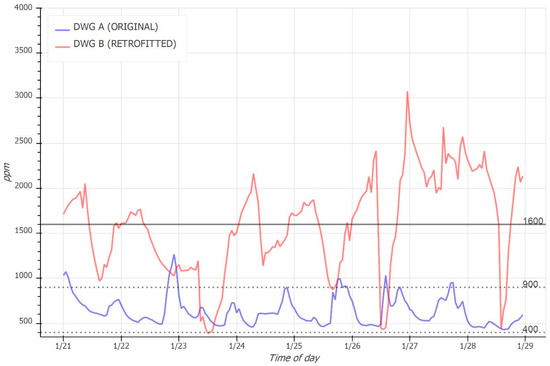
Figure 11.
Mean hourly CO2 (ppm) readings in a winter week (Monday through Sunday, 21/01/2019–28/01/2019).
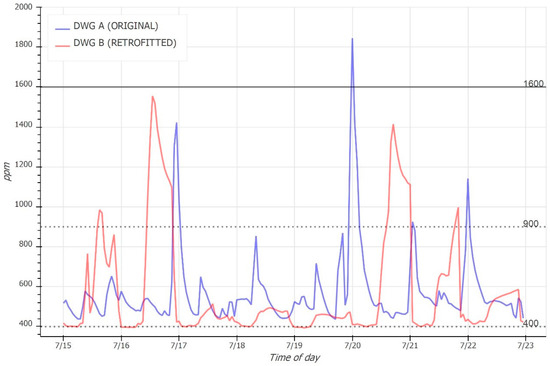
Figure 12.
Mean hourly CO2 (ppm) readings for a summer week (Monday through Sunday, 15/07/2019–22/07/2019).
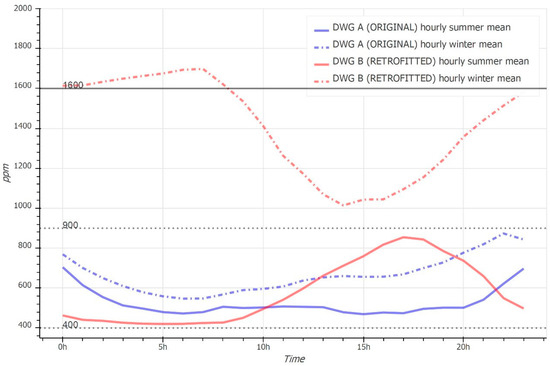
Figure 13.
Daily winter and summer air quality (CO2 ppm) profiles (hourly means).
More episodes of high CO2 concentrations were recorded in winter than in summer. Retrofitted dwelling B exhibited a mean of over 1600 ppm, an indication of the effect of that unit’s enhanced air-tightness. Wintertime values of over 1600 ppm were rarely recorded in the original state dwelling. The explanation may lie in its lower occupancy (two people, both absent from home during working hours) and scant air-tightness, even with the windows closed. Original state dwelling A had more episodes of ppm >1600 than dwelling B in the summer months due to the use of air conditioning in the absence of a flow of outside air. Those episodes were recorded at night, the same timeframe when ventilation lowered CO2 concentration substantially in retrofitted dwelling B. These results support the evidence that ventilation is also an important issue to take into account in retrofitting strategies, as increasing air tightness reduces air infiltration, and hence reduces also indoor pollutants release [58,59,60,61].
5.3. Power Consumption
Table 6 summarizes the monthly power consumption metered in the two dwellings, further to the respective energy bills. Original and retrofitted unit yearly consumption was estimated as the sum of the monthly means, as described in Section 4.3 (Table 7). The electricity and natural gas consumption values metered are analyzed below.
Table 6.
Monthly energy consumption metered in the case study dwellings.
Table 7.
Yearly consumption (kWh) estimated from monthly means metered in the two dwellings
5.3.1. Natural Gas Consumption
Natural gas consumption covered heating and domestic hot water only, for kitchen appliances were electrically powered in both dwellings. Summertime consumption was for DHW only, while the winter values referred to both uses.
As retrofitting was conducted in the summer of 2018 (grey shaded period in Figure 14), gas consumption for the winter prior to renovation could be compared to performance after envelope improvement. Data were available for two winters subsequent to renovation. In the first year (prior to retrofitting), dwelling B consumed more energy than dwelling A, perhaps due to a need for greater comfort in the former, some of whose occupants were children, than in the latter, occupied by two professionals who spent much of the day away from home with the heating off.
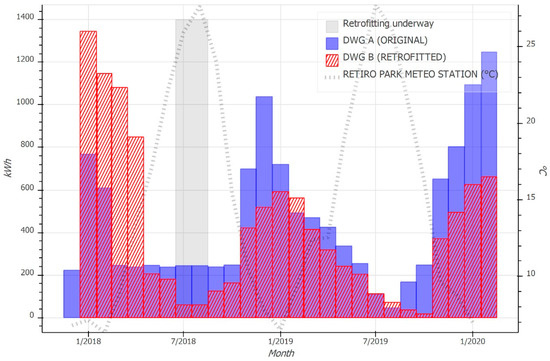
Figure 14.
Monthly natural gas consumption, 12/2017–02/2020.
5.3.2. Electric Power Consumption
Lower electricity consumption after than before envelope renovation in dwelling B was related to occupancy, which declined from four people to three. That confirmed the substantial impact of household size on electric power consumption (Figure 15).
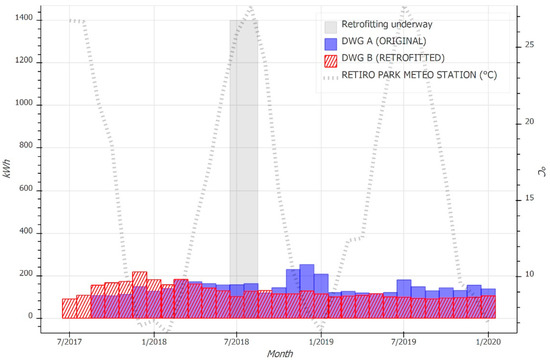
Figure 15.
Monthly electric power consumption, 07/2017–01/2020.
5.4. Urban Analysis
The urban energy performance model used was based on the calculation of heating energy demand for the entire complex analyzed, broken down building-by-building. The data were then compared to the consumption metered in the two case studies and nationwide mean values.
5.4.1. Heating Demand for the Complex
Heating energy demand was estimated for all 68 units in the complex on the grounds of geometry, orientation, and construction characteristics (Figure 16) (ISO 13790, 2008). Total demand for the complex as a whole amounted to 535 881 kWh/year, with a yearly mean per square meter of 100.2 kWh.
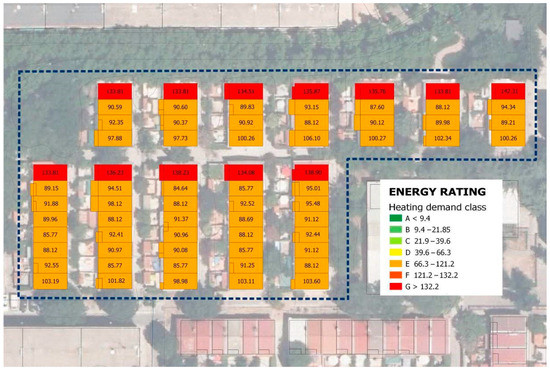
Figure 16.
Heating demand for 68 original state single-family units (authors’ formulation).
A comparison of demand per square meter to compactness ratio served as grounds for establishing a number of details on urban morphology. Three patterns of energy performance were observed in the complex (Figure 17). The 44 units with two party walls exhibited a higher compactness ratio (1.6 m3/m2 to 1.8 m3/m2), which translated to yearly energy needs of 84 to 98 kWh/m2 (mean, 92.3 kWh/m2). The 24 buildings located at the ends of rows, characterized by a lower compactness ratio (1.2 m3/m2 to 1.3 m3/m2), behaved in keeping with one of two energy demand patterns depending on whether they were located at the northern (133 to 142 kWh/m2) or southern (97.73 to 106.10 kWh/m2) end of the row. The units facing south could offset the energy loss associated with a larger envelope area by more effectively capturing passive solar radiation. The dwellings monitored in this study, located at the northern end of the respective row, exhibited the highest heating energy needs in the entire complex, with a yearly total of 10,437 kWh (133 kWh/m2).
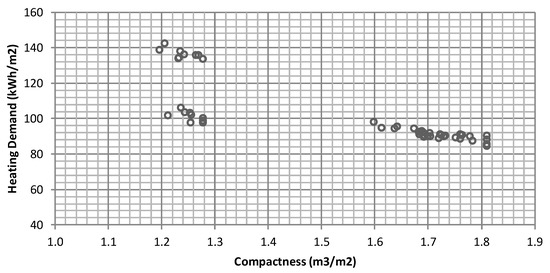
Figure 17.
Variation in heating demand (kWh/m2) with compactness ratio (m3/m2).
The simplified estimate of the energy balance for calculating heating demand in an original and retrofitted state dwelling graphed in Figure 18 illustrates the substantial impact of energy loss due to transmission across the envelope on total demand.
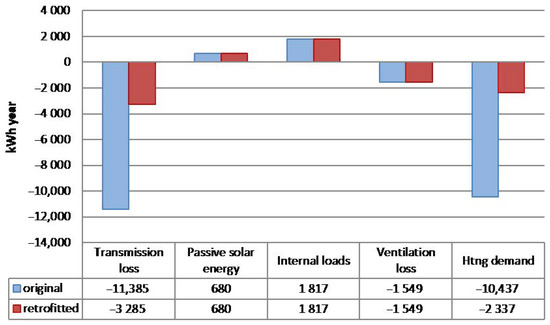
Figure 18.
Wintertime energy balance for original and retrofitted state, dwelling B (kWh year).
5.4.2. Total Consumption in the Urban Complex
This section compares the consumption estimated by the theoretical model to the values actually metered in the dwellings monitored in this study.
Earlier studies showed that consumption attributable to heating in an average dwelling located in Spain’s continental climate zone accounts for 55 % of the total, estimated as 15,119 kWh/year [53]. According to a study conducted under project SPAHOUSEC II [54], mean yearly natural gas consumption for single-family units in the continental climate zone amounts to 13,862, 6463 kWh of which are used for heating, 3947 kWh for DHW and 1134 for kitchen appliances. The dwellings sampled for the SPAHOUSEC II report had a mean floor area of 132.1 m2, whereas the area of the homes analyzed in this case study was approximately 79 m2 [56]. Values were consequently calculated per square meter for reasons of comparability (Table 8). A rough estimate of actual consumption in the residential complex as a whole was found by extrapolating the invoice data for the dwellings metered to all the other units.
Table 8.
Consumption in two dwellings studied and nationwide reference value for continental climate zone.
The mean monthly distribution of energy consumption metered in the dwellings studied here is graphed in Figure 19. The findings, which are not statistically significant (the mean is based on the 28-month period for which metered data were available), were used to calculate possible actual consumption in the complex as a whole.
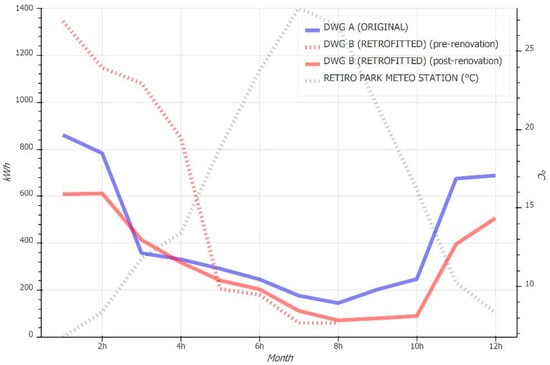
Figure 19.
Yearly natural gas consumption profile for two dwellings (monthly means for monitored data).
Extrapolating the findings for the reduction in heating-induced consumption in the dwellings monitored to the rest of the complex yielded a rough estimate of the reduction in consumption that would be observed if the envelopes of all the units in the complex were renovated. That calculation assumed the same energy sources for the same purposes in all the dwellings and a mean occupancy of 2.5 people. On those grounds and given a total yearly consumption of 371,447 kWh, envelope renovation was estimated to save 151,663 kWh/year or 38% of the total energy supplied (Table 9).
Table 9.
Extrapolation of savings in retrofitted dwelling to urban complex as a whole.
Energy demand estimates, at least for the two dwellings analyzed, were much higher than the consumption metered. That development, known as the performance gap and possibly due to a number of factors [34], is being studied on the urban scale as part of the Habita_RES project [50] described in [62]. The present study showed that the target temperatures used in the dwellings studied were lower than defined by the existing legislation to estimate energy demand [52,63]. The inference is that occupants are presumably cutting energy consumption back substantially by lowering their comfort levels to below the values envisaged in the legislation.
6. Conclusions
Substantial improvement in energy consumption was observed in the retrofitted dwelling, in particular as respects natural gas, which declined by 43%. Where the electric power consumed for ‘other purposes’ was included, the urban model developed envisaged 38% energy savings for the entire complex in the event all the units’ envelopes were similarly renovated.
Energy consumption estimated with theoretical models cannot be compared to the energy actually metered without factoring in habitability conditions, including environmental comfort and air quality. Information on indoor environment quality can only be gathered by monitoring dwellings for a sufficiently long period of time, which must cover both summer and winter. Information on case study consumption, in contrast, can be drawn from smart meter data histories. Smart meter information is highly useful to researchers to establish and encourage the widespread use of a minimal, lower cost monitoring protocol. Such information is not readily accessible to Spanish researchers, however, despite the growing deployment of smart meters across the EU. On the one hand, smart meters are not yet in place in all dwellings, (although installation is proceeding at a good pace and will be completed in the near future). On the other, researchers require occupants’ authorization to use their private data, which not all users are willing to grant. If consumption by all the dwellings in the complex studied here could be accessed, estimates of possible savings would be much more accurate, for a profile could be charted of all the units analyzed, delivering mean consumption numbers much closer to the actual values.
A comparison of the consumption data metered to the theoretical baseline consumption (calculated by estimating heating demand) suggested that the dwellings are consuming less energy than calculated by the models developed further to the standards presently in place. Indoor environment quality monitoring showed that the conditions prevailing in these dwellings do not meet the comfort levels defined in the existing legislation.
Analyzing indoor environment quality is vital to assessing the impact of energy renovation. IEQ parameter monitoring proved that the summer and winter temperatures improved in the retrofitted dwelling, where energy consumption declined. Relative humidity was found to be higher in the renovated than in the original state dwelling, particularly in winter, while it nonetheless remained within acceptable limits most of the time. Air quality declined, however, very likely as a result of enhanced post-renovation window air-tightness. Air quality in the renovated dwelling was not only lower than in the non-renovated unit, but exceeded the limits of CO2 concentration allowed by the existing legislation. Winter time ventilation would need to be increased in the renovated dwelling. This finding is highlighted as a fact to be borne in mind in future energy renovation projects. The findings suggest that ventilation must be broached in conjunction with other energy parameters. One of the possible solutions would be to practise more generous natural ventilation in the winter. More detailed study would be needed to determine the number of air exchanges required and the impact on indoor temperature. More generous natural ventilation practice should be defined or forced ventilation included in the Heating Ventilation and Air Conditioning (HVAC) systems to guarantee the air flows required to meet existing air quality standards. Such systems could include heat exchangers to minimize air replenishment-induced energy exchange with the outdoor air. Dwelling B was found to benefit from effective night time ventilation in the summer, both lowering the temperature around the clock and enhancing air quality. That suggests the need to further such good bioclimatic practice among the population at large.
The minimal monitoring method developed to conduct this study proved to suffice to assess the impact of energy renovation on both energy consumption and indoor environment quality in two case studies. For dwellings with different types of energy or heating and DHW facilities, the method would have to be adapted to ensure comparability by factoring in consumption attributable to each use.
This case study of single-family units confirmed that investment in the envelope can lower residential sector primary energy consumption substantially. Heating was found to account for the highest percentage of consumption. Passive renovation exhibits considerable potential for lowering energy consumption and should be prioritized in the pursuit of the EU’s decarbonation objectives for the building stock.
Author Contributions
Conceptualization: F.M.-C. and C.A.; Methodology: F.M.-C. and F.d.F.; Software: F.d.F.; Validation: I.O. and B.F.; Investigation: F.M.-C. and F.d.F.; Data curation: F.M.-C., I.O. and F.d.F.; Writing: F.M.-C. and F.d.F.; Review and Editing: I.O. and B.F.; Project administration: I.O. All authors have read and agreed to the published version of the manuscript.
Funding
This study was funded by the Spanish Ministry of the Economy’s National Programme for R&D + I Geared to Societal Challenges under projects BIA2017-83231-C2-1-R ‘Nueva herramienta integrada de evaluación para áreas urbanas vulnerables. Hacia la autosuficiencia energética y a favor de un modelo de habitabilidad biosaludable’ and ‘Habita_RES-(2018–2021)’.
Institutional Review Board Statement
Not applicable.
Informed Consent Statement
Not applicable.
Data Availability Statement
Not applicable.
Acknowledgments
Dwelling occupants’ selfless cooperation, authorization to access their homes for monitoring and consent to share their energy consumption data are gratefully acknowledged. Vigilancia Energética, a Spanish energy management company, are thanked for their collaboration in obtaining the consumption data. Thanks are also due to the Spanish Meteorological Agency for providing open access to their data.
Conflicts of Interest
The authors declare no conflict of interest.
References
- European Parliament; UE Council. Directive 2018/844 of the European Parliament and of the Council of 30 May 2018 Amending Directive 2010/31/EU on the Energy Performance of Buildings and Directive 2012/27/EU on Energy Efficiency (Text with EEA Relevance); European Parliament: Strasbourg, France, 2018; Volume OJ L.
- European Parliament; UE Council. Directive 2012/27/EU of the European Parliament and of the Council of 25 October 2012 on Energy Efficiency, Amending Directives 2009/125/EC and 2010/30/EU and Repealing Directives 2004/8/EC and 2006/32/EC (Text with EEA Relevance); European Parliament: Strasbourg, France, 2012; Volume OJ L.
- European Parliament; UE Council. Directive 2010/31/EU of the European Parliament and of the Council of 19 May 2010 on the Energy Performance of Buildings; European Parliament: Strasbourg, France, 2010; Volume OJ L.
- European Commission. A European Green Deal—European Commission. 2020. Available online: https://ec.europa.eu/info/strategy/priorities-2019-2024/european-green-deal_en (accessed on 17 July 2020).
- European Commission. Renovation Wave, Energy—European Commission. 4 June 2020. Available online: https://ec.europa.eu/energy/topics/energy-efficiency/energy-efficient-buildings/renovation-wave_en (accessed on 17 July 2020).
- Ministerio de Fomento. ERESEE 2014. Estrategia a Largo Plazo para la Rehabilitación Energética en el Sector de la Edificación en España. Secretaría de Estado de Infraestructuras, Transporte y Vivienda. 2014. Available online: https://www.mitma.gob.es/ministerio/planes-estrategicos/estrategia-a-largo-plazo-para-la-rehabilitacion-energetica-en-el-sector-de-la-edificacion-en-espana/eresee_2014 (accessed on 22 November 2019).
- Ministerio de Fomento. ERESEE 2017. Actualización de la Estrategia a Largo Plazo para la Rehabilitación Energética en el Sector de la Edificación en España. Secretaría de Estado de Infraestructuras, Transporte y Vivienda. 2017. Available online: https://www.mitma.gob.es/ministerio/planes-estrategicos/estrategia-a-largo-plazo-para-la-rehabilitacion-energetica-en-el-sector-de-la-edificacion-en-espana/eresee_2017 (accessed on 22 November 2019).
- Ministerio de Transportes, Movilidad y Agenda Urbana. ERESEE 2020. Actualización 2020 de la Estrategia a Largo Plazo para la Rehabilitación Energética en el Sector de la Edificación en España. 2020. Available online: https://www.mitma.es/el-ministerio/planes-estrategicos/estrategia-a-largo-plazo-para-la-rehabilitacion-energetica-en-el-sector-de-la-edificacion-en-espana (accessed on 16 July 2020).
- Escandón, R.; Suárez, R.; Sendra, J.J. On the assessment of the energy performance and environmental behaviour of social housing stock for the adjustment between simulated and measured data: The case of mild winters in the Mediterranean climate of southern Europe. Energy Build. 2017, 152, 418–433. [Google Scholar] [CrossRef]
- Howden-Chapman, P.; Matheson, A.; Crane, J.; Viggers, H.; Cunningham, M.; Blakely, T.; Cunningham, C.; Woodward, A.; Saville-Smith, K.; O’Dea, D.; et al. Effect of insulating existing houses on health inequality: Cluster randomised study in the community. BMJ 2007, 334, 460. [Google Scholar] [CrossRef] [PubMed]
- Thomson, H.; Thomas, S.; Sellström, E.; Petticrew, M. Housing Improvements for Health and Associated Socio-Economic Outcomes: A Systematic Review. Campbell Syst. Rev. 2013, 9, 1–348. [Google Scholar] [CrossRef]
- Cuchí, A.; Sweatman, P. Informe GTR 2012. Una Visión-País Para El Sector De La Edificación En España. Plan de Acción Para un Nuevo Sector de la Vivienda; Grupo de Trabajo sobre Rehabilitación (GTR): Madrid, Spain, 2012. [Google Scholar]
- Cuchí, A.; Sweatman, P. Informe GTR 2014. Estrategia para la Rehabilitación. Grupo de Trabajo Sobre Rehabilitación (GTR). 2014. Available online: https://gbce.es/recursos/informe-gtr-2014/ (accessed on 30 November 2019).
- NBE-CT-79; NBE-CT-79. Condiciones Térmicas de los Edificios; Presidencia del Gobierno: Madrid, Spain, 1979. [Google Scholar]
- CTE-DB-HE. Código Técnico de la Edificación. Documento Básico HE Ahorro de Energía; Gobierno de España: Madrid, Spain, 2019. [Google Scholar]
- Kurtz, F.; Monzón, M.; López-Mesa, B. Obsolescencia de la envolvente térmica y acústica de la vivienda social de la postguerra española en áreas urbanas vulnerables. El caso de Zaragoza. Inf. Construcción 2015, 67, 021. [Google Scholar] [CrossRef]
- Domínguez, S.; Sendra, J.J.; Oteiza San José, I. La Envolvente Energética de la Vivienda Social en el Periodo 1939–1979. Caso de Sevilla; Consejo Superior de Investigaciones Científicas: Madrid, Spain, 2016.
- Sánchez-Guevara Sánchez, C.; Núñez Peiró, M.; Neila González, F.J. Urban Heat Island and Vulnerable Population. The Case of Madrid. In Sustainable Development and Renovation in Architecture, Urbanism and Engineering; Mercader-Moyano, P., Ed.; Springer International Publishing: Cham, Switzerland, 2017; pp. 3–13. [Google Scholar]
- Sanz Fernández, A.; Gómez Muñoz, G.; Sánchez-Guevara Sánchez, C.; Núñez Peiró, M. Estudio Técnico Sobre Pobreza Energética en Madrid; Escuela Nacional de Salud: Madrid, Spain, 2017; p. 186. [Google Scholar]
- Martín-Consuegra, F.; Gómez Giménez, J.M.; Alonso, C.; Córdoba Hernández, R.; Hernández Aja, A.; Oteiza, I. Multidimensional index of fuel poverty in deprived neighbourhoods. Case study of Madrid. Energy Build. 2020, 110205. [Google Scholar] [CrossRef]
- Giancola, E.; Soutullo, S.; Olmedo, R.; Heras, M.R. Evaluating rehabilitation of the social housing envelope: Experimental assessment of thermal indoor improvements during actual operating conditions in dry hot climate, a case study. Energy Build. 2014, 75, 264–271. [Google Scholar] [CrossRef]
- Hills, J. Final report of the Fuel Poverty Review. 2012. Available online: https://www.gov.uk/government/publications/final-report-of-the-fuel-poverty-review (accessed on 22 May 2017).
- de Luxán García de Diego, M.; Gómez Muñoz, G.; López Román, E. Cuentas energéticas no habituales en edificación residencial. Inf. Construcción 2015, 67, 9. [Google Scholar] [CrossRef]
- Aranda, J.; Zabalza, I.; Conserva, A.; Millán, G. Analysis of Energy Efficiency Measures and Retrofitting Solutions for Social Housing Buildings in Spain as a Way to Mitigate Energy Poverty. Sustainability 2017, 9, 1869. [Google Scholar] [CrossRef]
- Mata, E.; Sasic Kalagasidis, A.; Johnsson, F. Building-stock aggregation through archetype buildings: France, Germany, Spain and the UK. Build. Environ. 2014, 81, 270–282. [Google Scholar] [CrossRef]
- Mata, E.; Medina Benejam, G.; Sasic Kalagasidis, A.; Johnsson, F. Modelling opportunities and costs associated with energy conservation in the Spanish building stock. Energy Build. 2015, 88, 347–360. [Google Scholar] [CrossRef]
- Loga, T.; Stein, B.; Diefenbach, N. TABULA building typologies in 20 European countries—Making energy-related features of residential building stocks comparable. Energy Build. 2016, 132, 4–12. [Google Scholar] [CrossRef]
- Golubchikov, O.; Deda, P. Governance, technology, and equity: An integrated policy framework for energy efficient housing. Energy Policy 2012, 41, 733–741. [Google Scholar] [CrossRef]
- Demski, C.; Thomas, G.; Becker, S.; Evensen, D.; Pidgeon, N. Acceptance of energy transitions and policies: Public conceptualisations of energy as a need and basic right in the United Kingdom. Energy Res. Soc. Sci. 2019, 48, 33–45. [Google Scholar] [CrossRef]
- Grillone, B.; Danov, S.; Sumper, A.; Cipriano, J.; Mor, G. A review of deterministic and data-driven methods to quantify energy efficiency savings and to predict retrofitting scenarios in buildings. Renew. Sustain. Energy Rev. 2020, 131, 110027. [Google Scholar] [CrossRef]
- Filippi Oberegger, U.; Pernetti, R.; Lollini, R. Bottom-up building stock retrofit based on levelized cost of saved energy. Energy Build. 2020, 210, 109757. [Google Scholar] [CrossRef]
- Alonso, C.; Oteiza, I.; García-Navarro, J.; Martín-Consuegra, F. Energy consumption to cool and heat experimental modules for the energy refurbishment of façades. Three case studies in Madrid. Energy Build. 2016, 126, 252–262. [Google Scholar] [CrossRef]
- Alonso, C.; Oteiza, I.; Martín-Consuegra, F.; Frutos, B. Methodological proposal for monitoring energy refurbishment. Indoor environmental quality in two case studies of social housing in Madrid, Spain. Energy Build. 2017, 155 (Suppl. C), 492–502. [Google Scholar] [CrossRef]
- Cuerda, E.; Guerra-Santin, O.; Sendra, J.J.; Neila, F.C. Understanding the performance gap in energy retrofitting: Measured input data for adjusting building simulation models. Energy Build. 2020, 209, 109688. [Google Scholar] [CrossRef]
- Esteban Maluenda, A.M. La vivienda social española en la década de los 50: Un paseo por los poblados dirigidos de Madrid. Cuad. Notas 1999, 7, 55–80. [Google Scholar]
- Centellas, M.; Jordá, C.; Landrove, S. Docomomo Ibérico, La Vivienda Moderna: Registro DOCOMOMO Ibérico, 1925–1965. Barcelona; Fundación DOCOMOMO Ibérico: Madrid, Spain, 2009. [Google Scholar]
- Moya, L.; Monjo, J.; Díez, A. La arquitectura ordinaria del siglo XX como patrimonio cultural: Tres barrios de promoción oficial de Madrid. Rev. EURE Rev. Estud. Urbano Reg. 2017, 43. [Google Scholar] [CrossRef]
- Carratt, A.; Kokogiannakis, G.; Daly, D. A critical review of methods for the performance evaluation of passive thermal retrofits in residential buildings. J. Clean. Prod. 2020, 263, 121408. [Google Scholar] [CrossRef]
- Madonna, F.; Quaglia, P.; Corrado, V.; Croci, L. Influence of Comfort Expectations on Building Energy Need. Energy Procedia 2017, 140, 265–276. [Google Scholar] [CrossRef]
- Elsharkawy, H.; Zahiri, S. The significance of occupancy profiles in determining post retrofit indoor thermal comfort, overheating risk and building energy performance. Build. Environ. 2020, 172, 106676. [Google Scholar] [CrossRef]
- Du, J.; Pan, W.; Yu, C. In-situ monitoring of occupant behavior in residential buildings—A timely review. Energy Build. 2020, 212, 109811. [Google Scholar] [CrossRef]
- Dovjak, M.; Slobodnik, J.; Krainer, A. Consequences of energy renovation on indoor air quality in kindergartens. Build. Simul. 2020, 13, 691–708. [Google Scholar] [CrossRef]
- Korsavi, S.S.; Montazami, A.; Mumovic, D. Indoor air quality (IAQ) in naturally-ventilated primary schools in the UK: Occupant-related factors. Build. Environ. 2020, 180. [Google Scholar] [CrossRef]
- Liang, W.; Zhao, B.; Liu, J.; Pei, J. Can carbon dioxide be a good indicator for formaldehyde in residences?—Monte Carlo modeling for a whole year. Sci. Technol. Built Environ. 2020, 26, 749–762. [Google Scholar] [CrossRef]
- Código Técnico de la Edificación. Documento Básico HS Salubridad 2019. Available online: https://www.codigotecnico.org/pdf/Documentos/HS/DBHS.pdf (accessed on 29 December 2020).
- Wöhler, Registrador de CO2 CDL 210. 2020. Available online: https://www.pce-iberica.es/medidor-detalles-tecnicos/instrumento-de-registrador/registrador-cdl210.htm (accessed on 11 May 2020).
- Besagni, G.; Borgarello, M. The determinants of residential energy expenditure in Italy. Energy 2018, 165, 369–386. [Google Scholar] [CrossRef]
- Wahlström, M.H.; Hårsman, B. Residential energy consumption and conservation. Energy Build. 2015, 102, 58–66. [Google Scholar] [CrossRef]
- Martín-Consuegra, F.; Gouveia, J.P.; de Frutos, F.; Alonso, C.; Oteiza, I. Energy consumption and comfort gap in social housing in Madrid, through smart meters and surveys information. Presented at the 10th European Conference on Energy Efficiency and Sustainability in Architecture and Planning—3rd International Congress on Advanced Construction, Vitoria-Gasteiz, Spain, 11–12 September 2019. [Google Scholar]
- Oteiza, I. Proyecto Habita_res—(2018–2021) Proyecto de Investigación BIA2017-83231-C2-1-R. Nueva Herramienta Integrada de Evaluación para Áreas Urbanas Vulnerables. Hacia la Autosuficiencia Energética y a Favor de un Modelo de Habitabilidad Biosaludable 2021. 2018. Available online: https://proyectohabitares.ietcc.csic.es (accessed on 15 February 2020).
- Martín-Consuegra, F.; de Frutos, F.; Oteiza, I.; Hernández Aja, A. Use of cadastral data to assess urban scale building energy loss. Application to a deprived quarter in Madrid. Energy Build. 2018, 171, 50–63. [Google Scholar] [CrossRef]
- International Organization for Standardization. ISO 13790:2008—Energy Performance of Buildings—Calculation of Energy Use for Space Heating and Cooling. Available online: https://www.iso.org/standard/41974.html (accessed on 29 December 2020).
- IDAE. Proyecto SECH-SPAHOUSEC. Análisis del Consumo Energético del Sector Residencial en España. Informe Final, Instituto para la Diversificación y Ahorro de Energía. 2011. Available online: www.idae.es/uploads/documentos/documentos_informe_spahousec_acc_f68291a3.pdf (accessed on 29 December 2020).
- IDAE. SPAHOUSEC II: Análisis Estadístico del Consumo de gas Natural en las Viviendas Principales con Calefacción Individual, Instituto para la Diversificación y Ahorro de Energía. 2019. Available online: https://idae.es/publicaciones/spahousec-ii-analisis-estadistico-del-consumo-de-gas-natural-en-las-viviendas (accessed on 1 December 2019).
- IGN. Plan Nacional de Ortofotografía Aérea; Instituto Geográfico Nacional: Madrid, Spain, 2016. [Google Scholar]
- Sede Electrónica de Catastro. Servicios Web Libres del Catastro. Dirección General de Catastro, 13 January 2011. Available online: http://www.catastro.minhap.gob.es/ws/Webservices_Libres.pdf (accessed on 9 May 2017).
- Tabatabaei Sameni, S.M.; Gaterell, M.; Montazami, A.; Ahmed, A. Overheating investigation in UK social housing flats built to the Passivhaus standard. Build. Environ. 2015, 92, 222–235. [Google Scholar] [CrossRef]
- Roetzel, A.; Tsangrassoulis, A.; Dietrich, U.; Busching, S. On the influence of building design, occupants and heat waves on comfort and greenhouse gas emissions in naturally ventilated offices. A study based on the EN 15251 adaptive thermal comfort model in Athens, Greece. Build. Simul. 2010, 3, 87–103. [Google Scholar] [CrossRef]
- Rodríguez Trejo, S.; Vega Sánchez, S.; Acha Román, C. Evaluation of Ventilation and IAQ Parameters Measured in Social Housing in Madrid. Presented at the AIVC Conference 2015, Madrid, Spain, 23–24 September 2015; Available online: http://oa.upm.es/41860/ (accessed on 22 May 2017).
- Kinnane, O.; Sinnott, D.; Turner, W.J.N. Evaluation of passive ventilation provision in domestic housing retrofit. Build. Environ. 2016, 106, 205–218. [Google Scholar] [CrossRef]
- Broderick, Á.; Byrne, M.; Armstrong, S.; Sheahan, J.; Coggins, A.M. A pre and post evaluation of indoor air quality, ventilation, and thermal comfort in retrofitted co-operative social housing. Build. Environ. 2017, 122, 126–133. [Google Scholar] [CrossRef]
- Frutos, F.; Martin-Consuegra, F.; Oteiza, I.; Alonso, C.; Frutos, B.; Galeano, J. Energy efficiency and comfort on a deprived neighbourhood in Madrid (Spain). Presented at the PLEA 2020 A Coruña. Planing Post Carbon Cities, A Coruña, Spain, 1–3 September 2020. [Google Scholar]
- CTE-DB-HE. Código Técnico de la Edificación. Documento Básico HE Ahorro de Energía 2013; Gobierno de España: Madrid, Spain, 2013. [Google Scholar]
Publisher’s Note: MDPI stays neutral with regard to jurisdictional claims in published maps and institutional affiliations. |
© 2020 by the authors. Licensee MDPI, Basel, Switzerland. This article is an open access article distributed under the terms and conditions of the Creative Commons Attribution (CC BY) license (http://creativecommons.org/licenses/by/4.0/).