1. Introduction
For developing countries, an increased level of integration into the global economy has shown to be a key driver of productivity and growth [
1,
2]. In this regard, simplifying the process of the movement of goods between countries and reducing trade transaction costs is of paramount importance. Trade facilitation actions that reduce the costs of engaging in international trade must be at the core of long-term development policy in developing countries. The Economic Community of West African States (ECOWAS) region of West Africa is not an exception to these market forces.
The main aim of this study is to estimate the annual economic welfare gains for the coastal member countries of the ECOWAS that can be achieved through the implementation of possible reforms to eliminate excessive trade compliance costs.
Economic welfare is a monetary valuation of the wellbeing of consumers and producers in a society. Changes in economic welfare because of trade facilitation refers to the monetary value that consumers would benefit from lower prices of imports plus the monetary value of the change in profits that producers accrue because of the reduction in the costs of doing business brought about by trade facilitation interventions. Economic welfare is measured by applying the principles enunciated by Harberger as the three basic postulates for applied welfare economics [
3].
The focus of this research is on the reform of a series of administrative functions—border compliance and documentary compliance—whose economic costs can be greatly reduced without bearing significant investment costs. These procedures’ time and costs are recorded annually by countries through the Ease of Doing Business Survey of the World Bank. Border compliance is the time and cost associated with a country’s customs clearance, an inspection of goods, and handling at ports or borders. The latter, documentary compliance refers to the associated time and cost of compliance with the required documentation to ship goods from the country of origin in order to reach the destination country [
4]. Trade facilitation measures are reforms to simplify, standardize, and harmonize the laws, regulations, procedures, and processes of border movement and customs clearance of trading merchandise. The ultimate objective is to achieve a faster, more transparent, and secure system for carrying out trade transactions [
5,
6,
7,
8,
9]. The decrease in time and cost of trading makes possible connections to the global production [
10]. That can be lead to an improvement in the welfare of the residents of ECOWAS economies.
To the best of our knowledge, no study has estimated how trade facilitation and the reduction of compliance costs contribute to the economic welfare of the residents of ECOWAS countries. In addition, this study addresses comprehensively the contribution that trade facilitation brings through improving the efficiency of the country’s tradable goods sectors, to achieve its sustainable development goals. This paper both quantifies the impacts of a specific set of trade facilitation reforms on regional trade integration, the volume of exports, imports, and economic efficiency gains. It also makes the link between these reforms and the Sustainable Development Goals (SDGs) of the country. A traditional analysis of the economic welfare gains from reducing import tariffs is carried out to compare the magnitudes of the trade flows and economic welfare impacts of a major tariff reform with that of a benchmarked reform of trade administration. We are not aware that such an analysis has been conducted to date by other researchers.
Reforms on trade policies and cutting red tape at the borders serves to reduce trade transaction compliance costs associated with the administration of international trade flows. A reduction in these costs will result in lower prices for consumers buying imported goods. Particularly for small and medium-sized enterprises (SMEs), the lower trade administration costs associated with exports will enable more of them to be able to enter global markets. Trade facilitation improves the control and safety of a country, leading to improved business conditions that will enhance the inflow of foreign direct investment (FDI) [
1,
6,
8,
10,
11,
12].
For the ECOWAS countries, trade facilitation is an important tool to achieve the dimensions of the SDGs of the United Nations 2030 Agenda. This Agenda has five dimensions of people, planet, peace, partnership, and prosperity, which are set out in the form of 17 goals [
13,
14,
15]. The goals are considered guidelines for a sustainable future [
16]. Trade facilitation contributes toward the realization of the development goals, particularly on poverty and hunger reduction, and sustained economic growth [
13].
The need for trade facilitation is greater in Sub-Sahara Africa (SSA) than elsewhere because of the heavier burden of trade costs that are currently present in SSA relative to the rest of the world [
17,
18,
19,
20]. The past two decades have been accompanied by a variety of successful trade facilitation interventions in SSA countries. The main focus of much subsequent research has been dedicated to estimating the potential extent that international trade flows can be stimulated by a reduction in trade-related costs.
The ECOWAS was established on 28 May 1975 via the Treaty of Lagos. The community, located in the Western Africa region comprises 15 member countries: Benin, Burkina Faso, Cape Verde (Cabo Verde), Cote d’Ivoire (Ivory Coast), The Gambia, Ghana, Guinea, Guinea-Bissau, Liberia, Mali, Niger, Nigeria, Senegal, Sierra Leone, and Togo [
21,
22].
As of 2019, more than US
$650 billion or about 40% of the total gross domestic product (GDP) of SSA is produced by ECOWAS countries. The major contributor to GDP in the region is Nigeria (US
$448 billion, 26% of SSA). Regarding international trade, 25% of the SSA’s merchandise import volume and 32% of its merchandise export volume are produced by members of the ECOWAS community [
23,
24]. These facts demonstrate how important the economic commission of ECOWAS is in SSA and in turn, how international trade is a significant factor in the economy of ECOWAS countries.
The ECOWAS members are heterogeneous in terms of population (ranging from 0.5 million people in Cape Verde to about 200 million people in Nigeria), the size of economy (with a range in GDP of US
$1.5 billion in Guinea-Bissau to US
$398 billion in Nigeria), colonial background, language, and culture. They also vary in income per capita of US
$414 in Niger to US
$3635 in Cape Verde, as of 2018 [
23,
24,
25]. Nevertheless, the ECOWAS countries are categorized in either the Low or Lower Middle Income group. All members, with the exception of Cape Verde and Nigeria, are listed as the heavily indebted poor countries (HIPCs) [
26].
The vision of the ECOWAS Commission is a borderless region in which everybody is able to take advantage of similar opportunities to exploit abundant existing resources under a sustainable environment [
21]. The ECOWAS Treaty, revised in 1993, has defined its aims as establishing an economic union to provide economic stability and enhance the living standards of the people in West Africa. It specifies the necessity of removing obstacles to free movement of goods, services, and people, and also the application of common social, financial, and economic policies for integrating economies to establish a Free Trade Area, a Customs Union, a Common Market, and eventually a Monetary and Economic Union to reach the aims of the community [
22,
25,
27].
In order to deepen the economic integration process, the ECOWAS Trade Liberalization Scheme (ETLS) came into existence in 1979 to address protocols on free circulation of goods in the free trade area, and to establish a customs union. Agricultural and artisan handcrafted goods and unprocessed products were initially covered by ETLS, and later, in 1990, this was extended to industrial goods [
21,
22]. With the objective of establishing a customs union in West Africa in line with article 3 of the revised ECOWAS Treaty, there should be a common trade policy vis-à-vis third countries. Hence, the ECOWAS Common External Tariff (CET) was adopted on 25th October 2013, to set identical customs duties and non-tariff barriers to goods crossing community borders. The CET has structured duty rates as follows: 0% (Basic Social Goods), 5% (Basic Goods, Raw Goods, and Capital Goods), 10% (Inputs and Semi-Finished Goods), 20% (Finished Goods), and 35% (Specific Goods for Economic Development) [
28,
29].
Despite the formal commitment, the financial-economic integration, and the freedom of movement, the trading bloc of ECOWAS continues to face impediments with poor leadership, weak infrastructure, and a low level of intra-regional trade. The cumbersome customs procedures and complicated border procedures with high trade compliance costs have resulted in a significant amount of informal trade [
30,
31,
32], all together, caused that economic growth in the region to do not well translate to improve inclusive development [
33]. Hence, the contribution of trade facilitation measures complements the ECOWAS CET and its trade liberalization policies [
34].
2. Literature Review
World Trade Organization (WTO) members opened a discussion on trade facilitation during the first WTO Ministerial Conference in Singapore, 1996. After eight years of explanatory work, members began negotiations in 2004, and concluded the negotiations by adopting the text of the Trade Facilitation Agreement (TFA) at the ninth WTO Ministerial Conference in 2013. Following ratification by two-thirds of WTO members, TFA came into force in 2017. By January 2020 the TFA had been ratified by more than 85 per cent of the 41 WTO member countries from Africa [
9,
10,
35].
Trade facilitation policy plays a decisive role in the performance of the economy. Among policy measures for enhancing economic growth, trade facilitation is particularly imperative due to its direct impact on international trade costs [
1,
36]. In two studies, covering 35 and 52 African countries that assessed the impacts of trade facilitation and international trade on economic growth, respectively, Sakyi et al. (2017) and Sakyi and Afesorgbor (2019) found that economic growth will be affected by international trade, which can be increased through extending trade facilitation measures [
1,
37]. There is a growing body of research that has explored different features of trade facilitation and their impacts on bilateral trade in SSA [
36,
38,
39,
40]. Balistreri et al. (2018) measured the effects of trade cost reduction on poverty and incomes of the bottom 40% of income distribution in the East African Customs Union and the Tripartite Free Trade Agreement [
39]. Valensisi et al. (2016) considered the TFA in Africa’s regional integration framework. The extent to which trade facilitation measures could enrich participation in international trade was assessed, and how trade-related costs hinder not only integration into the rest of the world but also regional integration [
38].
In the context of the Regional Trade Agreements (RTAs), there have been extensive studies [
41,
42,
43]. Since the independence of African countries, many RTAs have organized to accelerate the sustainable development of regional economic interactions. RTAs based on putting greater effort into cooperation and liberalization can take place in different integration phases of the preferential trade area, free trade agreement, customs union, and an economic union [
44]. RTAs are strategies to improve the trade ties between members. With the aim of liberalising trade flow through regional integration and economic cooperation, 15 countries in western Africa combined to form the ECOWAS Commission. This large trading bloc has a population of over 375 million people [
12,
23].
Since its inception, ECOWAS’ desire has been to provide a united, secure sub-region that lessens poverty and promotes sustainable development [
29]. G. Odularu and A. Odularu (2017) stated that RTAs are strongly correlated to trade facilitation, and Cissokho et al. (2013) stated there is a strong relationship between the adoption of trade facilitation and acceleration of economic development [
12,
45]. In so doing, the ECOWAS countries have deployed trade facilitation measures to promote inter and intra-regional trade and to realize their aim for economic integration [
12,
21,
45]. For instance, some members have implemented destination inspection and scanners to protect against security risks [
12].
Olayiwola et al. (2015) by using a dynamic gravity model to estimate the impact of trade facilitation, proxied by required processing days, on ECOWAS agricultural exports, found that a 1% decline in the number of days to process the export of agriculture commodities correlated with an expansion of approximately 0.07% of agricultural exports [
46].
Odebiyi and Alege (2019) identified that to increase trade flows under RTAs, not only are liberalization and elimination of tariffs required but also the adoption of trade facilitation policies. A similar pattern was observed in the ECOWAS community that tariff reduction would not result in a significant increase in the volume of intra-regional trade. They found that sub-regional trade was significantly affected by bilateral trade costs [
31]. A combination of lengthy customs procedures, poor logistics performance, lack of transparent information, and excessive documentation requirements are of the dominant trade barriers existing in ECOWAS [
7,
13,
31,
34,
47].
The ECOWAS countries also struggle with high levels of unrecorded informal trade, as a consequence formal intra-regional trade accounts for a relatively small percentage of the community’s total trade [
31,
32,
34,
48]. Formal trade is averaging 11% of total trade, which is several times less smaller than the average rate of intra-trade for Europe’s economic union (66%), between 2001 and 2014 [
31]. These may indicate that ECOWAS members are suffering from high trade-related costs [
25]. The relatively high burden of the cost of customs clearance and border procedures drives up the cost of trade, making potential exports uncompetitive, and thereby erodes their ability to integrate into global value chains [
12,
25,
49].
The ECOWAS region has a weak trade complementarity among its members. They produce similar primary commodities concentrated on oil, gas, and primary goods. Local producers seem to have a low level of comparative advantage as compared to trading countries beyond ECOWAS territory [
25,
48]. Nigeria, a large, dominant ECOWAS economy, is the largest producer of oil in Africa. To drop its dependency on oil would require it to diversify its export product market. Therefore, an array of possible opportunities for the trade would happen if industrial infrastructure capacity were to be enriched [
47,
50].
Torres and Seters (2016), in an overview study of West African trade, point out that the ECOWAS Treaty is an ambitious RTA but has not in actual fact implemented its commitments. Community members are also facing official and unofficial barriers to trade and a poor level of infrastructure that negatively affects trade flows. Approximately 75% of intra-region trade is informal trade, carried out by small traders, mainly females, to escape costly, time-consuming, and unpredictable border procedures. The study demonstrates the need to pay particular attention to trade facilitation [
48].
After reviewing the current research in this field, Hoekman and Shepherd (2015) concluded that while the studies assessed the potential effects of trade facilitation on export diversification and the volume of trade in Africa, very little direct quantitative assessment had been carried out on its economic welfare impacts [
51]. In light of the importance of trade facilitation, the following section will explore the possible impacts of the economic welfare gains from trade facilitation on achieving sustainable development goals for ECOWAS.
3. Sustainable Development Implications
In the context of regional trade agreements, West African countries can contribute through the implementation of trade facilitation towards achieving sustainable development goals, both directly and indirectly. As defined by the United Nations, international trade is the means of implementation of sustainable development goals [
14,
52]; hence, the facilitation of trade is of great importance to the achievement of the SDGs across many of its objectives.
Trade facilitation streamlines and increases international trade and, as a result, brings about the availability of more goods that are important for the aims of food security and eradicating hunger and poverty (SDG
1: No poverty and SDG
2: Zero hunger). Meanwhile, trade facilitation allows trading to take place in less time. This is becoming increasingly important for agricultural goods and intermediate inputs, as more perishable goods are being traded and prevents wastage (supporting SDGs
1,
2, and
12). Furthermore, trade facilitation provides producers with the input factors that are needed for competitive production of goods that are intended for both local consumers and/or export. New exporting producers are enabled due to the reduction of the administration costs for exporting goods (SDG
12: Responsible consumption and production and SDG
8: Decent work and growth) [
14,
15,
52,
53,
54].
Enhancing trade results in the transfer of technologies, fostering efficient usage of resources, and encouraging competition which brings about productivity gains and growth for the economy (SDG
9: Industry, innovation, and infrastructure and SDG
8). Improving infrastructure is a part of the reforms for facilitating trade, which itself brings about the improvement of development (SDG
9). One of the trade facilitation indicators, the Logistic Performance Index, is one of the indicators of sustainable development for evaluating SDG
9. One of the main impediments of ECOWAS borders is informal trade by small producers, of whom many are females. Easy and less costly border administration would secure borders and, meanwhile, make exportation affordable for females (SDGs
16 and
5 are to promote peace and empower females) [
14,
15,
52,
53,
54].
The ECOWAS regional trade agreement was signed by many countries that have backgrounds of conflicts, face border issues, have a large dependency on external finance, and suffer poverty. The aim of integration is to increase intra-regional trade, enjoy a peaceful and secure environment to share their culture and resources and to synergize their benefits (SDG
16: Peace, justice, and strong institutions and SDG
11: Sustain cities and communities). Transparent and simple market access as a result of integration and trade facilitation would moderate inequality within and among the countries (SDG
10: Reduced inequalities) [
14,
15,
21,
27,
52,
53,
54].
In the 2030 Agenda, international trade is recognized as being fundamental for promoting inclusive economic growth, poverty reduction, job creation, income rise, and enhanced welfare of people [
14,
52]. The final goal, SDG
17, is to “Strengthen the means of implementation and revitalize the global partnership for sustainable development”. Promoting a universal non-discriminatory multilateral trade system through global partnership is one of the SDG targets [
55]. Hence, trade facilitation is a key component for the implementation of these development goals, SDG
17 in particular.
Integrated West African countries would be able to contribute to fostering the sustainable development goals via deeper integration and employment of trade facilitation, thus bringing about economic welfare gains to their economies.
In attempting to measure the importance of trade facilitation, the following parts of this paper are allocated to specify the model, explain the estimation methodology, and analyse the data empirically to quantify the potential benefits to be gained through trade facilitation measures affecting importation and exportation.
4. Model Specification and Methodology
Different models of international trade have been used in order to estimate the consequences of trade facilitation on trade flows. Many researchers employed gravity equations to measure quantity changes in exports and imports that could be realized by decreasing costs through trade facilitation measures [
18,
36,
56]. Some studies have undertaken firm-level assessments of these impacts via econometric estimates of firms’ comparative responses across countries [
2]. CGE models have been used in some other studies to estimate how the volume of trade flows would change and what the impact of trade facilitation is on poverty groups [
39], and on regional integration in Africa [
38].
A partial equilibrium model that has been applied in many studies is the World Integrated Trade Solution (WITS)-SMART Model developed by the United Nations Conference on Trade and Development (UNCTAD). It permits one to obtain an approximate measurement of the change in consumer surplus from trade policy changes. This model has been used to evaluate the welfare impacts of signing the African Continent Free Trade Area (AfCFTA) on food sustainability in the Southern African Development Community (SADC) [
57]. The demand elasticities employed in the current versions of the WITS-SMART simulation model are those proposed by Kee, Nicita, and Olarreaga (2008) [
58]. Nevertheless, the default assumption of the model is that export supply elasticities are infinitely elastic. This assumption reduces the usefulness of the model when estimating economic welfare changes that involve changes in the trade costs facing exporters.
The present study, by taking the benefit of up-to-date sets of general equilibrium estimates for both import demand and export supply elasticities of each country [
59,
60], utilizes a partial equilibrium framework. These estimates are derived using the GDP work approach as developed by Kohli (1991) and Kee et al. (2008) [
58,
61].
A major advantage of our approach is that the analysis is based soundly on the three basic postulates of applied welfare economics [
3]. This theoretical framework has been well tested over a period of decades in the economic analysis of numerous international trade policies. The estimation procedure is transparent and can easily be subjected to a sensitivity analysis to test the reliability of the results. This is a very great advantage as compared to the construction of many CGE models, where the bulk of the parameters are not derived from the country in question but are assumptions transferred from estimates made for other countries. In our analysis, the key elasticities of supply of exports and demand for imports are country-specific and estimated by employing the data for the specific country [
59,
60].
4.1. Import Compliance Costs, Tariffs and the Demand for Importation
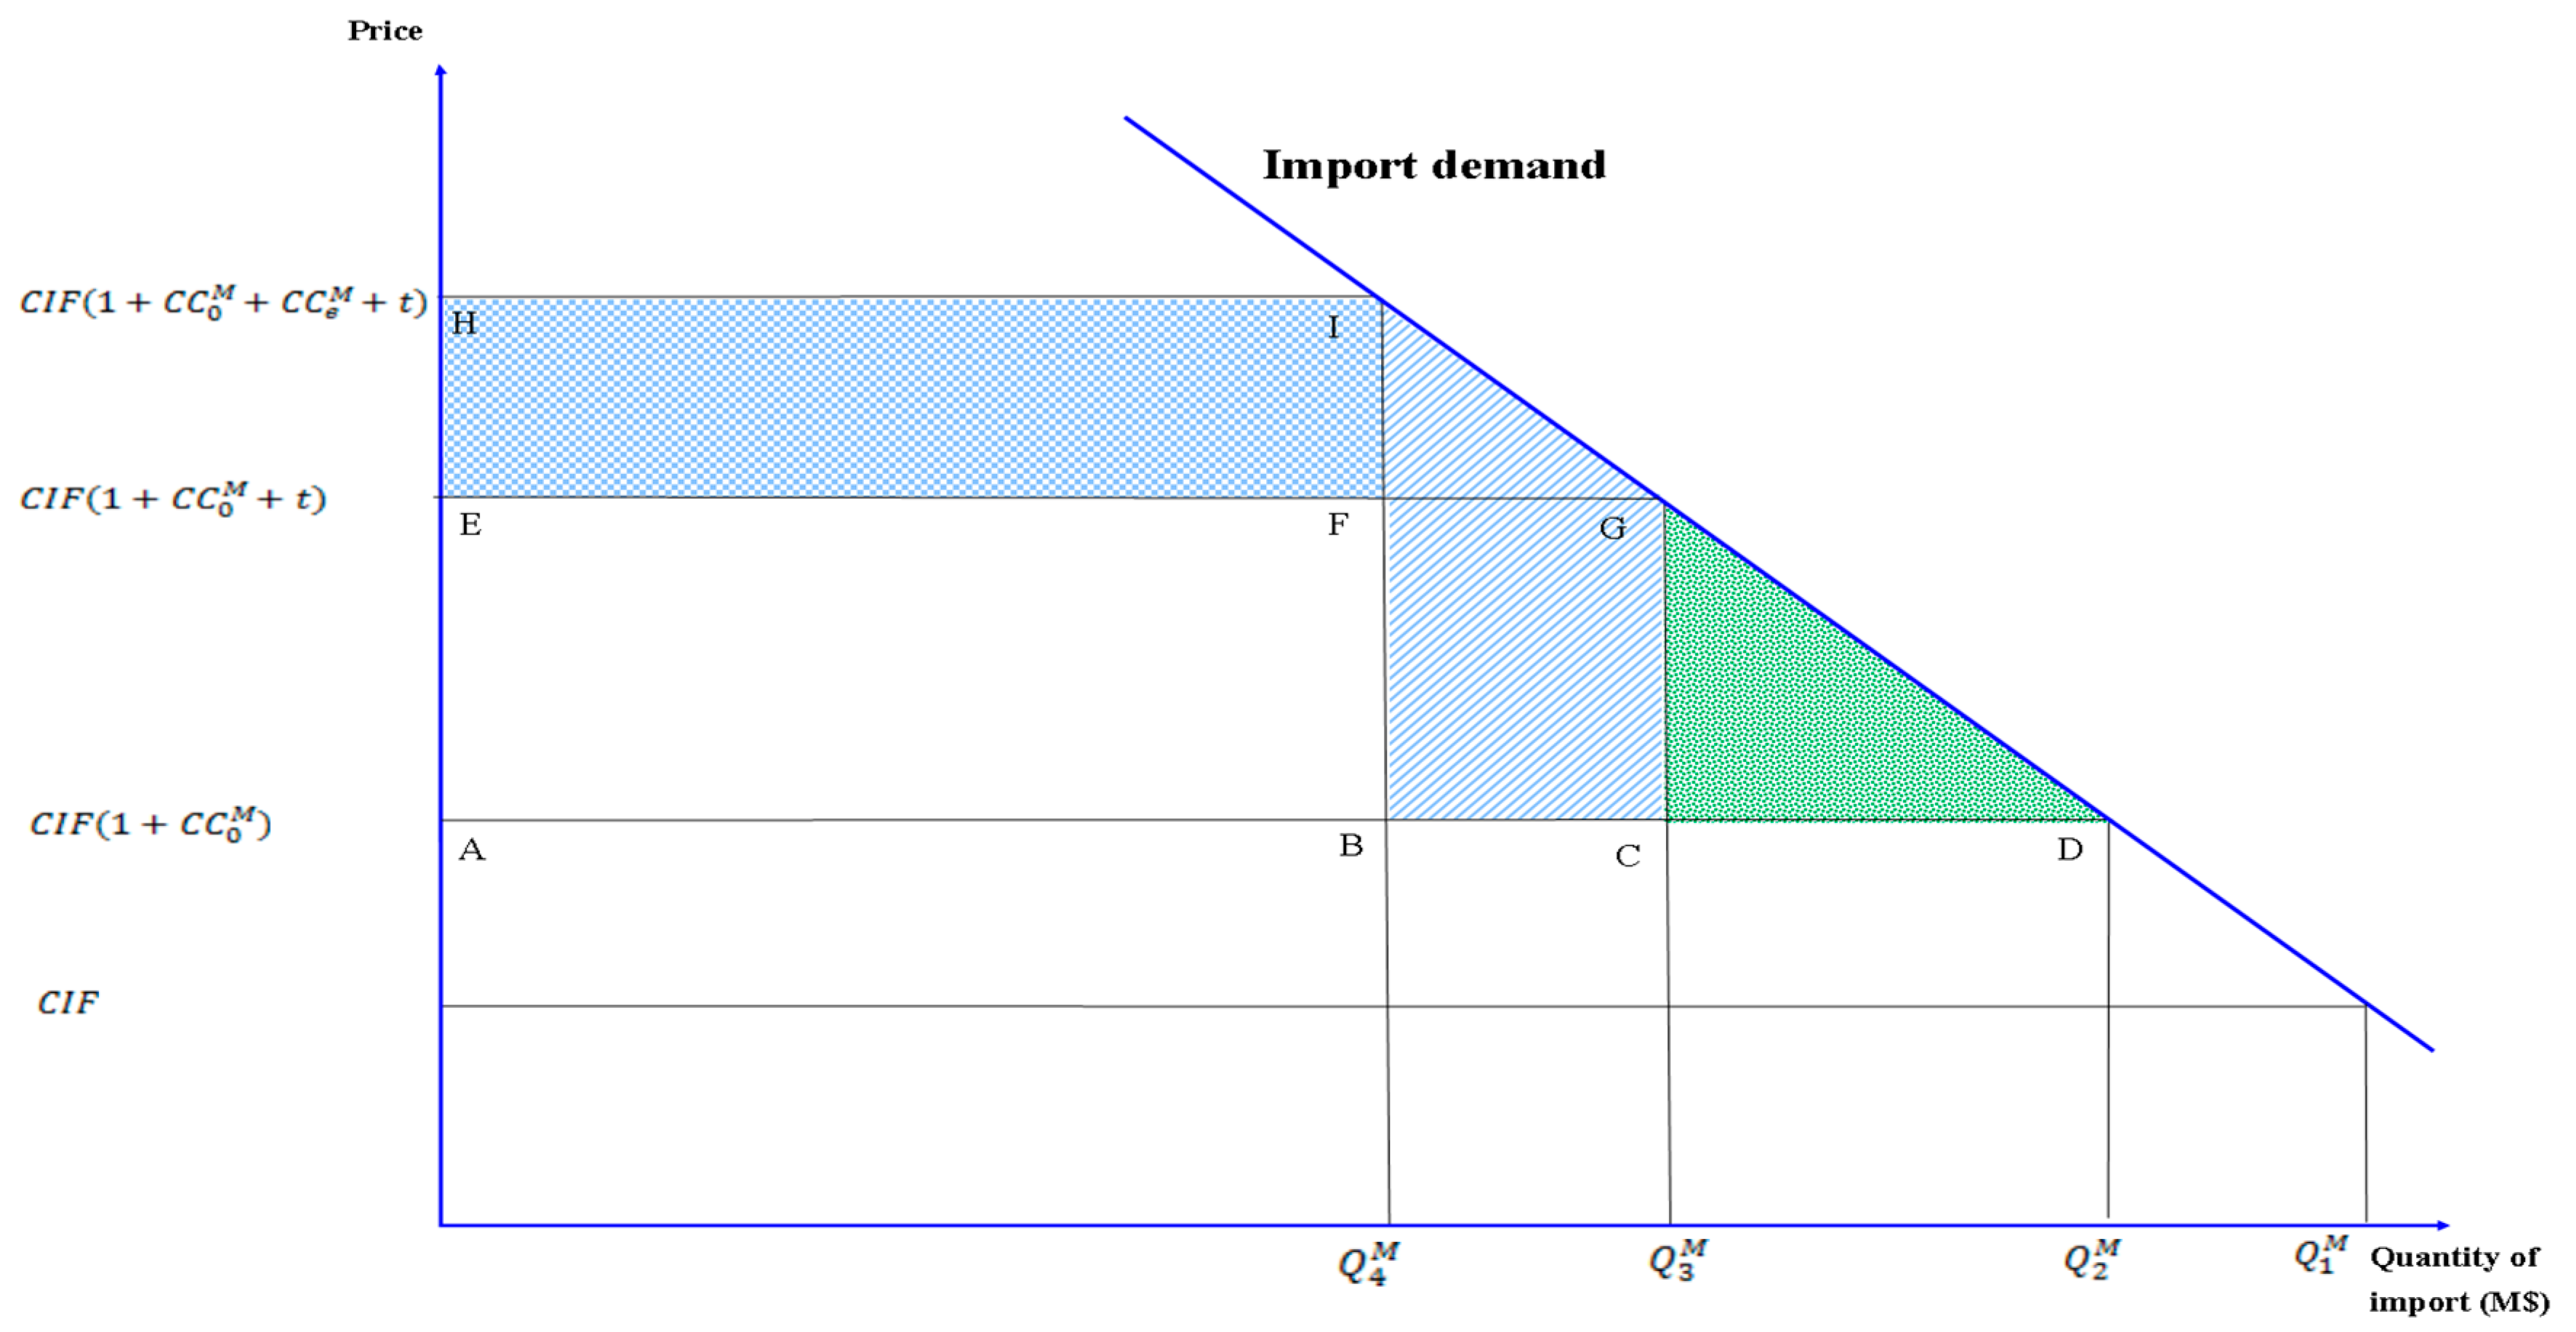
Figure 1 illustrates the nature of the effects of tariffs and compliance costs of imports on the quantity of imports, tariff revenues, and efficiency of the economy. The quantity of import demand in the case of non-existence of domestic marketing costs, domestic freight, import tariffs, and import compliance costs are determined through the demand function of imports and the CIF price of imports at the border of the importing country. As the focus of this research is on the effects of tariffs (t), and the compliance costs of administration of international import flows (CC
M), we are setting aside issues associated with domestic marketing costs and differential domestic freights. The analysis begins by identifying the level of imports, including both final goods and intermediate goods, which would be demanded in a market that is not subjected to tariffs or trade compliance costs. This level is denoted as
.
The importation of goods, even in the most efficient circumstances, accompanies with some rate of requisite compliance costs of import (
). The total
, observed for a country, comprises the minimum rate of compliance costs to import that is normal for an efficient administration system (
), and the excess rate of compliance costs (
). Equation (1) expresses this relationship for a country.
is the rate of compliance costs to import that can be eradicated through the launch of administrative reforms. Although is observable for a country, is not. Though, the rates of of other countries that have implemented trade facilitation reforms for an efficient system are observable. Therefore, in our analysis, the observed rates of those efficient countries are used as benchmark rates of.
Adding the efficient rate of import compliance costs,
to the CIF price will increase the cost (price) of import for a country. That causes a reduction in the quantity of merchandise imported from
to
. Moreover, imposing a tariff (t) on the CIF price of imports will increase the price paid by domestic consumers for those imports leading to a further reduction in demand quantity of imports from
to
. Any rate of excessive compliance costs,
, will raise the cost of imports and therefore affect the demand quantity of imported goods to drop to the level of
, as shown in
Figure 1. The level of
is the quantity of imports reported as international trade statistics.
In the pre-reform scenario, the price of imported items can be stated as, wherein the compliance costs of import can also be determined as a percentage of the CIF value of imports. By holding the assumption of small ECOWAS member countries, the level of imports demanded by these countries will not influence world prices of goods imported. Consequently, the level of imports can be declared in units of foreign exchange; thus, CIF is specified as being equal to one.
Implementing the reforms on administration procedure for removal of
would decrease the cost of a unit of imports to (
) and bring about a rise in the level of demanded imports from
to
. Equation (2) expresses the change in the level of imports, which is denoted as
.
ɛM is the demand elasticity of imports and is the percentage change in the price of imports if excess compliance costs of import are removed.
The economic welfare gain obtained from the removal of
ensues from two sources. The first welfare gain (∆
G1) comes from the lower cost for importing those quantities of merchandise being imported prior to the reforms. This is illustrated in
Figure 1, by the EHIF rectangle, which is an indication of a decrease in real resources used in the required administrative process of importing goods. This saving of resources can be measured as in Equation (3).
The second economic welfare gain, ∆G, arises from the rise in the quantity of demanded imports by
. Because, after the reform, the price of imported goods paid by consumers will drop from (
) to (
), the ensuing additional volume of imports from the lower price charged to consumers would have a resource cost of only (
). This gain in economic welfare is presented as the summation of areas BFGC and FIG in
Figure 1, and its estimation can be via Equation (4).
The area of BIGC in
Figure 1 is depicted as the difference between the total willingness of customers to pay for further quantity demanded (
) and further imports’ economic costs (
BC).
Having replaced Equation (2) into Equation (4), ∆G
2 is as
The total gain in economic welfare that comes from trade facilitation to eradicate excessive compliance costs of the import process is stated in Equation (6).
Within the case of imports, there is a long tradition of research on tariffs and their inefficiency costs. Assessing the economic welfare costs of a tariff can provide a comparison of the relative size of the economic inefficiency sources of tariff and trade compliance costs.
The economic inefficiency of import tariffs can be seen in
Figure 1, by the area of CGD. To quantify this familiar triangle of welfare cost, one should take into account the change in the quantity of imports demanded if the tariff has been withdrawn
, which is expressed in Equation (7).
The economic welfare gain of eliminating tariffs,
Gt, can be measured by Equation (8).
4.2. Export Compliance Costs and the Supply of Exportation
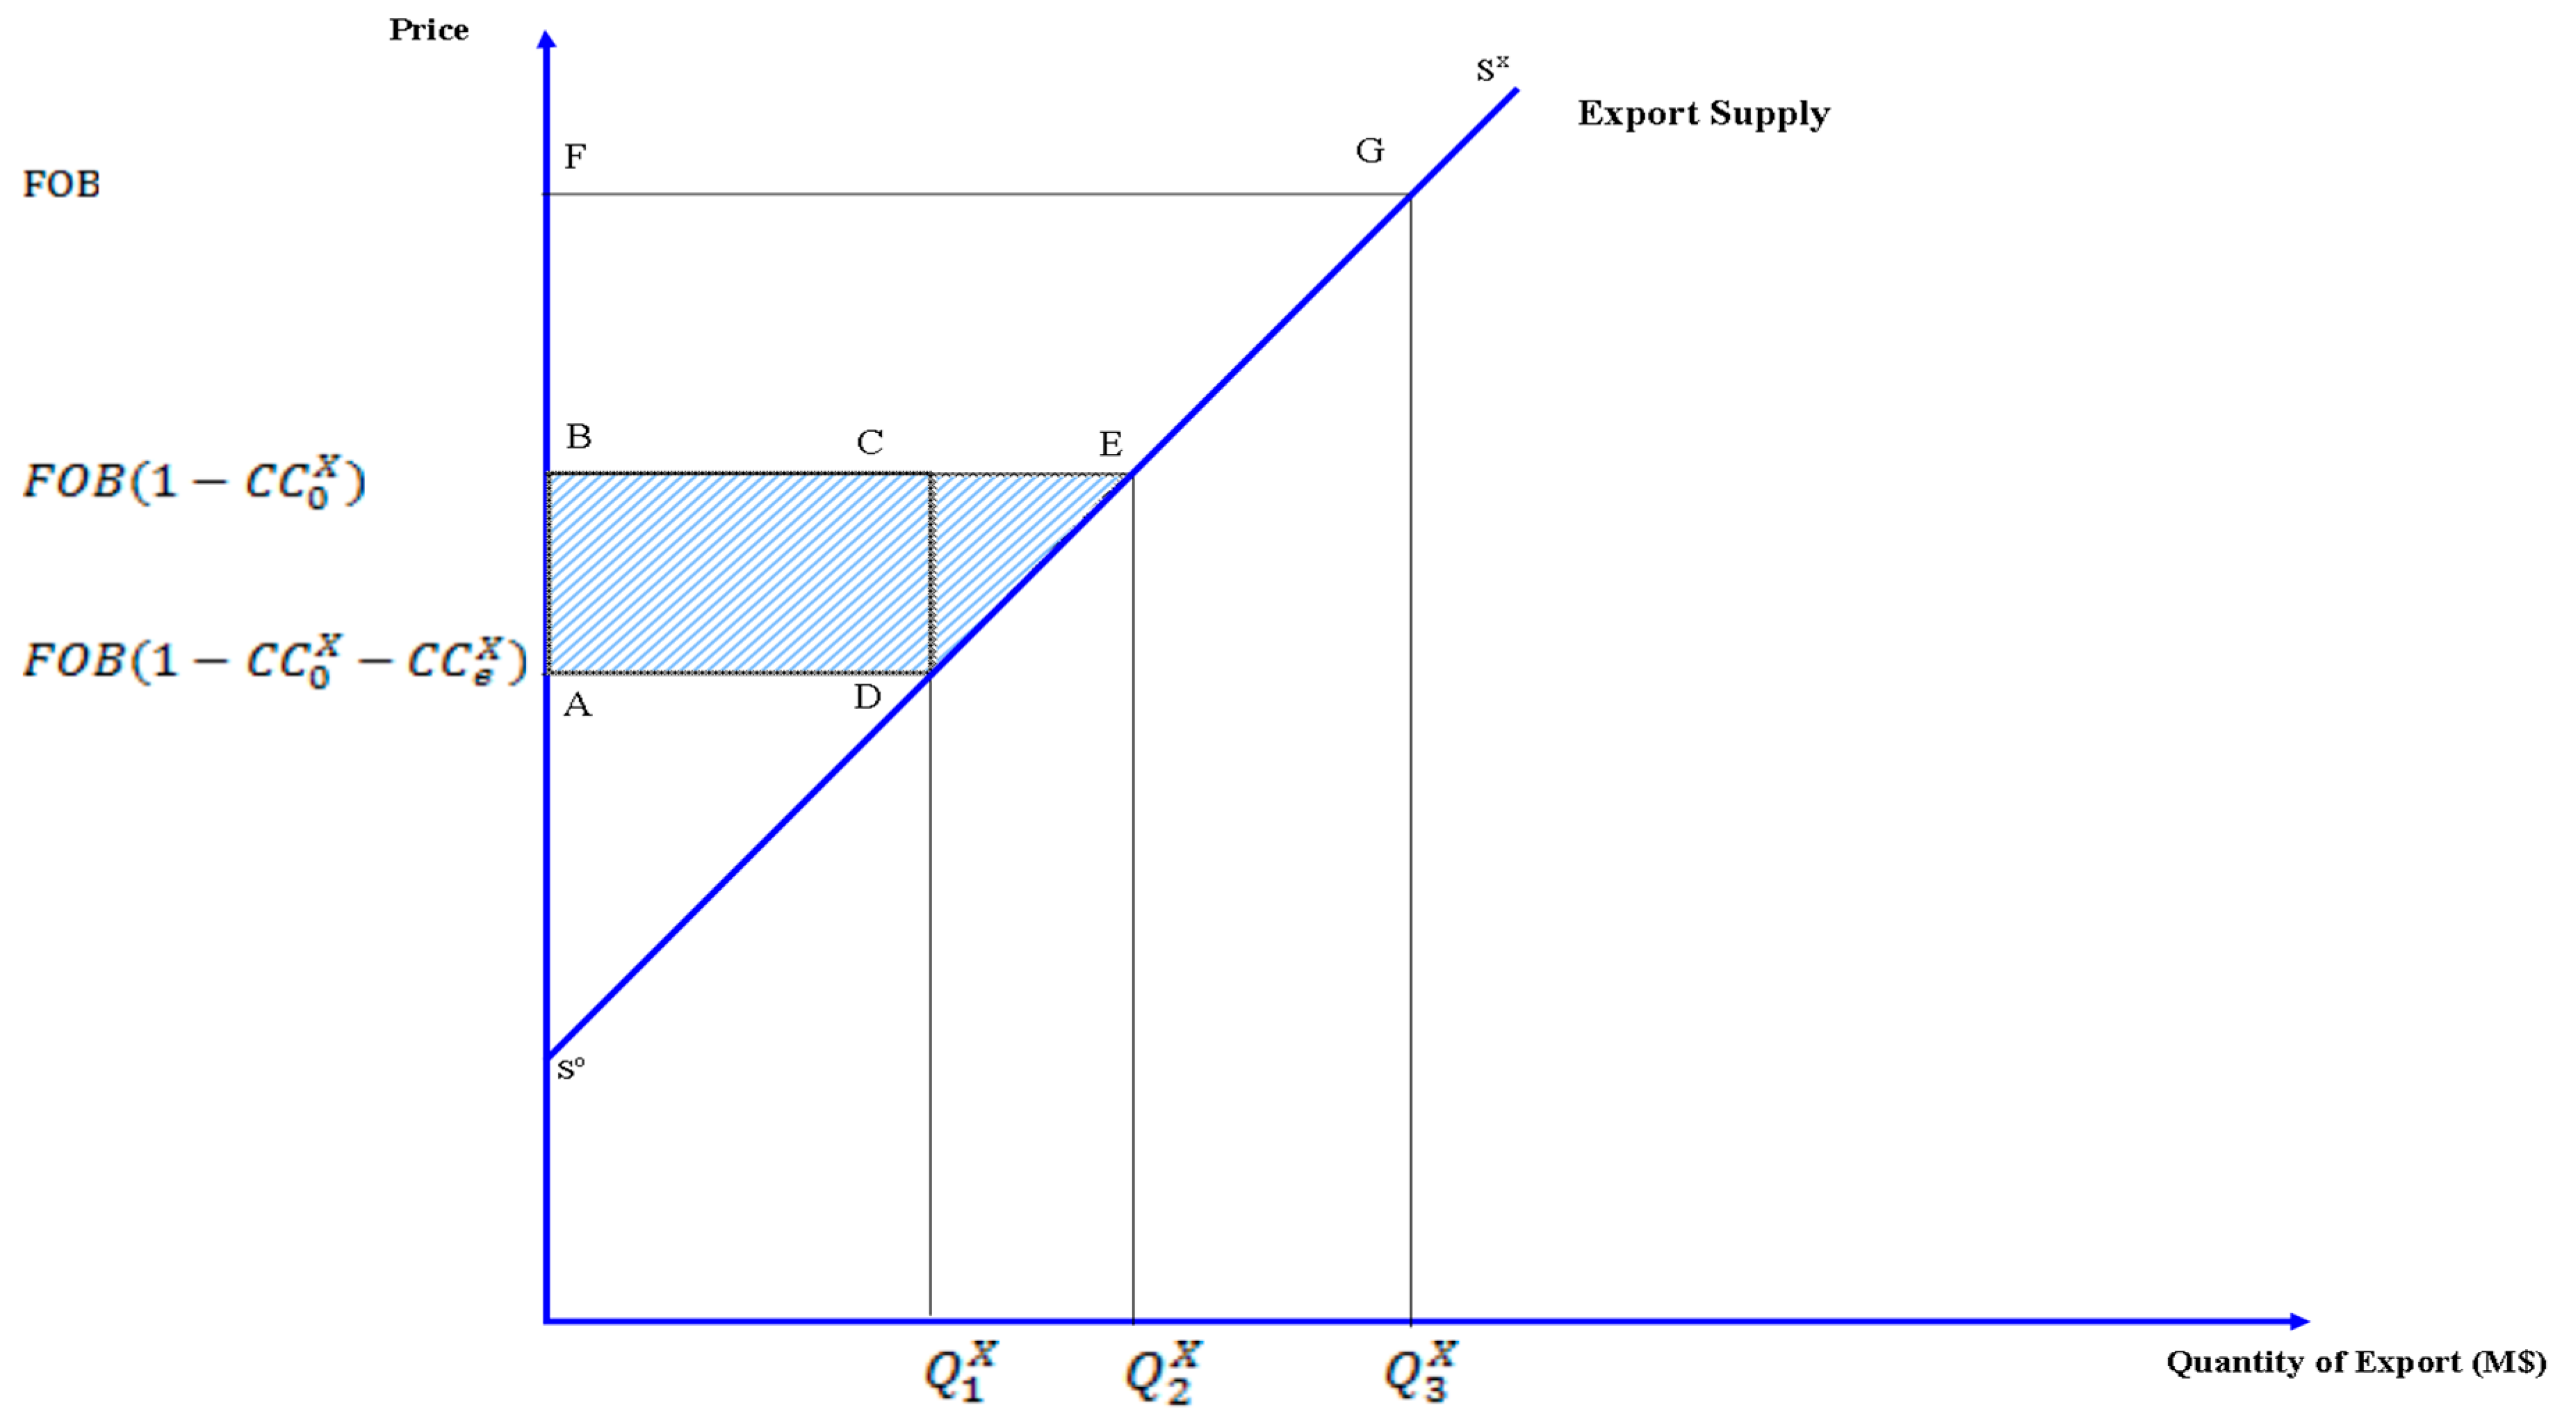
Figure 2 represents a similar framework that can be used to illustrate the effects of export compliance costs on the quantity of export and its impact on economic welfare. Where there is non-existence of compliance costs, the exporter would receive the free on board (FOB) price. The volume of exports can be expressed in foreign exchange units, with the FOB price defined as equal to one. Given the export supply function, S
oS
x, the level of export can be shown by
.
In contrast, when a country imposes a rate of transaction costs on exports,
the exporters would receive the net remuneration that has fallen to
and would export a lower quantity,
. Presuming
as an efficient rate of export compliance costs, the total quantity of exports would be
, at this rate. The relationship between these rates of administrative compliance costs to export is identified in Equation (9).
is the excessive export transaction costs that can be eradicated from the trade administration procedures.
Since compliance costs of exportation are also calculated as a percentage of its dollar value, the remuneration received by the domestic producers of exportable goods, net of the export transaction costs, would be (
). By implementing reforms to eliminate the
, the remuneration received for a unit of export by the producer will rise to (
). Therefore, the supply of exports would rise from
to
, indicated by
. Equation (10) is the expression of this supply response.
In which, ƐX is the export supply elasticity and is the percentage of change in the price of exports if excessive compliance costs of export are removed.
Economic welfare would be developed by eliminating excessive compliance costs of export because fewer resources would be used for export of the current level of goods. This welfare gain from the alleviation of excessive compliance costs is depicted in
Figure 2, by the rectangle ABCD that can be estimated via Equation (11).
A further welfare gain is achievable as a result of higher export producers’ prices. The source of this economic welfare, shown in
Figure 2, by the triangle area of DCE, is a rise in the quantity of exportation. The economic value received net of compliance costs from additional export sales (
CE
) is greater than the marginal cost of additional production (
DE
), which creates this economic gain of ∆G
4 that can be quantified by using Equation (12).
Therefore, the total area of ABED, in
Figure 2, represents the totality of economic welfare gained from the elimination of excessive export compliance costs. The expression of this gain, as shown in Equation (13), is the summation of the results of Equations (11) and (12).
In the current study, estimation of these economic welfare measurements is made for a trade administration reform by ECOWAS members.
5. Data and Empirical Analysis
To carry out the empirical estimates in this paper, the data on international trade for each coastal ECOWAS country is utilized. Data on merchandise imports and exports has been collected from the Direction of Trade Statistics issued by the IMF [
24]. The time and monetary costs of compliance associated with import and export are compiled from the World Bank’s Doing Business report [
62] and the rates of weighted average tariffs on imports have been gathered from the WB [
23]. Import elasticities of demand are acquired from the study by Ghodsi et al. (2016) which estimated elasticities for 167 countries using the semiflexible translog GDP function approach proposed by Kee et al. (2008) [
58,
60]. Export supply elasticities used in our analysis are the average elasticities of long-run export supply for each country adjusted for including the general equilibrium impacts of price changes, which have been estimated by Tokarick (2014) [
59].
The Doing Business survey excluded gems, precious metals, and oil products in the process of calculating compliance costs of exports. The coastal ECOWAS countries’ export data used in our study has also been adjusted to exclude the percentage share of these groups of goods according to the data extracted from the World Integrated Trade Solution database (WITS) [
63]. The cross-border values for ECOWAS trade, which are subject to trade compliance costs (CC), are reported in
Table 1, columns 1 and 3 (column 2 is a representation of the total value of exports before adjustment). The data indicate that Nigeria, Ghana, and Ivory Coast are respectively the three largest economies of the region, contributing more in merchandise trade as well. The weighted average rate of tariffs and the elasticities of import demand and export supply for each country are respectively presented in
Table 1, columns 4, 5, and 6.
In order to estimate the magnitude of excessive compliance costs of trade, the total import/export compliance costs of a shipment of goods should be measured for each of the ECOWAS countries and then compared with that of the benchmarks.
5.1. Trade Compliance Costs to Import
In the present study, we only focused on border and documentary compliance costs of trade. The total compliance time and cost to import are reported in
Table 2. The first two columns are the hours and USD value of compliance time to import. The total time to import is found by the summation of border and documentary compliance hours (
Table 2, column 1) [
62]. Taking into account the total time hours of delays for a shipment of imports, the average value of the shipment and the capital cost of waiting time are required to estimate the average monetary value of waiting time for a shipment of merchandise imports into a country. This relationship is expressed in Equation (14), as follows:
Based on the assessment of the World Bank on the cost of doing business, the average value of an import shipment is 50,000 USD [
4]. The real cost of funds for the importer for a one-year period (8760 h) is assumed to be 12%, on average. The result of the estimation of the total cost of waiting time for each country is reported in
Table 2, column 2. The total US dollar cost to import is the sum of border and documentary compliance costs, as of 2019, that is reported in column 3 [
62]. Following this, the values of costs reported in columns 2 and 3 are added together to derive the total compliance cost to import as presented in column 4. These values for each ECOWAS country can be expressed as a percentage of a standard shipment value of 50,000 USD (
Table 2, column 5). These compliance cost rates,
are what each of the countries imposes on a shipment of imports passing through official procedures of the ECOWAS countries ports. This research focuses only on the coastal members of the ECOWAS Commission.
Some degree of compliance cost must accompany the process of cross-border trade of merchandise to ensure the health and security of residents. A variety of trade facilitation measures taken around the world could considerably decrease these costs while enhancing the quality of the services provided by customs and other government trade organizations, that is a matter of the sustainable development goals [
8,
11,
14,
15,
64,
65]. Based on Doing Business assessments, the majority of West African countries have also carried out some reforms towards simplification of the process of moving goods [
64], but there is still a long way to go to meet efficient conditions for international trade flows crossing borders. For instance, Nigeria has decreased the time needed to import and export via the implementation of joint inspections and electronic systems in 2019 and through the launch of e-payment of fees in 2020 [
64]. However, it has the highest compliance cost rate amongst ECOWAS members that, on average, is 3.78% of the value of a shipment of goods (
Table 2, row 12, and column 5).
Comparing the total rate of compliance costs to import for ECOWAS countries revealed that The Gambia, Cape Verde, and Benin have the lowest rate of compliance costs in comparison to others in the community [
62,
64]. The Gambia and Cape Verde are the smallest countries of the territory with a surface area of only 11 and 4 thousand square kilometres, respectively, which have very low levels of GDP and population. Benin is the country that has Cotonou, one of the six major port cities in ECOWAS that the trade corridors emanated from them [
48]. Benin has undertaken various reforms in the area of the management of imports and exports related to border and customs procedures [
65]. These reforms consisted of the measures decreased the customs clearance time through the implementation of an electronic data interchange system in 2010, and customs integration via the implementation of an electronic single window system in 2013.
Benin improved its port management system and enhanced its port infrastructure in 2014. Benin also imposed new rules for the transit of trucks in 2014 and reduced the required documents for importation in 2015. It undertook further development on its electronic single window system in 2016 to enhance cross border trade for both importers and exporters [
64]. Hence, we chose Benin as a benchmark country in the region as it has a lower level of compliance cost to import, at 1.61% of the value of imported goods (
Table 2; column 5, row 3) [
62,
64]. The other country we considered as an appropriate performance target for ECOWAS members is Singapore, the successful forerunner of the Single Window system to facilitate international trade. A total compliance cost of import to Singapore is US
$284.66, which is only 0.57% of the value of a shipment of imported goods (
Table 2, row 13).
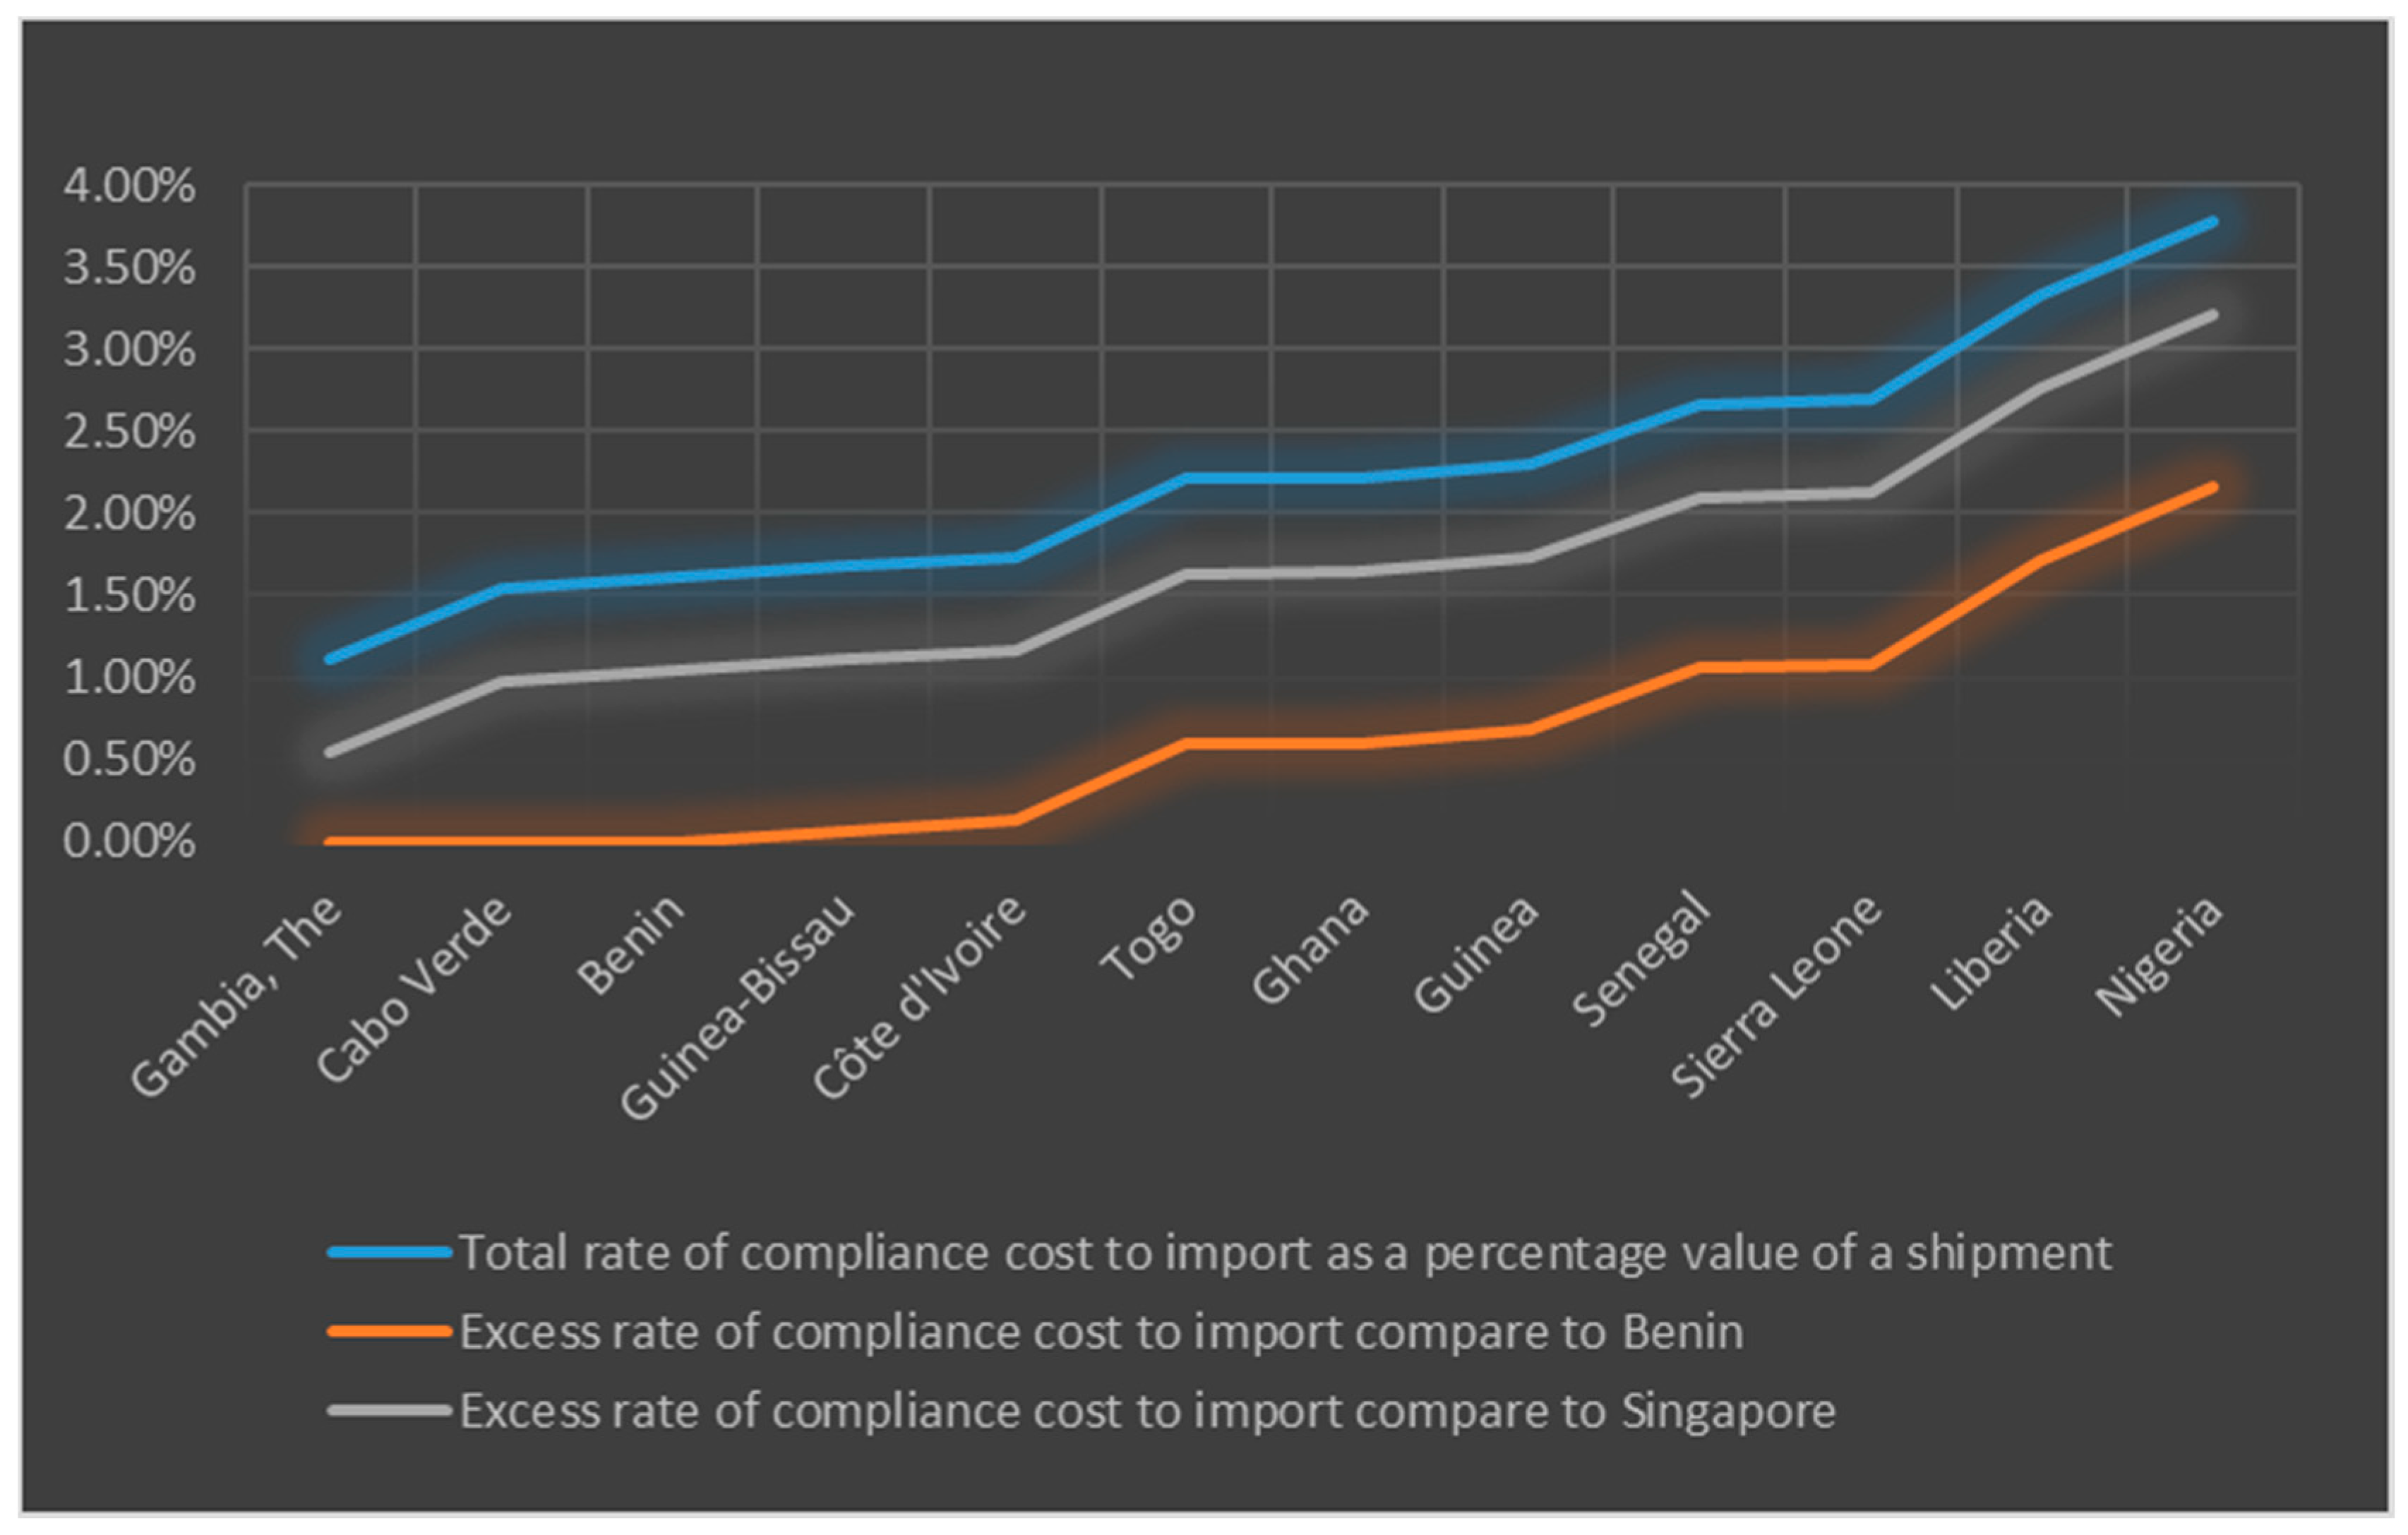
Columns 6 and 7 represent the amounts of inefficiency existing in ECOWAS countries in comparison to the benchmark countries. By subtracting the rates of compliance costs of the benchmark countries from the current rate of compliance costs of ECOWAS countries, the excess rate of compliance cost to import, (
), is realized. This can be removed through the implementation of trade facilitation reforms in the Commission. Using Benin as the benchmark for the normal value of compliance cost to import, the potential saving in the importation costs for ECOWAS countries would be between 0.06% and 2.17% of the value of imports, and where Singapore is a benchmark, trade facilitation reforms result in a wide saving range of 0.55% to 3.21% of the importation value.
Figure 3 presents both the rates of compliance costs as a percentage of the value of a standard import shipment and also the estimated excess compliance costs using as benchmark efficiency levels of Benin and Singapore. These three estimated parameter values are critical in determining the economic welfare gains from trade facilitation initiatives as they apply to the administration of imports.
By knowing the excess rate of compliance cost to import, tariff rate, the value of merchandise traded, and the demand elasticity of import, the impacts on the economic welfare of ECOWAS countries can be estimated for changes in the price of imports brought about by the elimination of trade distortions. The economic efficiency effects of reforms on import administration, expressed in Equations (3)–(7) for imports, are represented in
Table 3, columns 2, 3, 4, and 6, respectively. The first 13 rows present the economic impacts of using Benin as a benchmark, however, the following rows of section b represent when Singapore is used as a benchmark.
The first column represents the rise of between 2.30% and 3.90% in the quantity of demanded imports as a result of reducing import compliance costs, with the biggest increase being seen in Nigeria. The economic welfare gain from removing excessive compliance costs to imports is shown in column 2. The cumulated gain of saving of resources for ECOWAS countries is between US$1182 million and US$2077 million annually for the existing quantity of imports (column 2). An additional gain to the welfare of the economy comes about with an increase in the quantity of imports. This incremental economic welfare gain ranged from US$195 to US$354 million per year (column 3). Column 4 represents the summation of these estimated annual gains in the economic welfare of the Commission, which amount to between US$1377 million and US$2430 million. Around 70% of these economic benefits would occur for Nigeria.
A perspective of the relative magnitude of the economic gains from trade administration reforms can be revealed when these values compare to the welfare gains occurring after elimination of all import tariffs. The weighted average rate of tariff (
Table 1, column 4) is large relative to the potential decrease in the rate of import compliance costs (
Table 2, columns 6 and 7). Hence, the impact of eliminating import tariffs on the quantity of imports demanded is bigger, 14.62% versus 2.30%–3.90% (
Table 3, columns 2 and 5). Nonetheless, the economic gain from the complete removal of all import tariffs (Equation (7)), annually US
$615 million, is much less than the economic gain resulting from the reform of import administration (
Table 3, column 7).
The fundamental reason for this different economic welfare impact is that tariffs only create the traditional triangle deadweight loss of inefficiency as a result of a decrease in the consumer demand for importables and stimulation of producer supply of importables. The increase in government tariffs revenue is mainly borne by consumers as they face higher prices. Rather than being an economic welfare cost, this tariff revenue is a fiscal transfer to governments. In contrast, the compliance cost of trade administration is an economic resource cost for the ECOWAS community members.
5.2. Trade Compliance Costs to Export
Equations (8)–(12) are utilized to estimate the economic gains that would result from administrative reforms in the ECOWAS countries to reduce export compliance costs. In this regard, data is used on the quantity of export and supply elasticity of exports (
Table 1), along with the estimated compliance cost to export (
Table 4) of each country.
According to
Table 1, the export level of coastal ECOWAS countries has been adjusted to consider only non-fuel and non-precious metal goods, as Doing Business measured the compliance costs only of these product groups [
63,
64]. For Nigeria, oil and gas account for more than 94% of its export values, which have been excluded from our study. Fuel export values are around 25%, 16%, 15%, and 13% for Ghana, Senegal, Liberia, and Ivory Coast, respectively. Diamonds and precious metals amount to approximately 40%, 36%, 28%, and 16% of exports of Guinea, Ghana, Liberia, and Senegal, respectively, are included in this group [
63]. Thus, the focus of our investigation on the export side is to estimate the potential economic gains from trade facilitation reforms in the administration system of exportation for the remaining items.
By adding the direct compliance cost to export to the cost of the time spent to export, the average total compliance cost per shipment for merchandise exportation was calculated and ranged between US
$241 to US
$1674 (
Table 4, columns 1 to 4). The total compliance cost to export as a percentage of the given value of US
$50,000 for a shipment of goods, TC
X, which varies between 0.48% and 3.35%, is presented in
Table 4, column 5.
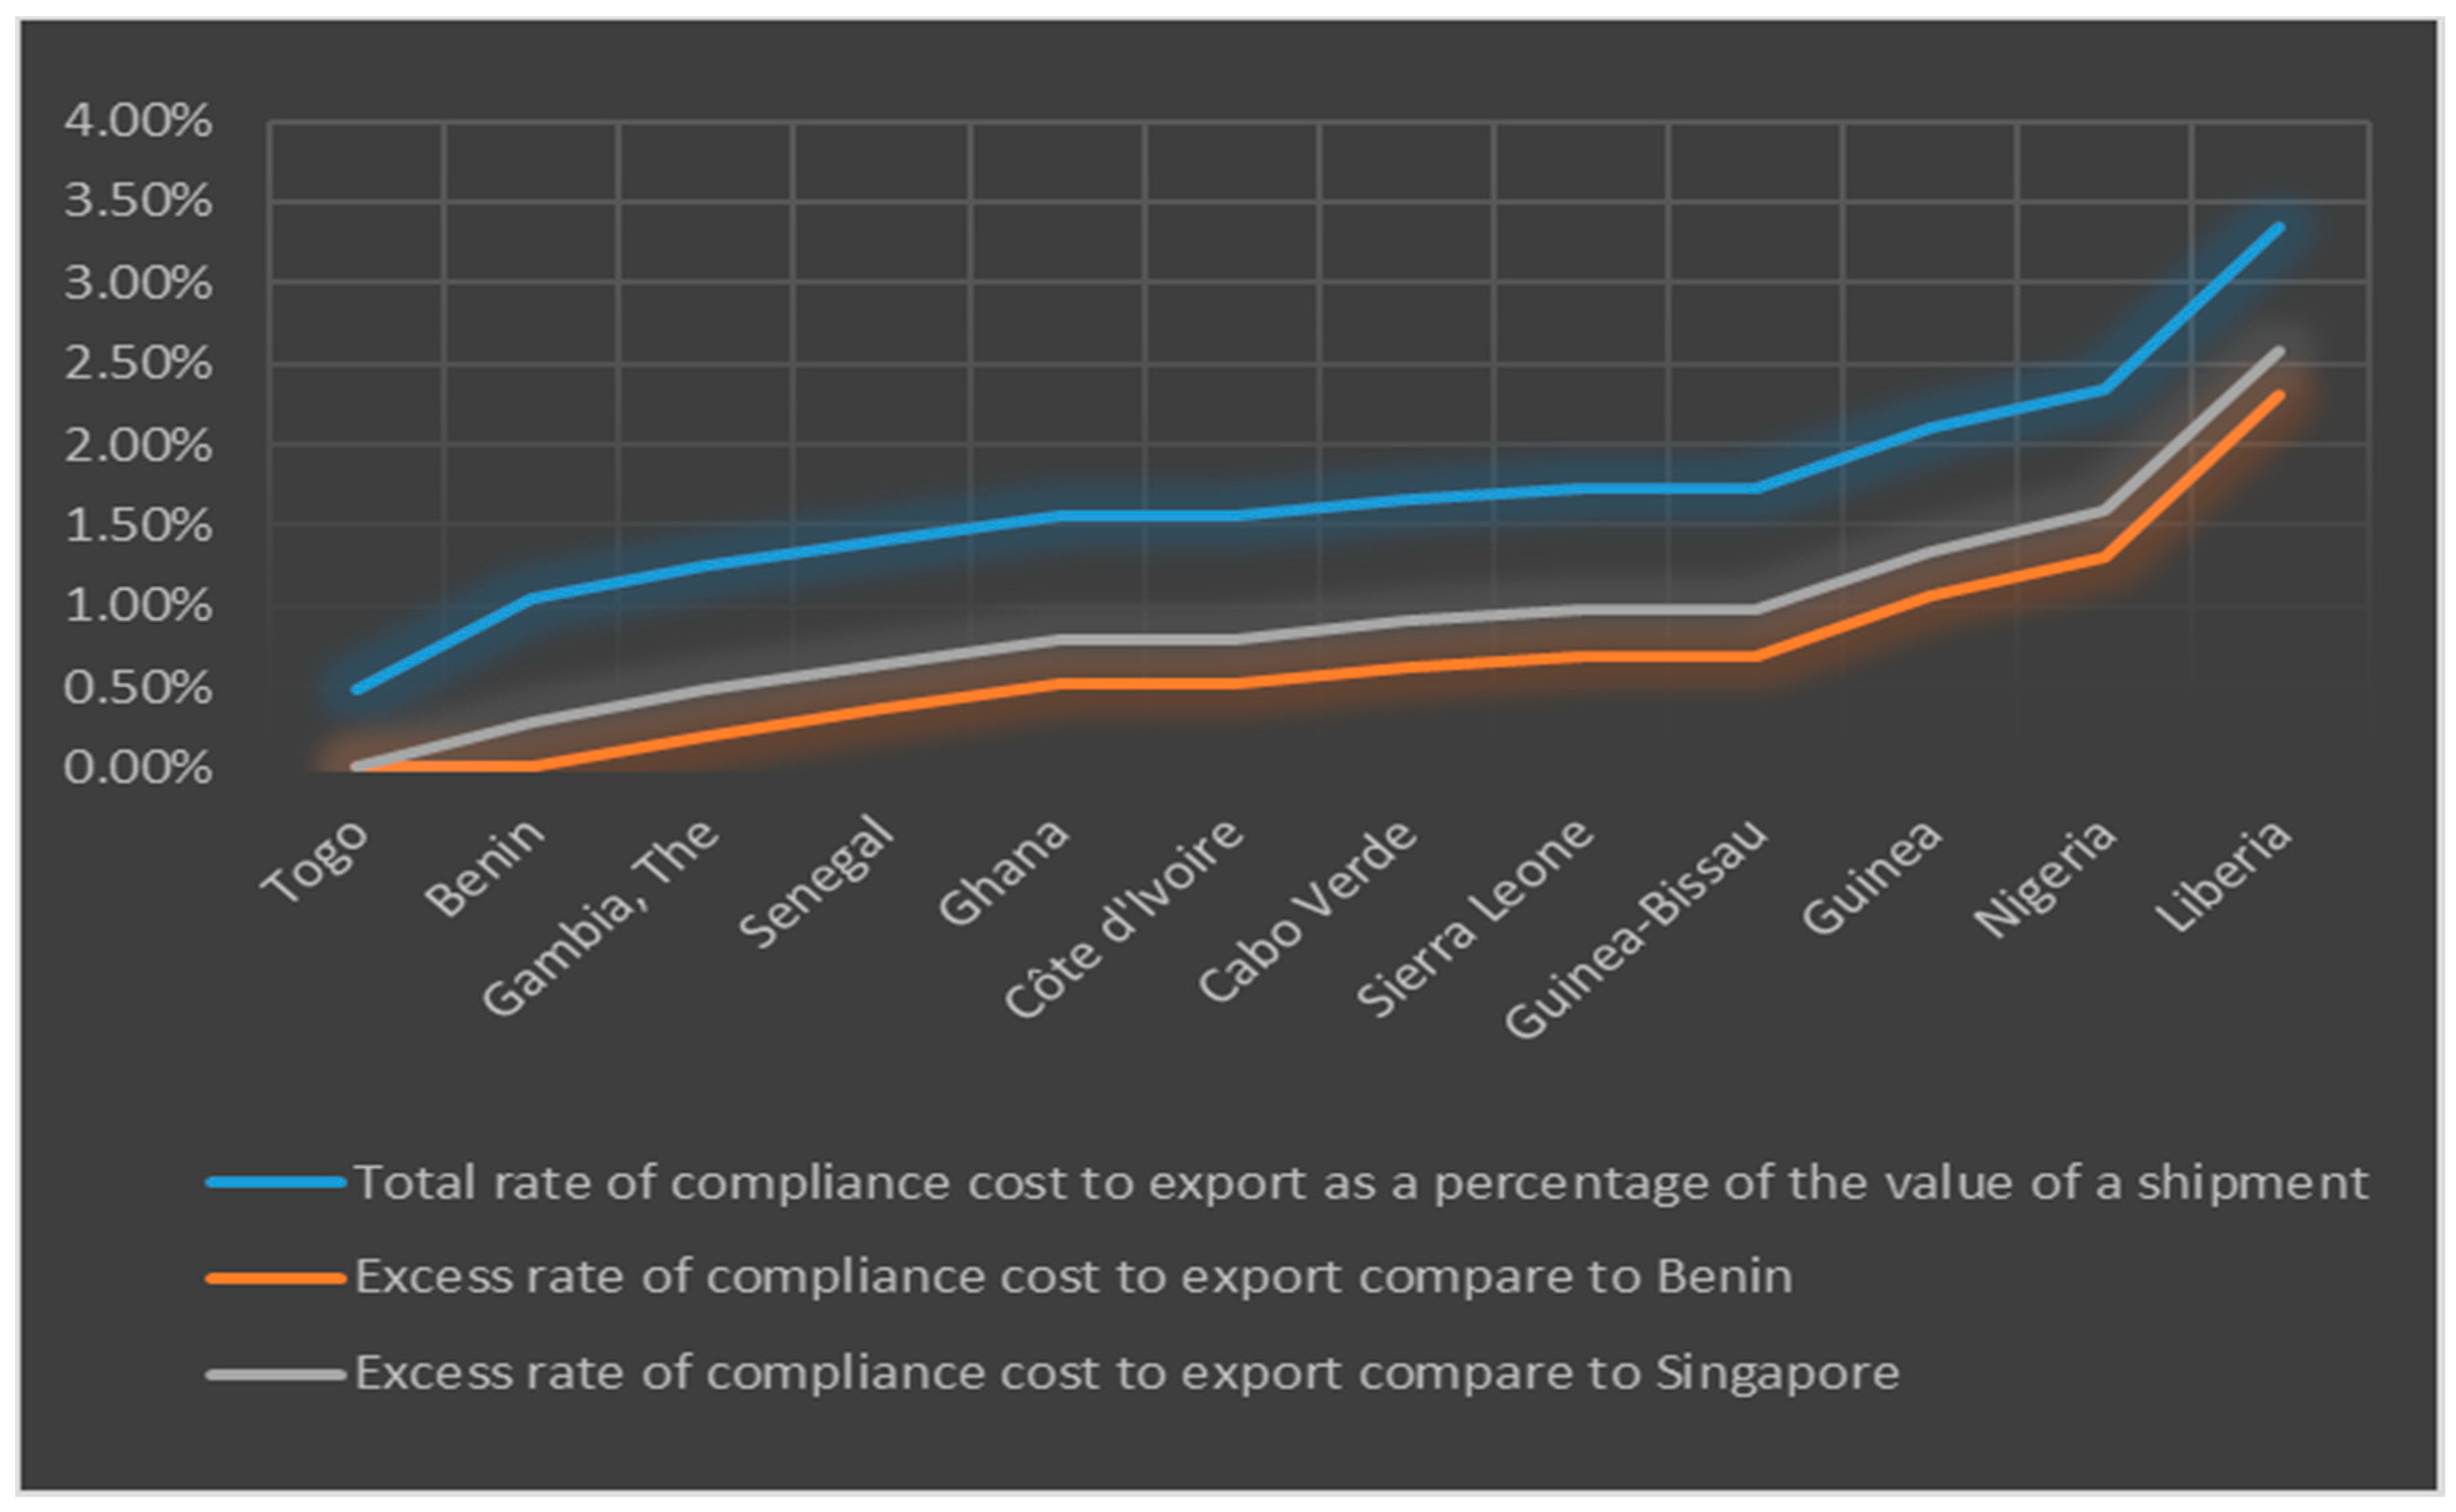
In order to estimate the impact of trade facilitation efforts that could improve the efficiency of international trade administration, a benchmark is required to estimate the practical range of possibilities. Togo and Benin have the lowest rate of export compliance costs among ECOWAS countries. Due to various reforms carried out by Benin, it is one of the countries with the lowest rate of costs associated with the importation as well, while Togo stands in the sixth place. Hence, again we considered Benin and Singapore to be export compliance cost benchmarks for coastal ECOWAS countries, with corresponding rates of 1.04% and 0.76% per shipment value, respectively. By subtracting these benchmark rates of normal compliance costs to export from the current compliance costs rates of ECOWAS members, the excessive rates of compliance costs,
, (
Table 4, columns 6 and 7) will be obtained as the objective for trade facilitation reforms. The range of
is from 0.20% to 2.31% in comparison with Benin and from 0.28% to 2.59% in comparison with Singapore. These potential cost savings, similar to an exportation tax, can be utilized to finance the reforms on administrative inefficiency of the administration procedures of merchandise exportation.
Figure 4 presents both the rates of compliance costs as a percentage of the value of a standard export shipment and also the estimated excess compliance costs using as benchmark efficiency levels of Benin and Singapore. These three estimated parameter values are critical in determining the economic welfare gains from trade facilitation initiatives as they apply to the administration of exports.
Table 5 reports on how the presence of export facilitation can impact the economy of ECOWAS members. The percentage change in each country’s export levels can be derived from Equation (9) accompanied by data on current merchandise export quantities, and the supply elasticity of export (
Table 1). The estimates show that the average change in export volumes is an increase of 20–29%. However, for Liberia, it is between 83% and 93% (
Table 5, column 1). Equations (10)–(12) are used to measure the economic gains that result from the reduction in export compliance costs.
The cumulative value of these welfare economic gains, for the exportation of non-oil and non-gold groups of goods, is between US
$183.62 million to US
$260.67 million annually (
Table 5, rows 13a and 13b). Nigeria and Ivory Coast gain the most from the export facilitation measures.
6. Overall Results
As reported in
Table 6, the facilitation of both imports and exports and reduction of compliance costs to the levels of Benin and Singapore would result in an annual economic welfare gain of approximately US
$1.6 billion to US
$2.7 billion (2019 prices) for ECOWAS, respectively (column 1).
While the main concern of the economists about the imposition of import tariffs in ECOWAS has been the magnitude of their economic inefficiency costs [
66], our results demonstrate that the economic welfare cost of the inefficient administration of cross-border trade is much larger. As shown in
Table 6, column 2, for the ECOWAS commission, the estimated economic welfare benefits of removing the excess compliance costs of trade (∆G
e) is 2.5 to 4.4 times greater than the economic welfare gain of a complete removal of import tariffs (∆G
t).
At the present time, there are very few studies that have attempted to estimate the actual or potential economic welfare gains from trade facilitation. Most studies only assess the impact of the expansion of trade facilitation on the expansion of the flows of imports and exports [
40,
46]. The results of this study are focused on the potential cost savings from trade facilitation initiatives. These initiatives are comparable to what was implemented by Singapore. In 1986, Singapore introduced a series of trade facilitation reforms that greatly decreased the costs of what was an inefficient system of trade administration. By 2010, the estimated annual savings from the TradeNet system introduced in Singapore in 1986 amounted to US
$1 billion a year [
67]. The success of Singapore has caused a number of countries, such as Benin, Togo, Kenya, and Mozambique to introduce a Single Window system similar to the TradeNet system. In all cases, very substantial savings in costs have been realized [
64,
68].
In comparing the worth of resources saved in an efficient system of goods clearance with other macroeconomic indicators, the annual economic gain achieved through reforms would amount to 0.24% to 0.42% of the total GDP for the coastal ECOWAS members (column 3). In Liberia, the waste of resources is as high as 1.45% to 2.25% of the value of its GDP. This is the economic loss that residents would lose annually if the proposed reforms are not undertaken.
Health and education are of sustainable development goals (SDGs 3 and 4). The percentages of GDP governments spend on health and education is one of the indicators for evaluating government performance in partnership with the goals for sustainable development (SDG 17). The economic welfare gained from trade facilitation for these West African countries if they could reach the target system of Singapore, is about 10% and 58% of their budgets which is allocated for education and health, respectively (row 13b, columns 4 and 5). The potential economic gain of decreasing Liberia’s compliance costs, only to Benin’s level, is more than the government’s total health expenditure. These place great emphasis on the importance of trade facilitation measures to help the countries reach their sustainable development goals faster.
The total potential welfare gain for the ECOWAS economic community can also be compared to the total ”net official development assistance received” (US$9316 million) in 2018. This comparison indicates more than 15% to 26% of the value of loans and grants received by coastal ECOWAS members could be achieved through the reforms that facilitate the trade across borders (Column 6). This ratio is even higher for Nigeria: around 31% to 46% of net official assistance.
Compared to the benefit gained from reducing the compliance costs, for many trade facilitation reforms, the implementation cost is trivial. For instance, setting up the “Single Window” in Kenya incurred a cost of US
$14.7 million. Singapore’s cost to launch its Trade Net system was significantly less than US
$50 million in 2019 prices. This is while the annual operating costs are between US
$195,000 and US
$1.2 million [
38,
69,
70].
The immediate implication of this analysis is that public sector investments in improving the physical and administrative facilities of the infrastructure should be a very high priority for both governments and international donors. There are probably no other reforms or public investments that countries can implement where they can to attain such widespread net economic benefits. The benefits arising from reducing unnecessary trade transaction costs are going to be distributed to the countries of ECOWAS as well as to the countries trading with this region. While the member countries of ECOWAS will benefit directly from the lower consumer prices for imports and higher producer prices for exports, the increases in the demand for imports of between 2.3% and 3.9% annually will create an indirect benefit to those countries both developing and developed who will be supplying these additional imports.
7. Conclusions and Policy Implications
This study aimed to estimate the annual economic welfare gains for the coastal countries of ECOWAS that could be realized by the implementation of potential reforms to eliminate the excessive trade transaction compliance costs. It also investigated the contribution of regional integration and trade facilitation reforms to achieve the realization of their sustainable development goals.
About 35% of the SSA population are inhabitants of ECOWAS, whose members are net food importers. Trade facilitation speeds up the clearance of goods moving across borders, boosts trade, particularly for time sensitive perishable agricultural goods and intermediate manufactured goods. In previous years, the West African countries observed growth higher than many of the developed countries. For improving the economies of this region and enhance the welfare of its residents, there is a need to improve current infrastructure, remove excessive formalities and inefficient procedures. Trade facilitation through a reduction in economic waste contributes to fostering the integration of this community into the global economy. It will expand international trade to contribute towards partnerships in attaining the sustainable development goals (tackling poverty and hunger, bringing economic growth, sufficient consumption and production, allowing peace, and so on).
This study shows that the economic welfare benefits resulting from a reduction in excessive import and export border and documentary compliance costs are considerable for ECOWAS countries, amounting to 0.24% to 0.42% annually of their GDP. This gain for these West African countries would be between US$1561 million and US$2691 million. Nigeria would provide its residents with around 63% to 73% of these economic gains.
The principal reforms that are required to realize these cost savings tend to be first and foremost a Single Window administrative system. In such a system all customs, health, security, controls as well as payment of any duties, taxes and licenses are carried out by a single administrative office. This should be combined with risk based customs inspections, upgrading trade logistics infrastructure, deepening regional administrative cooperation, and training and communications with trade stakeholders. Failure to proceed quickly with such reforms will inflict costs on the wellbeing of the residents of the ECOWAS countries.
A vigorous trade facilitation policy is the correct priority to reduce barriers to deepen the implementation of regional trade agreements in ECOWAS and support the SDGs. Its benefits are expandable in the context of the single wide continent market of Africa, AfCFTA. By attaining administrative efficiencies for international trade, ECOWAS would not only improve the chances of achieving its sustainable development goals but may also lead to a better economic integration of the member countries of ECOWAS. This is of major importance for Nigeria as it has the largest population and is the dominant economy or the region.
A major challenge in bringing about trade facilitation reforms has been the reluctance of the stakeholders of the current system to make changes that will reduce costs and their influence. Customs administrations have been notoriously difficult to reform. Corruptions of such institutions and the strong unions representing port workers have often resisted the kinds of administrative changes required to implement new systems. Often the reforms require the application of advanced information technology that the current managers and workers might not be comfortable using. With the potential benefits, being so large, future research should focus on the analysis of the implementation of changes. How such reforms might take place so that the special interest groups that benefit from the current inefficient practices come to accept such changes. A series of countries have successfully implemented such reforms. The implementation strategies of the successful reforms in the countries should be studied so that a better understanding can be developed of the political economy of trade facilitation reform.


