Article

Spatial-Temporal Response Patterns of Tourist Flow under Real-Time Tourist Flow Diversion Scheme

1
Jiangsu Key Laboratory of Urban ITS, Southeast University, Nanjing 211189, China
2
Jiangsu Province Collaborative Innovation Center of Modern Urban Traffic Technologies, Southeast University, Nanjing 211189, China
3
School of Transportation, Southeast University, Nanjing 211189, China
4
Beijing Key Laboratory of Traffic Engineering (Beijing University of Technology), Beijing 100124, China
*
Authors to whom correspondence should be addressed.
Sustainability 2020, 12(8), 3478; https://doi.org/10.3390/su12083478
Submission received: 6 March 2020 / Revised: 5 April 2020 / Accepted: 21 April 2020 / Published: 24 April 2020
(This article belongs to the Section Sustainable Transportation)

Abstract

:
This paper excavates tourist decision-making mechanism under the real-time tourist flow diversion scheme (RTFDS) and evaluates the tourist flow diversion effect of RTFDS. To meet the objectives, the stated preference survey and tourist flow survey of the Summer Palace were implemented. The tourist behavior adjustment model and tourist flow diversion simulation model were established. The results show that: (a) For core tourist spots, 66.5% and 16.5% of tourists will choose “behavior adjustment” and “no longer adjustment” under RTFDS, these behavior adjustments all shorten tourists’ residence time in tourist spots; (b) When the tourist congestion perception degree equals 4 or 5, tourists tend to adopt behavior adjustment or the individuals adopt no longer adjustment instead of cognitive adjustment when they face low tourist congestion perception degree, which equals 1 or 2; (c) When core tourist spots’ residence time is reduced by 10% and 20%, there are 60% and 73% time nodes where core tourist spots’ tourist flow density is less than or equal to the condition of null information, there are 73% and 60% time nodes where periphery tourist spots’ density is more than the condition of null information. The simulation results showed that some tourists could be guided from core tourist spots to periphery tourist spots through releasing RTFDS information. The research can provide theoretical support for the implementation of RTFDS, and alleviate the congestion inside the tourist attraction.

1. Introduction

1.1. Background

With the improvement of people’s living standards and the rapid development of the tourism industry, there are significant increases on holiday travel demands. The “over-tourism” problem has gradually become a concern of managements and scholars all over the world. The conditions in Beijing, China, Venice, Italy, Barcelona, Spain, Amsterdam, Netherlands, and New Zealand were analyzed, the problems caused by over-tourism were also exposed, such as reducing the comfort and satisfaction of tourists, threatening the UNESCO World Heritage status of the tourist attraction, affecting the life quality of local people, and threatening the environmental sustainability of destinations [1,2,3,4,5,6]. Based on a qualitative survey of 80 stakeholders in 13 European cities, Koens et al. pointed out that “over-tourism” is a multi-dimensional and complex problem. The “over-tourism” problem should not only be regarded as a tourism problem or a city problem, but also be observed and solved by researchers in various disciplines from a perspective of broader social and urban development [7]. In the disciplines of traffic engineering and science of decision making, some scholars and management departments have carried out some research to adjust and control tourists’ decision-making behavior and balance tourists’ spatial-temporal distribution, such as redistributing the existing parking resources, releasing the information of staggered shifts, adjusting the road toll discount on holidays, and implementing tourist flow control schemes (TFCS) [8,9,10,11,12,13].
A large number of tourists gather in some popular tourist attractions, which results in the tourist number exceeding the carry capacity of tourist attractions. In famous tourist attractions, influenced by travel strategy, information release, tourist preference, and other reasons, tourists always gather in core tourist spots, while few tourists visit periphery tourist spots. Taking the Summer Palace as an example, which is a 5A tourist attraction in Beijing, China, the spatial-temporal distribution of tourist flow is shown in Figure 1. Tourists mainly gather at some entrances (e.g., North Palace Gate, East Palace Gate) and some core tourist spots (e.g., Long Corridor, Hall of Happiness, and Longevity), while the tourist flow in periphery tourist spots (e.g., Garden of Harmonious Virtue, Wenchang Gallery, Farming, and weaving map) is rare. In this study, “core tourist spot” refers to the tourist spot with high popularity, high tourism satisfaction, and superior geographical location, “periphery tourist spot” refers to the tourist spot with lower popularity and periphery geographical location [14,15]. Short-term highly aggregated tourist crowd not only causes the decline of tourists’ satisfaction, but also induces safety accidents such as stampede, which puts pressure on the management of tourist attraction [12].
It is very important for the traffic network in the tourist attraction to have the ability to deal with various tourism emergency events such as traffic accident, short-term highly aggregated tourist crowd [16]. There is still much room for improvement in the management and service in response to emergencies, and the effectiveness and timeliness of the implementation of tourism security service schemes needed to be reinforced [17]. The China National Tourism Administration (CNTA) promulgated the Guidelines for the measurement of carry capacity of tourist area (referred to as Guidelines) on January 9, 2015, which stipulated that tourist attractions should count the instantaneous and daily maximum carrying capacity. The real-time monitoring, tourist flow control schemes (TFCS), early-warning are suggested to control tourist flow [12]. According to the guidelines, many tourist attractions have carried out some TFCS, such as entrance tourist flow control scheme (ETFCS), ticket reservation diversion scheme (TRDS), real-time tourist flow diversion scheme (RTFDS), and emergency diversion scheme (EDS). A complete tourist travel stage includes pre-trip, en route, and travel in the tourist attraction [18]. At each travel stage, different TFCSs have been implemented. In the stage of traveling in the tourist attraction, managements want to induce tourists transfer from the crowded tourist spot to the uncrowded one through RTFDS. In RTFDS, the real-time tour information is released to tourists via Light Emitting Diode (LED) display screen, broadcasting, official platform, and other media. The released tourist information includes tourist flow congestion information and tourism attribute information (e.g., ornamental value, popularity, and the information of tourists’ visit frequency, etc.) of tourist spots, and tour recommendation information (e.g., tour route recommendation under congestion state, etc.). The above tourist information can affect and regulate tourists’ decision-making behavior such as the residence time of each tourist spot, visiting sequence of tourist spots, and further affect the spatial-temporal distribution of tourist flow in the tourist attraction.

1.2. Research Motivation

With the progress of the advanced traveler information system (ATIS), travel information affects individual travel behavior at different aspects [19]. Information plays an important role in the process of individual travel decision, and its influence is widely discussed [17,19,20,21]. Some tourists have intention to adjust their destination, tour route, and visiting time in holidays to improve their tourism experience. Furthermore, the number and spatial-temporal distribution characteristic of tourists can be collected by ATIS, so that the managements of tourist attractions can take some schemes to alleviate traffic congestion, improve service level and efficiency. The real-time tourist flow diversion scheme information (RTFDSI) system is one of the core elements of ATIS.
However, only a few studies have explored how RTFDSI affects tourist decision-making behavior, alleviates holiday traffic congestion and enhances tourist experience.
Therefore, there are still many problems to be studied and solved:
  • What is the interactive relationship among tourist information demand, RTFDS, and tourists’ decision-making behavior?
  • What are the main factors that affect tourists’ behavior adjustment under RTFDSI and their sensitivity? How much is the effect of RTFDS on tourists’ behavior adjustment?
  • What measures can be taken to adjust and optimize RTFDS dynamically?
The essence of the above problems is to capture tourists’ information demand, and tourists’ behavior adjustment mechanism under RTFDSI. Therefore, it is necessary to formulate an effective RTFDS, clarify the mechanism of tourists’ behavior adjustment, and establish tourists’ behavior adjustment model under RTFDSI and the tourist flow diversion simulation model.
The rest of the paper is organized as follows. Section 2 summarizes relevant literature on RTFDS and impact on tourists, tourists’ behavior adjustment under congestion conditions, and tourist behavior simulation research. Section 3 explores the mechanism of tourists’ behavior adjustment under RTFDSI. In Section 4, the methodology of describing and calculating the multinomial logit (MNL) model is provided. Section 5 contains the revealed preference (RP) and stated preference (SP) survey. A case introduction and description of the survey data obtained from questionnaires under RTFDSI are analyzed. Section 6 explains the meaning of the variables used in the MNL model. The estimation results of the model are preliminary presented. The rules of tourists’ behavior adjustment in every tourist spot in the Palace Area under RTFDSI are revealed. Based on the tourist flow diversion simulation model, the effect of RTFDS on balancing the spatial-temporal distribution of tourists in the tourist attraction is analyzed. Finally, theoretical and managerial implications and suggestions for future research are given in Section 7.

2. Literature Review

2.1. RTFDS and Impact on Tourists

At present, the CNTA, scholars, and managements have carried out some research on the implementation of RTFDS and its information release mode. The guidelines pointed out that the management of tourist attractions should set up electronic display screens to show the tourist flow distribution inside the tourist attraction, and facilitate tourists to choose the next tourist spot [12]. Some tourist attractions have carried out RTFDS, Huangshan Mountain (5A level) and Huangya Cave (4A level) have built LED display screen, broadcast, and other information release systems to timely release the tourist flow information of each tourist spot in peak hours. Tourists can proactively adjust their tour plan (e.g., the sequence of tourist spots, residence time of tourist spots) according to the released information, which can balance the tourist flow distribution among tourist spots [22,23]. For the identification and collection of tourist flow information of each tourist spot in the tourist attraction, some scholars pointed out that RFID technology can get the information they need [24,25]. In addition to releasing RTFDSI to tourists, some scholars also studied tour route design and tourism cost information release. Han et al. put forward a tour route optimization design model considering tourists’ congestion perception. The model can reasonably plan tourist spots visiting sequence, improve tourists’ tourism benefits (e.g., satisfaction degree, travel time, tourist congestion perception degree), and guaranteed the tourism safety of the tourist attraction [26]. O’Hara proposed a self-adaptive tour route recommendation model for multiple tourist groups traveling in multiple destinations. The simulation results showed that the model could reduce the average waiting time of tourists, and avoid congestion [27]. Sidi proposed an interactive map based on scalable vector graphics (SVG). Tourists can use the map to find the shortest and the least uncrowded path [28]. For the information release of tourism cost, Wanhill discussed the possibility of eliminating the congestion of tourist spots by releasing the waiting time cost information to tourists, and used price attraction to allocate tourist resources [29].
To sum up, for RTFDS, some work has been carried out on theoretical research and management practice. However, the information release mode of RTFDS needs to be further studied, including information release content, information form, location, media, frequency, scope, etc. In addition, there are few studies which focused on the interaction relationship between RTFDS and tourist needs, it is difficult to quantify the impact of RTFDS on tourist experience and behavior adjustment, and evaluate the effectiveness of RTFDS.

2.2. Tourists’ Behavior Adjustment

When facing the crowded tourist attraction or tourist spot, tourists tend to maintain their satisfaction through behavior adjustment. Some scholars studied the modes of behavior adjustment, the characteristics of tourists who prefer to adjust behavior, and the factors which affect tourists’ congestion perception and behavior adjustment. For behavior adjustment, Anderson and Brown, Hammitt and Patterson, Manning and Valliere insisted that tourists’ behavior adjustment modes mainly included transfer, rationalization and product conversion [30,31,32]. Shailes et al. indicated some domestic tourists tend to avoid congestion by adjusting the route and departure time [33]. Zhang constructed a congestion-adjustment model, and concluded that tourists’ congestion adjustment behavior mainly includes cognitive adjustment, behavior adjustment, and time adjustment [34]. Le used the route search data and GPS driving path data to analyze the stopover behavior of returning drivers [35]. The characteristics of tourists who prefer to adjust their behavior were analyzed and discussed. Shailes et al. found that the domestic tourists who have more vehicles and have visited the area before have preference to avoid traffic congestion in travel planning [36]. Based on the multinomial logit model, Wang indicates female tourist, tourists with low monthly income, and tourists with many companions mainly tend to ignore congestion; tourists with high monthly income and tourists who visited the tourist attraction many times mainly tend to change their destination [37]. Some scholars focus on the factors which affect tourists’ congestion perception and behavior adjustment. Based on the structural equation model, Zhu et al. pointed out that tourists’ attitude, subjective norm (e.g., family and friends, new media), and perceived behavior control (e.g., lacking of abundant time, preferential travel costs) have significant influence on the intention and behavior of avoiding travel during rush-hour on holidays [9]. Han et al. discussed the feedback mechanism among tourism information release mode, tourists’ congestion perception and behavior adjustment. The results showed that tourism information variables in the tour stage (e.g., the content of congestion information release, residence time of tourist spots, etc.) had a significant impact on tourists’ congestion perception and behavior adjustment [37]. Zhang hold the view that behavior adjustment was influenced by both tourists’ own factors (e.g., socio-economic characteristics, tourism experience, tourism motivation, preferred landscape type, congestion expectation, tourist temperament), and external objective factors (e.g., bad behavior characteristics of other tourists, facilities and services of the tourist attraction) [34]. Based on the data analysis of questionnaires, Jin et al. pointed out that nationalities and motivation (e.g., self-development/novelty, kinship/relax) were related to tourists’ congestion perception [38].
To sum up, the current research has analyzed the interactive influence relationship between tourists’ adjustment behavior and congestion perception. However, very few studies investigate how RTFDSI affects tourists’ behavior adjustment choices. The influence mechanism between RTFDSI usage and tourists’ decision-making behavior has not yet been excavated.

2.3. Tourists’ Behavior Simulation

In order to guide the management and planning of tourist attractions, some scholars have simulated the current and the future situation of tourist flow spatial-temporal distribution, and the effect of TFCS. Lawson used the computer simulation model to generate a comprehensive picture of existing tourists utilize conditions, so that the management can fully and effectively understand the spatial-temporal characteristics (e.g., when, where, how many tourists enter the area, and where to go) of tourists in the Inyo National Forest. The spatial-temporal characteristics of tourists can guide the management and planning of the tourist attraction [39]. Zhang developed a tourists’ spatial behavior simulator which uses GIS to manage spatial data and analyze and display simulation results on the basis of studying the characteristics of tourists’ spatial behavior. The multi-agent system was also used to simulate tourists’ spatial behaviors to protect and manage the tourist attraction [40]. Based on GIS and multi-agent system technology, Zhang constructed a tourist behavior simulation system considering the spatial recreation behavior of tourists and the environment of tourist attraction. The system can help to plan and manage the tourist attraction [41]. Since the core tourist spots in the tourist attraction are easy to gather a large number of tourists, some tourist attractions have carried out TFCS, and some scholars used the simulation model to analyze the effect of TFCS. For example, Li built a tourist simulation system by Agent technology, and analyzed the effects of residence time regulation scheme and upstream diversion regulation scheme on the diversion of tourist flow [42].
In conclusion, the current simulation research mainly focuses on analyzing the spatial-temporal distribution of tourists, which can guide the management and planning of the tourist attraction (e.g., layout of tourist facilities, design of tourist routes, planning of transportation facilities, protection of tourist resources, etc.). In addition, few scholars use simulation tools to analyze the implementation effect of TFCS. RTFDS is a kind of TFCS, RTFDS aims to release RTFDSI (e.g., tourist flow of tourist spots, tour recommendation information, etc.) to tourists, make some tourists proactively shorten the residence time at core tourist spots with high tourist congestion perception degree. Sometimes RTFDS can induce tourists transfer from core tourist spots to periphery ones based on their own congestion perception and tourism experience. The current research on TFCS inside the tourist attraction is less based on the premise of tourist spots classification. In fact, firstly, the tourist spots should be divided into core tourist spots and periphery tourist spots according to tourist spot’s popularity, tourism satisfaction, and geographical location, and only core tourist spots need to divert tourist flow. Besides, the current research focuses on how to reduce the tourist flow of core tourist spots through TFCS, does not analyze whether TFCS can achieve the equilibrium distribution of tourist flow in each tourist spot, that is, whether the tourist flow of core tourist spots can be diverted to periphery tourist spots through TFCS. Moreover, tourists should be divided into individual tourists and group tourists; there are differences in tourism behavior characteristics (e.g., residence time, speed, and transfer probability among tourist spots) between them, and few scholars distinguish these two tourist groups in the tourist simulation model.

2.4. The Main Contribution

In light of the three parts mentioned above, the contribution of this study is three-fold: (1) It makes an initial attempt to determine the information release content of RTFDS based on the needs of tourists and the managements of tourist attractions; (2) After discussing tourists’ behavior adjustment mechanism under RTFDSI, the tourists’ behavior adjustment model under RTFDSI was established, the key factors and their levels that influence tourists’ behavior adjustment were analyzed. Based on the model, tourists’ behavior adjustment probability value in each tourist spot of the Palace Area was obtained; (3) The tourist flow diversion simulation model under null information and RTFDSI were respectively established to measure the impact of RTFDS on balancing the spatial-temporal distribution of tourists in tourist attraction. The research can provide a theoretical support for the implementation of RTFDS, information release, and the improvement of tourist experience.

3. Tourists’ Behavior Adjustment under RTFDSI

3.1. RTFDS and Its Information Release

In recent years, with the progress of the advanced traveler information system (ATIS), the tourist flow information (e.g., the number and spatial-temporal distribution characteristic of tourists) can be collected through RFID, video monitoring, etc. Then RTFDS can be made and executed, and some tour recommendation information (e.g., tourist spots, tour routes) can be released to tourists. As we all know, travel information affects individual travel behavior at different aspects. Some tourists have intention to adjust their destination, tour route, and visiting time on holidays to improve their tourism experience. If tourists can obtain RTFDSI, sometimes tourists would like to proactively shorten their residence time in core tourist spots with high tourist congestion perception degree or transfer from core tourist spots with high tourist congestion perception degree to periphery tourist spots with low tourist congestion perception degree. Hence, the RTFDSI system has become one of the core elements of ATIS, which is widely applied in tourist attractions in China.
For the information release content of RTFDS, it needs to integrate the information needs of tourists and management of tourist attractions. For tourists, when visiting tourist attractions, they often are concerned about the tourism attributes of tourist spots, such as the ornamental value, popularity, and tourists’ visits frequency information. For tourists who are sensitive to congestion, they will also be concerned about the tourist congestion perception degree of tourist spots. For the managements of tourist attractions, they hope to release the tourist congestion perception degree information of tourist spots, make tourists transfer from tourist spots with high tourist congestion perception degree to tourist spots with low tourist congestion perception degree, and realize the equilibrium spatial-temporal distribution of tourist flow among tourist spots. Therefore, comprehensively considering the needs of tourists and management of tourist attractions, this paper selected tourist spots’ tourist congestion perception degree and tourist spots’ recommendation index as the release content of RTFDS, in which the tourist spots’ recommendation index was the comprehensive index determined by the tourist spots’ ornamental value, popularity, and the information of tourists’ visit frequency [43,44].

3.2. Tourists’ Behavior Adjustment under RTFDSI

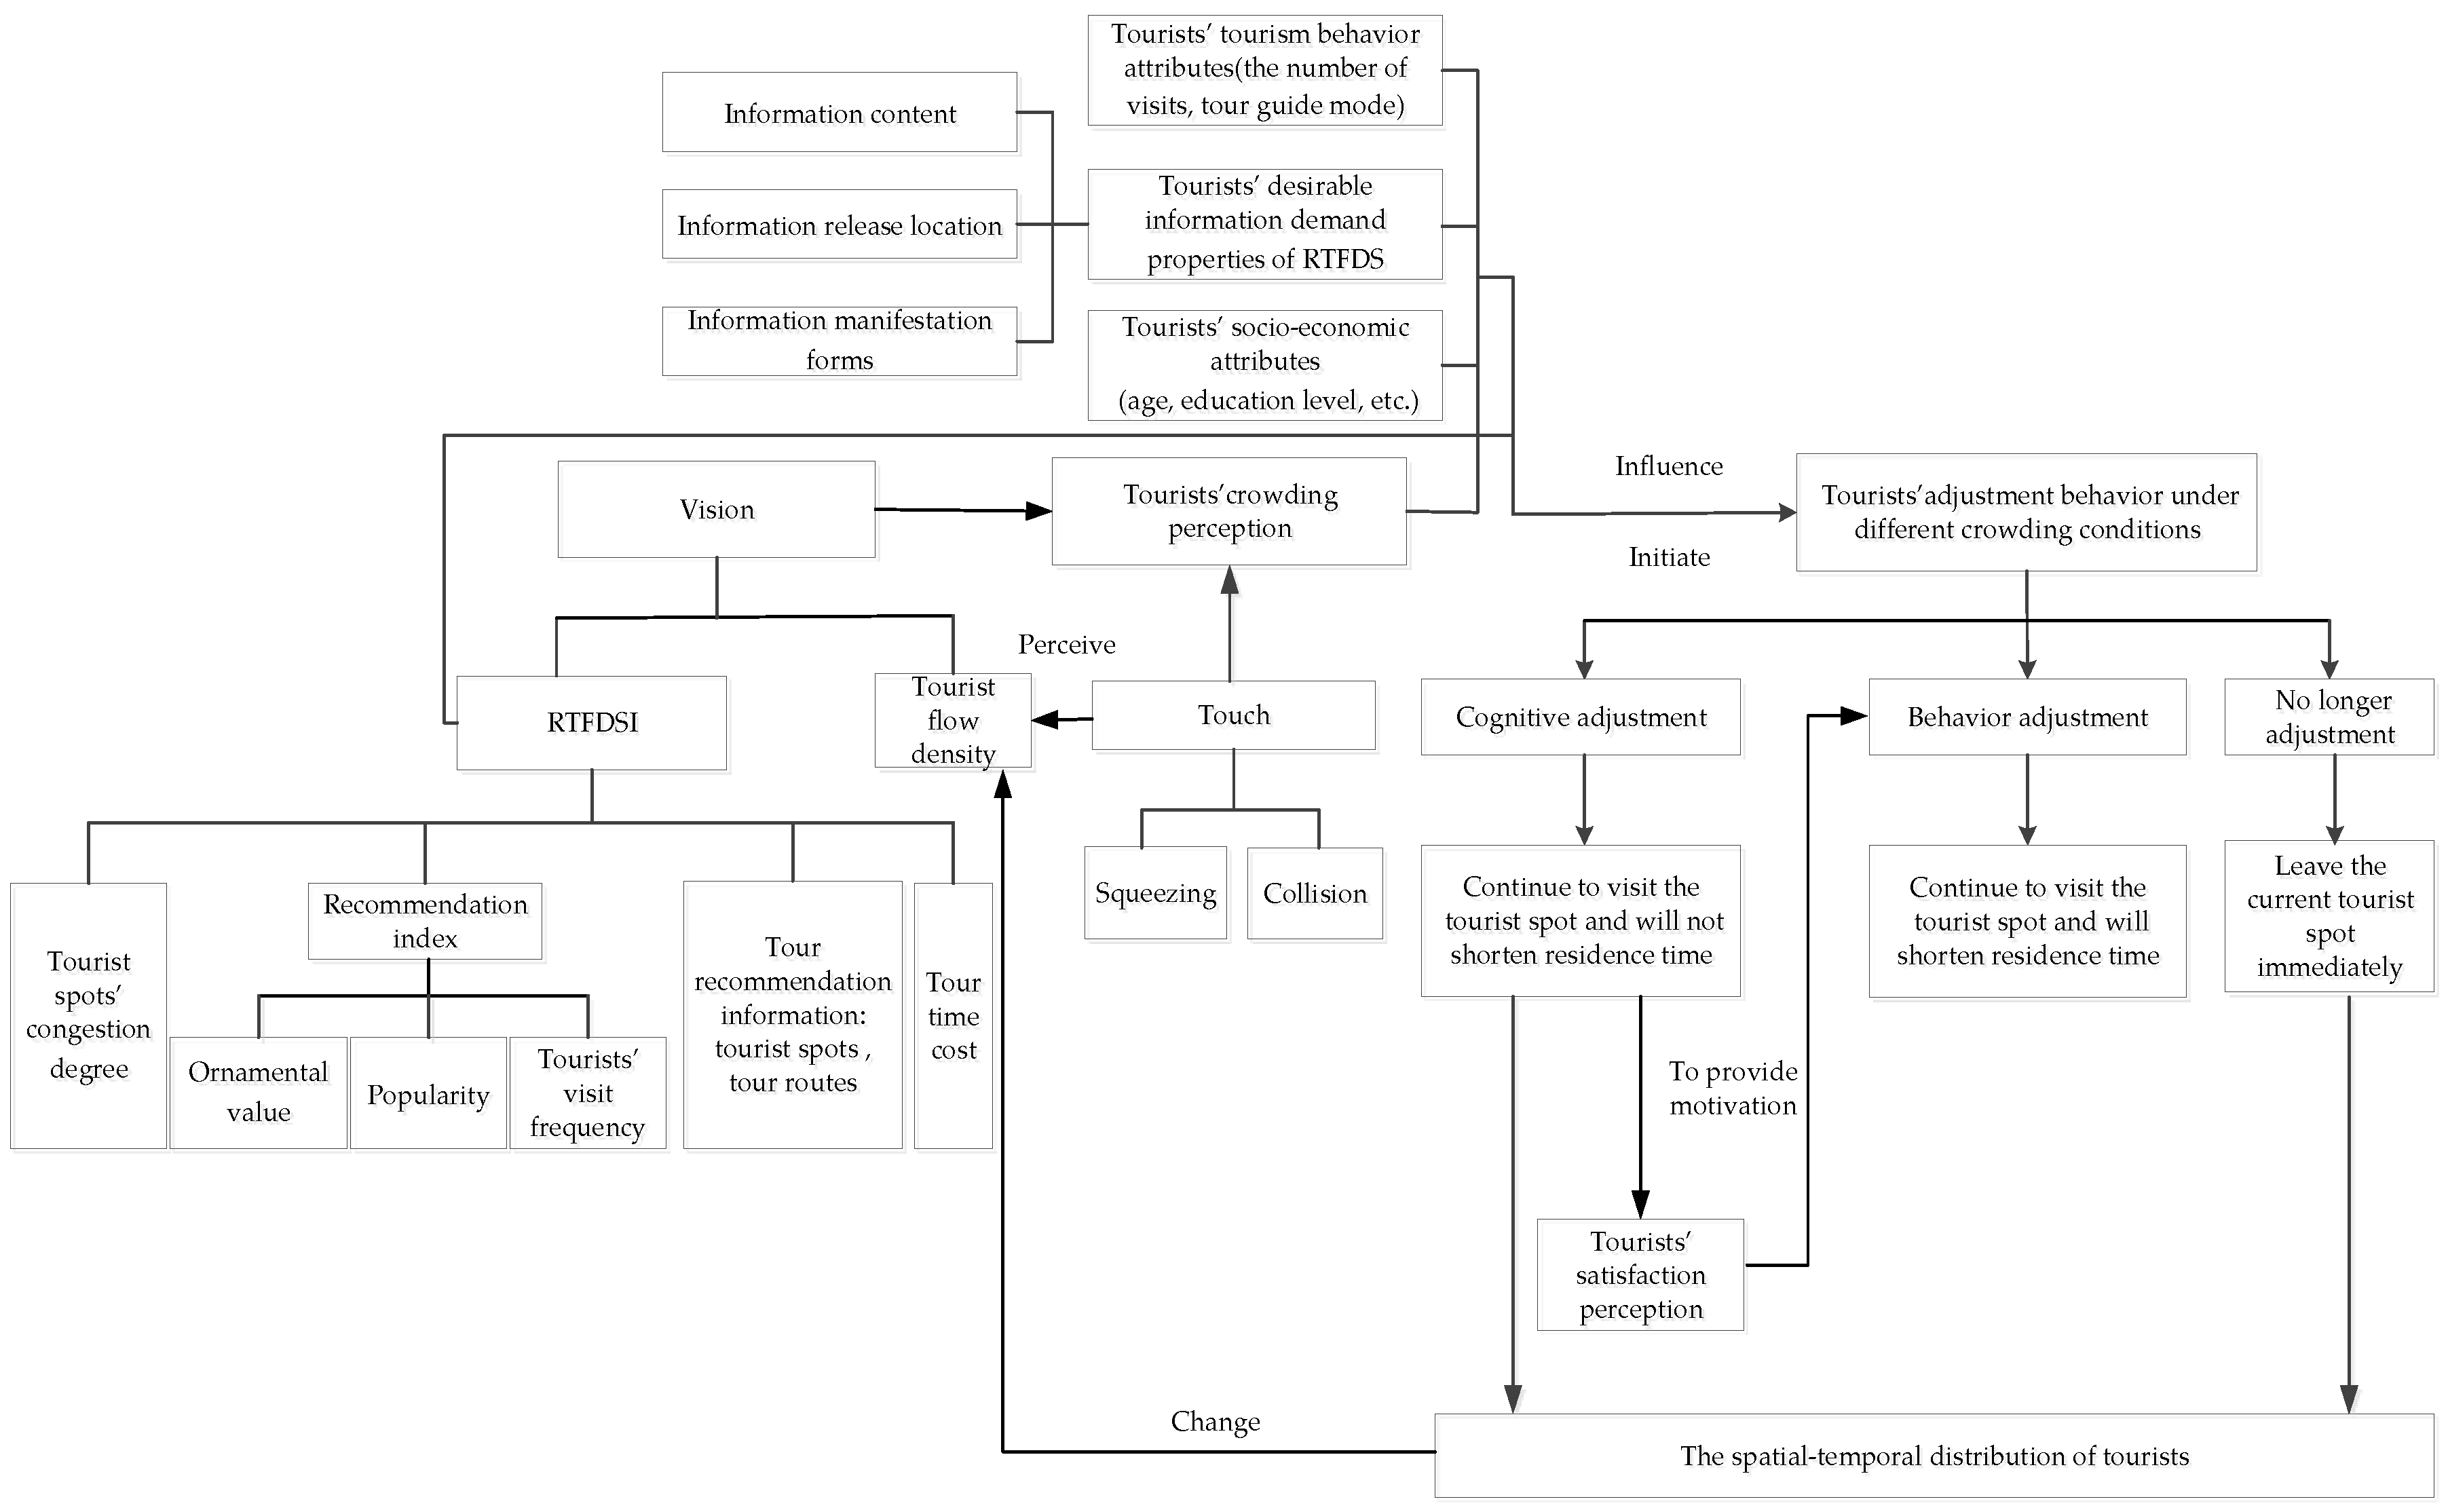
In order to get a better tourism experience, tourists want to get tourism information, especially all kinds of tourist flow control scheme information (TFCSI), to make tourism decisions and adjust travel behavior. The mechanism of tourists; behavior adjustment under RTFDSI is shown in Figure 2, and includes three stages: information acquisition, perception, and congestion evaluation stage, behavior adjustment initiation stage, and behavior adjustment stage.
(1)
Information acquisition, perception, and congestion evaluation stage
In the process of touring, tourists mainly perceive and evaluate the congestion of external environment through vision and touch. In the aspect of vision, tourists often evaluate the congestion of external environment by observing the tourist flow density and RTFDSI content (e.g., tourist spots’ tourist congestion perception degree, tour recommendation information, tourism cost information, etc.). In the aspect of touch, tourists evaluate the congestion of external environment by squeezing and collision.
(2)
Initiate behavior adjustment stage
Due to the evaluation result of congestion perception, tourists’ socio-economic attributes (e.g., age, education, etc.), tourism behavior attributes (e.g., number of visits, tour guide methods), and information demand attributes (e.g., information content, information release location, etc.) of RTFDS, tourists will decide whether to initiate behavior adjustment.
(3)
Behavior adjustment stage
A large number of tourists gather in a tourist spot in a short time, which will lead to a higher perception of congestion, tourists’ experience is not good and they are in an unbalanced state. Heider believed that everyone would follow a psychological rule— the balance theory during decision-making procedure. When people feel balanced, they will have a positive psychological experience and positive behavior. When the relationship between people and other things is in an unbalanced state, the experience will be unpleasant. The unpleasant experience can become a motivation, driving people to adjust and transform the unbalanced state into a balanced state until reaching psychological balance [45]. To improve tourism experience, tourists can adopt cognitive adjustment, behavior adjustment, and no longer adjustment strategies under RTFDSI, as shown in Figure 2. The cognitive adjustment is a way of psychological adjustment. Tourists can maintain a high satisfaction degree by ignoring congestion or adjusting their own preferences and expectations; they will choose “continue to visit the tourist spot and will not shorten residence time”. However, with the increase of congestion in the tourist spot, tourists will not be able to maintain a certain satisfaction degree through cognitive adjustment; at this time, tourists will tend to adjust their behavior, they will choose “continue to visit the tourist spot and will shorten residence time”. Some tourists cannot tolerate the current congestion state of the tourist spot; they will directly “leave the current tourist spot immediately”, no longer adjust. It can be seen that tourists will take a series of adjustment behaviors under different congestion conditions of tourist spots. The above adjustment behavior will affect tourists’ experience and the tourist flow status of each tourist spot inside the tourist attraction, and then change the spatial-temporal distribution of tourists in the tourist attraction.
The travel behavior adjustment choice under RTFDSI is a complex decision-making process, which is affected by many factors, such as tourists’ individual characteristics, and tour characteristics. Each tourist’s individual characteristics has an influence on choice behaviors, such as gender, education level, and occupation, which are caused by cultural differences [37]. Tourist demand was considered when the influence factor of behavior adjustment was analyzed, which will help us to understand and explain the differences in travel behavior adjustment choices under RTFDSI among tourists with different characteristics.
When tourists choose their behavior adjustment, they usually are determined by some factors such as tourism plan and previous tour experiences. Various tourism information contents and release methods have direct or indirect effects on tourists’ choices. RTFDSI should be considered as significant variables during the mechanism analysis of tourists’ decision-making process. It becomes more scientific and reasonable to explain the tourist’s travel choice under ATIS by introducing RTFDSI variables into the decision-making process.
The factors influencing tourists’ decision-making behavior under RTFDSI are the following: (1) RTFDSI’s relevant content, including the tourist congestion perception degree, ornamental value, popularity, and tourists’ visits frequency information of tourist spots; (2) Tourists’ socio-economic attributes (e.g., age, education level, etc.), congestion perception, and tourism behavior characteristics (e.g., the number of visits, tour guide mode). (3) Tourists’ desirable information release position, content, information manifestation form of RTFDS.
Then, the question is: what aspect of RTFDS will affect the tourist’s choice? How does it work? In addition, which plays an important role? What is the correlation between different aspects of RTFDSI and tourists’ behavior adjustment choice? Next, we need to quantify the relationship among specific RTFDS, RTFDSI, and tourists’ behavior adjustment choice.

4. Methodology

4.1. Framework of Multinomial Logit Model

There are many discrete decision-making processes existing in tourists’ travel and tourism stage, such as destination selection, tourism time selection, travel mode selection, tourism decision-making behavior under congestion situations, etc. Analyzing tourists’ behavior adjustment rule and influencing factors in different situations can help understand tourists’ selection preference and tourism demand. It also can improve the management of tourist attractions, such as tourism information release, charge management, travel mode optimization, brand marketing management, etc.
At present, many scholars used a variety of models to depict tourists’ discrete choice behavior, the most widely model was ogit discrete choice model, including multinomial logit (MNL) model, nested logit (NL) model, mixed logit model, etc. Some scholars used logit model to research tourism destination selection [46,47,48,49], tourism time selection [11], travel mode selection [50,51], tourists’ revisiting behavior [52,53], tourists’ consumption behavior [54], tourists’ decision-making behavior in congestion situations [55], etc. In these models, tourists will face no less than two selection schemes. When facing many selection schemes, tourists will make a decision according to the random utility maximization rule [56,57], that is, they will choose the selection scheme with the largest total utility from all selection schemes. Logit model can reveal the behavior rule of decision-makers. The factors that really affect the behavior of decision-makers can be determined by analyzing the symbol, size, and significance of the estimated parameters. For different types of people, the differences between groups can be compared. The willingness to pay for goods, facilities and policies of decision-makers can be estimated. Differences between before and after caused by changes in factors, policy implementation, and increase or decrease of alternatives can be analyzed by carrying out simulation analysis. And the effect of measures and scenarios also can be predicted in the early stage [58,59].
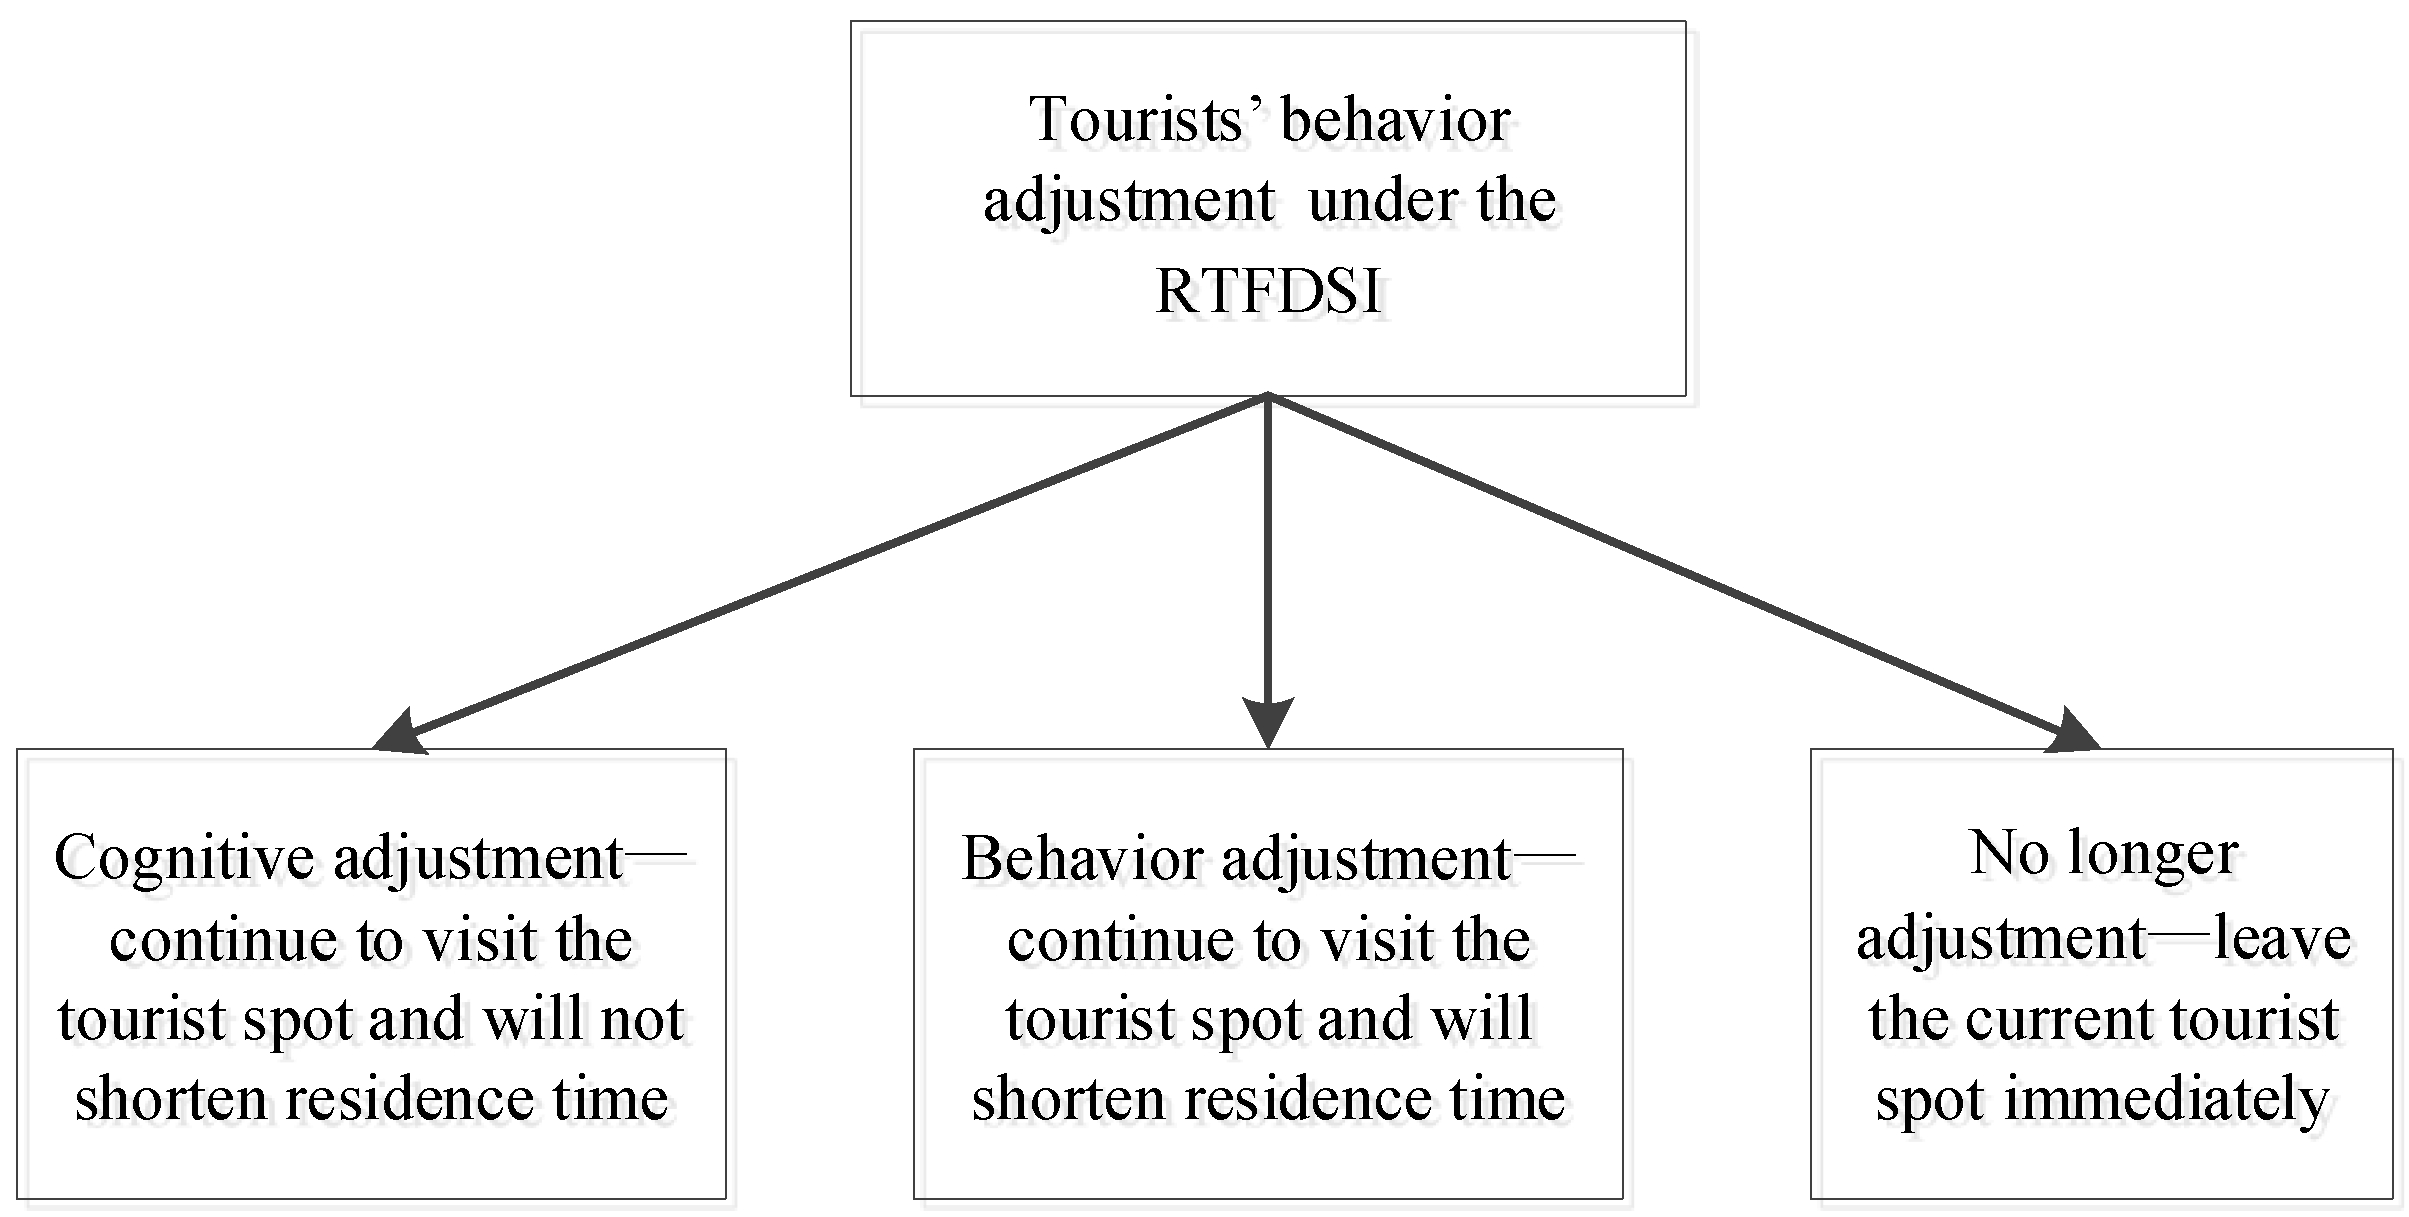
Based on the mechanism of tourists’ behavior adjustment under RTFDSI, when RTFDSI is released to the tourist in the tourist spot, the tourist will generate the behavior adjustment as shown in Figure 3. The selection schemes set includes “cognitive adjustment—continue to visit the tourist spot and will not shorten residence time”, “behavior adjustment—continue to visit the tourist spot and will shorten residence time”, and “no longer adjustment—leave the current tourist spot immediately”. It can be seen that the behavior adjustment of tourists under RTFDSI discussed in this paper belongs to the discrete decision-making behavior of tourists. Therefore, this paper used the MNL model [60,61] to build the tourists’ behavior adjustment model under RTFDSI. In addition, the behavior adjustment rules and relevant influencing factors are analyzed to clarify the interactive influence relationship among tourists’ information demand, RTFDS, and tourists’ behavior adjustment. This research can guide the implementation of RTFDS in tourist attractions.

4.2. Estimation Method of Multinomial Logit Model

The behavior adjustment process of a tourist from a selection scheme set under RTFDSI can be described by the utility function. According to the random utility theory, the utility function consists of two parts [57,60], as shown in Equation (1):
U i n = V i n + ε i n ( i A n ) ,
where U i n is the utility of the tourist n selects scheme i; V i n is the non-random change part (fixed term), calculated from the observed influencing factors variables; ε i n is the random change part (probability term), caused by the influence of other factors which cannot be observed and the deviation of the existing variables; A n is the selection scheme set, A n in this paper is 3.
Assuming that tourist n’ utility V i n is present in the linear relationship, the manifestations of V i n is Equation (2):
V i n = θ X i n = k = 1 K θ k X i n k ,
where θ = ( θ 1 , , θ k ) is the coefficient for X i n , X i n = ( X i n 1 , , X i n k , , X i n K ) is the influencing factor vector of tourist n select the scheme i.
If the alternative schemes are independent of each other, that is, the random change part (probability term) is independent and obeys the same Gumbel distribution, then the probability of tourist n choose the scheme i is shown in Equation (3) [57]:
P i n = e V i n j A n e V j n ( i j , j A n ) .
The unknown parameters θ of the MNL model can be estimated by the maximum likelihood method [61,62]. The t-test is used to judge the influence degree of influencing factors on decision-making behavior, when the absolute value of the t-test value is greater than 1.96, it shows that the influencing factors have a significant impact on the decision-making behavior at 95% confidence interval. The goodness ratio ρ 2 is used to measure the accuracy of the model, when ρ 2 reaches 0.2–0.4, the accuracy of the model is high [63,64].

5. Case Study

5.1. Case Introduction and Description

In order to obtain the tourist information demand, and analyze the influence of RTFDS on tourists’ behavior adjustment, the survey of tourists’ behavior adjustment under RTFDSI was designed and carried out. This paper adopted the face-to-face questionnaire survey method [65,66,67].
The questionnaire includes the information regarding:
(1)
Tourists’ socio-economic attributes, including gender, age, education level, occupation, monthly income, and whether tourist is a local tourist.
(2)
Tourists’ tourism behavior, including tourists’ tourism information (residence time, tourist congestion perception degree) of the current, previous, and next expected tourist spot, tour guide method, the number of visits, visiting purpose, travel mode, companions.
(3)
Tourists’ information demand of RTFDS, including preferred information release content, information manifestation form, information release location, information release media, information release frequency.
(4)
Tourists’ preferred behavior adjustment under RTFDSI was investigated and obtained. The tourists’ stated preference behavior adjustment scenario under RTFDSI is the following:
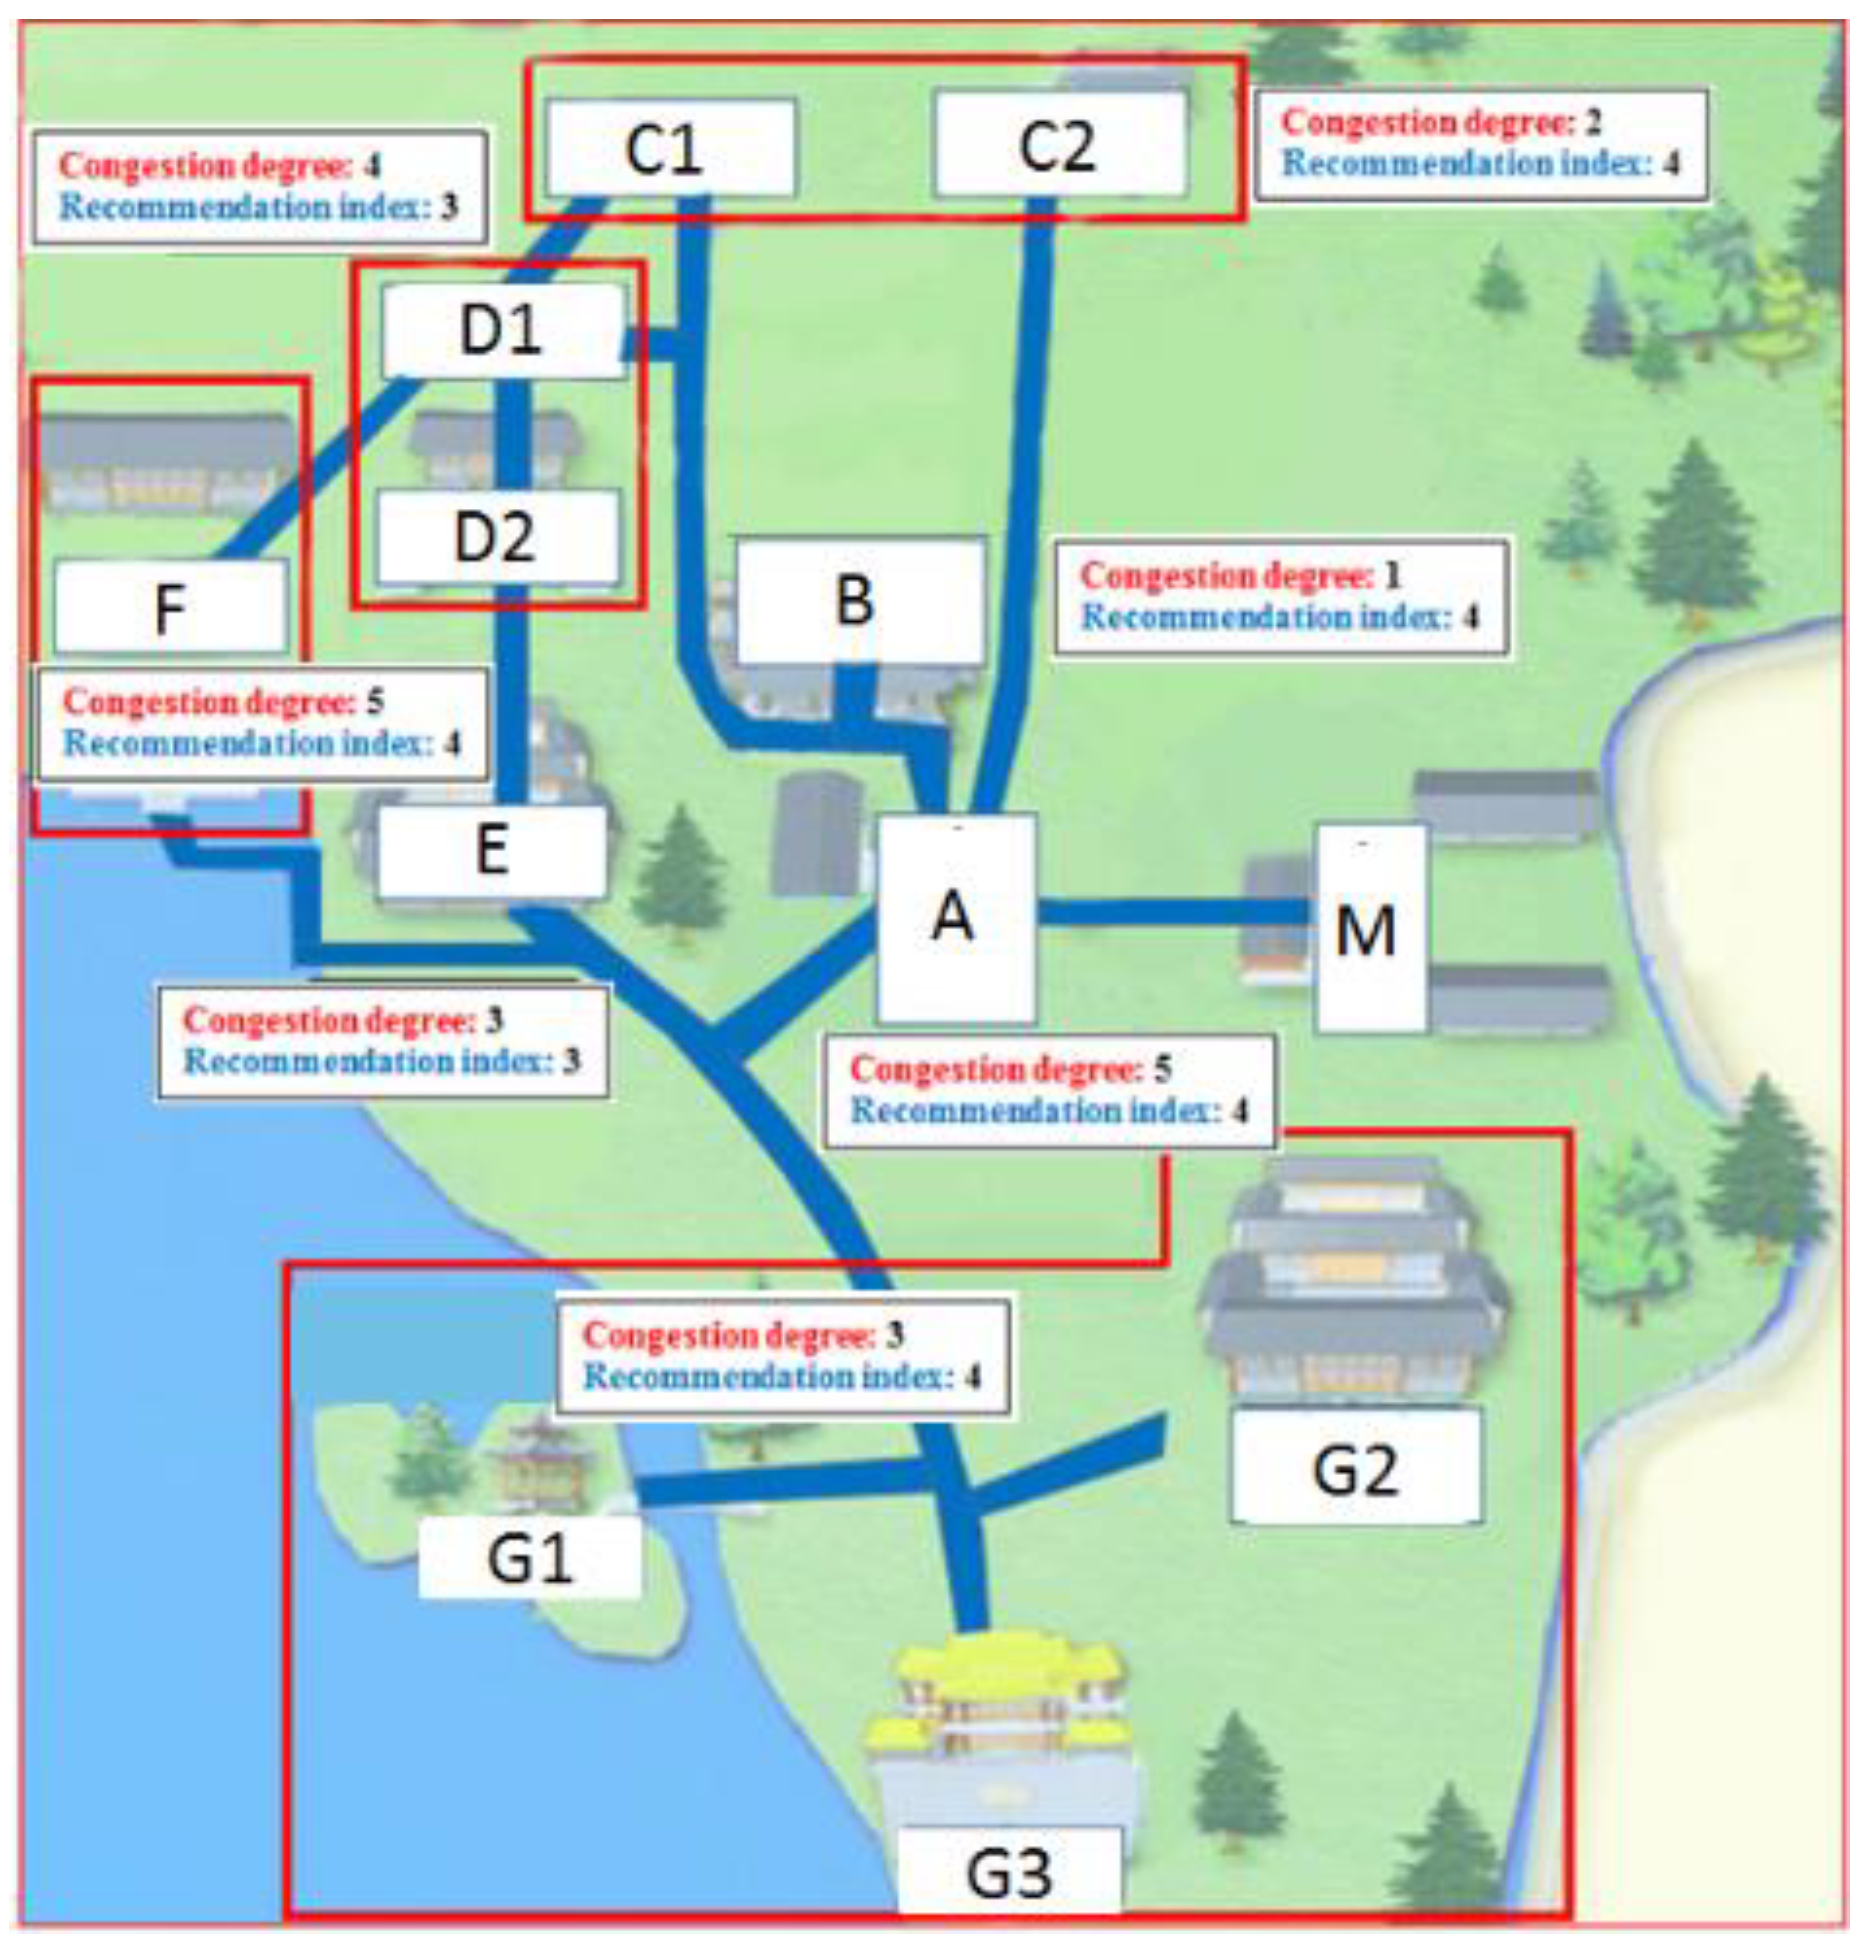
Constructing a RTFDSI release scenario as shown in Figure 4. The information release content of RTFDS includes the tourist congestion perception degree and recommendation index of each tourist spot. The investigators show RTFDSI to tourists in the A-G 7 tourist spots (or tourist spots group) in the Palace Area. Then, obtaining tourists’ virtual travel activity by asking, “the following figure shows you the tourist congestion perception degree and recommendation index of each tourist spot in the Palace Area at a certain time between 10:00 and 11:00. When you receive this information in the tourist spot which you are visiting, what will you make the next tourism decision?” This investigation can inquire about tourists’ behavior adjustment under RTFDSI, the behavior adjustment includes: “cognitive adjustment—continue to visit the tourist spot and will not shorten residence time”, “behavior adjustment—continue to visit the tourist spot and will shorten residence time”, and “no longer adjustment—leave the current tourist spot immediately”.
The tourist congestion perception degree ranges from 1 to 5, indicating the change range from “uncrowded” to “very crowded” [68,69]. Before the survey, the visual evaluation method was used to score the tourist congestion perception degree of each tourist spot during the tourist flow peak period [70]. According to the attributes of each tourist spot in the Palace Area, the recommendation index of each tourist spot is determined. The above-mentioned tourist congestion perception degree information and recommendation index information are all the information needs of tourists under the scheme of RTFDS.
The Summer Palace is rich in nature, culture, history, religion, and other attributes, attracting a large number of tourists from all over the world. The problem of tourist flow congestion is especially serious on holidays. In the internal of the Summer Palace, due to the attribute differences of tourist spots and the imperfection of tourism information release, a great many tourists gather in some core tourist spots of the Palace Areas, such as Happiness and Longevity, Hall of Benevolence and Longevity, which is prone to stampede and other safety events. Meanwhile, there exist some periphery tourist spots (e.g., The Garden of Virtuous Harmony, Wenchang Gallery, etc.) with a little tourist flow, which do not play a good role in diverting tourist flow. Therefore, the Palace Area of the Summer Palace was selected as the research object to analyze the behavior adjustment of tourists under RTFDSI. Analyzing whether tourists can reduce their residence time in core tourist spots with high tourist congestion perception degree and transfer to periphery tourist spots with low tourist congestion perception degree through releasing RTFDSI. The survey was conducted on November 5, 2017.
After pre-treatment and cleaning for the data, 202 completely valid questionnaires were obtained. The gender, age, education level, and visit number of survey samples are summarized in Table 1, comparing with the analysis of tourists in Beijing [71]. The proportion of male and female is 1:1. The composition of the gender is roughly like the gender structure of the analysis of Beijing tourists. For age distribution of tourists in Beijing, the proportion of 20–39, >39, <20 gradually decreased, it is the same pattern as our sample. In general, the survey data reasonably conform to the representative sample and can be used for further analysis. The education background of the respondents are mainly undergraduate college and junior college, accounting for 59.4%; 48.5% of the respondents visited the tourist attraction for the first time, 33.7% of respondents have visited the tourist attraction 2–3 times.

5.2. Data Analysis

5.2.1. Information Release of RTFDS

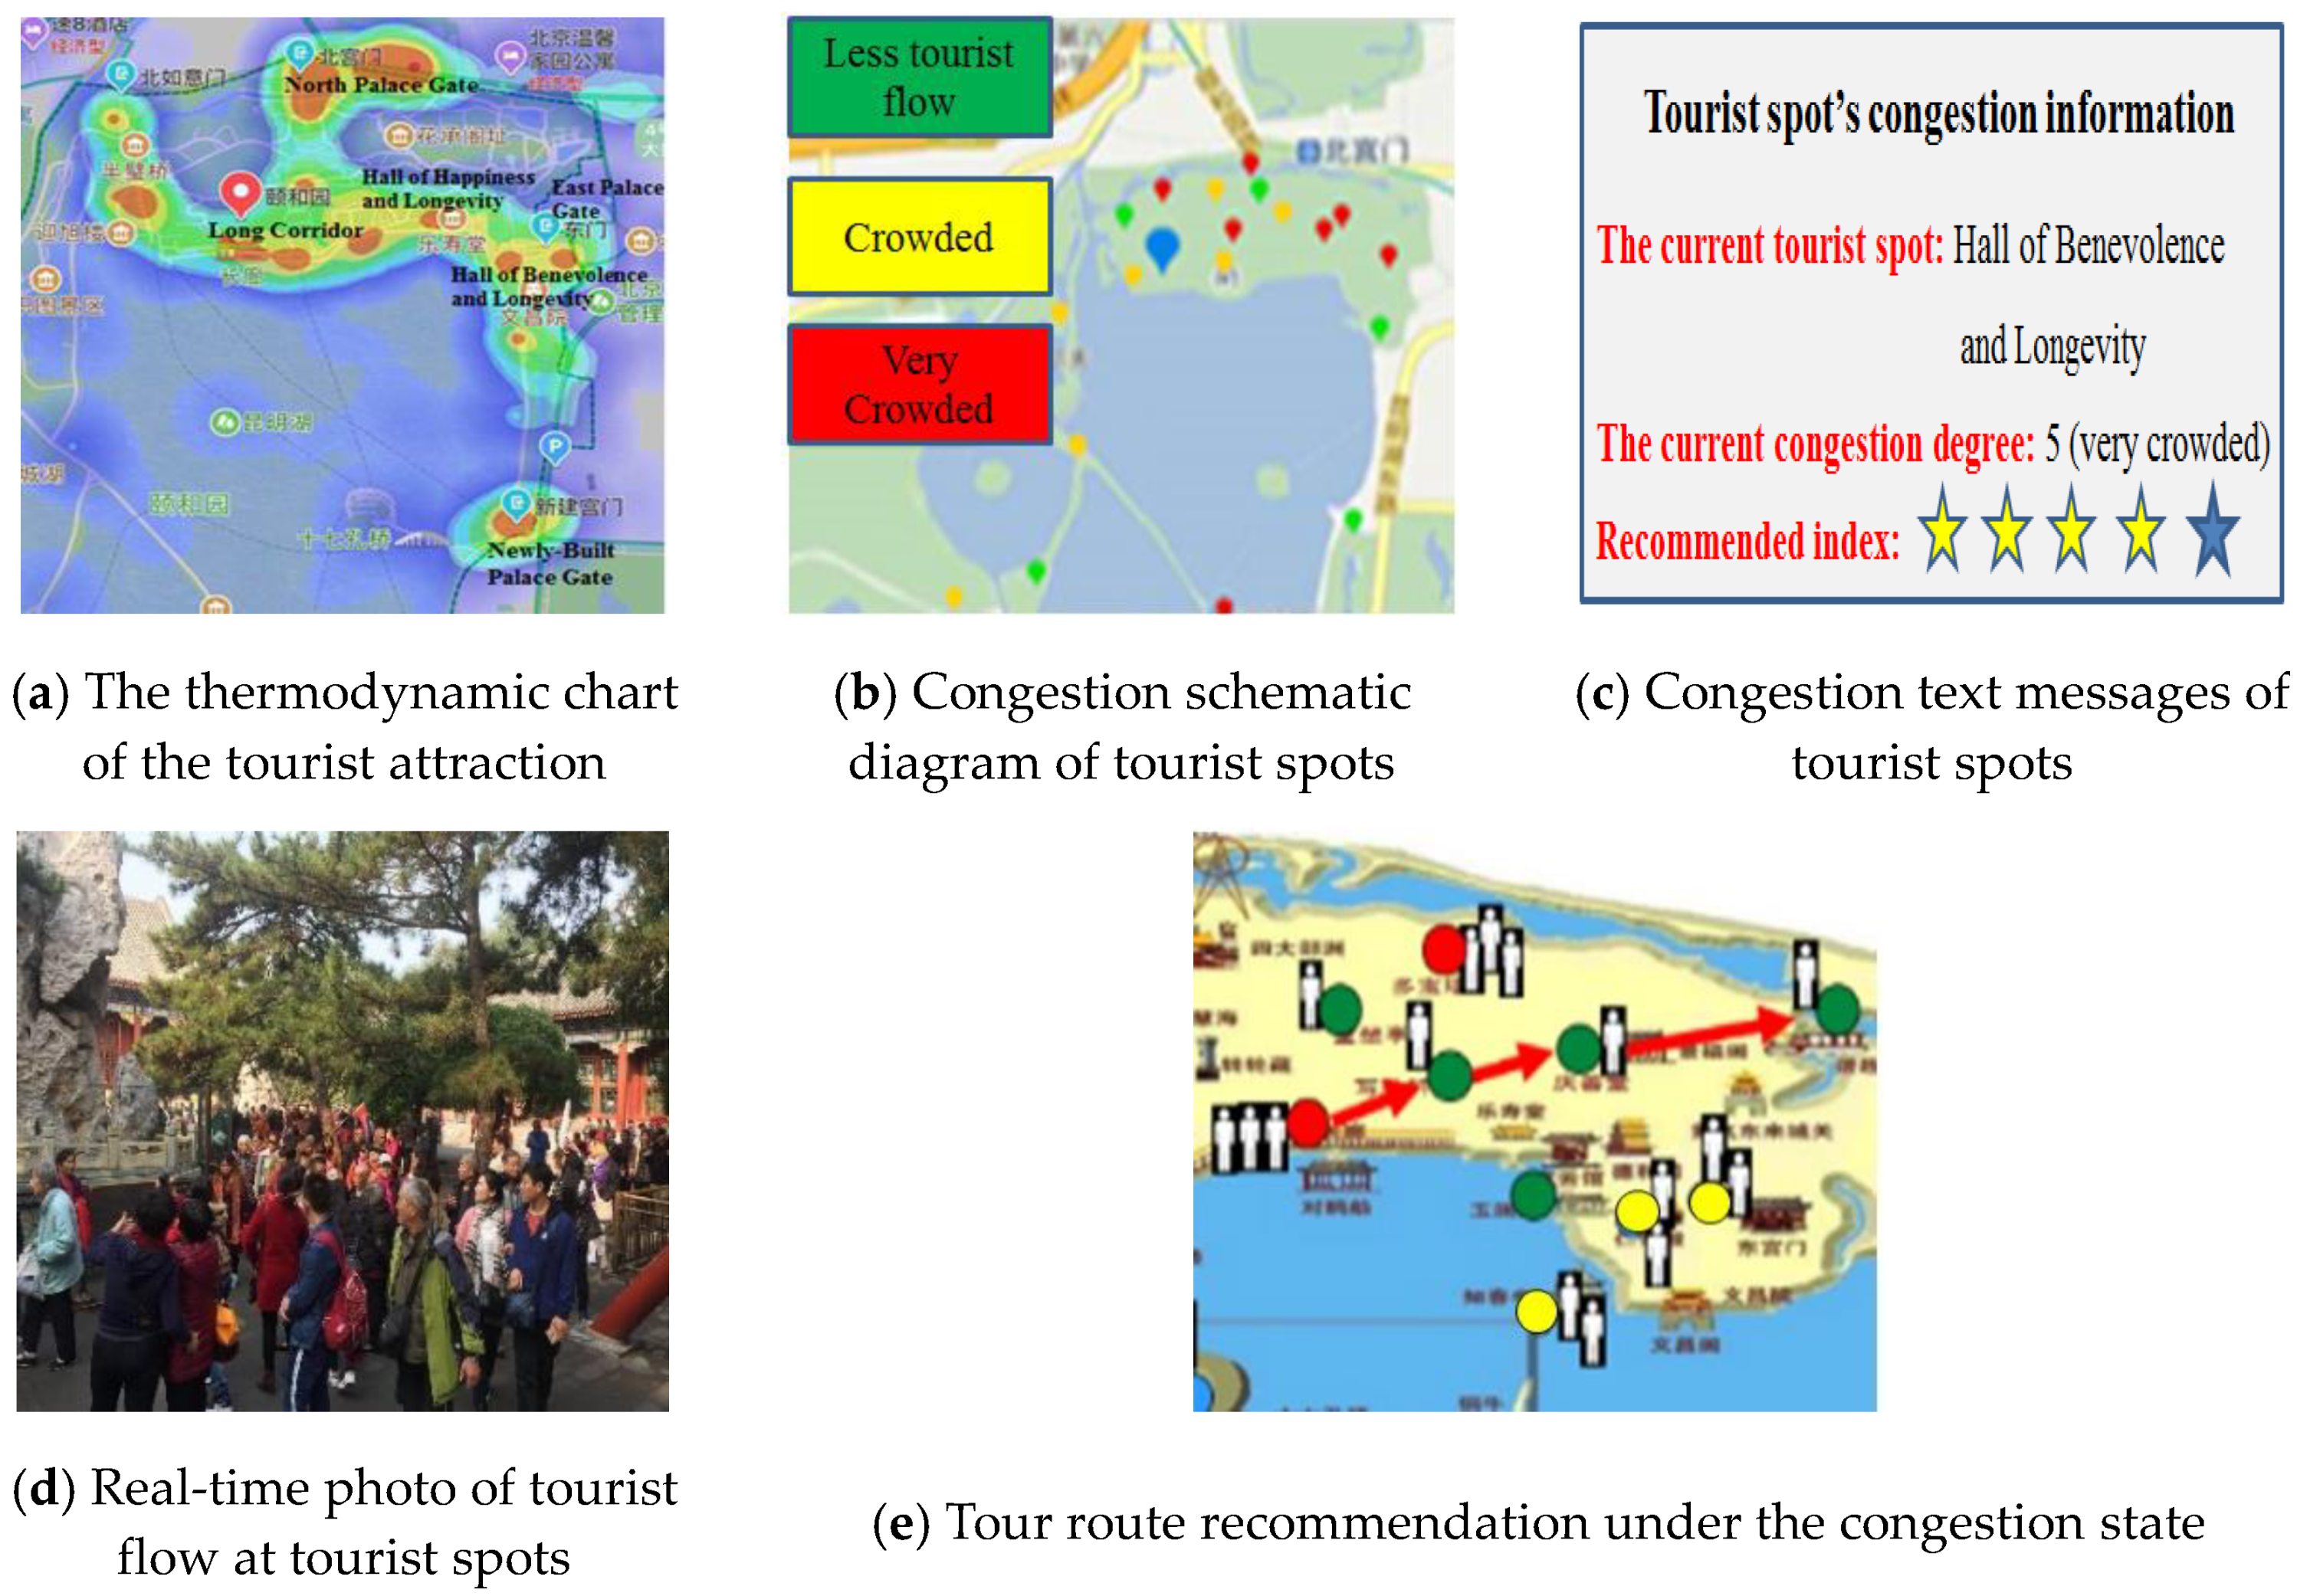
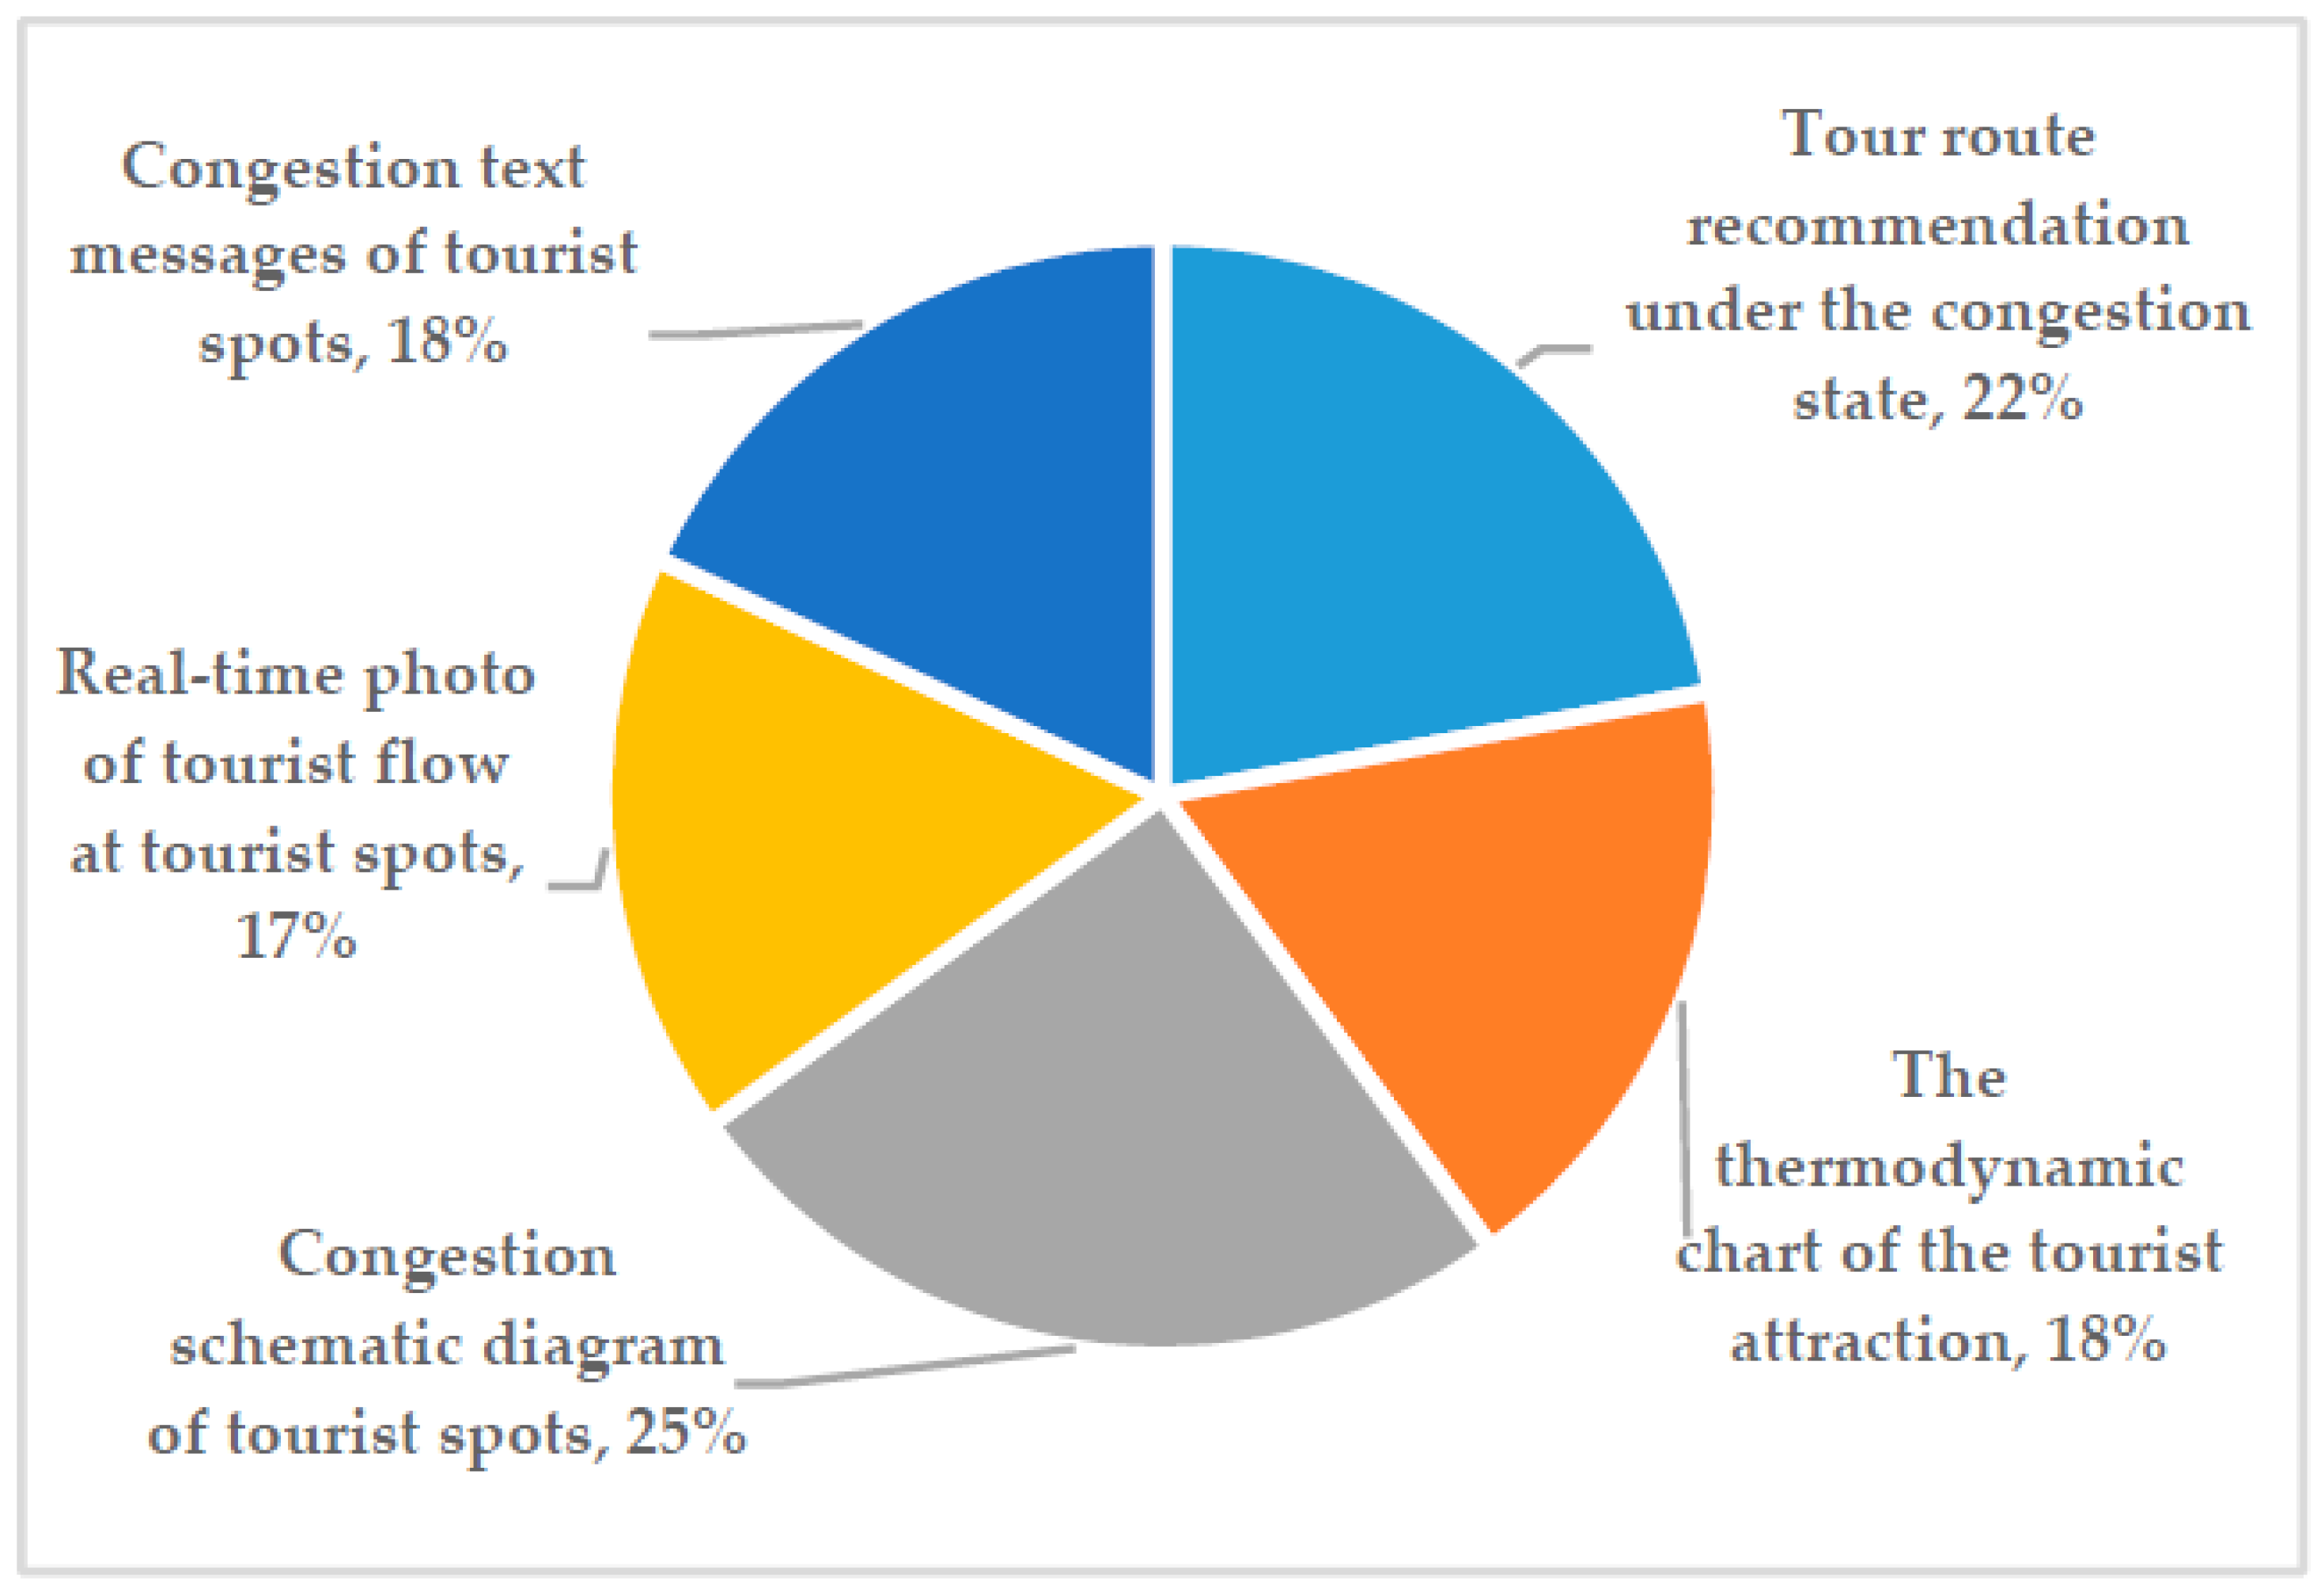
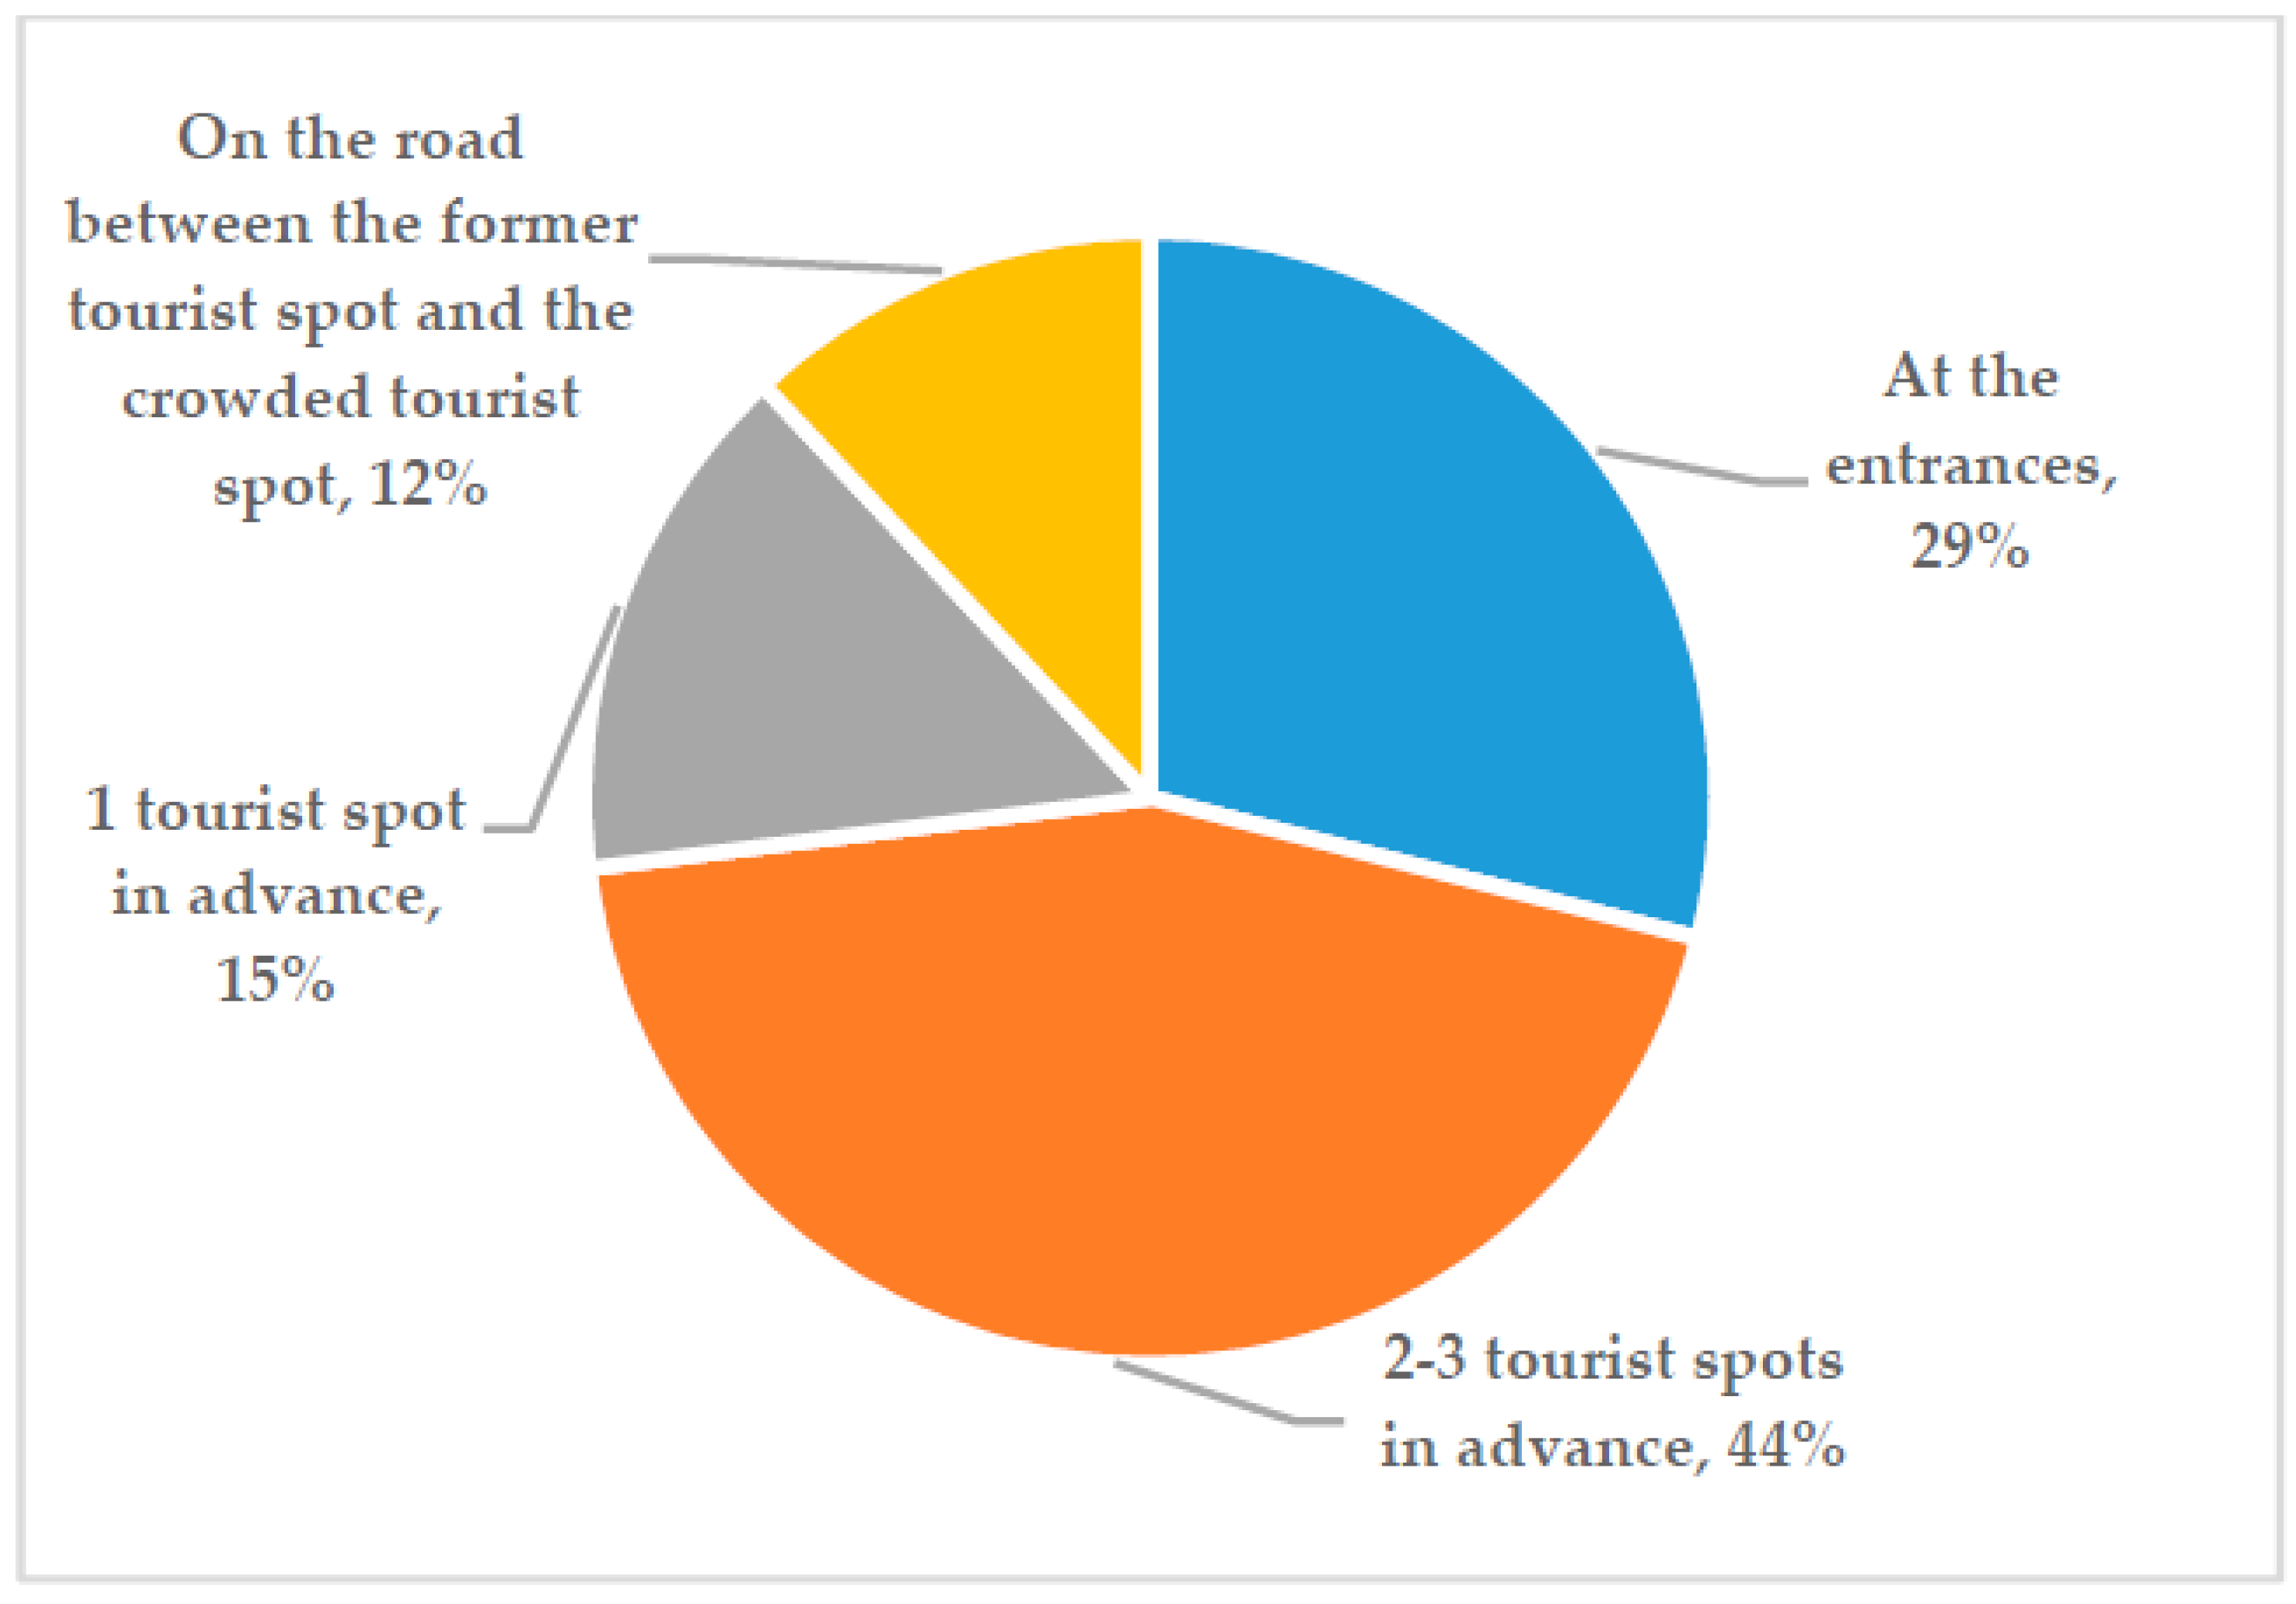
Based on the survey data, the information release mode (e.g., information manifestation forms, information release location, information release media, information release frequency) of RTFDS was discussed. Figure 5 shows several types of information manifestation forms of RTFDS. According to Figure 6, tourists’ preference for information manifestation forms is evenly distributed, and the highest proportion is congestion schematic diagram of tourist spots and tour route recommendation under congestion state, the proportions respectively are 25% and 22%. According to Figure 7, for the information release location of RTFDS, tourists’ preference locations are 2–3 tourist spots in advance and at the entrance, the proportions respectively are 44% and 29%. In other aspects, tourists’ preference information release media are LED display screen, broadcasting, and official platform of the tourist attraction, accounting for 42%, 23%, and 22% respectively. Tourists’ preference information release frequency is less than once every 15 min, accounting for 87%.

5.2.2. Tourists’ Behavior Adjustment under RTFDSI

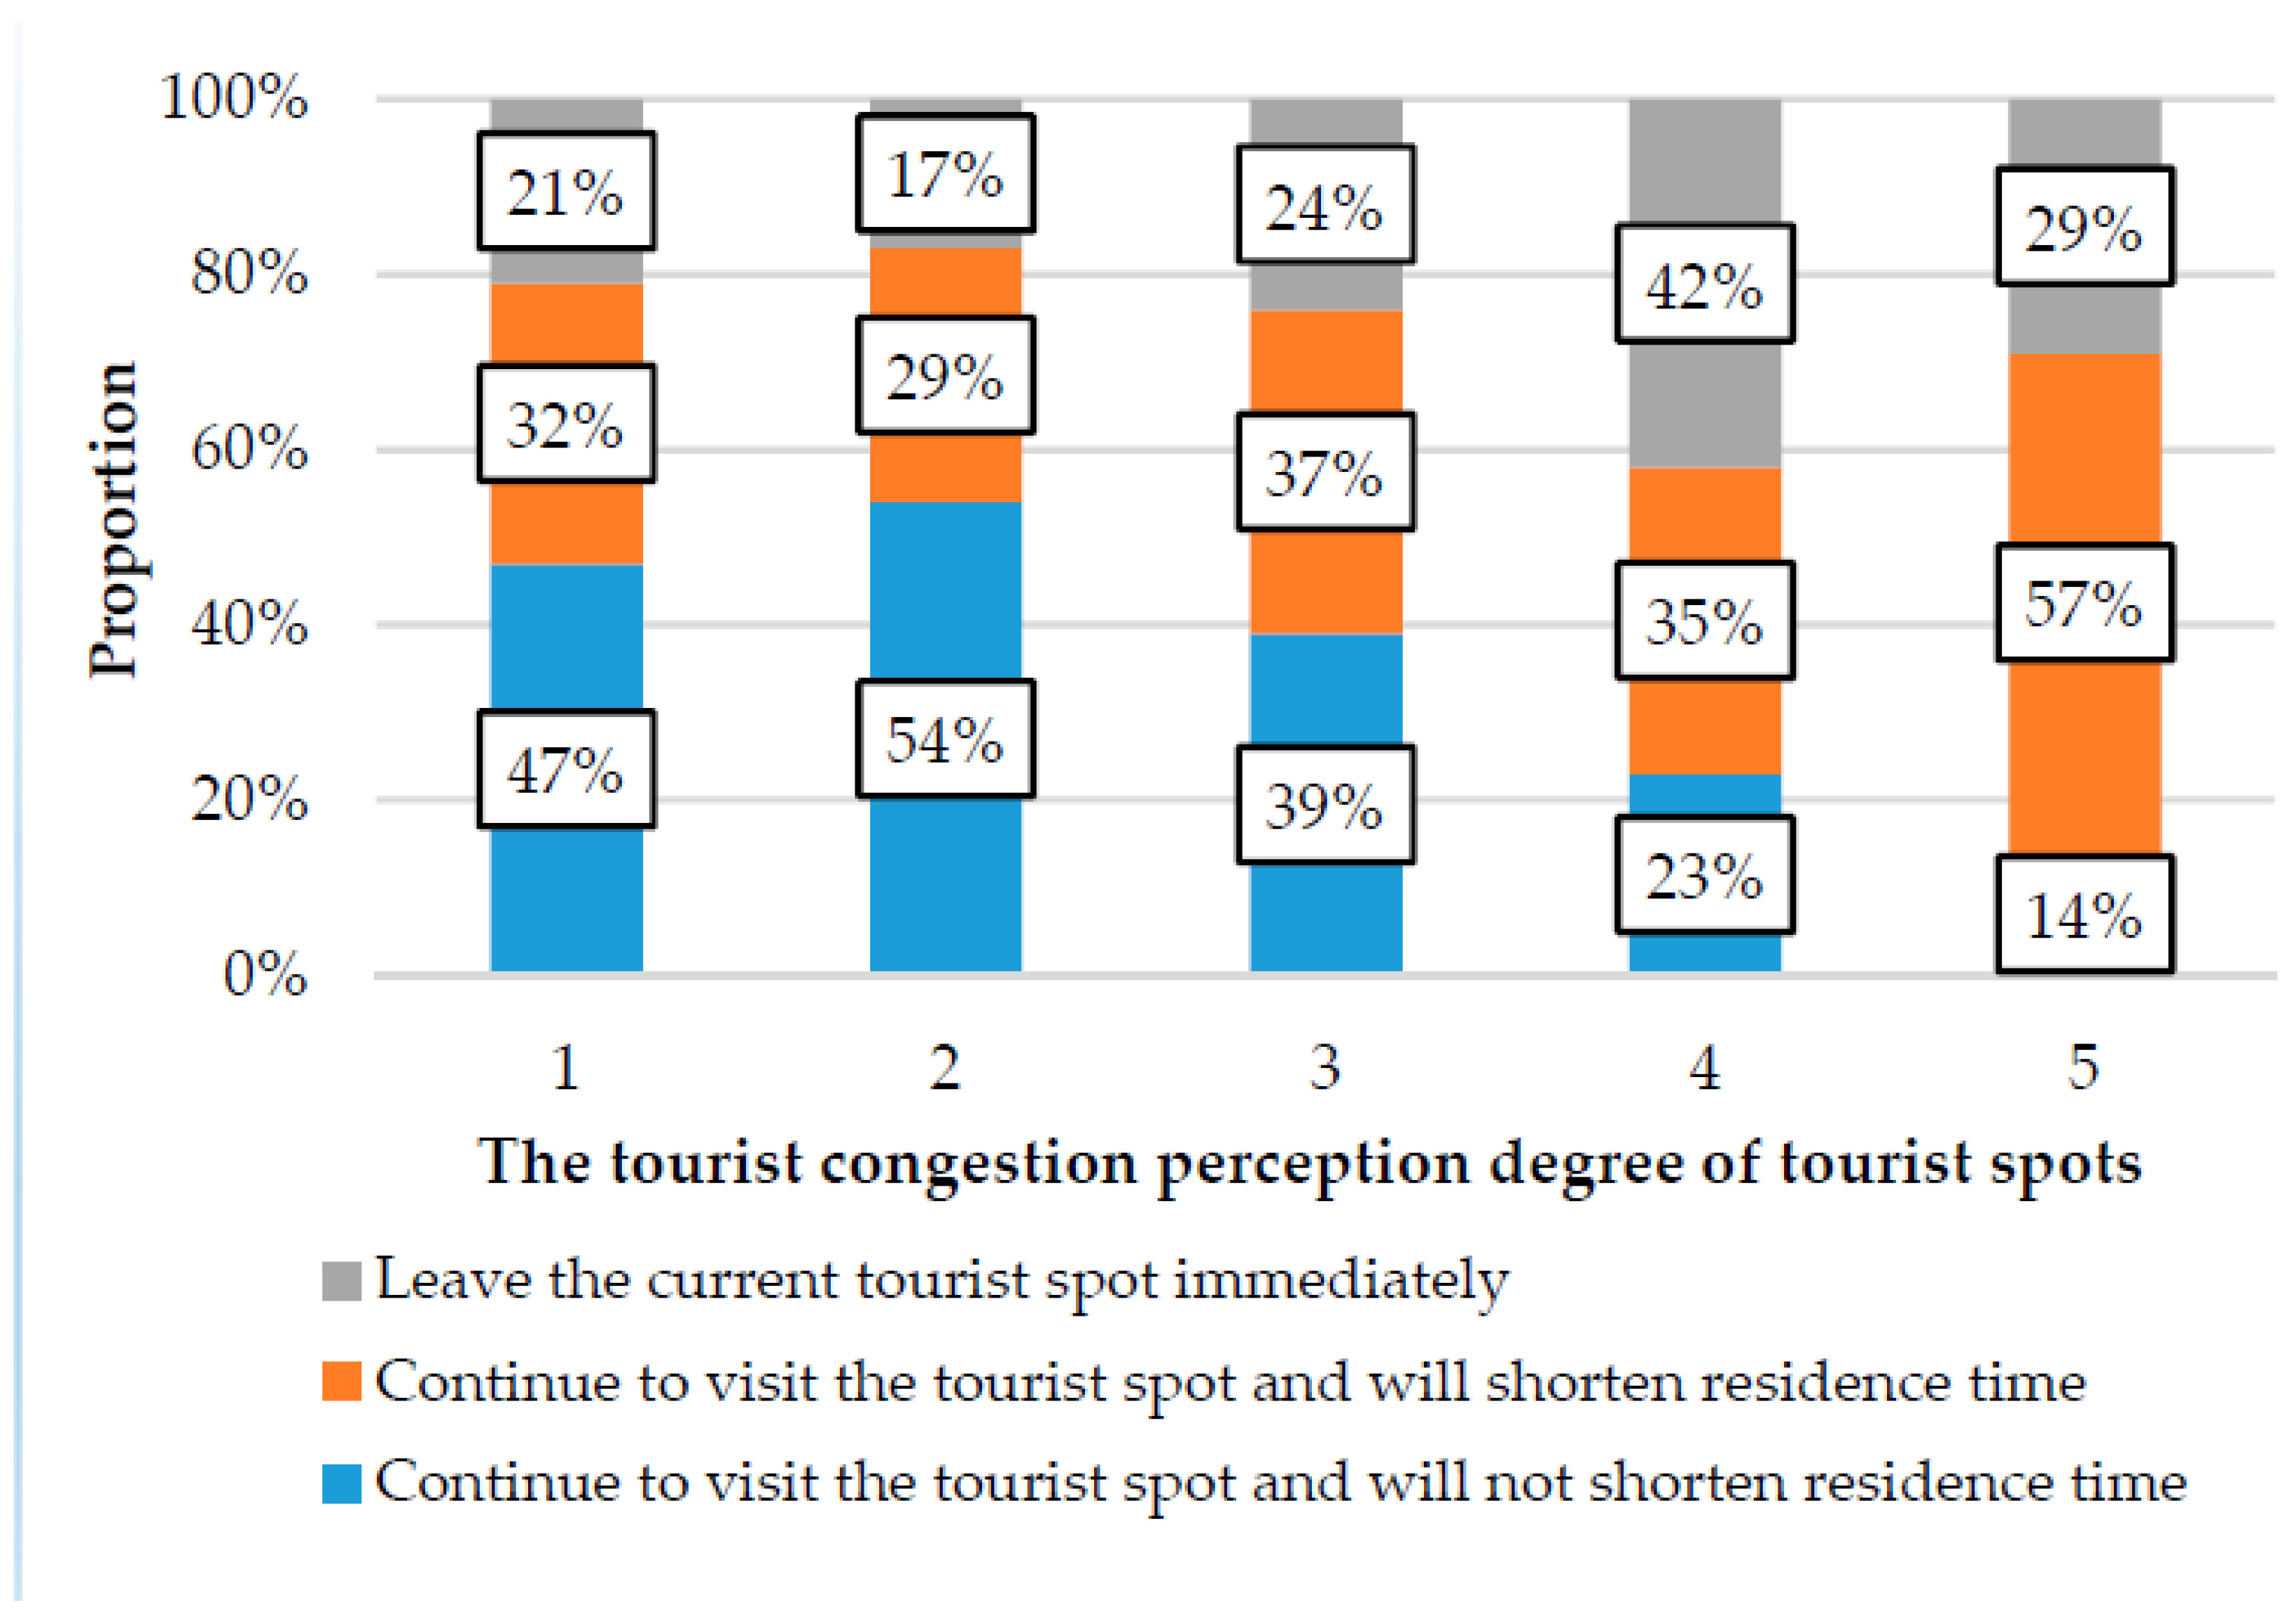
The distribution of tourists’ behavior adjustment in tourist spots with different tourist congestion perception degree is shown in Figure 8. When tourist spots’ tourist congestion perception degree equals to 1 or 2, the proportions of tourists choosing “continue to visit the tourist spot and will not shorten residence time” is the highest, accounting for 47% and 54% respectively. When the tourist congestion perception degree of tourist spots is 4, the proportion of tourists choosing “leave the current tourist spot immediately” is the highest, accounting for 42%. When the tourist congestion perception degree of tourist spots is 5, the proportion of tourists choosing “continue to visit the tourist spot and will shorten residence time” is the highest, accounting for about 57%. It can be seen that under the condition of RTFDSI, tourists tend to maintain their tourism satisfaction through cognitive adjustment when the tourist congestion perception degree of tourist spots is low (= 1, 2), tourists tend to maintain their tourism satisfaction through behavior adjustment and no longer adjustment when the tourist congestion perception degree of tourist spots is high (= 4, 5).
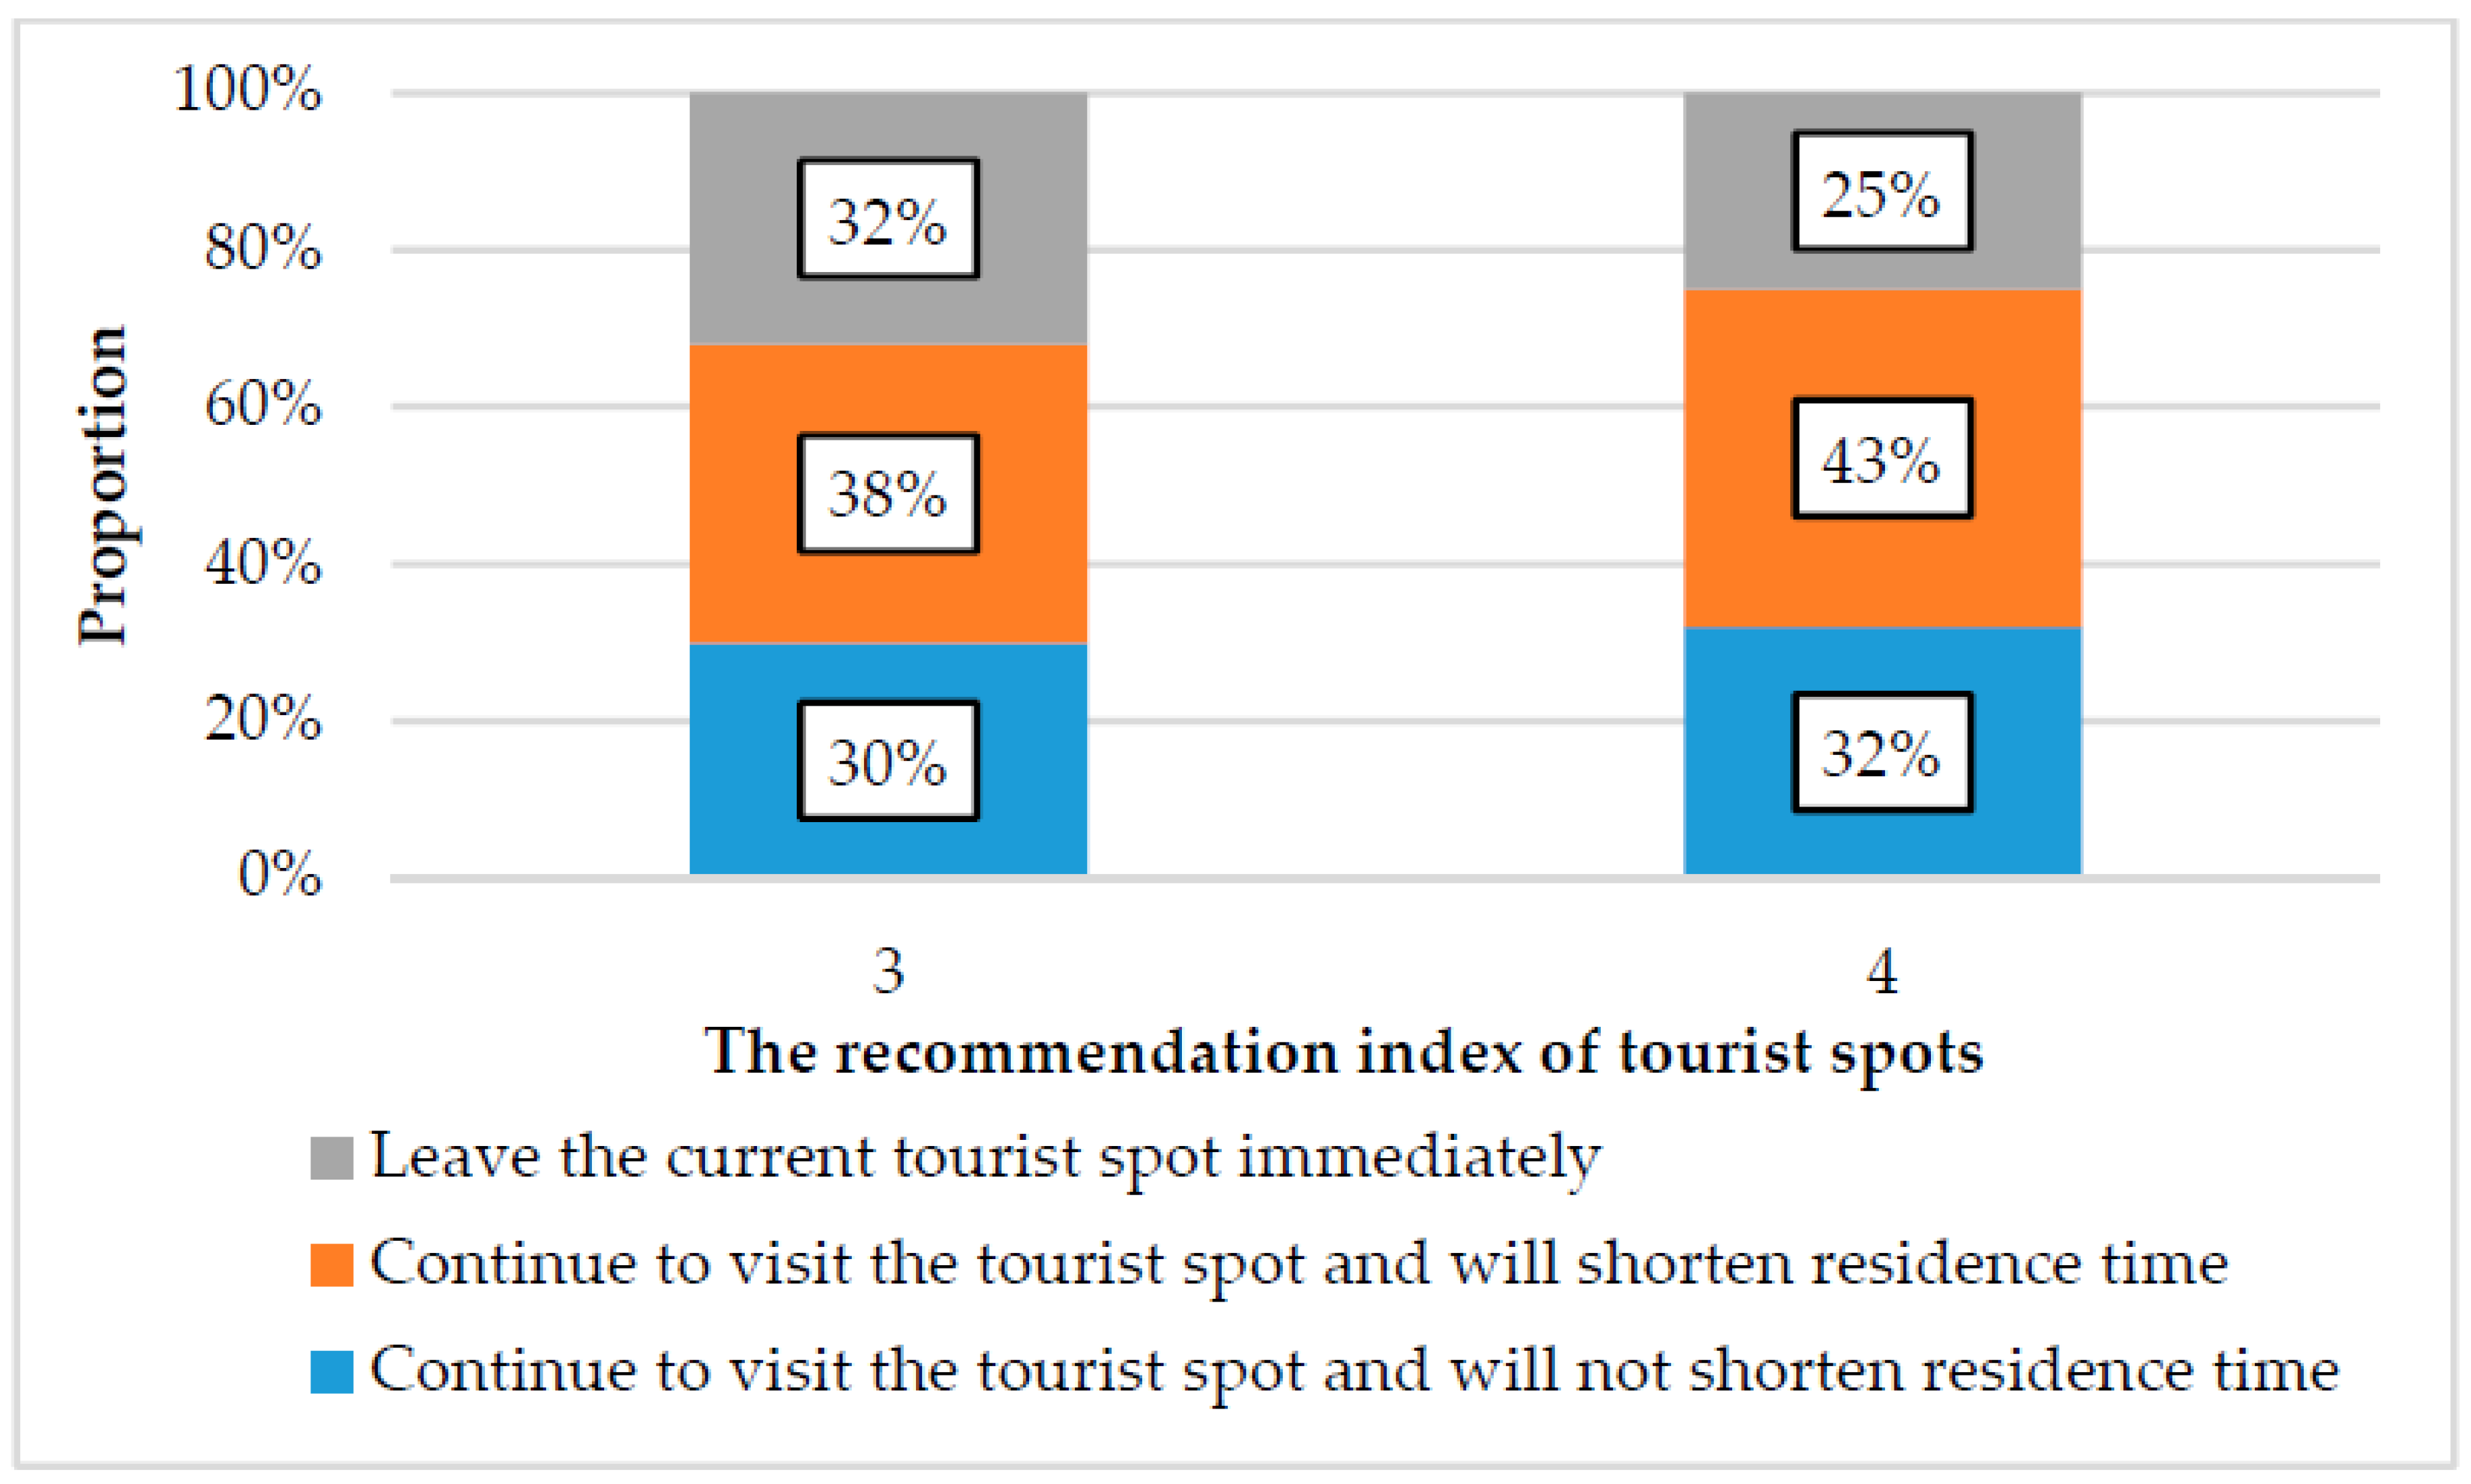
The distribution of tourists’ behavior adjustment under different tourist spot recommendation index is shown in Figure 9. No matter whether the tourist spot recommendation index is 3 or 4, the proportions of tourists choosing “continue to visit the tourist spot and will shorten residence time” is the highest, accounting for 38% and 43% respectively. With the tourist spot recommendation index increasing from 3 to 4, the proportion of tourists choosing “continue to visit the tourist spot and will not shorten residence time” increases from 30% to 32%, the proportion of “continue to visit the tourist spots and will shorten residence time” increases from 38% to 43%, and the proportion of “leave the current tourist spot” decreases from 32% to 25%. It can be seen that under the condition of RTFDS, when tourists at the tourist spots with a low recommendation index, they tend to maintain their tourism satisfaction through behavior adjustment and no longer adjustment; when tourists at the tourist spots with a high recommendation index, they tend to maintain their own tourism satisfaction through behavior adjustment and cognitive adjustment.

6. Results and Discussion

6.1. Estimation Results of Tousists’ Behavior Adjustment Model

Through the method of stated preference (SP) survey, the behavior adjustment of tourists under RTFDSI was obtained, and tourists’ behavior adjustment model under RTFDSI was constructed based on the MNL logit model.
Variables were screened by contingency table test and bivariate correlation analysis. Through variable screening, the discrete variables brought into the model were tourists’ socio-economic attributes (education level), tourists’ tourism behavior attributes (e.g., the number of visits, tour guide mode), RTFDSI attributes (e.g., the tourist congestion perception degree of tourist spots), tourists’ information demand attributes (e.g., tourists whether concern the congestion duration of core tourist spots, the distance between core tourist spots and recommended periphery tourist spots, the tour route recommendation under congestion conditions, the ornamental value of each tourist spot, the location and manifestation form of information release). The continuous variable is the tourist’s age. The definition of above variables is shown in Table 2.
According to the characteristic variables and data structure table of the MNL model, the utility functions of three choices are established, which are shown in Equations (4)–(6):
V 1 n = θ 2 + θ 3 X 1 n 3 + θ 9 X 1 n 9 + θ 12 X 1 n 12 + θ 15 X 1 n 15 + θ 20 X 1 n 20 ,
V 2 n = θ 1 + θ 5 X 2 n 5 + θ 6 X 2 n 6 + θ 7 X 2 n 7 + θ 8 X 2 n 8 + θ 10 X 2 n 10 + θ 18 X 2 n 18 ,
V 3 n = θ 4 X 3 n 4 + θ 7 X 3 n 7 + θ 11 X 3 n 11 + θ 14 X 3 n 14 + θ 16 X 3 n 16 + θ 17 X 3 n 17 + θ 19 X 3 n 19 ,
where V 1 n , V 2 n , V 3 n are the effects of “continue to visit the tourist spot and will not short the residence time”, “continue to visit the tourist spot and will shorten the residence time”, and “leave the current tourist spot immediately”.
In this paper, the MNL model is calibrated by Transcad with the method of phased estimation. The model calibration and test results are shown in Table 3. The absolute value of t-test value of variables is greater than 1.96, which indicates that the variables have a significant impact on tourists’ behavior adjustment at 95% confidence level. The goodness ratio is 0.203, which means that the accuracy of the MNL model is higher [63,64]. There is a strong ability to explain tourists’ behavior adjustment under RTFDSI.
The model was analyzed according to Table 3:
(1)
In terms of RTFDSI, the coefficient θ 3 is positive, which indicates that when the tourist spot tourist congestion perception degree is low (equals to 1 or 2), the tourist tends to continue to visit the tourist spot and will not shorten residence time. The coefficient θ 5 is positive, which indicates that when the tourist spot tourist congestion perception degree is high (equals to 5), the tourist tends to continue to visit the tourist spot, but will shorten residence time.
(2)
In terms of tourists’ social and economic attributes, the influence coefficient θ 6 is positive, which indicates that the older the tourist is, the more likely to continue to visit the tourist spot and will shorten residence time. The influence coefficients θ 7 and θ 8 are all positive, indicating that the tourist whose education level is undergraduate and junior college tends to shorten residence time or leave the current tourist spot immediately; the tourist whose education level is Master and Doctor tends to shorten residence time under RTFDSI.
(3)
For tourists’ tourism behavior attributes, the influence coefficient θ 9 is positive, which indicates that the tourist who visits the first time tends to continue to visit the tourist spot and will not shorten residence time under RTFDSI. The influence coefficient θ 10 is positive, which indicates that the tourist who visit 2–3 times tends to shorten residence time. The influence coefficient θ 11 is positive, which indicates that the tourist who visit 4–5 times tends to leave the current tourist spot immediately.
(4)
In terms of tourists’ information demand, the influence coefficients θ 14 and θ 16 are positive, which indicates that the tourist who concerns about the congestion duration of core tourist spots and the tour route recommendation tends to leave the current tourist spot immediately. The influence coefficient θ 15 is negative, which indicates that the tourist who concerns the distance between core and recommended periphery tourist spot is not inclined to “continue to visit and will not shorten the residence time”.

6.2. Tourists’ Behavior Adjustment under RTFDSI in The Palace Area

Taking the calibrated Equations (4)–(6) into Equations (1)–(3), based on the questionnaire data in each tourist spot, the behavior adjustment probability value of tourists in each tourist spot in the Palace Area under RTFDSI can be obtained, as shown in Table 4. Analyzing the average value of core tourist spot A and F, 66.5% and 16.5% of tourists will choose “continue to visit and will shorten the residence time” and “leave the current tourist spot immediately” under RTFDSI. While, for periphery tourist spots with low tourist congestion perception degree, a larger proportion of tourists in tourist spots B and C tend to “continue to visit and will not shorten residence time”. The above results show that when tourists get RTFDSI in core tourist spots, they tend to improve their tourism satisfaction through “behavior adjustment” and “no longer adjustment”, when tourists get RTFDSI in periphery tourist spots, they tend to improve tourism satisfaction through “cognitive adjustment”. The “behavior adjustment” and “no longer adjustment” all shorten tourists’ residence time in tourist spots, and further affect the spatial-temporal distribution of tourists among tourist spots. In order to further quantitatively measure the impact of tourists’ adjustment behavior (tourists’ residence time adjustment) on the status of tourist flow among tourist spots under RTFDSI, this paper respectively established the tourist flow diversion simulation model under null information and RTFDSI.

6.3. The Tourist Flow Diversion Simulation Model

6.3.1. Tourist Flow Diversion Simulation Model under Null Information

This paper took the tourist spots of the Palace Area in tourist flow peak period “10:00–11:00” as the research objects, established the tourist flow diversion simulation model under null information, analyzed the tourist flow reception level of each tourist spot in the area through the operating model, and provided the basic data for the establishment of the tourist flow diversion simulation model under RTFDSI.
The steps to build the simulation model include investigating the spatial layout of the simulation area and the travel rules of tourists in the simulation area, setting the flow chart, and setting the properties of tourist agents.
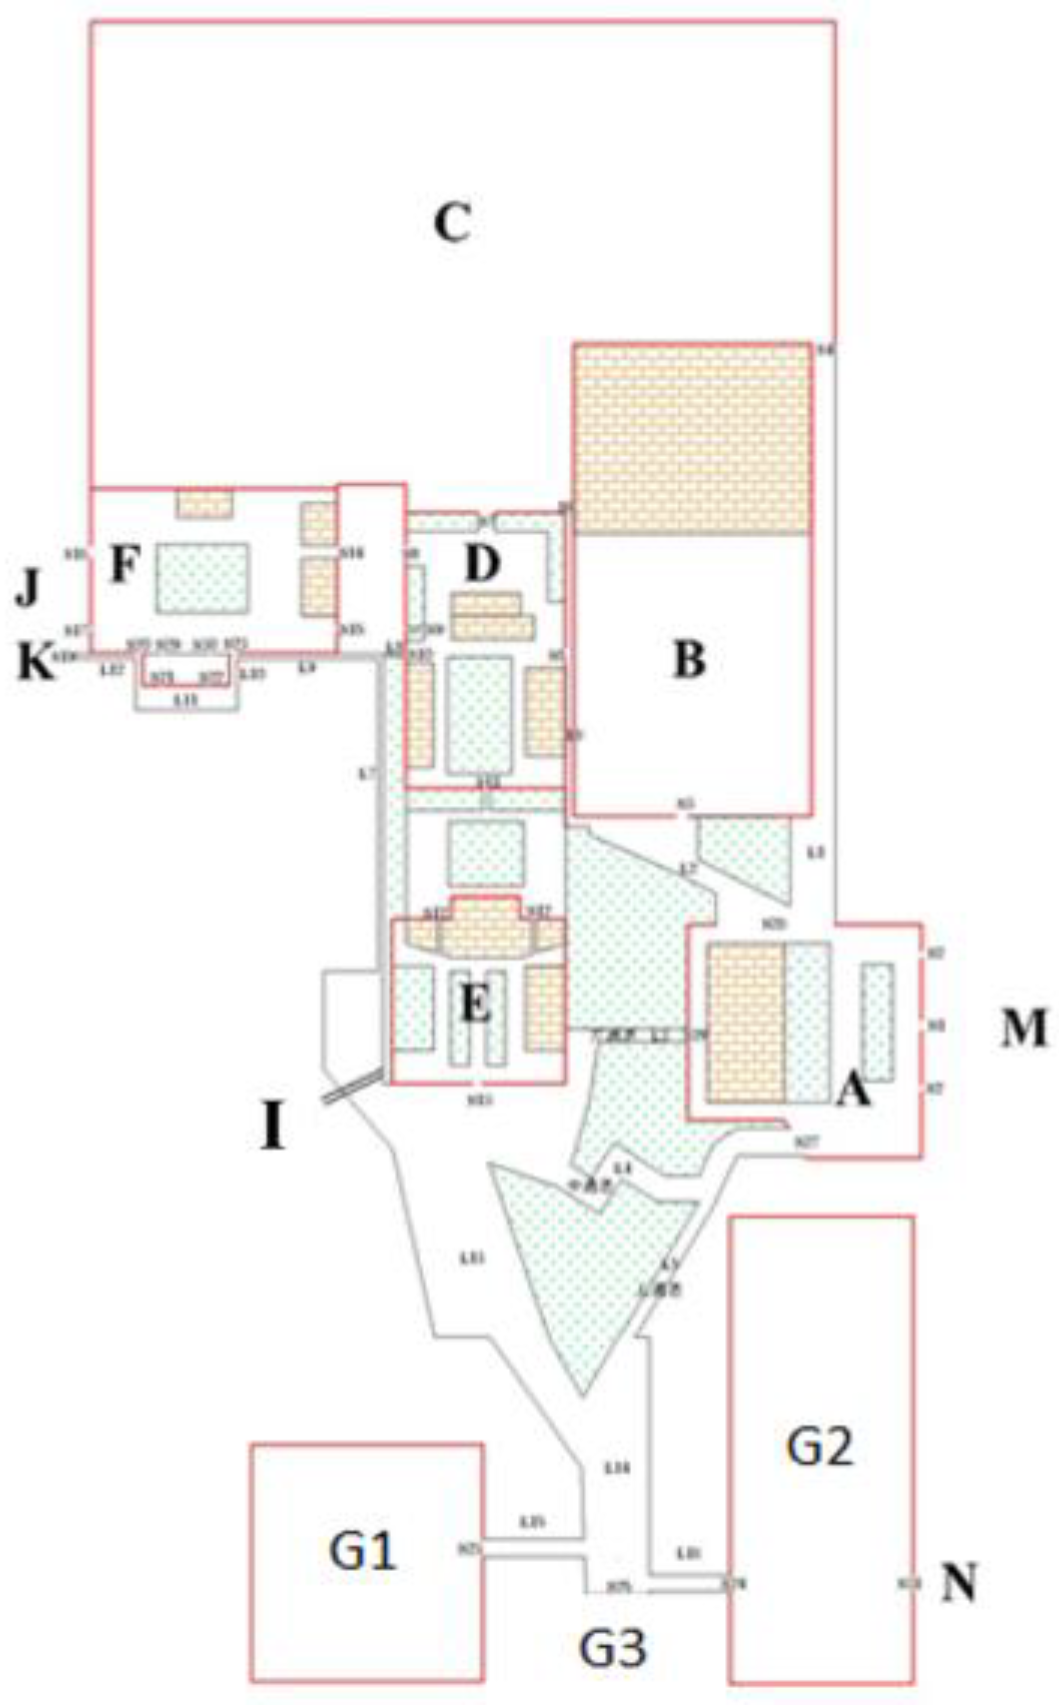
Firstly, the spatial layout of the Palace Area was investigated to create the simulation area which includes tourist spots and road network. Based on the map data (e.g., Baidu, Gaode) and field survey data, AutoCAD was used to draw the tourist spots and road network of the Palace Area, as shown in Figure 10. Then, the AutoCAD file was imported into the Anylogic model [72].
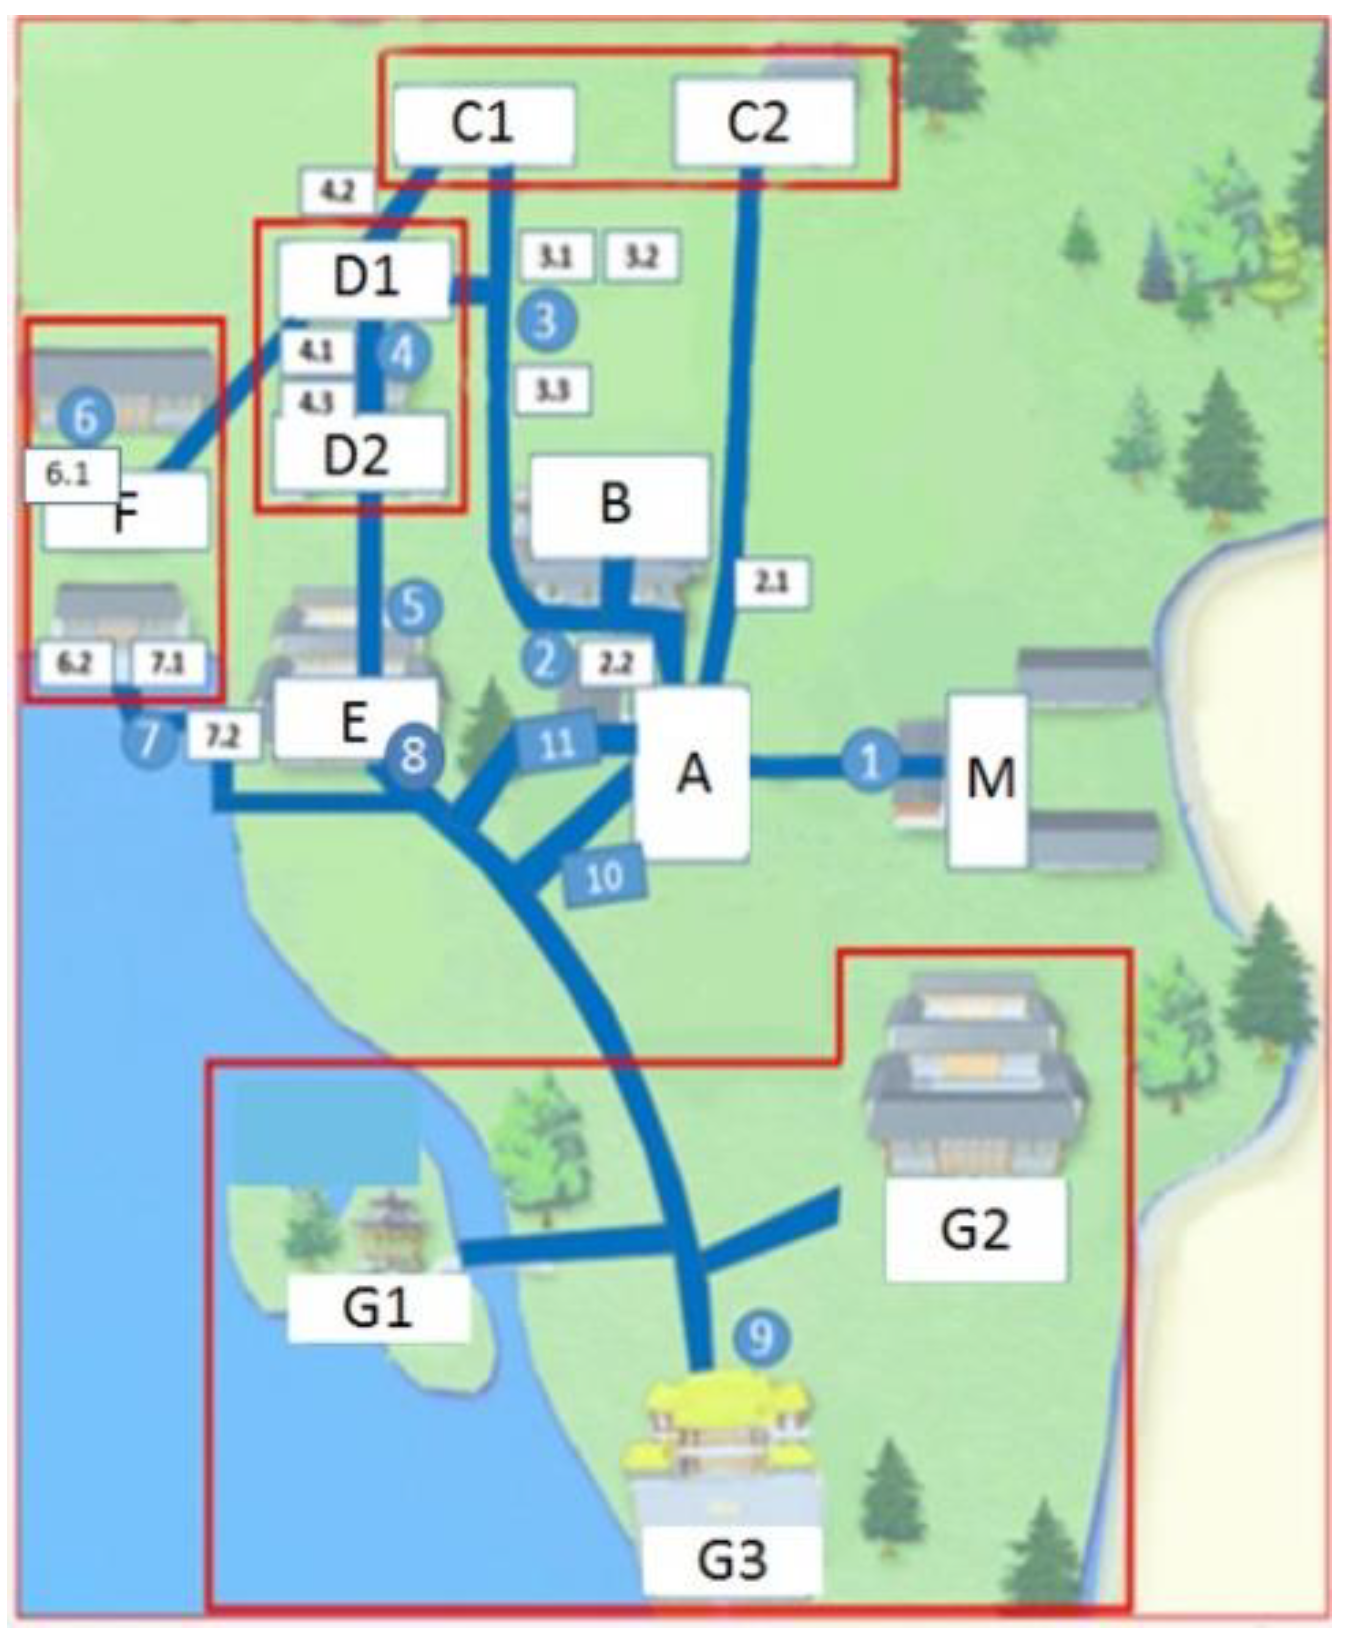
Secondly, the travel rules of tourists among tourist spots were investigated. Before the simulation, it is necessary to investigate tourists’ transfer probability among tourist spots, as the basic data of the simulation model. Figure 11 is the survey point map of the Palace Area, with a total of 11 survey points. The Palace Area is composed of A-G 7 tourist spots (or tourist spots group), A-Hall of Benevolence and Longevity, B-Garden of Harmonious Virtue, C1-Longevity Hill, C2-Garden of Harmonious Interest, D1-Phoenix Tail Pine, D2-Hall of Fragrant Grass, E- Hall of Jade Ripples, F- Hall of Happiness and Longevity, G1- Heralding Spring Pavilion, G2- Wenchang Gallery, and G3- Wenchang Pavilion. Among them, A, D, and F are the core tourist spots and the rest are periphery tourist spots [15]. Point J and K are the west entrances and exits of the Palace Area, point G3 is the south entrance and exit, point M is the east entrance and exit, point C1and C2 are the north entrance and exit. The blue road section is the path which connects the above tourist spots. When conducting the investigation, the two-way tourist flow volume on the road during peak period (10:00–11:00) is counted at 5 min time intervals, the individual tourists and group tourists are counted respectively. The survey time is 5 November 2017. The method of “manual counting + video camera” was adopted to count the tourist flow volume.
The travel rules of tourists among tourist spots include the residence time, tourism speed, tourism direction (transition probability among tourist spots), and tourist flow volume into the simulation environment [73]. According to the tourist questionnaire and follow-up survey, the residence time, tourism speed of individual and group tourists in each tourist spot of the Palace Area are determined, as shown in Table 5; Table 6. According to the continuous observation of tourist flow transfer behavior among 11 survey points, the tourism direction of individual tourists and group tourists among tourist spots in the Palace Area is obtained in peak period 10:00–11:00. For the tourism direction, taking tourist spot A (Hall of Benevolence and Longevity) as an example, Table 7 shows the proportion of tourist flow of individual tourists and group tourists transfer to the surrounding tourist spots or roads at peak period 10:00–11:00 in the tourist spot A. Table 8 shows the tourist flow entering the simulation environment during the peak period 10:00–11:00.
Thirdly, setting the flow chart to describe tourists’ travel behavior in the tourist dynamic model. The several modules should be set, such as generation source, disappearance source, designated destination, walking path, waiting time. Then, the connector is used to connect each module according to the actual tourist flow situation [72].
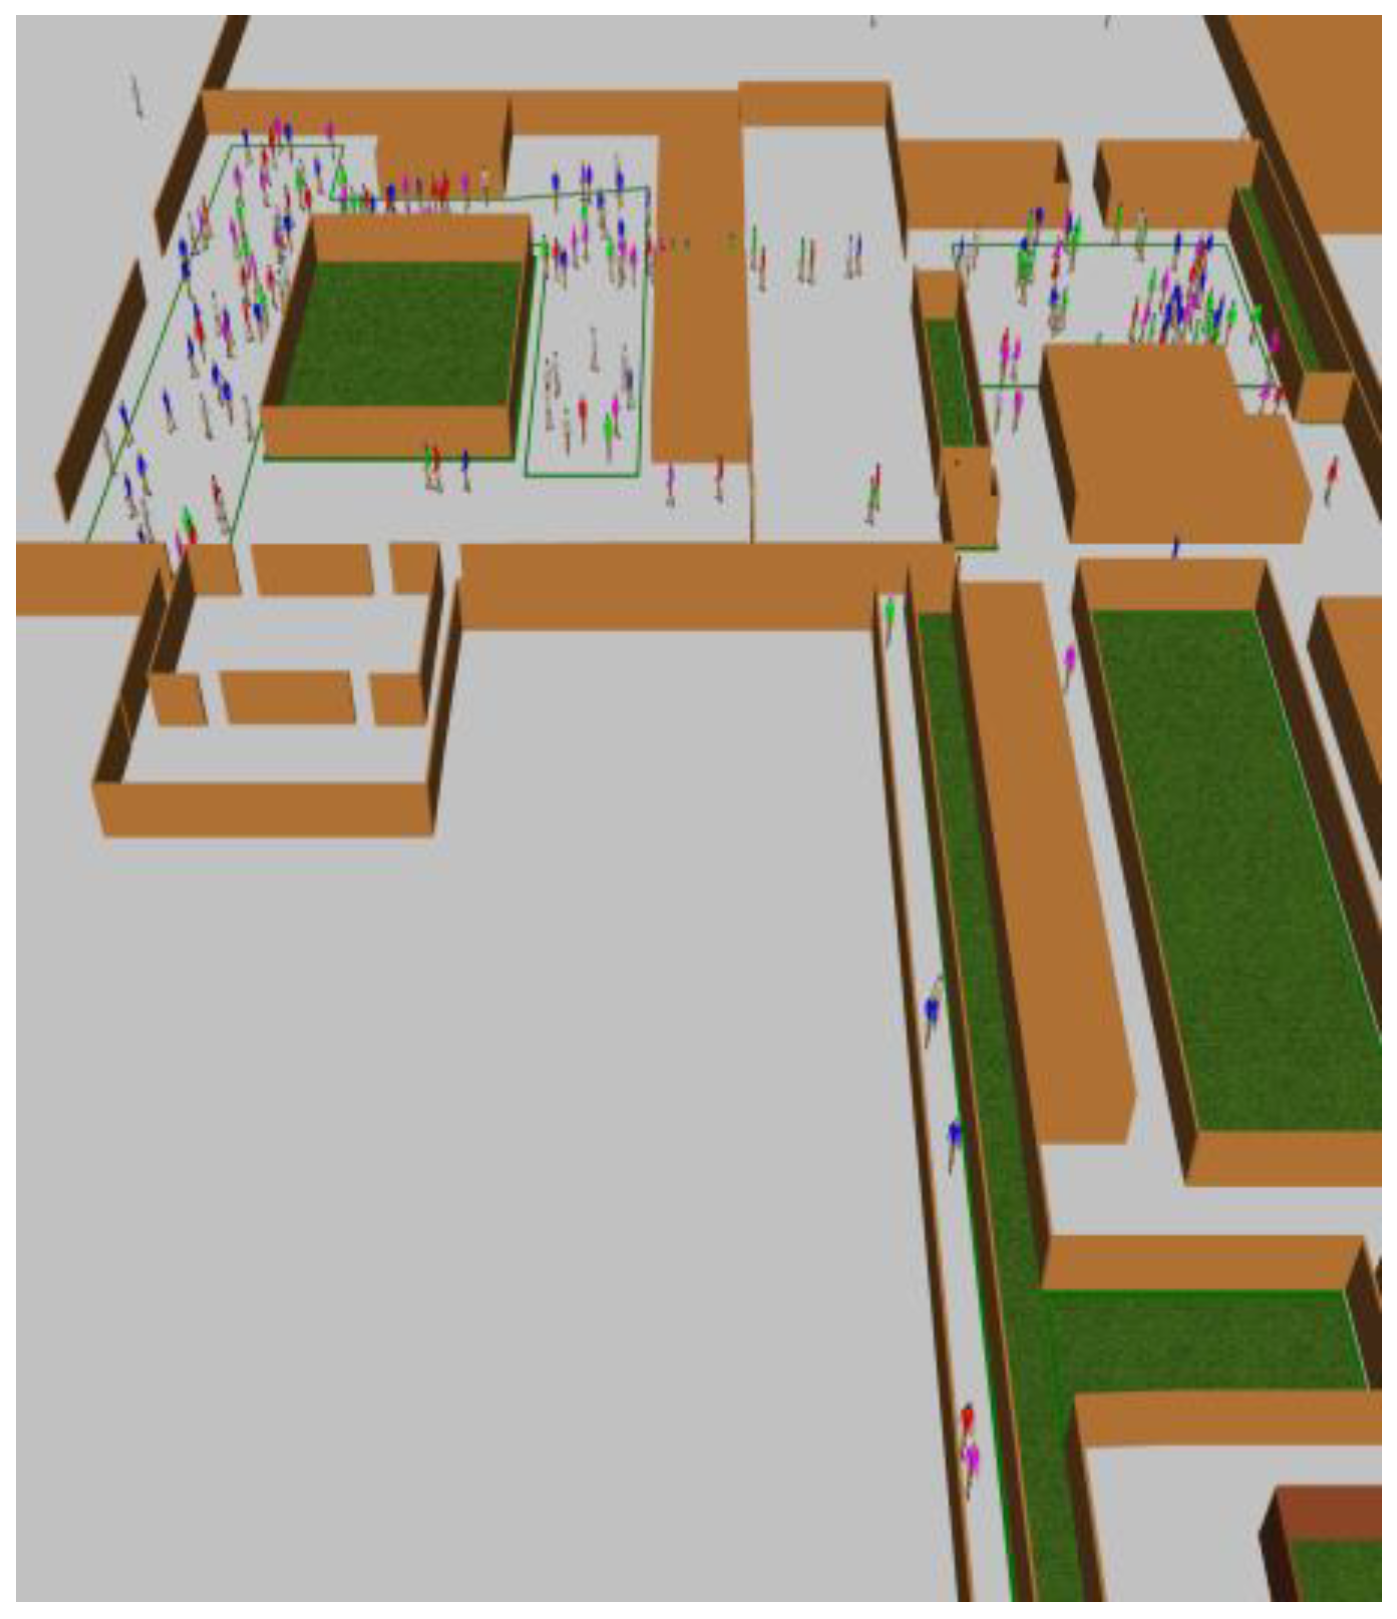
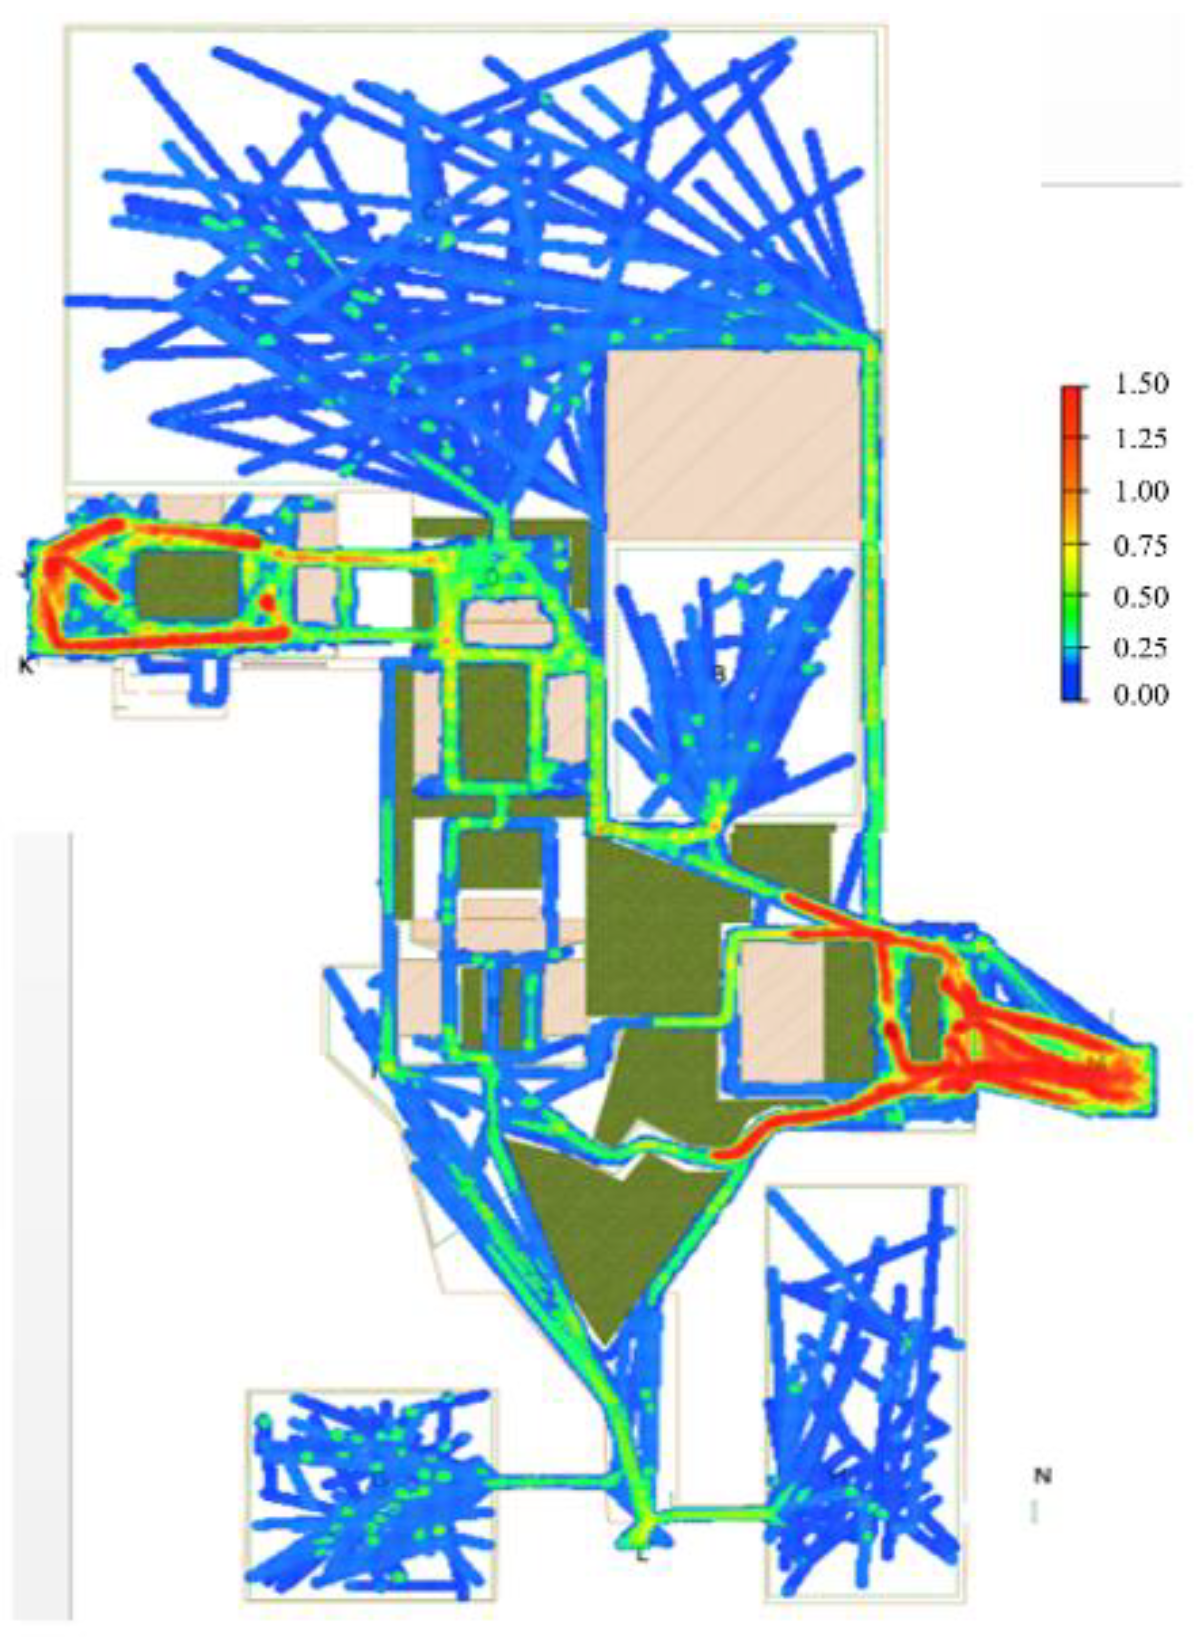
Finally, setting the properties of tourist agents. The residence time, the tourism speed, the tourism direction, are given to the individual tourist agents and the group tourists agents. The above properties are shown in Table 5 to Table 7. Simulating the tourist behavior of tourists for one hour. Figure 12 is the simulation animation of some areas of the Palace Area, and Figure 13 is the tourist flow thermal diagram of the simulation area.
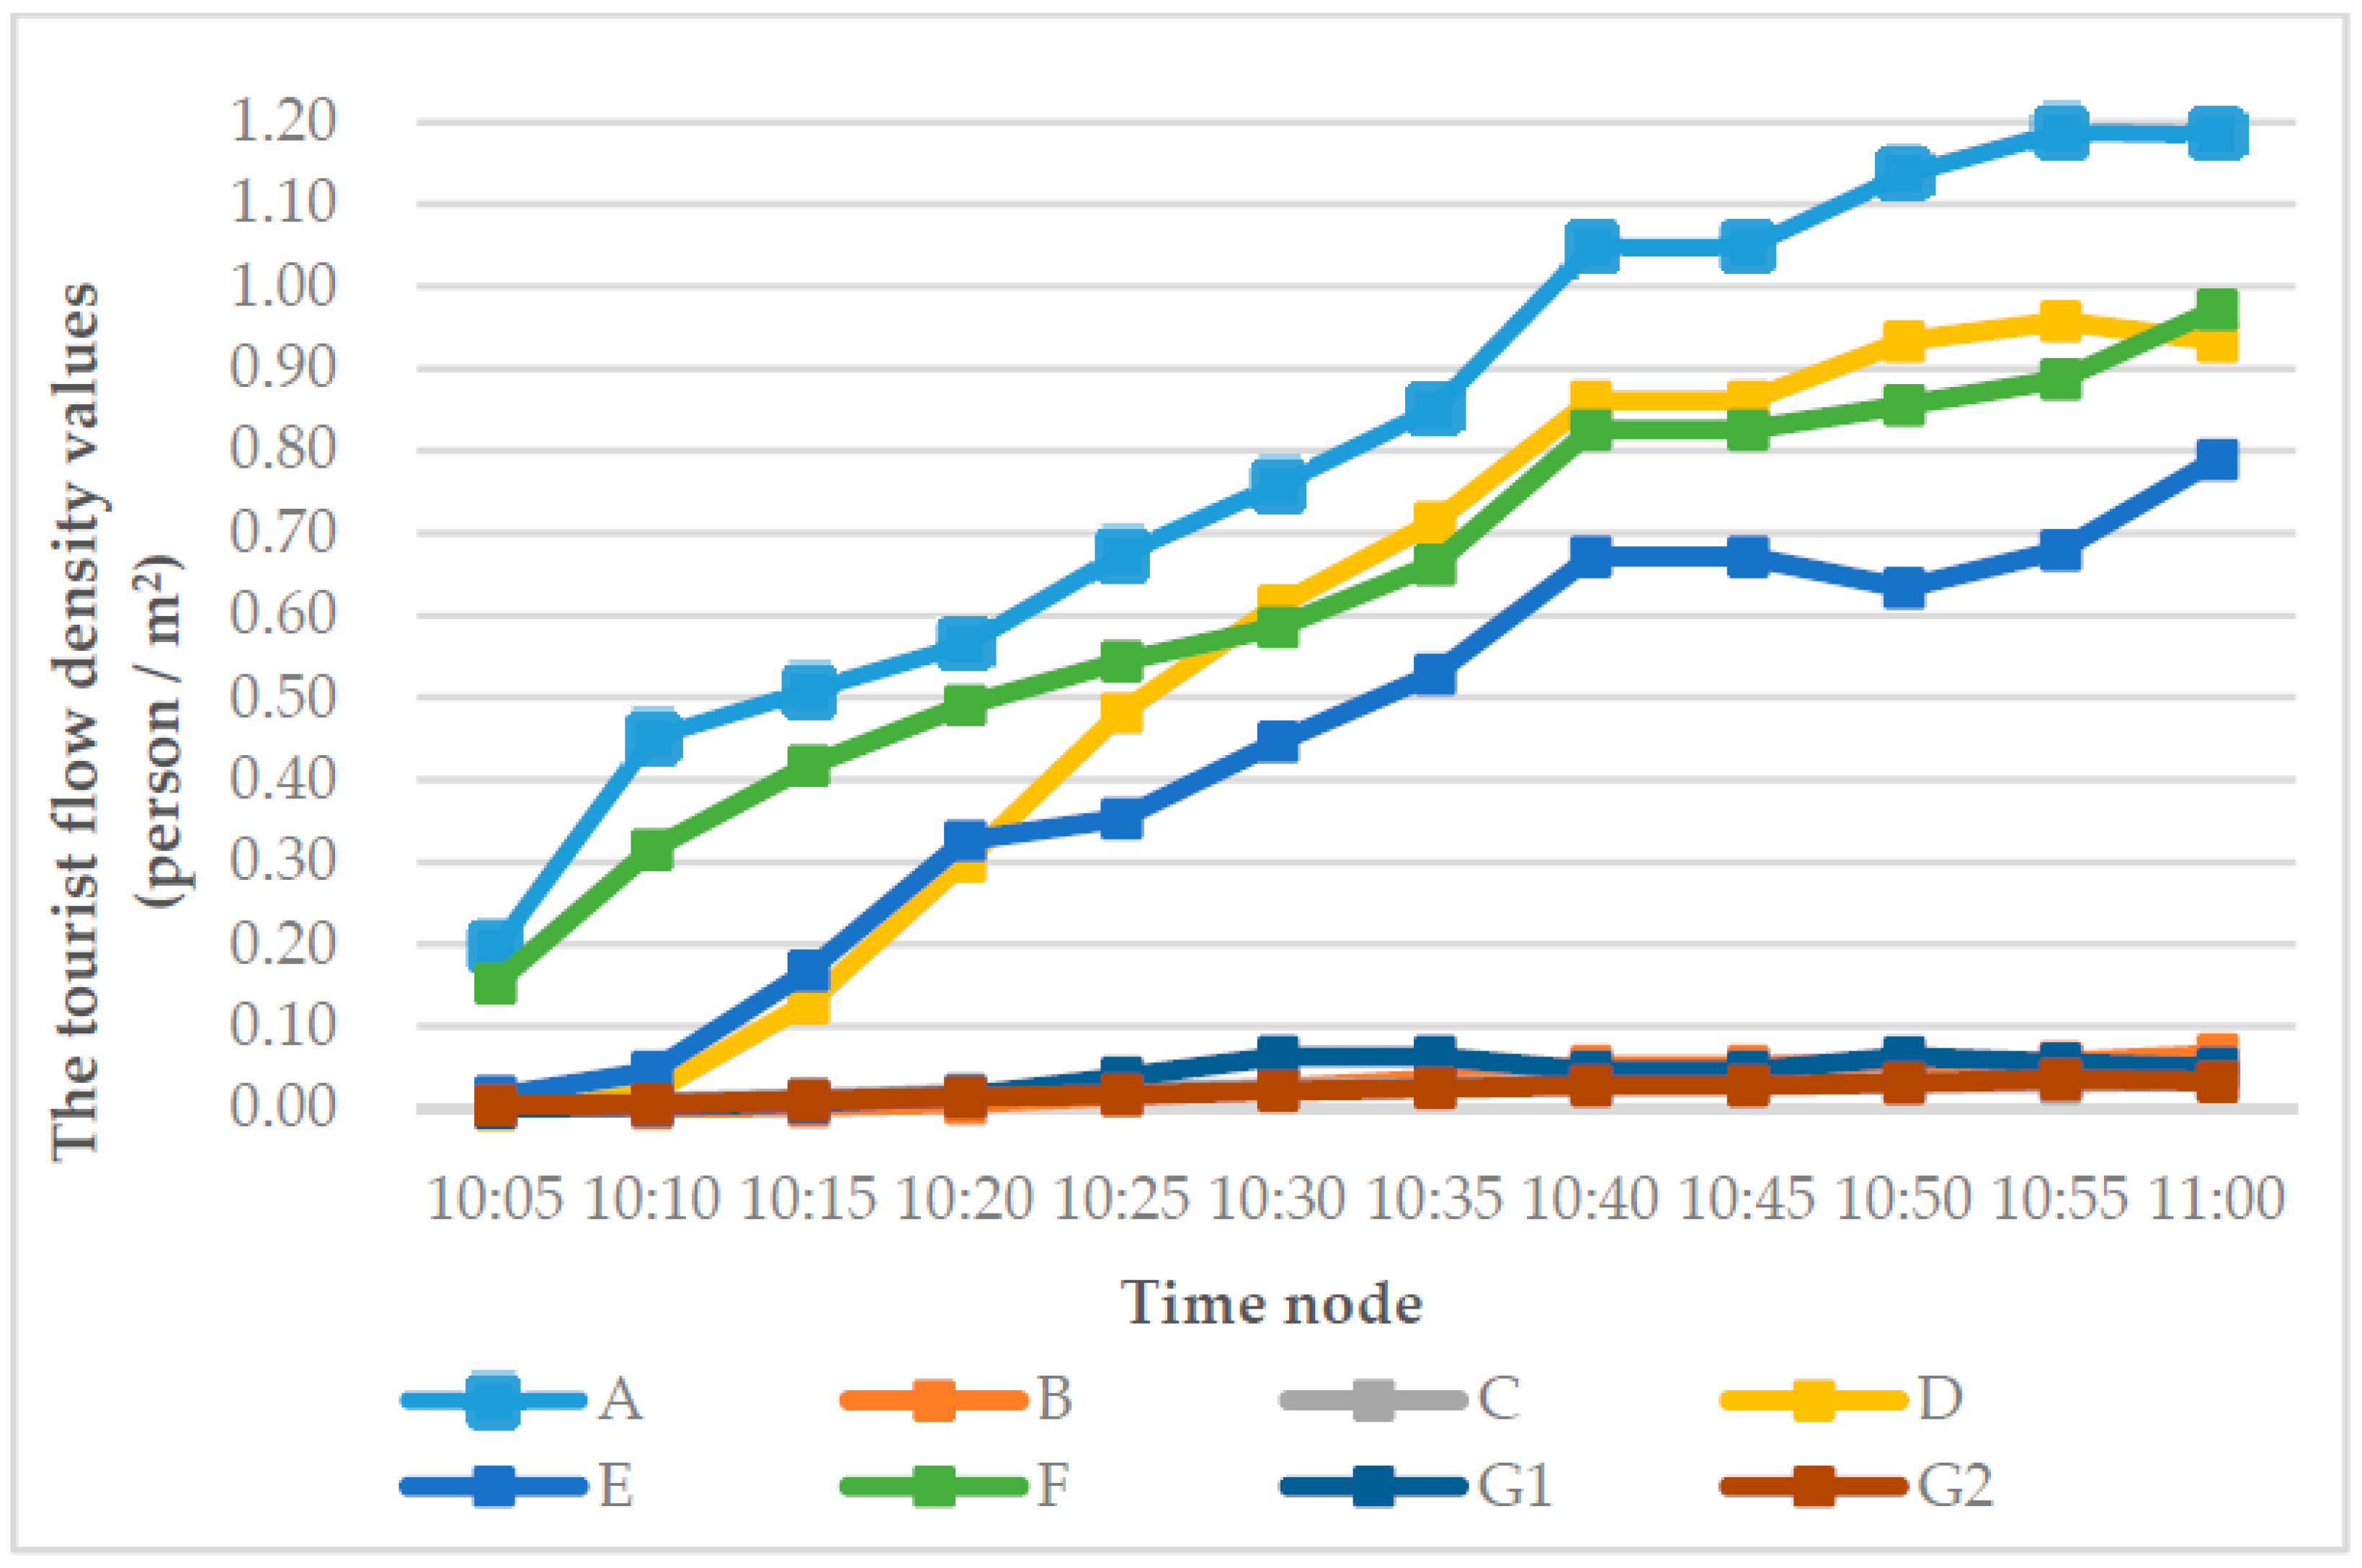
The tourist flow density of each tourist spot at each time node is obtained through the simulation model. Figure 14 shows the tourist flow density of each tourist spot in the Palace Area under the condition of null information. The top fourth crowded tourist spots are A, D, F, and E. The tourist spots with little tourist flow density are B, C, G1, and G2, the tourist flow density values are all lower than 0.1 person/m2.
Analyzing the results of the tourist flow diversion simulation model under null information. From Figure 11, it can be seen that tourists need to go through tourist spot A or F to arrive or leave the Palace Area, D and E located in the important tourist flow passage, and tourist spot A, D, and F are core tourist spots, so tourist spot A, D, F, and E have a high tourist flow density. Tourist spots B and G2 are charging tourist spots, with low tourist flow arrival and low tourist flow density. Tourist spots C, G1 have broad areas, with low tourist flow arrival and low tourist flow density. In conclusion, the simulation results accord with the actual tourist flow situation.

6.3.2. Tourist Flow Diversion Simulation Model under Null RTFDSI

According to the survey results of tourists’ behavior adjustment under RTFDSI (Table 4), when RTFDSI is released to tourists during the tourist flow peak period, the tourists in core tourist spots tend to improve tourism satisfaction through “continue to visit and shorten the residence time” and “leave the current tourist spot immediately”, the above two kinds of behavior adjustment all shorten the residence time in tourist spots.
In order to further measure the impact of tourists’ adjustment behavior (tourists’ residence time adjustment) on the status of tourist flow in tourist spots, this paper reduced the residence time by 10% and 20% of core tourist spots (A, D, and F) in the tourist flow diversion simulation model under null information, and carried out the tourist flow simulation. The tourist spots’ tourist flow density under null information and RTFDSI in the same time period were compared to analyze the effect of residence time regulation on balancing tourist flow among tourist spots, and further to verify the effectiveness of RTFDS on balancing the tourist flow among tourist spots.
Table 9 shows the residence time after 10% and 20% reduction, the residence time of individual tourists and group tourists in core tourist spots (A, D, and F).
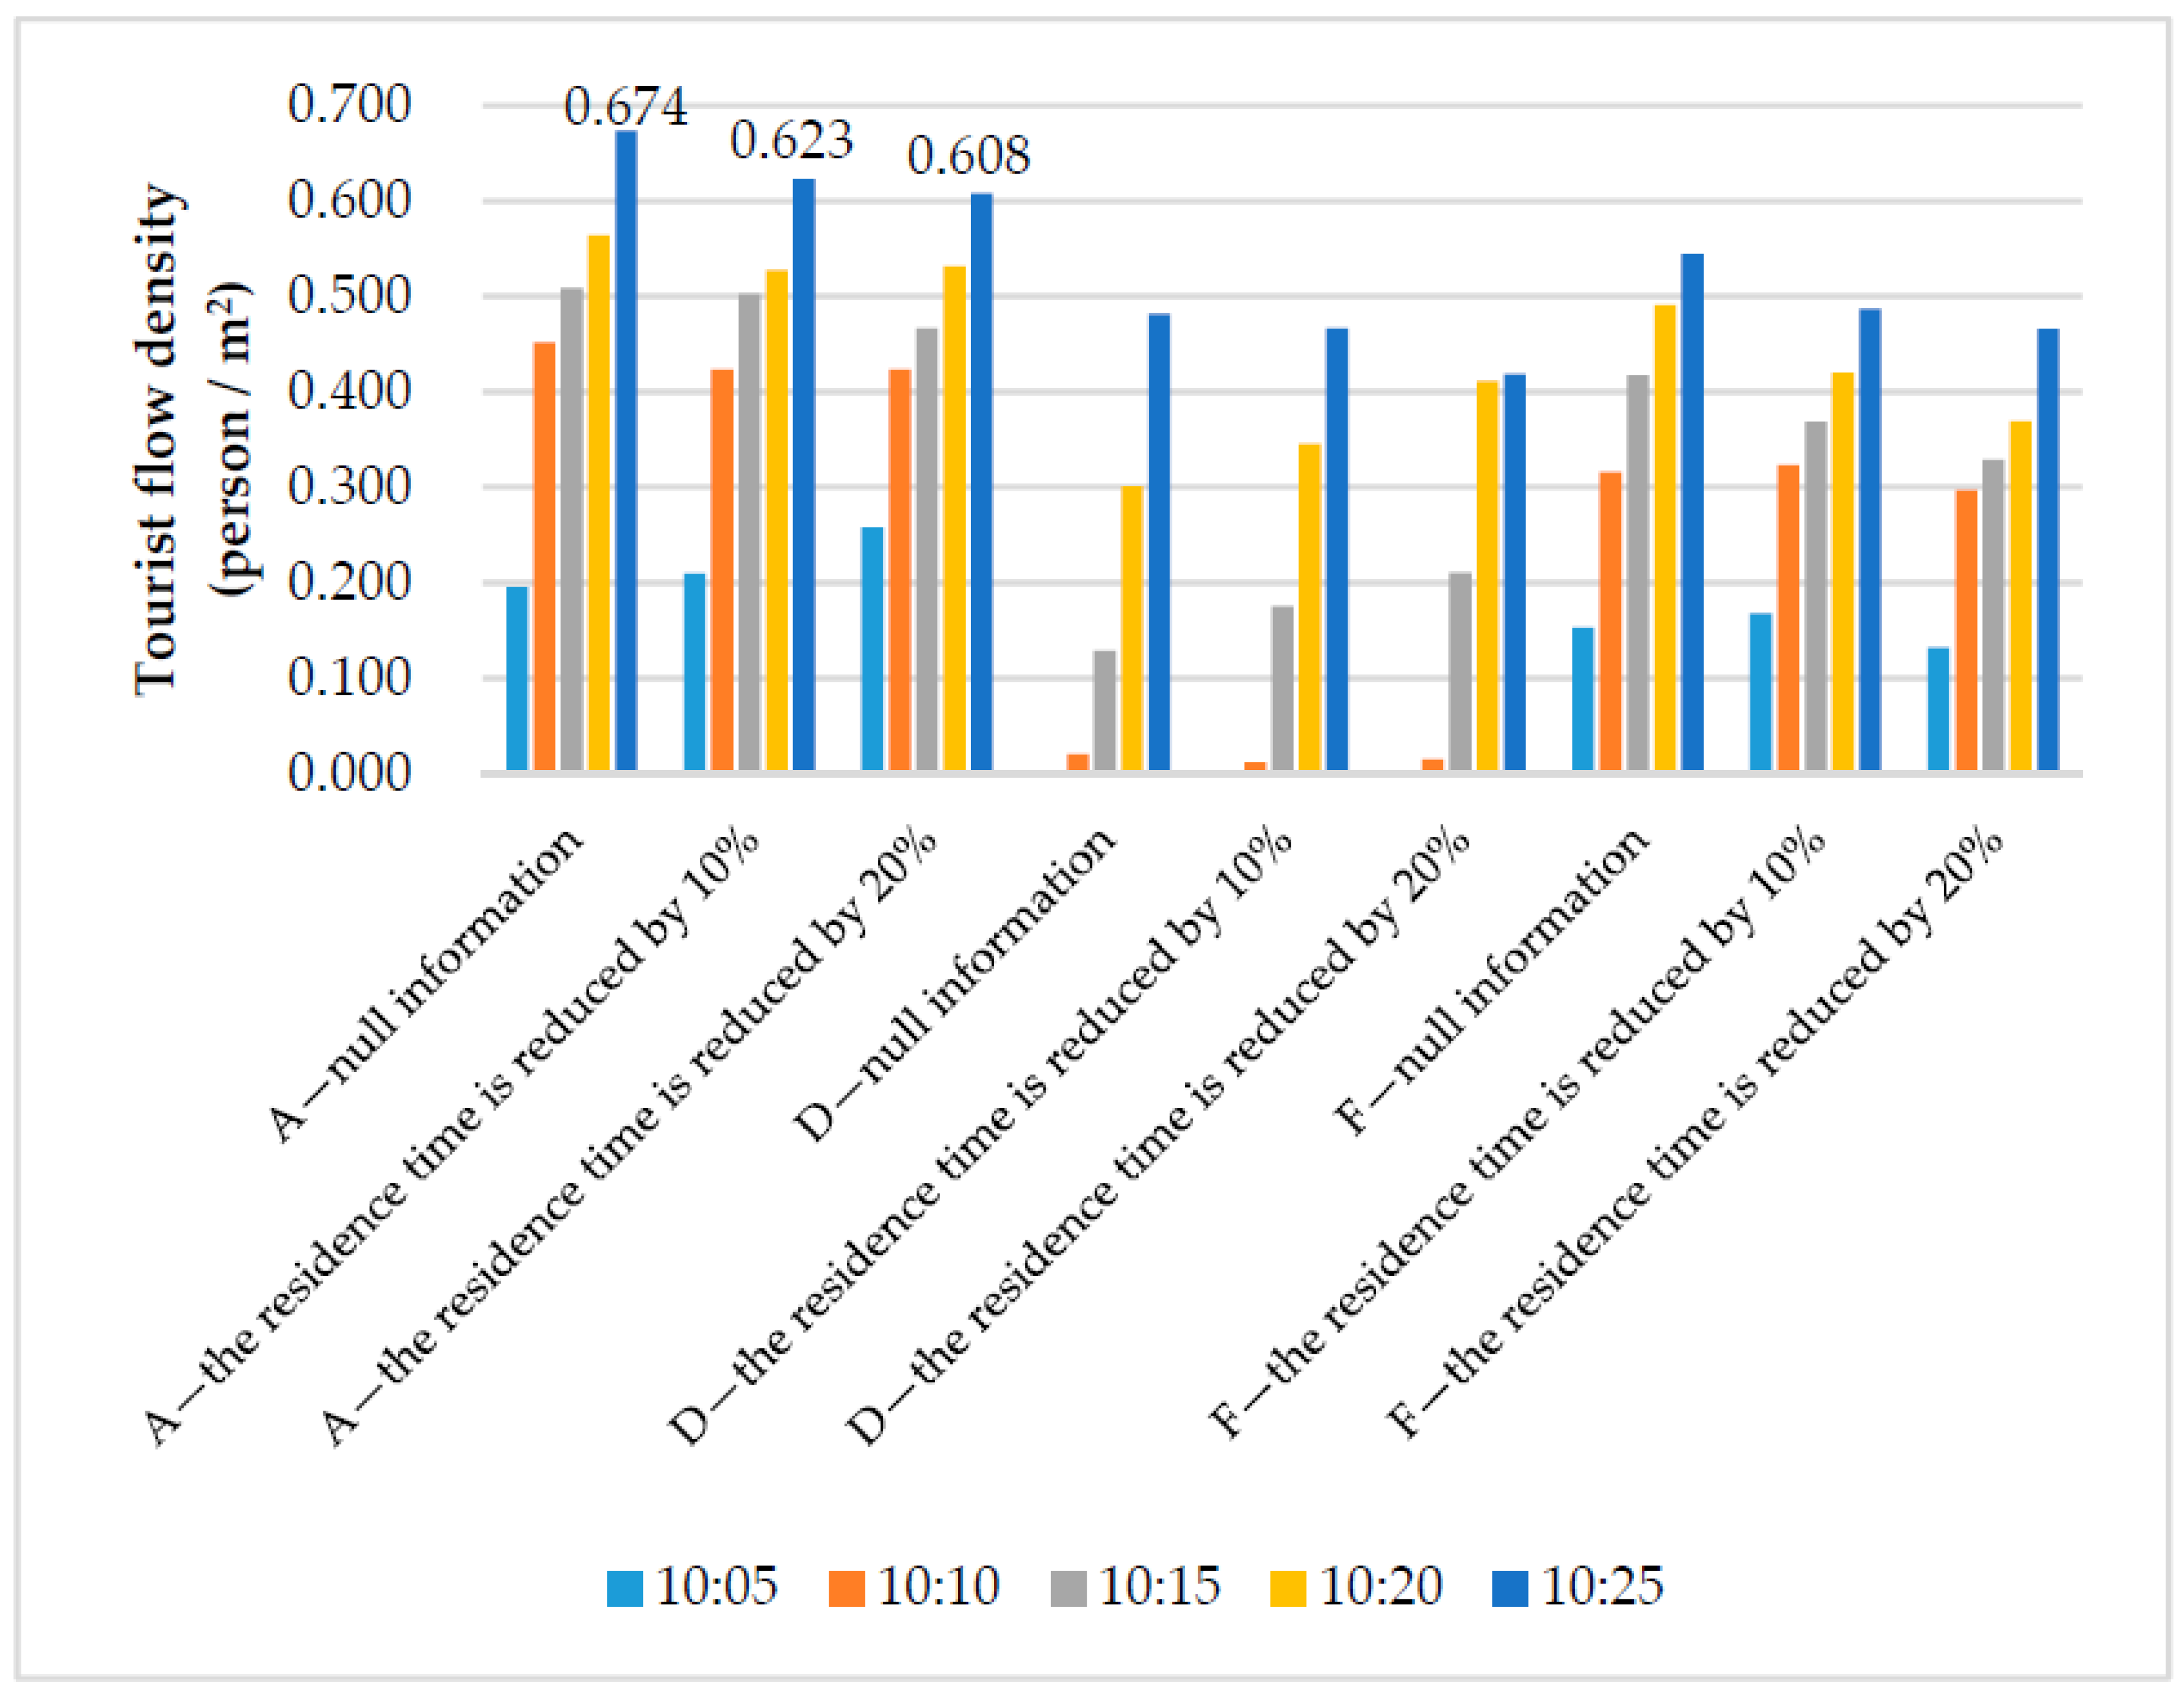
Figure 15 shows the change of tourist flow density of core tourist spots A, D, and F at five minutes interval during 10:05–10:25 after reducing the residence time of core tourist spots A, D, F by 10% and 20%. For core tourist spots, when the residence time is reduced by 10% and 20%, there are 60% and 73% time nodes where the density is less than or equal to the tourist flow density in the condition of null information. Taking core tourist spot A as an example, when the residence time is reduced by 10% and 20%, except for time node 10:05, the density of tourist spot A is less than or equal to the tourist flow density in the condition of null information. For example, at 10:25, the tourist flow density value in the null information is 0.674 person/m2, when the residence time is reduced by 10% and 20%, the tourist flow density value respectively drops to 0.623 and 0.608 person/m2.
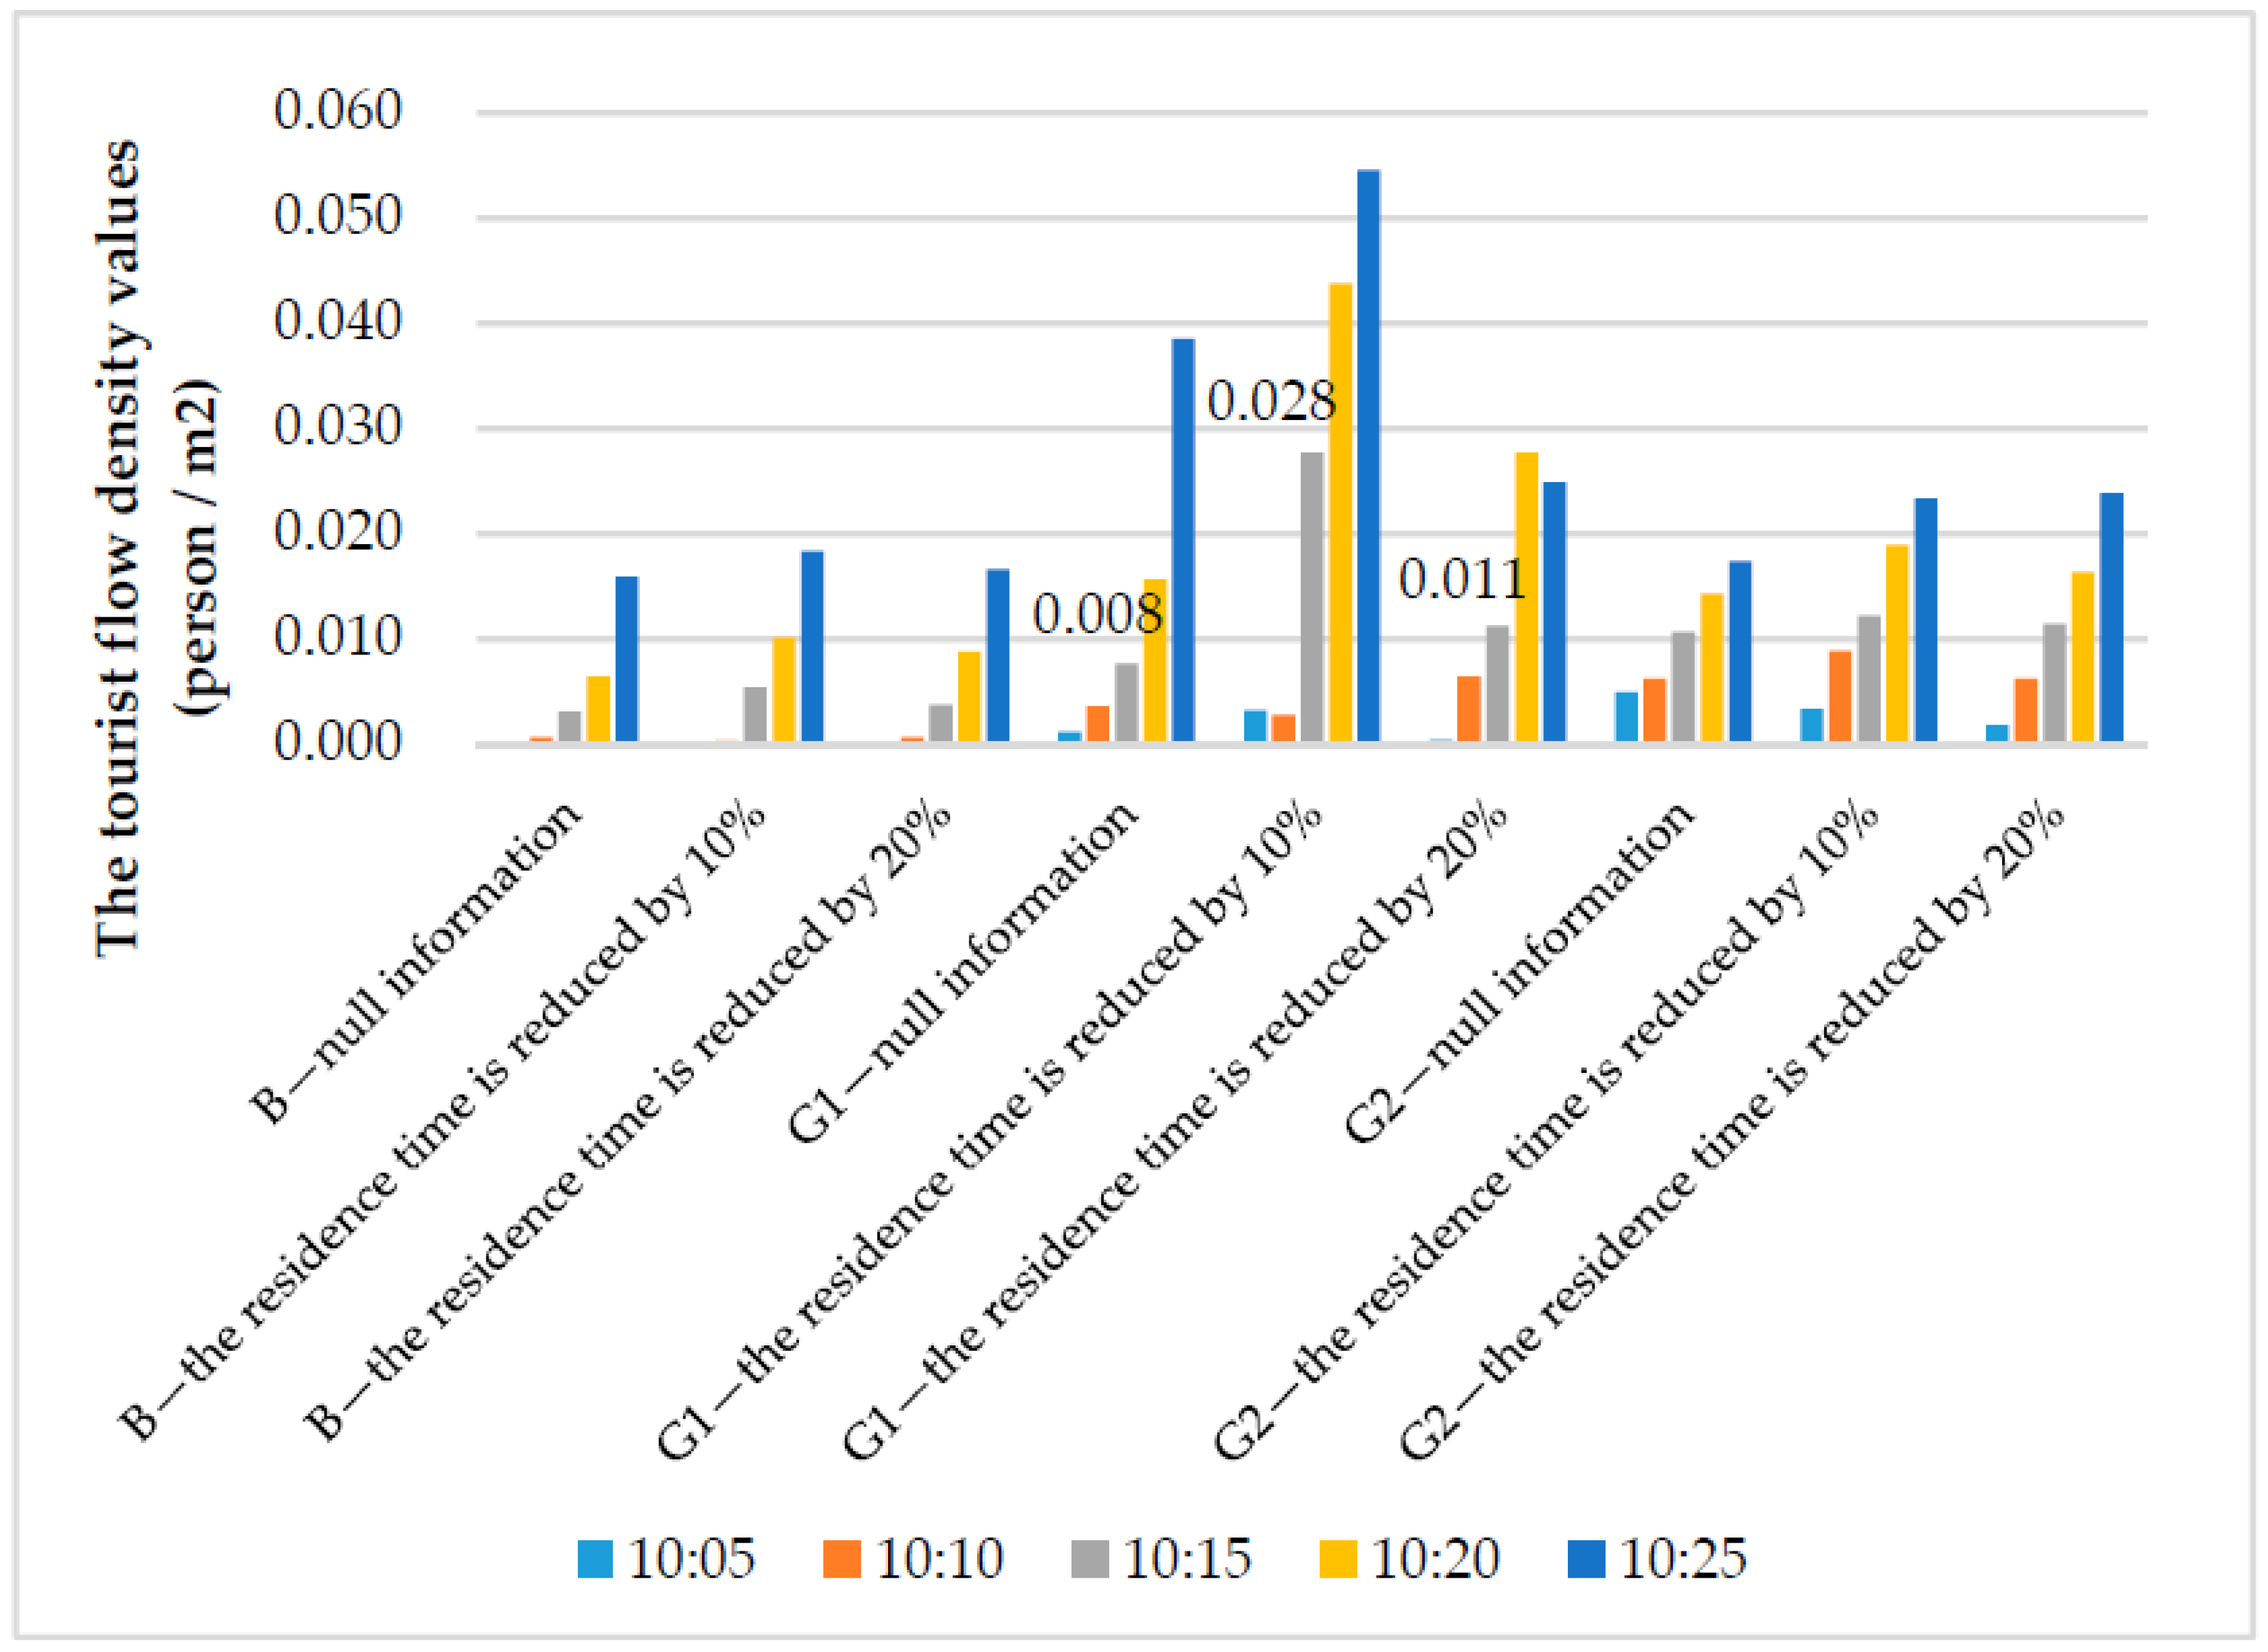
Figure 16 shows the change of tourist flow density of periphery tourist spots B, G1, and G2 at five minutes interval during 10:05–10:25 after reducing the residence time of core tourist spots A, D, F by 10% and 20%. For periphery tourist spots, when the residence time is reduced by 10% and 20%, there are 73% and 60% time nodes where the density is more than the density in the condition of null information. Taking tourist spot G1 as an example, when the residence time is reduced by 10% and 20%, there are 80% time nodes (10:05, 10:15, 10:20, 10:25) and 60% time nodes (10:10, 10:15, 10:20) where the density is more than the density in the condition of null information. For example, at 10:15, the tourist flow density value in the null information is 0.008person/m2, when the residence time is reduced by 10% and 20%, the tourist flow density value respectively increases to 0.028 and 0.011 person/m2.
Comprehensively analyzing the results of Figure 15; Figure 16, when reducing tourists’ residence time in core tourist spots, the tourist flow of core tourist spots can be guided to some periphery tourist spots, and the equilibrium distribution of tourist flow among tourist spots in the tourist attraction can be achieved.

7. Conclusions

7.1. Theoretical and Managerial Implications

7.1.1. Theoretical Implications

Firstly, in order to play to the role of RTFDS, the information demands of tourists and tourist attractions were comprehensively considered, and tourist spots’ tourist congestion perception degree and recommendation index were determined as the information release content of RTFDS. Secondly, for clarifying the interactive relationship among tourists’ information demand, RTFDS, and tourists’ decision-making behavior, the mechanism of tourists’ behavior adjustment under RTFDSI was analyzed.
Thirdly, in order to understand the preferences of tourists for RTFDSI, the information release mode (e.g., information manifestation forms, information release location, information release media, information release frequency) of RTFDS was revealed. In addition, the analysis of tourists’ behavior adjustment in tourist spots with different tourist congestion perception degree and recommendation index can help to understand the decision-making rules of tourists under RTFDSI.
Fourthly, to identify the main factors that affect tourists’ behavior adjustment under RTFDSI and evaluate the effect of RTFDS on tourists’ behavior adjustment, the tourists’ behavior adjustment model based on the MNL logit model was constructed. The model results show that: (a) tourists’ social-economic attributes, tourism behavior attributes, and tourism information demand attributes have a significant impact on tourists’ behavior adjustment; (b) 66.5% and 16.5% of tourists in core tourist spots tend to improve tourism satisfaction through “continue to visit and shorten the residence time” and “leave the current tourist spot immediately”, the above two kinds of behavior adjustment all shorten the residence time in tourist spots and will further affect the spatial-temporal distribution of tourists among tourist spots.
Finally, in order to evaluate the impact of tourists’ residence time adjustment behavior on balancing the tourists’ spatial-temporal distribution in tourist attraction, the tourist flow diversion simulation model under null information and RTFDSI were established respectively. The simulation results show that: (a) For core tourist spots, when the residence time is reduced by 10% and 20%, there are 60% and 73% time nodes where the density is less than or equal to the tourist flow density in the condition of null information. (b) For periphery tourist spots, when the residence time is reduced by 10% and 20%, there are 73% and 60% of time nodes where the density is more than the density in the condition of null information. The simulation results show that the tourist flow of core tourist spots can be guided to some periphery tourist spots through releasing RTFDSI to tourists.

7.1.2. Managerial Implications

This paper can guide the construction of tourist attraction’s real-time tourist flow diversion scheme system (RTFDSS). The above theoretical research results can used as references for information release, such as information release content and information release mode (e.g., information manifestation forms, information release location, information release media, information release frequency).
The results of simulation research indicate that reducing tourists’ residence time in core tourist spots can induce some tourists to transfer from the crowded core tourist spots to the uncrowded periphery tourist spots, and the reduction of tourists’ residence time can be realized by releasing RTFDSI to tourists. Hence, when the management implement RTFDS, ATIS should be used to collect and identify the tourist flow state of each tourist spot, RTFDSI needs to be updated in real-time according to ATIS, so that tourists can know the tourist flow state of different tourist spots in time, and make some behavior adjustment to balance tourists’ spatial-temporal distribution among different tourist spots and alleviate congestion.

7.2. Limitations and Future Research

The premise of using the MNL model to study tourists’ decision-making behavior is to assume that the tourist is completely rational. In the future, we should research the decision-making behavior of tourists from the perspective of limited rationality.
In this paper, the factors influencing tourists’ decision-making behavior are not fully explored. There are also other factors that affect the decision-making behavior of tourists, such as tourists’ residence (e.g., city-village, settlement unit with different size, suburban area, etc.), companion (e.g., the presence of a small child needing a stroller), tourists’ mobility (e.g., whether easy to walk, whether to need a wheelchair), and tourists’ individual personality. Tourists’ individual personality can be obtained through psychological research. Therefore, future research should further expand the scope of influencing factors.
Tourists’ behavior adjustment under RTFDSI mainly includes tourists’ residence time adjustment and tourist spots visiting sequence adjustment. This paper mainly focuses on tourists’ residence time adjustment. In order to further enrich the theory of RTFDS, future research can excavate the rule of tourists’ tourist spots visiting sequence adjustment under RTFDSI, and analyze the influence of tourists’ tourist spots visiting sequence adjustment on balancing the spatial-temporal distribution in tourist attraction by some simulation methods.

Author Contributions

Conceptualization, Y.H. and G.Y.; Data curation, G.Y.; Formal analysis, G.Y.; Funding acquisition, Y.H.; Investigation, G.Y.; Methodology, G.Y.; Project administration, Y.H.; Resources, Y.H.; Supervision, Y.H.; Validation, G.Y.; Visualization, G.Y.; Writing—original draft, G.Y.; Writing—review & editing, G.Y., Y.H., H.G. and T.Z. All authors have read and agree to the published version of the manuscript.

Funding

This research was funded by the National Natural Science Foundation of China (Grant No. 51308015, 71971005), the National Key Research and Development Program of China: The Key Special Projects “Scientific Winter Olympic Games” (2018YFF0300305-07) and the Project of Science and Technology Plan of Beijing Municipal Education Commission (No. KM201510005023).

Conflicts of Interest

The authors declare no conflict of interest.

References

  1. Liao, Z.; Jin, M.; Ren, P.; Luo, Y. Research on scenic spot’s sustainable development based on a SD model: A case study of the jiuzhai valley. Sustainability 2014, 6, 4632–4644. [Google Scholar] [CrossRef] [Green Version]
  2. Zhang, S.; Tang, B. The analysis and countermeasure suggestion of overconcentration of tourist population in Beijing. Econ. Trade Update 2017, 4, 52–55. [Google Scholar] [CrossRef]
  3. Seraphin, H.; Sheeran, P.; Pilato, M. Over-tourism and the fall of venice as a destination. J. Destin. Mark. Manag. 2018, 9, 374–376. [Google Scholar] [CrossRef]
  4. Antonio, A.S. The problems of tourist sustainability in cultural cities: Socio-political perceptions and interests management. Sustainability 2018, 10, 503. [Google Scholar] [CrossRef] [Green Version]
  5. Lalicic, L. Solastalgia: An application in the overtourism context. Ann. Touris. Res. 2019, 102766. [Google Scholar] [CrossRef]
  6. Insch, A. The challenges of over-tourism facing New Zealand: Risks and responses. J. Destin. Mark. Manag. 2019, 15, 100378. [Google Scholar] [CrossRef]
  7. Koens, K.; Postma, A.; Papp, B. Is overtourism overused? Understanding the impact of tourism in a city context. Sustainability 2018, 10, 4384. [Google Scholar] [CrossRef] [Green Version]
  8. Li, J.; Ye, J.; He, Q.; Shao, C. A novel scheme to relieve parking pressure at tourist attractions on holidays. Sustainability 2016, 8, 164. [Google Scholar] [CrossRef] [Green Version]
  9. Zhu, H.; Guan, H.; Han, Y.; Li, W. A study of tourists’ holiday rush-hour avoidance travel behavior considering psychographic segmentation. Sustainability 2019, 11, 3755. [Google Scholar] [CrossRef] [Green Version]
  10. Lin, X.; Susilo, Y.; Shao, C.; Liu, C. The implication of road toll discount for mode choice: Intercity travel during the chinese spring festival holiday. Sustainability 2018, 10, 2700. [Google Scholar] [CrossRef] [Green Version]
  11. Han, Y.; Zhang, T.; Wang, M. Holiday travel behavior analysis and empirical study with Integrated Travel Reservation Information usage. Transport. Res. A Pol. 2020, 134, 130–151. [Google Scholar] [CrossRef]
  12. The China National Tourism Administration. Guidelines for Measurement of Carry Capacity of Tourist Area; LB/T034-2014; The China National Tourism Administration: Beijing, China, 2014.
  13. The China National Tourism Administration. The Stand of Responding to Tourist Scenic Area during Peak Hours; LB/T068-2017; The China National Tourism Administration: Beijing, China, 2017.
  14. Wan, Y. Core-periphery geographical theory in regional tourism planning. Econ. Geogr. 2002, 22, 372–375. [Google Scholar] [CrossRef]
  15. Huang, X. Tourists Spatial-Temporal Behavior Study, 1st ed.; China Travel & Tourism Press: Beijing, China, 2011; pp. 141–142. [Google Scholar]
  16. Li, W.; Han, Y.; Wang, P.; Guan, H. Invulnerability analysis of traffic network in tourist attraction under unexpected emergency events based on cascading failure. IEEE Access 2019, 7, 147383–147398. [Google Scholar] [CrossRef]
  17. Gai, W.; Du, Y.; Deng, Y. Evacuation risk assessment of regional evacuation for major accidents and its application in emergency planning: A case study. Saf. Sci. 2018, 106, 203–218. [Google Scholar] [CrossRef]
  18. Wang, B.; Shao, C.; Li, J.; Weng, J.; Ji, X. Holiday travel behavior analysis and empirical study under integrated multimodal travel information service. Transp. Policy 2015, 39, 21–36. [Google Scholar] [CrossRef]
  19. Parvaneh, Z.; Arentze, T.; Timmermans, H. Understanding travelers’ behavior in provision of travel information: A Bayesian belief approach. Procedia Soc. Behav. Sci. 2012, 54, 251–260. [Google Scholar] [CrossRef] [Green Version]
  20. Kattan, L.; de Barros, A.G.; Saleemi, H. Travel behavior changes and responses to advanced traveler information in prolonged and large-scale network disruptions: A case study of west LRT line construction in the city of Calgary. Transp. Res. F 2013, 21, 90–102. [Google Scholar] [CrossRef]
  21. Wang, B.; Shao, C.; Ji, X. Dynamic analysis of holiday travel behaviour with integrated multimodal travel information usage: A life-oriented approach. Transp. Res. A Pol. 2017, 104, 255–288. [Google Scholar] [CrossRef]
  22. Zhongan Online- Anhui Daily. Huangshan use big data command and dispatching system to divert tourists. Available online: http://ah.anhuinews.com/system/2014/10/04/006562349.shtml (accessed on 4 October 2014).
  23. Licheng Taihang Mountain Huangya Cave Tourism Development Co Ltd. Tourist Flow Control and Diversion Scheme in Huangya Cave during the Peak Period of Tourism. Available online: https://wenku.baidu.com/view/2070f05ebb1aa8114431b90d6c85ec3a87c28ba9.html (accessed on 30 April 2017).
  24. Li, K.; Chen, X.; Huang, S. The research on large tourist attraction flow diversion navigation system based on RFID technology. Tour. Overv. 2014, 9, 70–72. [Google Scholar]
  25. Zhang, H.; Xie, C. Tourist area traffic guidance system based on RFID Technology. Netw. Secur. Technol. Appl. 2014, 8, 111–112. [Google Scholar]
  26. Han, Y.; Yang, G.; Wu, X.; Zhang, S.; Li, W. Tour routes optimization design considering tourists congestion perception. J. Beijing Univ. Technol. 2018, 44, 1537–1546. [Google Scholar]
  27. O’Hara, M.E. Congestion effects in valuation of recreation land using revealed preference methods: An application to rock climbing resources at New York’s Shawangunk Ridge. Dissertations Theses, Colgate University, Hamilton, NY, USA, 2007. [Google Scholar]
  28. Sidi, J.; Fa, L.W.; Junaini, S.N. Simulation of traffic congestion at the tourist attraction spot of kuching waterfront, sarawak. In Proceedings of the International Conference on Computer Technology and Development, Kota Kinabalu, Malaysia, 13–15 November 2009; pp. 3–5. [Google Scholar] [CrossRef]
  29. Wanhill, S.R.C. Charging for congestion at tourist attractions. Int. J. Tour. Manag. 1980, 1, 168–174. [Google Scholar] [CrossRef]
  30. Anderson, D.H.; Brown, P.J. The displacement process in recreation. J. Leis. Res. 1984, 16, 61–73. [Google Scholar] [CrossRef] [Green Version]
  31. Hammitt, W.E.; Patterson, M.E. Coping behavior to avoid visitor encounters: Its relationship to wildland privacy. J. Leis. Res. 1991, 23, 225–237. [Google Scholar] [CrossRef]
  32. Manning, R.E.; Valliere, W.A. Coping in outdoor recreation: Causes and consequences of crowding and conflict among community residents. J. Leis. Res. 2001, 33, 410–426. [Google Scholar] [CrossRef]
  33. Shailes, A.; Senior, M.L.; Andrew, B.P. Tourists’ travel behaviour in response to congestion: The case of car trips to Cornwall, United Kingdom. J. Transp. Geogr. 2001, 9, 49–60. [Google Scholar] [CrossRef]
  34. Zhang, C. Tourist Coping Behavior in Crowding Environment: A Case Study on the Xixi National Wetland Park in Hangzhou. Master’s Thesis, Zhejiang Gong Shang University, Hangzhou, China, 2012. [Google Scholar]
  35. Le, Y.; Aoyagi, S.; Takahashi, K. Understanding Additional Stopover Behaviors of Car Tourists: An Analysis of Combined Route Search and Mobile GPS Travel Trajectory Data. In Proceedings of the 4th International Conference on Intelligent Transportation Engineering, Singapore, 6–8 September 2019; pp. 104–108. [Google Scholar]
  36. Wang, C.; Wei, F. Measuring the preferences of the visitor’s choice behavior based on the perception of crowding. J. Fujian Jiangxia Univ. 2015, 15, 16–23. [Google Scholar]
  37. Han, Y.; Wu, X.; Yang, G. Tourists’ congestion perception analysis based on ordered choice model. J. Transp. Syst. Eng. Inf. Technol. 2017, 17, 138–144. [Google Scholar] [CrossRef]
  38. Jin, Q.; Hu, H.; Kavan, P. Factors influencing perceived crowding of tourists and sustainable tourism destination management. Sustainability 2016, 8, 976. [Google Scholar] [CrossRef] [Green Version]
  39. Lawson, S.R. Computer simulation as a tool for planning and management of visitor use in protected natural areas. J. Sustain. Tour. 2006, 14, 600–617. [Google Scholar] [CrossRef]
  40. Zhang, R.; Wang, Q.; Zhou, Q. Micro-simulation of tourists? Behaviors in nature heritage resort: A case study on Mount Emei Tourist Area. IEEE Comput. Soc. 2007, 118–122. [Google Scholar] [CrossRef]
  41. Zhang, R. A Tourists’ spatial behavior simulator based on GIS and Multi-Agent system. J. Sichuan Norm. Univ. (Nat. Sci.) 2006, 29, 495–4987. [Google Scholar]
  42. Li, N. Agent-based simulation modeling of visitor behaviors at tourism attractions: The case of the Summer Palace, Beijing. Tourism Trib. 2014, 29, 62–72. [Google Scholar] [CrossRef]
  43. Geng, Q.; Huang, X.; Jiang, W.; Li, X. Design and implementation of attractions evaluation system based on Web. Comput. Mod. 2012, 10, 191–193. [Google Scholar]
  44. Yang, G. Research on Tourists’ Decision-Making Behavior under Information Dissemination. Master’s Thesis, Beijing University of Technology, Beijing, China, 2018. [Google Scholar]
  45. Han, Y.; Guan, H.; Li, D. Analysis of trip attitude adjustment of public transit of the elderly based on heider’s balance theory. J. Beijing Univ. Technol. 2015, 41, 906–911. [Google Scholar]
  46. Hassan, M.N.; Najmi, A.; Rashidi, T.H. A two-stage recreational destination choice study incorporating fuzzy logic in discrete choice modelling. Transp. Res. F 2019, 67, 123–141. [Google Scholar] [CrossRef]
  47. Li, Y.; Yang, L.; Shen, H.; Wu, Z. Modeling intra-destination travel behavior of tourists through spatio-temporal analysis. J. Destin. Mark. Manag. 2019, 11, 260–269. [Google Scholar] [CrossRef]
  48. Oppewal, H.; Huybers, T.; Crouch, G.I. Tourist destination and experience choice: A choice experimental analysis of decision sequence effects. Tour. Manag. 2015, 48, 467–476. [Google Scholar] [CrossRef]
  49. Wu, L.; Zhang, J.; Fujiwara, A. A tourist’s multi-destination choice model with future dependency. Asia Pac. J. Tour. Res. 2012, 17, 121–132. [Google Scholar] [CrossRef]
  50. Vieira, J.; Câmara, G.; Silva, F.; Santos, C. Airline choice and tourism growth in the Azores. J. Air Transp. Manag. 2019, 77, 1–6. [Google Scholar] [CrossRef]
  51. Alderighi, M.; Gaggero, A.A. Flight availability and international tourism flows. Ann. Tour. Res. 2019, 79, 102642. [Google Scholar] [CrossRef]
  52. Meleddu, M.; Paci, R.; Pulina, M. Repeated behaviour and destination loyalty. Tour. Manag. 2015, 50, 159–171. [Google Scholar] [CrossRef]
  53. Do Valle, P.O.; Correia, A.; Rebelo, E. Determinants of tourism return behavior. Tour. Hosp. Res. 2008, 8, 205–219. [Google Scholar] [CrossRef]
  54. Seok Lee, W.S.; Lee, J.K.; Moon, J. Influential attributes for the selection of luxury camping: A mixed-logit method. J. Hosp. Tour. Manag. 2019, 40, 88–93. [Google Scholar] [CrossRef]
  55. León, C.J.; de León, J.; Araña, J.E.; González, M.M. Tourists’ preferences for congestion, residents’ welfare and the ecosystems in a national park. Ecol. Econ. 2015, 118, 21–29. [Google Scholar] [CrossRef]
  56. McFadde, D. Conditional Logit Analysis of Qualitative Choice Behavior; Academic Press: Salt Lake City, UT, USA, 1974. [Google Scholar]
  57. Ben-Akiva, M.; Lerman, S.R. Discrete Choice Analysis: Theory and Application to Travel Demand; MIT Press: Cambridge, UK, 1985. [Google Scholar]
  58. Anciaes, P.; Metcalfe, P.; Heywood, C.; Sheldon, R. The impact of fare complexity on rail demand. Transp. Res. A Pol. 2019, 120, 224–238. [Google Scholar] [CrossRef]
  59. Wang, C.; Wang, D.; Zhu, W.; Song, S. Research progress of discrete choice models. Prog. Geogr. 2015, 34, 1275–1287. [Google Scholar]
  60. Horowitz, J. Reconsidering the multinomial probit model. Transp. Res. B Methodol. 1991, 25, 433–438. [Google Scholar] [CrossRef]
  61. Train, K.E. Discrete Choice: Methods with Simulation; Cambridge University Press: Cambridge, UK, 2009. [Google Scholar]
  62. Guan, H. Disaggregate Model- A Tool of Traffic Behavior Analysis; China Communications Press: Beijing, China, 2004. [Google Scholar]
  63. Louviere, J.J.; Hensher, D.A.; Swait, J.D.; Adamowicz, W. Swait Stated Choice Methods: Analysis and Applications; Cambridge University Press: Cambridge, UK, 2000. [Google Scholar]
  64. Qin, H.; Gao, J.; Zhang, G.; Chen, Y.; Wu, S. Nested logit model formation to analyze airport parking behavior based on stated preference survey studies. J. Air Transp. Manag. 2017, 58, 164–175. [Google Scholar] [CrossRef]
  65. Bonnel, P.; Nir, M.L. The quality of survey data: Telephone versus face-to-face interviews. Transportation 1998, 25, 147–167. [Google Scholar] [CrossRef]
  66. Szolnoki, G.; Hoffmann, D. Online, face-to-face and telephone surveys—Comparing different sampling methods in wine consumer research. Wine Econ. Policy 2013, 2, 57–66. [Google Scholar] [CrossRef] [Green Version]
  67. Liu, M. Data collection mode differences between national face-to-face and web surveys on gender inequality and discrimination questions. Women Stud. Int. Forum 2017, 60, 11–16. [Google Scholar] [CrossRef]
  68. Shelby, B.; Vaske, J.J.; Heberlein, T.A. Comparative analysis of crowding in multiple locations: Results from fifteen years of research. Leis. Sci. 1989, 11, 269–291. [Google Scholar] [CrossRef]
  69. Wu, X. Research on Subjective and Objective Crowding Perception in Tourist Spots. Master’s Thesis, Beijing University of Technology, Beijing, China, 2017. [Google Scholar]
  70. Manning, R.; Lawson, S.; Newman, P.; Laven, D.; Valliere, W. Methodological issues in measuring crowding-related norms in outdoor recreation. Leis. Sci. 2002, 24, 339–348. [Google Scholar] [CrossRef]
  71. QQcom. Big Data Report on Beijing Cultural and Tourism Consumption. Available online: https://new.qq.com/omn/20190617/20190617A0NNN500 (accessed on 17 June 2019).
  72. Grigoryev, L. AnyLogic 7 in Three Days System Modeling and Simulation—Using AnyLogic 7; Tsinghua University Press: Beijing, China, 2017; pp. 125–126. [Google Scholar]
  73. Li, N. A Computer simulation model for visitors’ recreational behaviors at tourism attractions: A case study of the Summer Palace. Tour. Sci. 2013, 27, 42–51. [Google Scholar] [CrossRef]
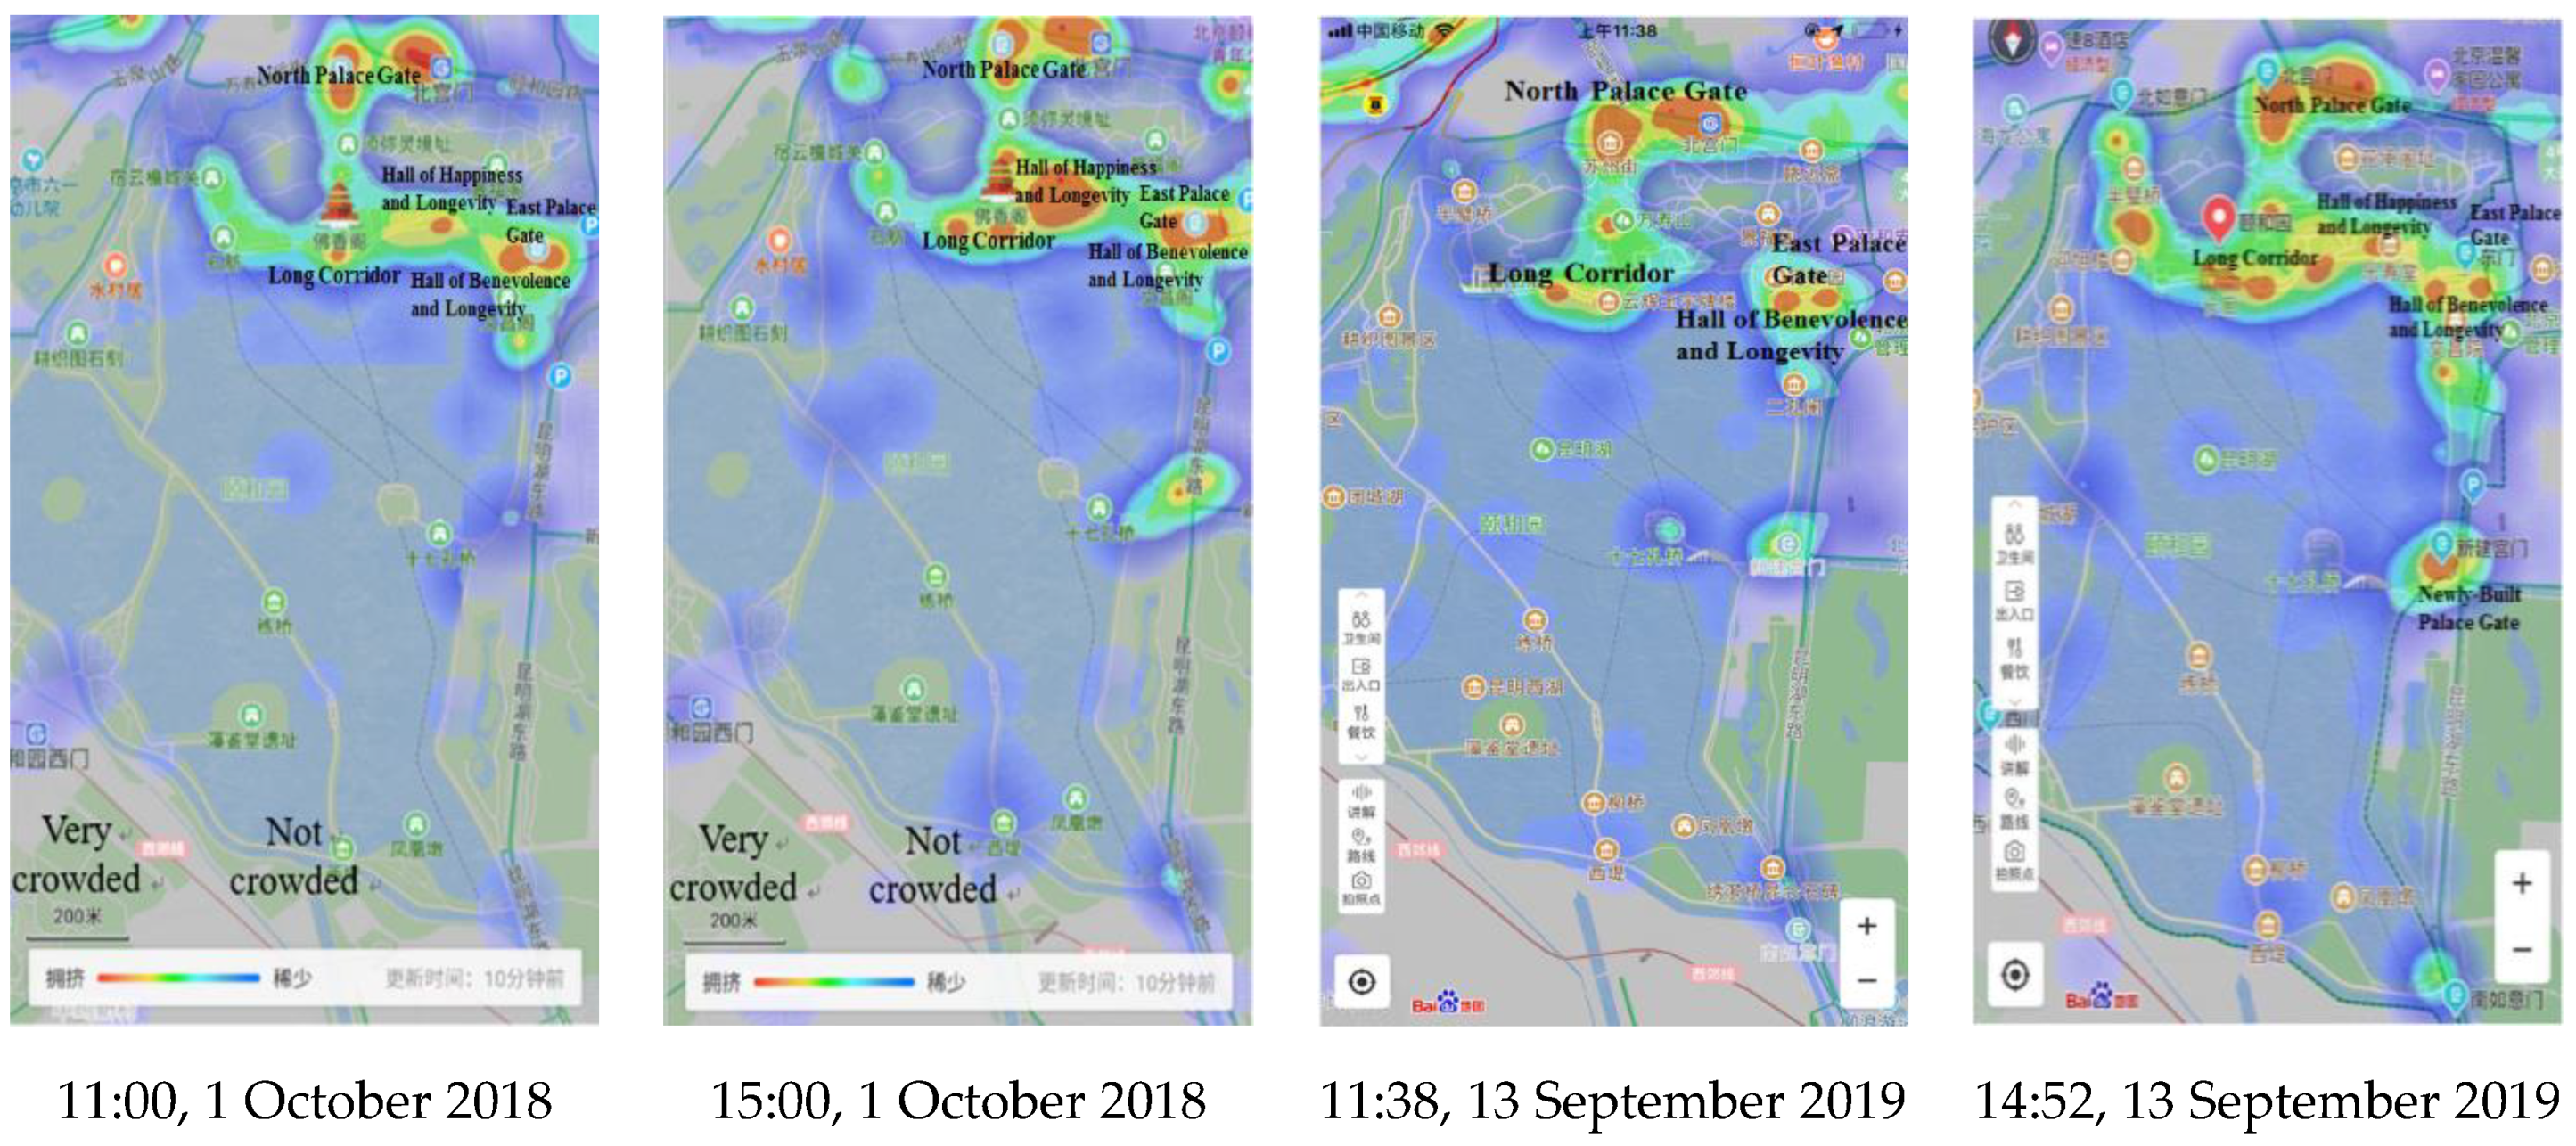
Figure 1. Tourist flow distribution map of the Summer Palace (Baidu Map).
Sustainability 12 03478 g001
Figure 2. The influencing mechanism between real-time tourist flow diversion scheme (RTFDS) and tourists’ decision-making behavior.
Sustainability 12 03478 g002
Figure 3. Multinomial logit model structure.
Sustainability 12 03478 g003
Figure 4. The information release content of RTFDS at a certain time during 10:00–11:00.
Sustainability 12 03478 g004
Figure 5. Several types of information manifestation forms of RTFDS.
Sustainability 12 03478 g005
Figure 6. The distribution map of tourists’ preferable information manifestation form.
Sustainability 12 03478 g006
Figure 7. The distribution map of tourists’ preferable information dissemination location.
Sustainability 12 03478 g007
Figure 8. Behavior adjustment of tourists under different tourist congestion perception degree of tourist spots.
Sustainability 12 03478 g008
Figure 9. Behavior adjustment of tourists under different recommendation index of tourist spots.
Sustainability 12 03478 g009
Figure 10. Tourist spots and road network.
Sustainability 12 03478 g010
Figure 11. Survey location.
Sustainability 12 03478 g011
Figure 12. Simulation animation of the Palace Area.
Sustainability 12 03478 g012
Figure 13. Tourist flow thermal diagram in the simulation area.
Sustainability 12 03478 g013
Figure 14. Tourist flow density of tourist spots in the Palace Area under null information.
Sustainability 12 03478 g014
Figure 15. Tourist flow density of core tourist spots (A, D, F) under shortening 10% of the tourists’ residence time in A, D, F.
Sustainability 12 03478 g015
Figure 16. The tourist flow density of tourist spots (B, G1, G2) under shortening 10% of the tourists’ residence time in A, D, F.
Sustainability 12 03478 g016
Table 1. The distribution of survey samples.
AttributeCategoryQuantityProportionAnalysis of Beijing Tourists
GenderMale10049.5%51.19%
Female10250.5%48.81%
Age<2021.0%6.9%
20–2912662.4%21.3%
30–395728.2%39.0%
>39178.4%32.8%
Education level High school and below209.9%
Undergraduate college, Junior college12059.4%
Master5728.2%
Doctor52.5%
Number of visits1 time9848.5%
2–3 times6833.7%
4–5 times178.4%
≥6 times199.4%
Table 2. Dummy variable setting table.
Variable NameClassifyDummy Variable
Education Level (Abbr. Edu)Edu 1: Undergraduate, junior college1 0
Edu 2: Master, Doctor0 1
Edu 3: High School and below0 0
Number of visits (Abbr. Num)Num 1: 1 time100
Num 2: 2–3 times010
Num 3: 4–5 times001
Num 4: ≥6 times000
The current situation’s tour guide mode: recommended tour route (Abbr. CTGM)Yes1
No0
The desired tour guide mode: optionally visit (Abbr. DTGM) Yes1
No0
The tourist congestion perception degree of the current tourist spot (Abbr. Congestion degree)Congestion degree 1: 1, 2100
Congestion degree 2: 4010
Congestion degree 3: 5001
Congestion degree 4: 3000
Concern 1: the congestion duration of core tourist spotsYes1
No0
Concern 2: the distance between core and recommended periphery tourist spotsYes1
No0
Concern 3: the tour route recommendation under congestion conditions Yes1
No0
Concern 4: the ornamental value of each tourist spot Yes1
No0
The desired location of information release (Abbr. Location) Location 1: Entrance, 1 tourist spot in advance1 0
Location 2: The road between the previous spot and the crowded spot0 1
Location 3: 2–3 tourist spots in advance0 0
The desired form of information release: the tour route recommendation under congestion conditions (Abbr. Form)Yes1
No0
Table 3. Calibration and test results of MNL mode.
CoefficientExplanatory Variable Estimated ValueStd. Err.t-Test Value
θ 1 The inherent dummyASCI−1.6640.920−1.809 *
θ 2 The inherent dummyASCI2.2120.5354.132 ***
θ 3 Congestion degree 1 X 1 n 3 0.8250.4441.858 *
θ 4 Congestion degree 2 X 3 n 4 0.4990.4531.104
θ 5 Congestion degree 3 X 2 n 5 0.9460.3842.460 **
θ 6 Age X 2 n 6 0.0590.02692.198 **
θ 7 Edu 1 X 2 n 7 1.6060.4413.637 ***
θ 8 Edu 2 X 2 n 8 0.7720.4351.774 *
θ 9 Num 1 X 1 n 9 0.5540.4161.332
θ 10 Num 2 X 2 n 10 0.4890.3761.300
θ 11 Num 3 X 3 n 11 1.2200.6022.026 **
θ 12 CTGM X 1 n 12 −1.2930.533−2.427 **
θ 13 DTGM X 1 n 13 −0.9240.459−2.016 **
θ 14 Concern 1 X 3 n 14 0.6560.3641.802 *
θ 15 Concern 2 X 1 n 15 −1.3450.425−3.168 ***
θ 16 Concern 3 X 3 n 16 0.7130.3691.932 *
θ 17 Concern 4 X 3 n 17 −0.8460.390−2.167 **
θ 18 Location 1 X 2 n 18 0.4290.3321.292
θ 19 Location 2 X 3 n 19 0.8780.5071.731 *
θ 20 Form X 1 n 20 −0.7830.369−2.125 **
N = 202; L ( 0 ) = −221.920; L ( θ ) = −176.819; 2 [ L ( 0 ) L ( θ ) ] = 90.201; ρ 2 = 0.203
Note: *. Relevance is significant in 90% confidence; **. Relevance is significant in 95% confidence; ***. Relevance is significant in 99% confidence.
Table 4. Individual tourists’ behavior adjustment probability under RTFDSI in the Palace Area.
Tourist SpotContinue to Visit without Shortening Their Residence TimeContinue to Visit, Shorten the Residence TimeLeave the Current Tourist Spot Immediately
A16%72%12%
B53%11%37%
C58%29%13%
D16%26%58%
E45%47%8%
F18%61%21%
G1,G222%47%31%
Table 5. The individual and group tourists’ residence time of the tourist spots in the Palace Area.
Tourist SpotSurvey Samples of Tourist Spots’ Residence Time (Unit: Minute)
The Individual TouristsThe Group Tourists
A5–125–10
B15–2515–25
C15–2515–25
D5–123–12
E5–123–12
F5–155–11
G15–125–12
G25–205–20
Table 6. The tourism speed of individual and group tourists (unit m/s).
Tourists TypeTourism Speed Range
The individual tourists0.82–1.38
The group tourists1.32–1.44
Table 7. The tourist proportion of individual and group tourists from A to the surrounding tourist spots.
Time PeriodOriginDestinationIndividual Tourists Transfer ProportionGroup Tourists Transfer Proportion
10:00–11:00AB0.050.00
C0.060.00
D0.130.37
the middle passage0.060.05
the north passage0.050.05
the south passage0.350.00
M0.300.53
Note: The middle, north, and south passage are the roads extending from tourist spot A to the square.
Table 8. The tourist flow volume entering the simulation environment.
Time PeriodOriginThe Tourist Flow Volume Entering the Simulation Environment (Unit: Person)
The Individual TouristsThe Group Tourists
10:00–11:00M1729757
C7310
J11731113
K9170
L1097894
Table 9. Individual and group tourists’ residence time after reducing 10% and 20% of the tourists’ residence time in A, D, F.
Tourist SpotResidence Time after Reducing 10%Residence Time after Reducing 20%
Individual Tourists’ Residence TimeGroup Tourists’ Residence TimeIndividual Tourists’ Residence TimeGroup Tourists’ Residence Time
A5–10 min5–9 min5–9 min5–7 min
D5–10 min3–11 min5–9 min3–9 min
F5–13 min5–9 min5–11 min5–8 min