Article

Changes in Climatic Water Availability and Crop Water Demand for Iraq Region

by
Saleem A. Salman
1,2,
Shamsuddin Shahid
1,
Haitham Abdulmohsin Afan
3,
Mohammed Sanusi Shiru
1,4,5,
Nadhir Al-Ansari
6 and
Zaher Mundher Yaseen
7,*
1
School of Civil Engineering, Faculty of Engineering, Universiti Teknologi Malaysia (UTM), Johor Bahru 81310, Malaysia
2
College of Engineering, Civil Engineering Department, University of Al-Qadisiyah, Al Diwaniyah, Iraq
3
Institute of Research and Development, Duy Tan University, Da Nang 550000, Vietnam
4
Department of Environmental Sciences, Faculty of Science, Federal University Dutse, Dutse P.M.B 7156, Nigeria
5
Department of Civil Engineering, Seoul National University of Science and Technology, Seoul 01811, Korea
6
Civil, Environmental and Natural Resources Engineering, Lulea University of Technology, 97187 Lulea, Sweden
7
Sustainable Developments in Civil Engineering Research Group, Faculty of Civil Engineering, Ton Duc Thang University, Ho Chi Minh City, Vietnam
*
Author to whom correspondence should be addressed.
Sustainability 2020, 12(8), 3437; https://doi.org/10.3390/su12083437
Submission received: 30 March 2020 / Revised: 17 April 2020 / Accepted: 22 April 2020 / Published: 23 April 2020

Abstract

:
Decreases in climatic water availability (CWA) and increases in crop water demand (CWD) in the background of climate change are a major concern in arid regions because of less water availability and higher irrigation requirements for crop production. Assessment of the spatiotemporal changes in CWA and CWD is important for the adaptation of irrigated agriculture to climate change for such regions. The recent changes in CWA and CWD during growing seasons of major crops have been assessed for Iraq where rapid changes in climate have been noticed in recent decades. Gridded precipitation of the global precipitation climatology center (GPCC) and gridded temperature of the climate research unit (CRU) having a spatial resolution of 0.5°, were used for the estimation of CWA and CWD using simple water balance equations. The Mann–Kendall (MK) test and one of its modified versions which can consider long-term persistence in time series, were used to estimate trends in CWA for the period 1961–2013. In addition, the changes in CWD between early (1961–1990) and late (1984–2013) periods were evaluated using the Wilcoxon rank test. The results revealed a deficit in water in all the seasons in most of the country while a surplus in the northern highlands in all the seasons except summer was observed. A significant reduction in the annual amount of CWA at a rate of −1 to −13 mm/year was observed at 0.5 level of significance in most of Iraq except in the north. Decreasing trends in CWA in spring (−0.4 to −1.8 mm/year), summer (−5.0 to −11 mm/year) and autumn (0.3 to −0.6 mm/year), and almost no change in winter was observed. The CWA during the growing season of summer crop (millet and sorghum) was found to decrease significantly in most of Iraq except in the north. The comparison of CWD revealed an increase in agricultural water needs in the late period (1984–2013) compared to the early period (1961–1990) by 1.0–8.0, 1.0–14, 15–30, 14–27 and 0.0–10 mm for wheat, barley, millet, sorghum and potato, respectively. The highest increase in CWD was found in April, October, June, June and April for wheat, barley, millet, sorghum and potato, respectively.

1. Introduction

The increase in precipitable water vapor in the atmosphere due to rises in temperature has changed the seasonal and geographical distribution of precipitation in many regions of the globe [1,2,3]. The climatic water availability (CWA), which is the difference between the evaporative demand of a reference crop and the total precipitation, has changed due to the rise in evapotranspiration and the alteration in precipitation. CWA provides an estimation of the surplus or deficit of precipitation to meet the evaporative demand of a reference crop and thus, it is a key factor that defines crop irrigation needs. The modification in CWA due to variations in climate can have severe implications in agriculture [4,5].
One of the limiting factors of agricultural development in the Middle East and Mediterranean regions (MENA) is water as there is a general deficiency in the overall amount of water and irregularity in rainfall [6]. The recent climate changes due to global warming have seriously aggravated the issue of water scarcity. The CWA and crop water demand (CWD) have also changed due to the changes in seasonal rainfall pattern and rises in temperature. The alteration in CWA and CWD is particularly important in Iraq where a gradual decrease in rainfall and a rise in temperature have been noticed in recent years [7].
The temperature in Iraq is increasing at a higher rate compared to the average global rate [8]. Such a rate of temperature increase has been confirmed to be continued in the coming years by climate models [9]. The increase in temperature is believed to contribute to an increase in evapotranspiration which can result in a large increase in CWD and a decrease in CWA [10]. It can have severe implications for water stress in the country and thus, food scarcity. Understanding the changes in water demand and water balance is vital for preparedness and planning adaptation to climate change effects on water resources and to achieve sustainability in agriculture.
Atmospheric water balance has been assessed in different regions of the earth to provide clues to climate change implications in agricultural water use in terms of variations in net irrigation needs [3,11,12,13,14,15,16,17,18,19,20]. However, there is no study so far on detecting/assessing the spatiotemporal changes in CWD and CWA employing long-term precipitation and temperature data and trustworthy methods.
Trends in climate variables are usually assessed for the quantification of the changes in climate variables. The non-parametric Mann–Kendall (MK) test [21,22] suggested by the World Meteorological Organization (WMO, 1998) is generally used for the evaluation of the trends in atmospheric variables. The MK test is independent of data distribution and less sensitive to missing values and therefore most popularly used for the assessment of trends in different climate variables all over the world. However, the major drawback of the MK test is that it is sensitive to autocorrelated data [9,23]. Several revisions of the MK test have been made to make it insensitive to autocorrelation [24,25,26]. Recent studies also revealed that long-term persistence (LTP) or the slow decay of the autocorrelation function that causes a longstanding cycle in data series also affects the significance in trend [27]. The LTP in climatic time series occurs due to the influence of slow climatic processes that change over time. The LTP is a part of climate and therefore, it is required to distinguish the natural climate variations from the unidirectional trend of climate in order to estimate the trend caused by global warming [8,28,29,30,31]. The recent modification of the MK test (MMK) by Hamed (2008) can be used for this purpose [32].
The present study aims to evaluate the spatiotemporal pattern in the trends in CWD and CWA of Iraq using MMK tests. The monthly rainfall data of the global precipitation climatology center (GPCC) and temperature data of the climate research unit (CRU), having a spatial resolution of 0.5° for the period 1961–2013, were used for this purpose. The spatial variability in the trend in both annual and seasonal CWA was assessed. The changes in CWD for five common crops of Iraq namely, wheat, barley, millet, sorghum and potato were analyzed. Obtained results were compared with MK test results to distinguish the trends due to global warming and the natural variability of climate.
The robust trend tests adopted in this study for the evaluation of the spatiotemporal changes in CWD and CWA are expected to provide the secular trends in CWA and CWD due to global warming. CWA and CWD are important indicators of water availability and irrigation needs. Therefore, the changes in CWA and CWD would provide valuable knowledge required for long-term management of water resources in Iraq.

2. Study Area and Data

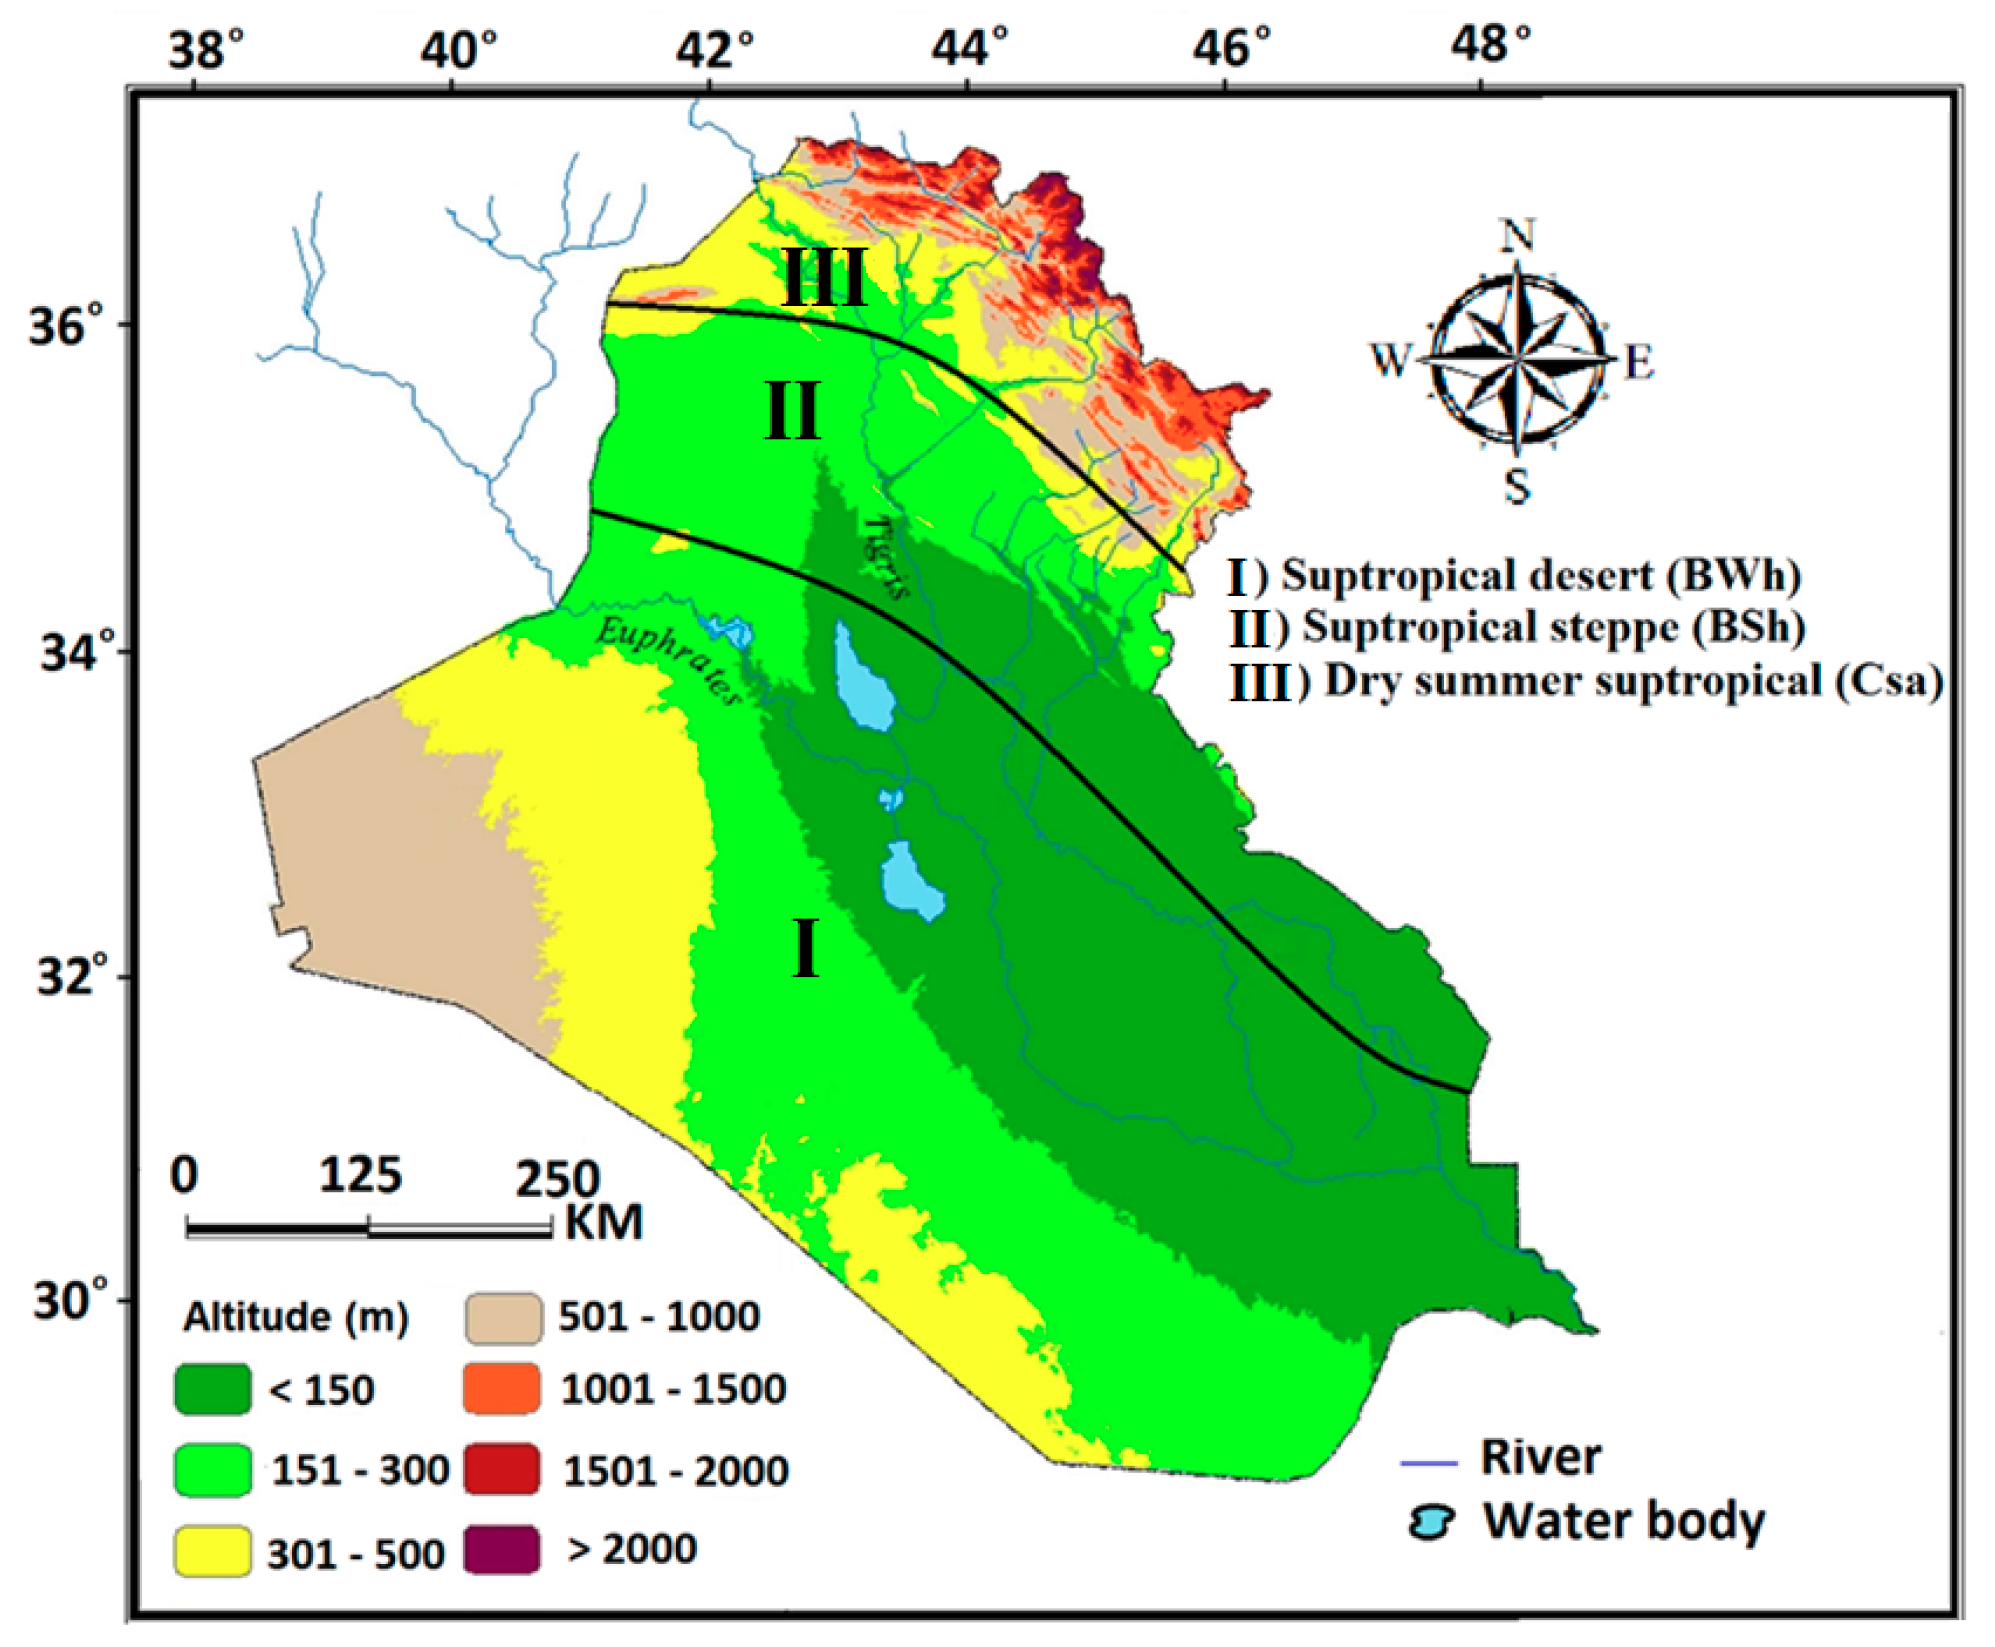
2.1. Geography and Climate of Iraq
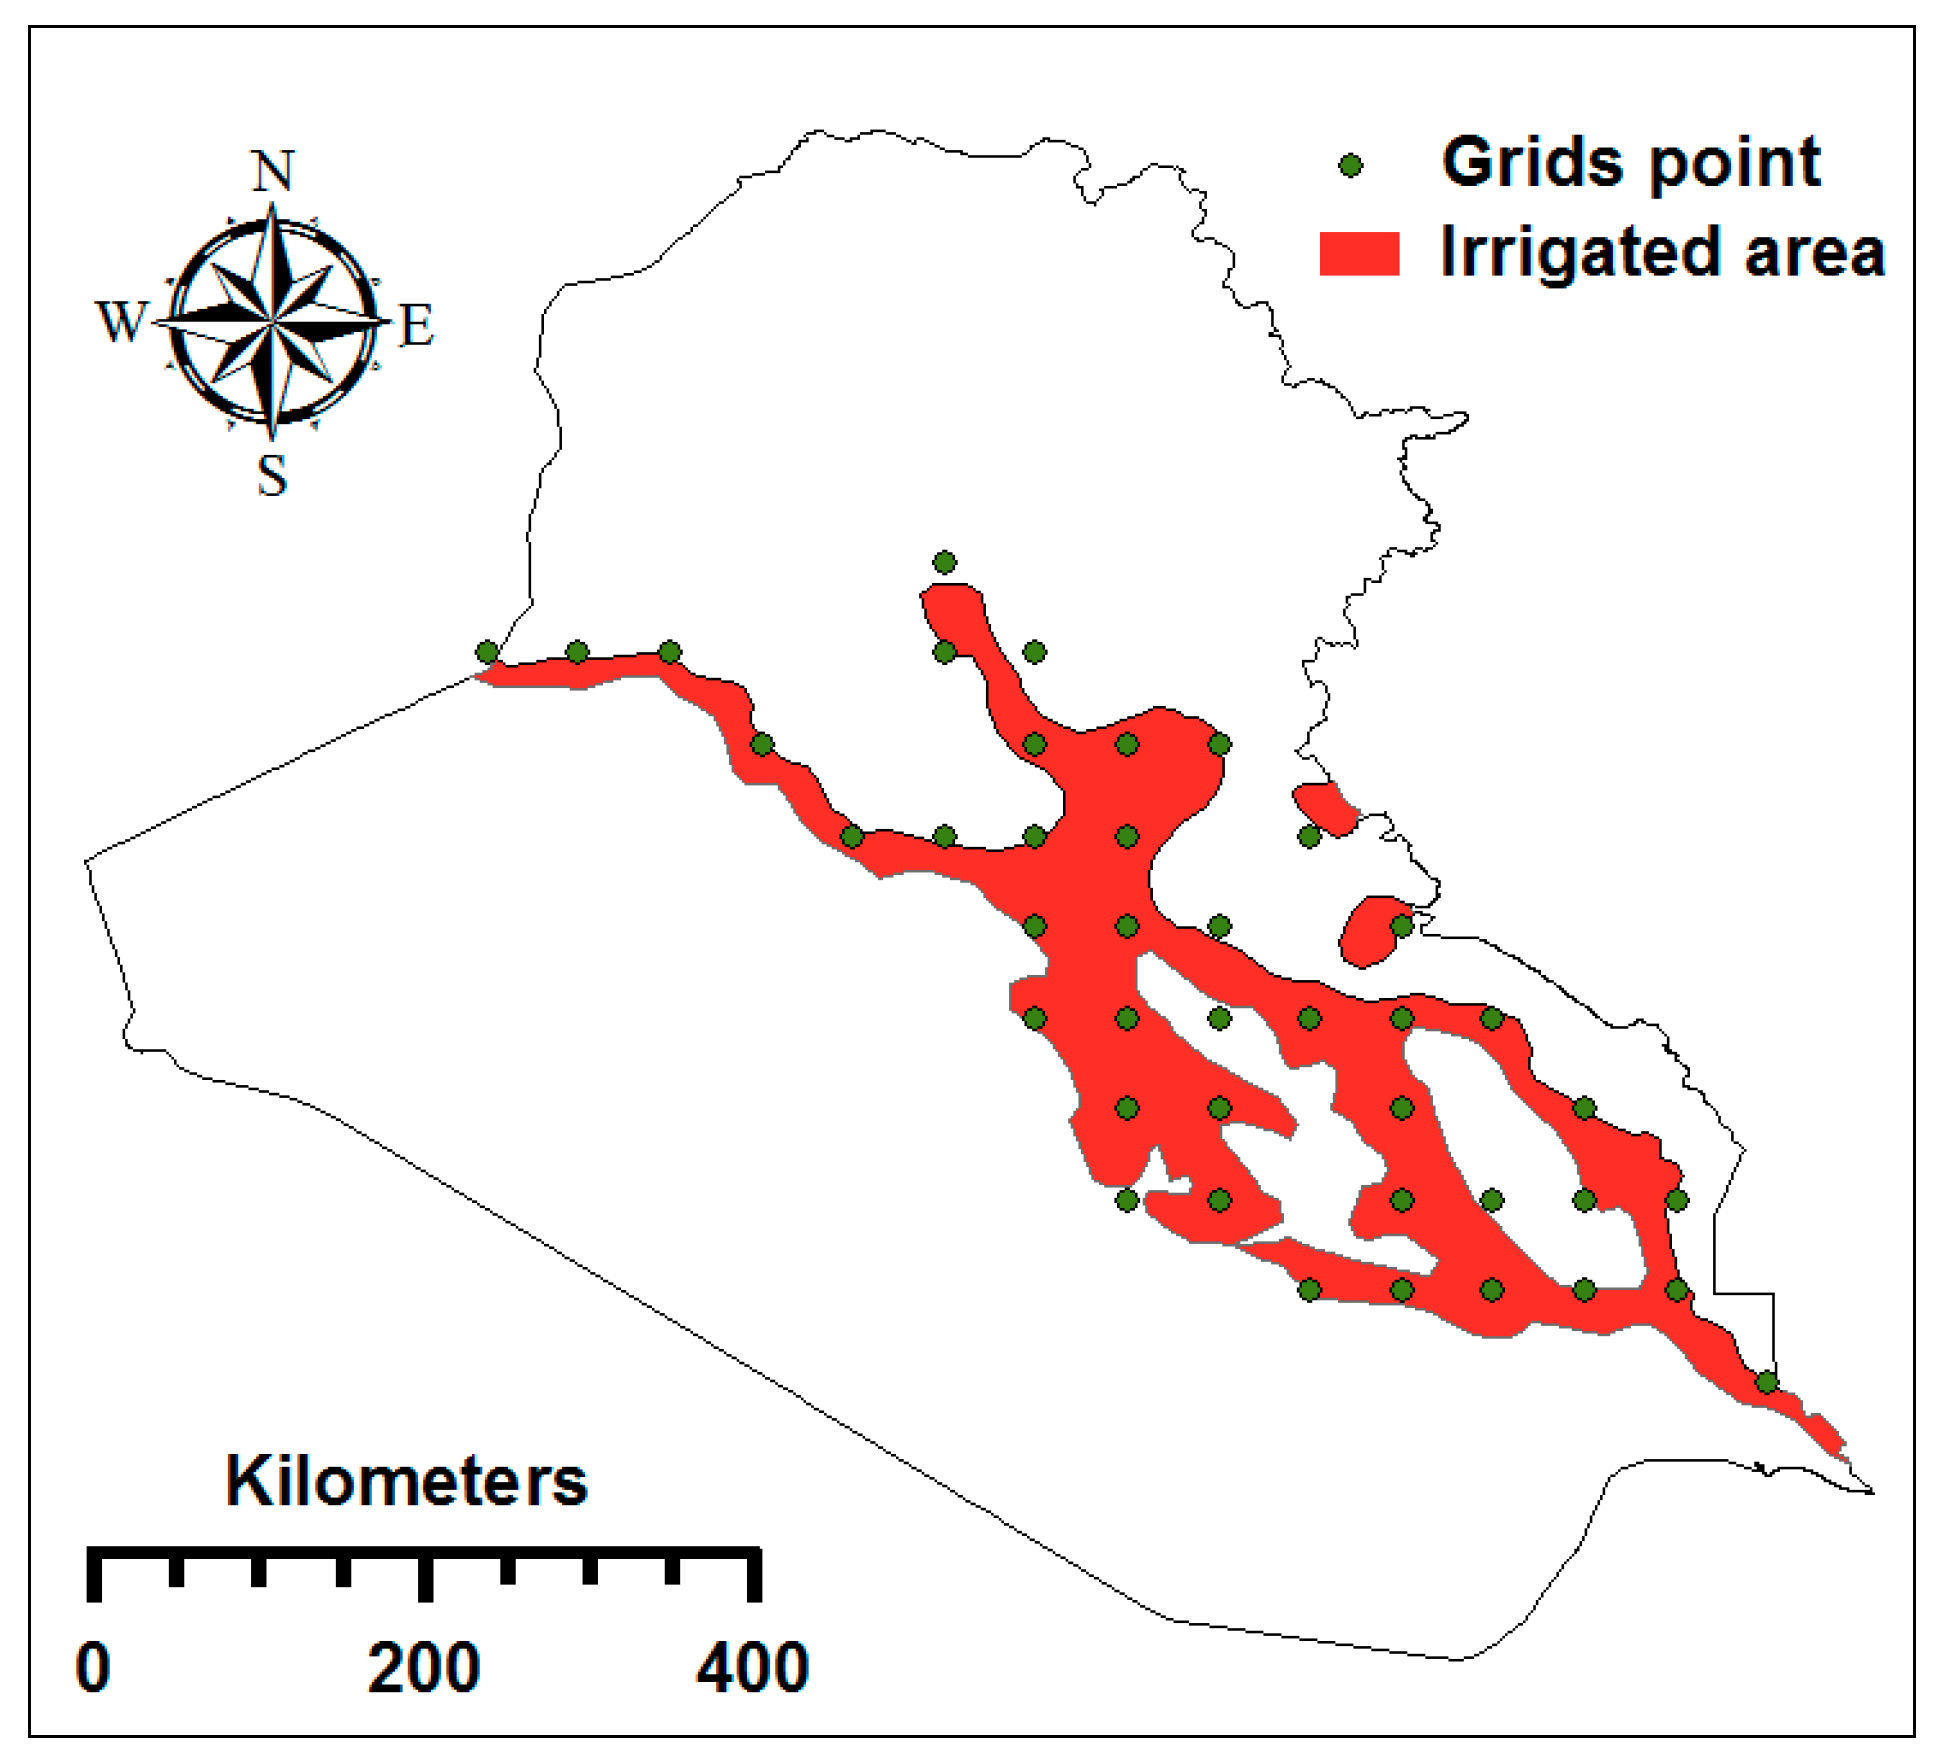
Iraq is a Southwest Asian country (Longitude: 38° 45′E–48° 45′E and Latitude: 29°15′N–38° 15′N) with a total land area of 438,320 km2 [33]. The hot and dry summer (June-September) and the cool and wet winter (November-March) dominate the climate of the country [34]. Almost all rainfall (about 90% of the annual total) occurs in winter while the summer is extremely dry [35,36]. The rainfall amount geographically varies from below 100 mm in the southwest to above 1000 mm in the far north [37]. The minimum temperature in winter varies between 0 and 5 °C in the northeastern foothills and the southern alluvial plains. The summer daily maximum temperature often exceeds 45 °C in the south. A subtropical desert (BWh) climate dominates the parts of the country followed by subtropical steppe (BSh) and dry-summer subtropical (Csa) climate (Figure 1). The combined effects of low rainfall and extreme temperature have made the major portion of the country dry. The country often faces natural disasters such as severe drought due to high variability in climate [38]. Three major river basins namely, the Tigris, the Euphrates, and the Shatt Al-Arab cover the most parts of the county [39].
The croplands of Iraq are predominantly irrigated. A major portion of the croplands (about 70%) is located in the central and the south of Iraq along the major rivers, where crops are produced under an irrigation scheme (Figure 2). The crops in the rest of the 30% cultivated land, mostly located in the northern region, are rain-fed [40].

2.2. Data Source

The monthly gridded precipitation and temperature data of GPCC and CRU were used in the present study. Both the data have a spatial resolution of 0.5° × 0.5° [41,42]. Both the datasets have a longer period of record. In this study, data for the period 1961–2010 was employed. An assessment of the performance of different gridded rainfall data in Iraq showed GPCC as the best dataset to replicate the precipitation climatology of Iraq [35]. The CRU was also found as a good product for temperature analysis in Iraq [43]. Both of the gridded datasets have been widely used for investigating hydroclimate across the world [44].

3. Methodology

3.1. Climatic Water Availability (CWA)

The CWA is the surplus or deficit of water after evaporative loss (PET) of precipitation (P). Therefore, CWA is estimated as the difference between P and PET. Several methods are available for PET estimation. Performance of some widely used PET methods in a semi-arid region [45] showed Penman–Monteith as the most suitable method followed by Hargreaves and Thornthwaite. The Thornthwaite method [46] needs merely the mean temperature in contrast to a large number of data required for other methods and therefore, it is more preferable for estimation of PET in a data-scarce region.
The Thornthwaite PET can be estimated as [47]:
P E T i = 16 K i ( 10 T i H ) m
where PETi and Ti are the monthly total PET (mm) and average temperature (°C) of the month i respectively; Ki is the correction coefficient defined as:
K i = ( S i 12 ) ( n i 30 )
where Si and ni represent sunshine hours and the number of days respectively in month i.
The CWAi of the month i is estimated as:
C W A i = P i P E T i

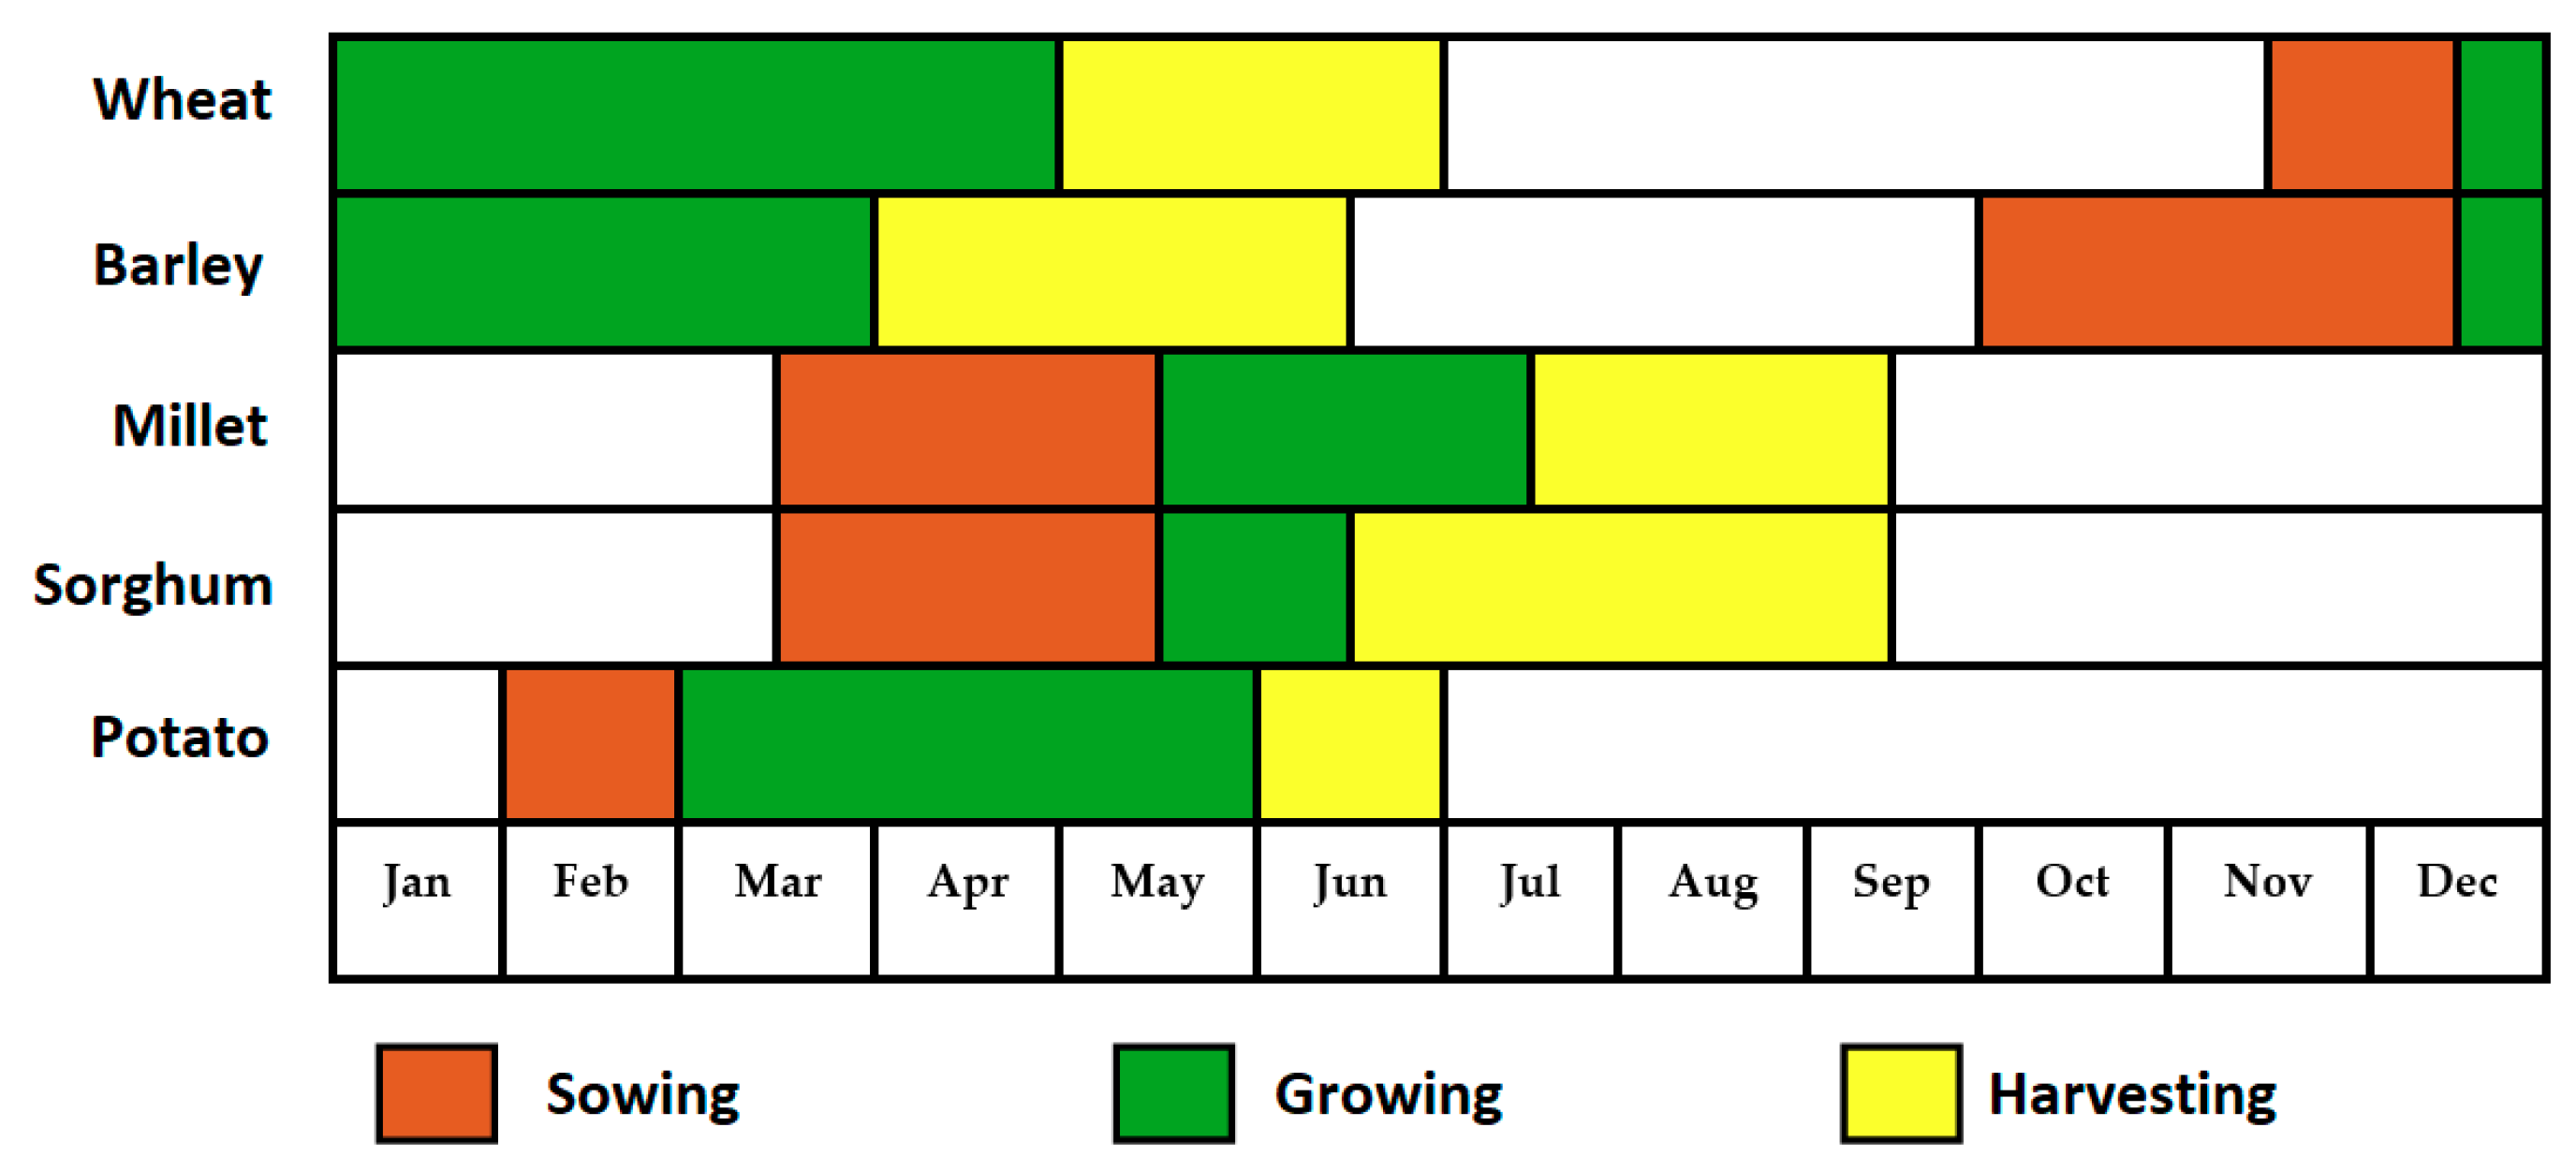
3.2. Cropping Seasons

The CWA and CWD during five main crop growing seasons of Iraq were analyzed in this study. Among the five crops, two are winter crops, wheat and barley which account for 73% of all planted area of Iraq while the remaining three are summer crops, millet, sorghum and potato. The calendar of the selected crops of Iraq is shown in Figure 3.
The cropping seasons vary for a few days from the irrigated area in the south to the rain-fed agricultural region in the north of Iraq; in the rain-fed zones the date of plantation is always associated with the timing of rainfall. Therefore, the season of winter crops in the irrigated region is more regular than rain-fed area. Crop yield in the irrigated region is more but the production cost is also higher. Irrigation is generally required during sowing and growing periods of a crop. Therefore, CWD during those periods is estimated in this study. The periods for which CWD of different crops was estimated in this study are presented in Table 1.

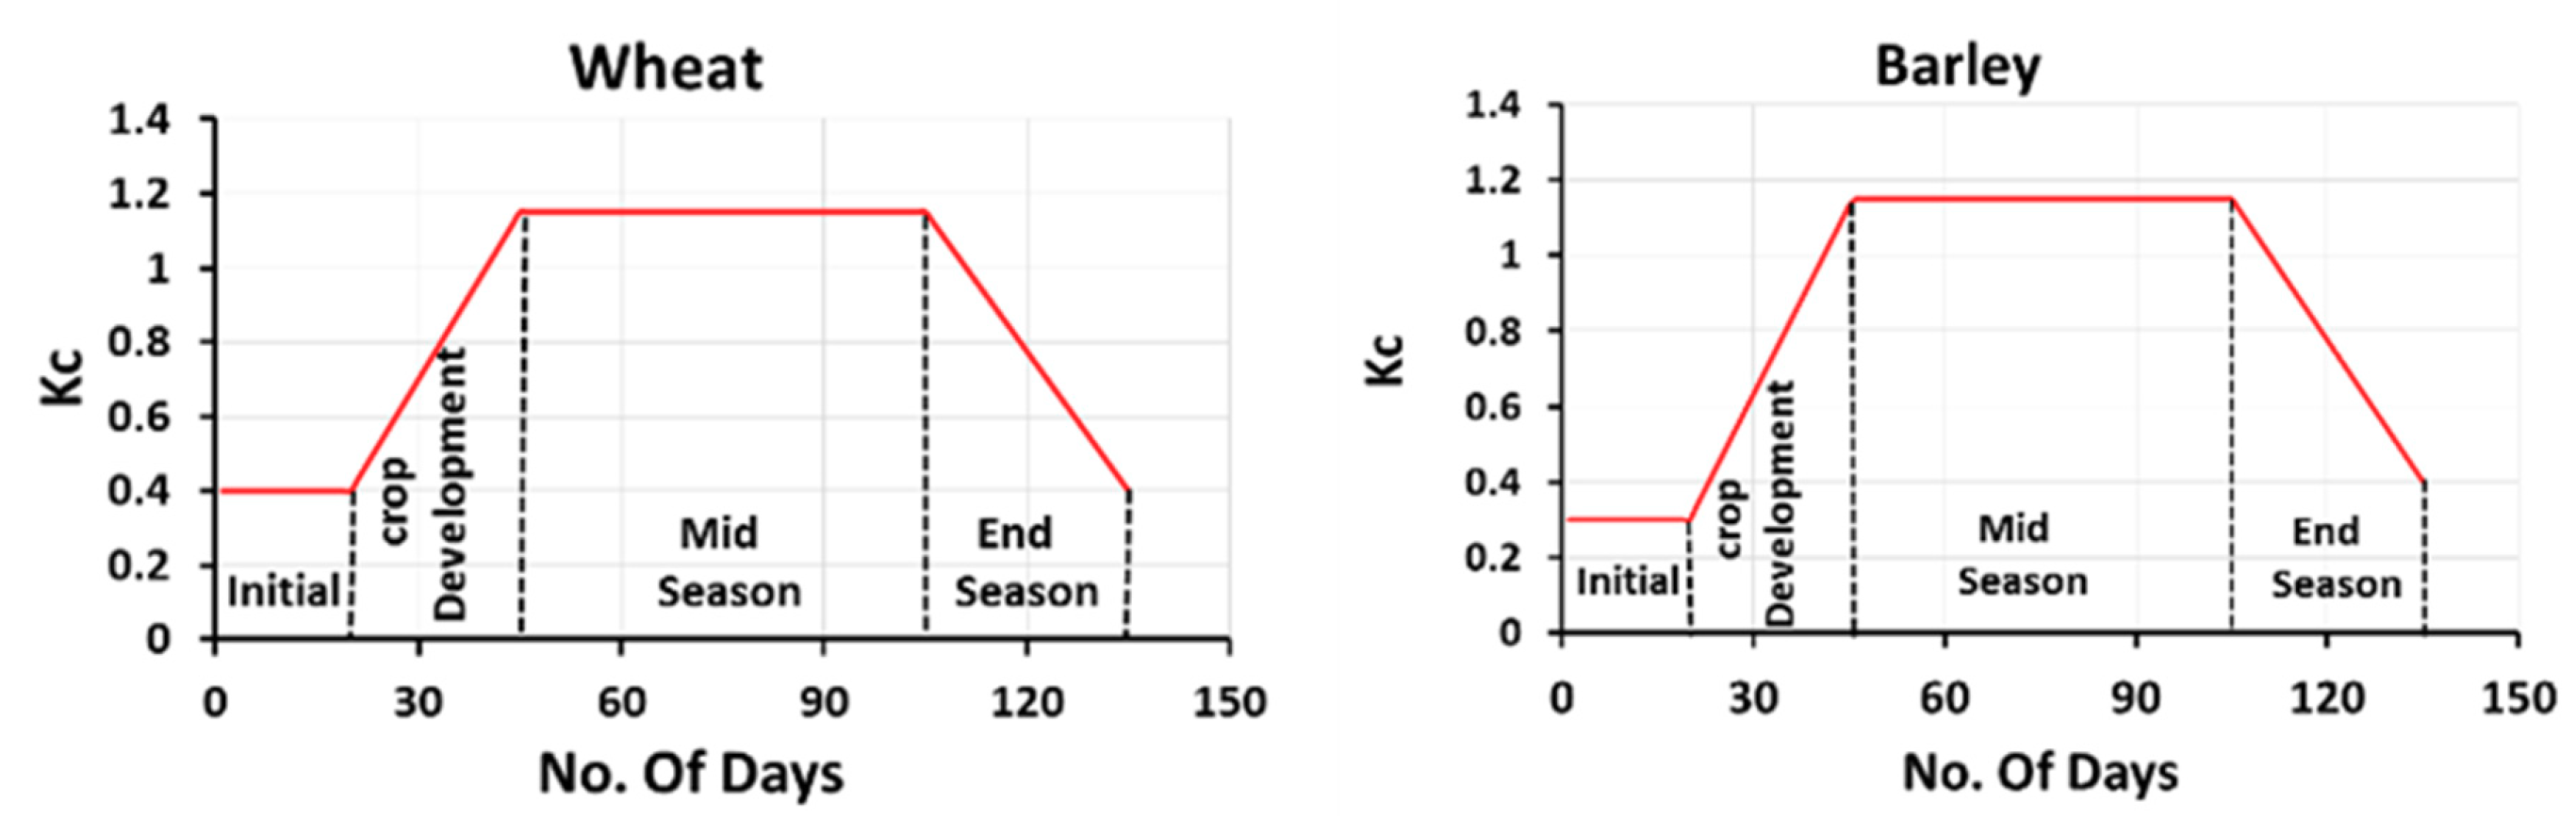
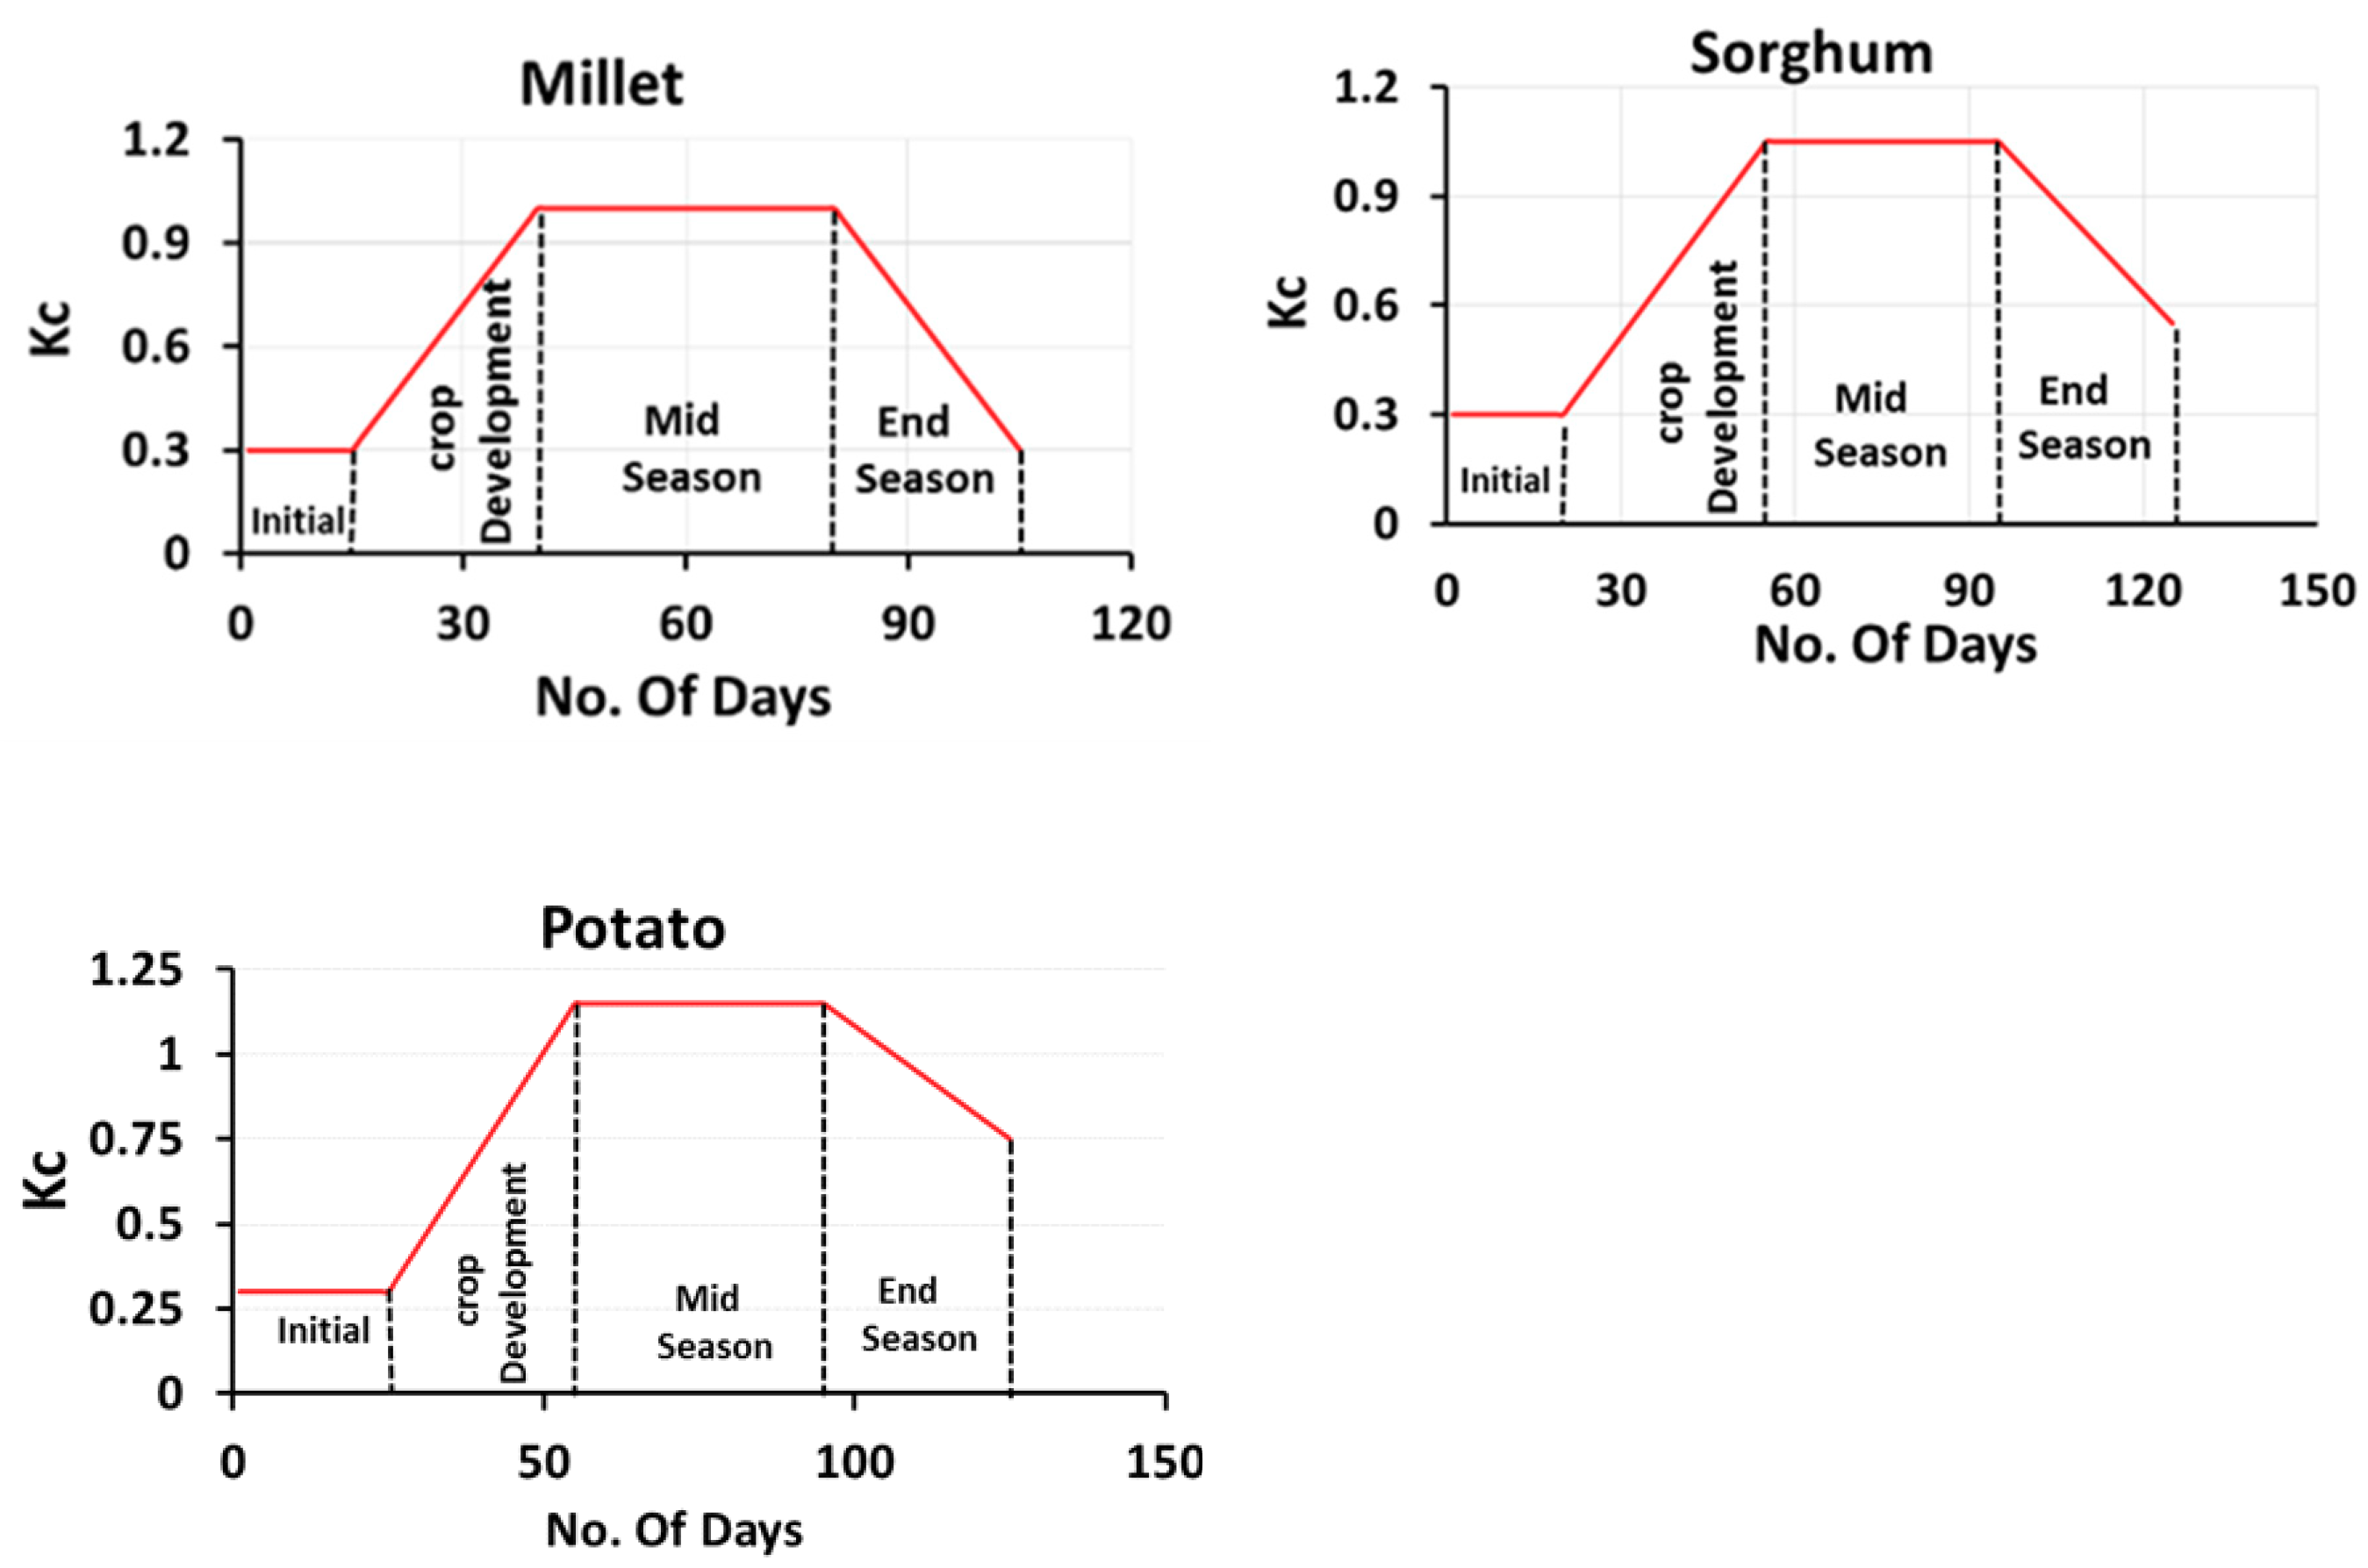
3.3. Defining the Crop Coefficient (Kc)

The Kc, introduced by [48] is defined as the proportion of actual crop evapotranspiration (ETc) to reference evapotranspiration (ETo) [49,50]. The Kc of a crop is used to estimate the ET of the crop from the reference ET. Figure 4 shows the Kc coefficient of the crops considered in this study.

3.4. Estimation of Crop Water Demand (CWD)

FAO-56 model was employed for the estimation of crop irrigation need. The CWD can be estimated as [51]:
C W D = E T c r o p P e
where E T c r o p = crop evapotranspiration and P e = effective precipitation. The E T c r o p can be calculated as:
E T c r o p = K c   × E T o
The Kc values suggested by FAO (given in Figure 3) were used in this study for the estimation of ETcrop.

3.5. Sen’s Slope Estimates

Sen’s slope (Q) estimates the overall slope of a time series (y) as the median of slope between all the successive sampling points [52]. Mathematically, it is represented as:
Q = m e d i a n [ Δ y Δ t ]
where, Δy is the change in recorded values due to change in time, Δt, between two successive data points in the time series.

3.6. Trend Analysis using MK and MMK Tests

The MK test statistic (S) of a data series, y having n data points is estimated as [21]:
S = k = 1 n 1 . i = k + 1 n sign   ( y i y k )
where
s i g n   ( y i y k ) = {   + 1             w h e n   ( y i y k ) > 0       0               w h e n   ( y i y k ) = 0 1             w h e n   ( y i y k ) < 0
The variance of S (Var(S)) is estimated from Z statistics to decide trends significance,
Z = { S 1 V a r   ( S )     w h e n   S > 0   0                             w h e n   S = 0   S 1 V a r   ( S )     w h e n   S < 0  
If Z is found significant, the MMK test de-trends the time series [32], ranks the series ( R i ) and then calculates its equivalent normal variants ( Z i ) as,
Z i = ϕ 1   ( R i n + 1 )
where, ϕ 1 represents the inverse form of normal distribution. The Hurst coefficient (H) of the series is then derived through maximum log-likelihood function to estimate autocorrelation function for lag l at any scale using the following equation [53]:
ρ l = 1 2   ( | l + 1 | 2 H 2 | l | 2 H + | l 1 | 2 H )
The significance of H is decided using the first and second moments for H = 0.5. For significant H, the variance of S is estimated as:
V a r ( S ) H   = i < j .   k < l 2 π   sin 1 ( ρ | j i | ρ | i l | ρ | j k | + ρ | i k | ( 2 2 ρ | i j | ) ( 2 2 ρ | k l | ) )
Here, V a r ( S ) H   is the biased estimate of the variance of S which can be removed using a correction factor (B):
V a r ( S ) H = V a r ( S ) H × B
where, B is a function of H, which can be found in [32]. The significance of the MMK test is determined by using V a r ( S ) H instead of V a r ( S ) in Equation (9). At 95% confidence level, the null hypothesis of no trend is rejected if |Z| > 1.96.
The “modifiedmk” package available in statistical software R was used in this study for the estimation of Sen’s slope, and MK and MMK test significance.

3.7. Wilcoxon Signed-Rank Test

The Wilcoxon signed-rank test is a non-parametric hypothesis test widely employed to compare two related samples [54]. In this study, it was used to evaluate the change in CWD between early (1961–1990) and late (1984–2013) periods to reveal if there was any significant change in CWD. The null hypothesis of the test is that the median of CWD in the early and the late period are same. It means that there is a change in CWD, in the case of a rejection of the null hypothesis.
Wilcoxon signed-rank test does not depend on the distribution of data like student’s t-test which is only applicable when the CWD data is normally distributed. However, the sample size of CWD data for each period was only 30 which was also found highly skewed. Therefore, non-parametric Wilcoxon signed-rank test instead of any parametric test (e.g., student’s t-test) was used in this study.
In Wilcoxon signed-rank test, the differences between CWD values for two periods are first calculated and the values are then ranked in two ways, ascending and descending. The ranks in both orders are summed individually and the Wilcoxon test statistics (W) are estimated as the smaller of those two values to assess the significance in the difference in two samples [55]. The “wilcox.test” function available in statistical software R was used in this study for Wilcoxon signed-rank test.

4. Results and Discussion

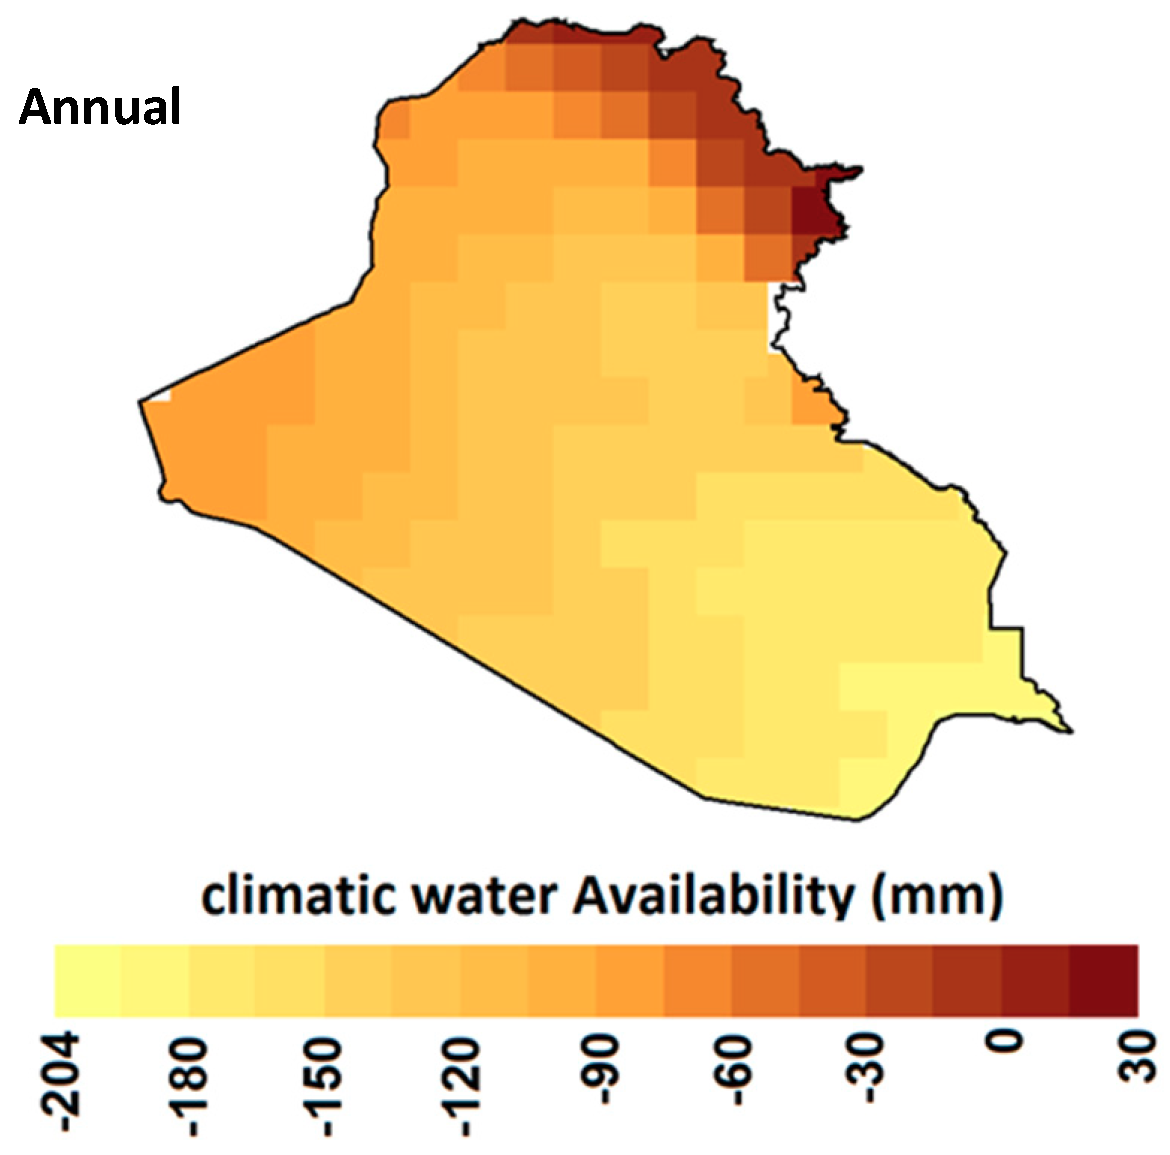
4.1. Spatial Distribution of Climate Water Availability (CWA)

The monthly gridded surface air temperature data of CRU and precipitation data of GPCC were used for the estimation of CWA at different CRU/GPCC grid points covering Iraq during 1961–2013. The spatial distribution of annual and seasonal CWA of Iraq is presented in Figure 5. The map of annual CWA reveals a deficit in entire country of Iraq, except in the high rainfall dominated northern region (Zone III). The deficit was found more than 150 mm in the major irrigated region located in Zone I. The figure shows a surplus in CWA during winter and spring in most of the country and deficit during summer and autumn. The surplus in CWA during winter and spring was found in the range of 60–130 mm and 30–120 mm in Zone III where the rainfall is high and the temperature is low during winter and spring. The surplus in winter and spring CWA was also observed in Zone II in the range of 20–60 mm and 0–30 mm, respectively. However, CWA in Zone I, where most of the irrigated land is located, was found to have a small surplus (0 to 20 mm) in winter and a small deficit (−20 to 0 mm) in spring. A completely opposite scenario was observed for summer and autumn. A large deficit in CWA was observed over the whole country during summer and moderate deficit in most of the country except in the extreme north in autumn. The deficit in the irrigated regions located in Zone I was found in the range of −350 to −250 mm in summer and −120 to −75 mm in autumn. Overall, the results suggest a deficit in CWA in the major irrigated region of Iraq in most of the year (spring, autumn and summer) and a slight surplus in winter. The large deficit in CWA in a major part of the country has made the agriculture of Iraq dependent on irrigation. A surplus of water in the northern part (Zone III) allows rain-fed agriculture.

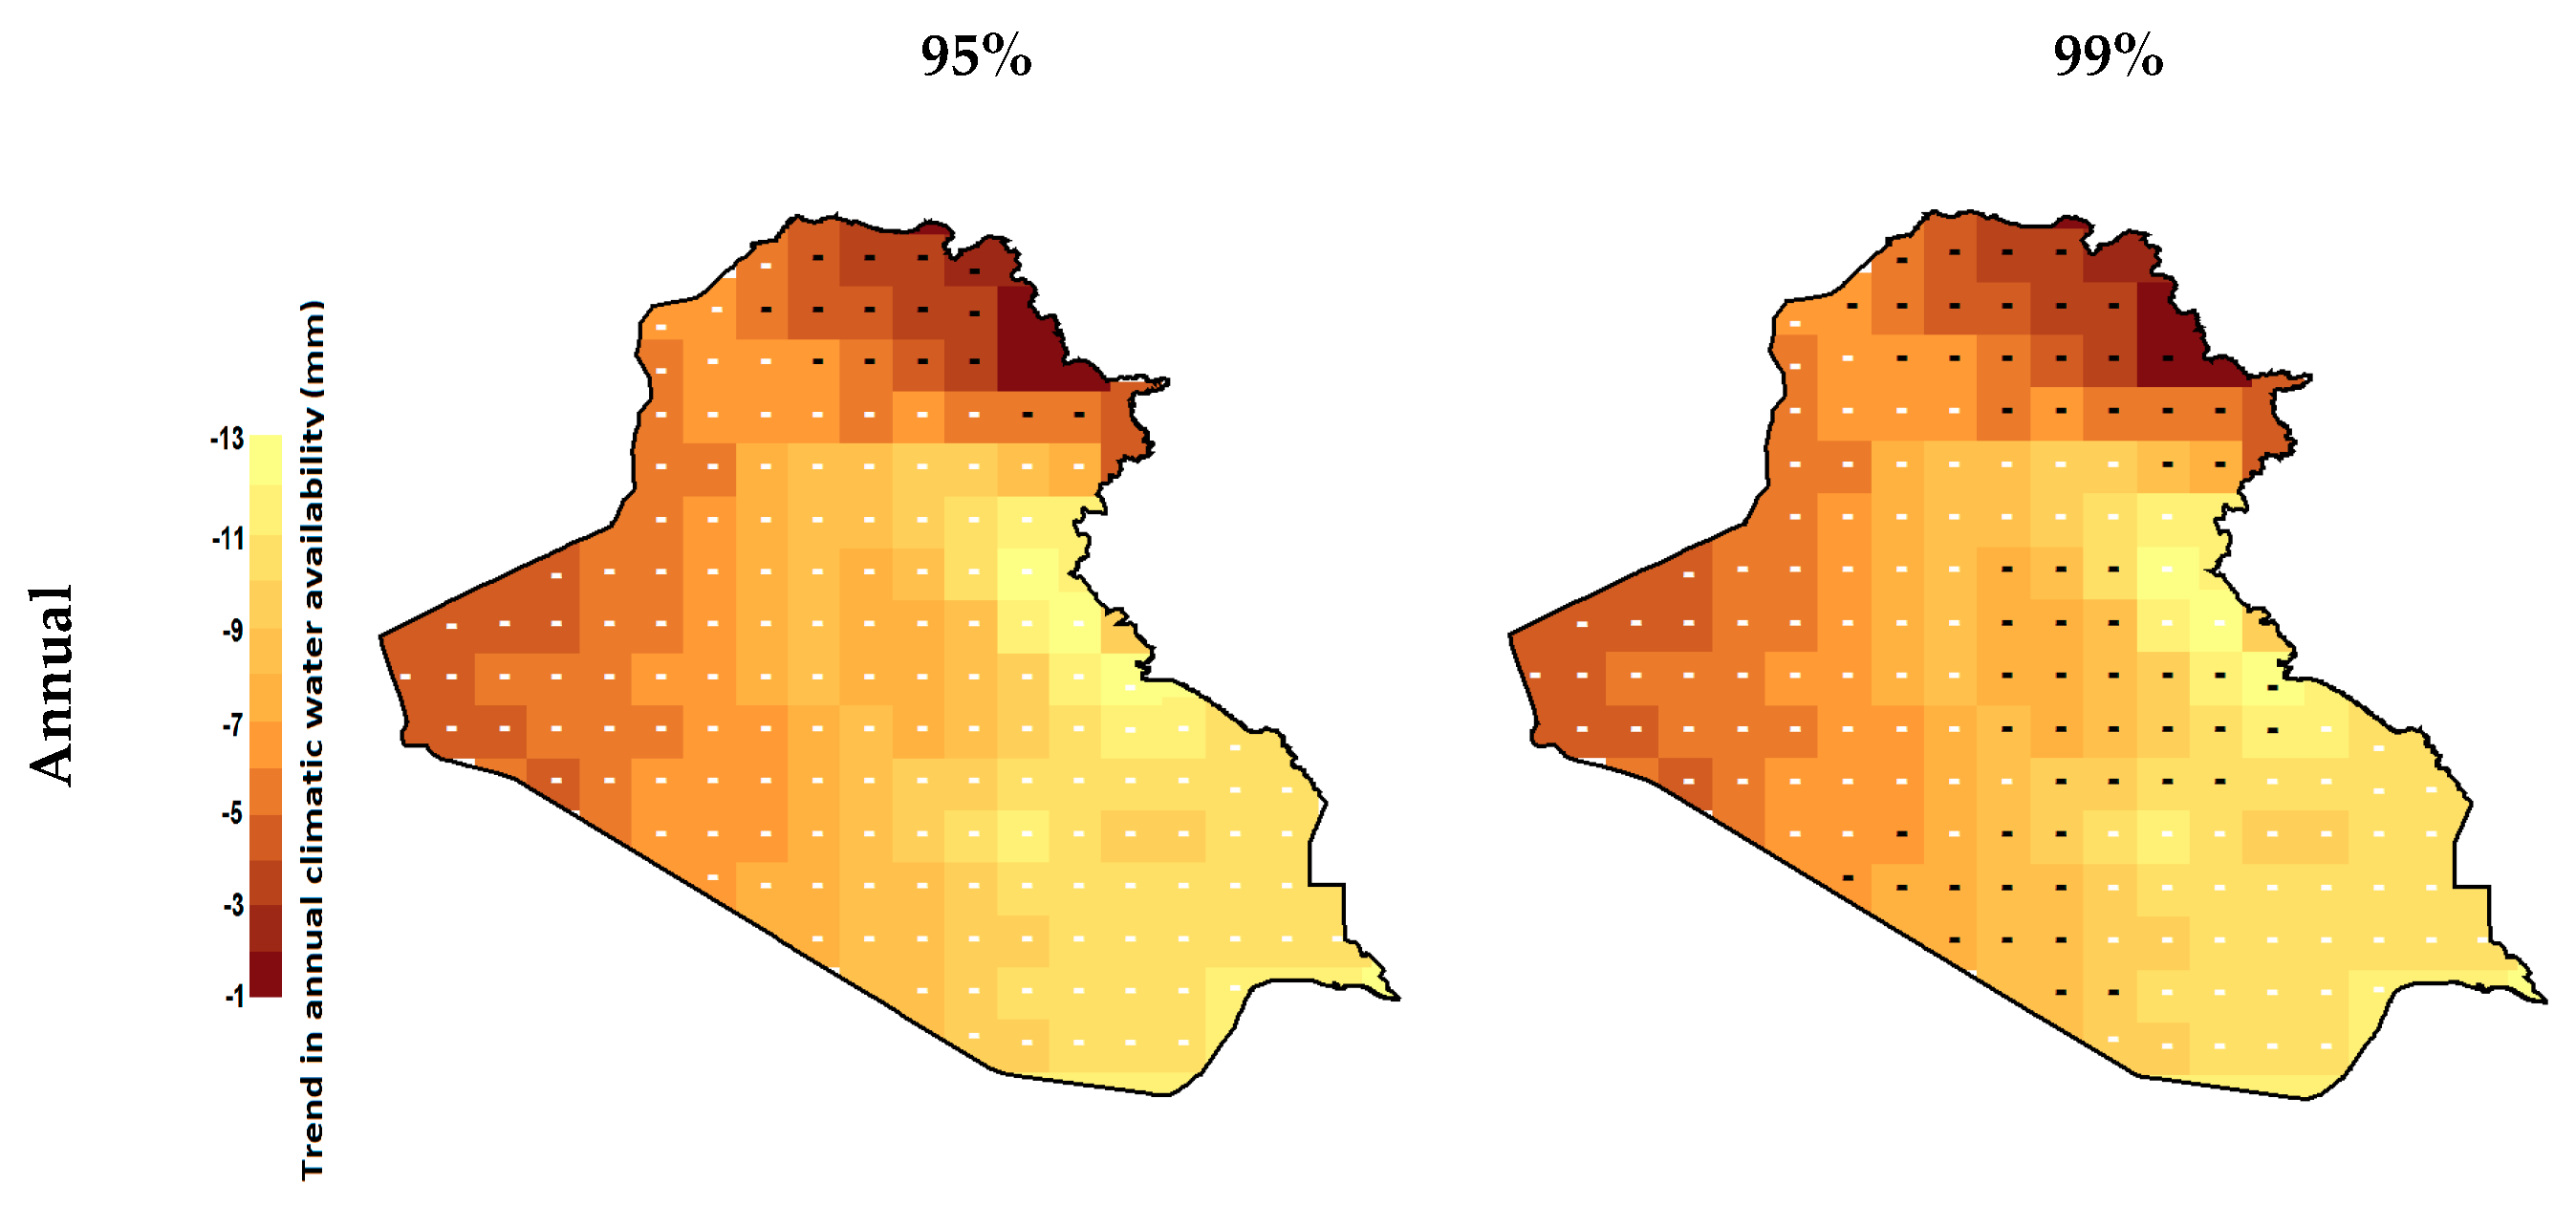
4.2. Trends in Climatic Water Availability

The spatial distribution in the trends in annual and seasonal CWA is presented in Figure 6. The color ramp is used to show Sen’s slope to estimate the rate of change. The black and white + or – sign is used to show the significance of changes estimated by MK and MMK tests, respectively. The figure shows a decreasing trend in CWA in all the seasons of Iraq.
The MK trends in annual CWA showed a decrease in CWA at α = 0.01 (99% confidence level) over the whole of Iraq. The MMK trend also shows a decrease in CWA in the entire country except in Zone I at α = 0.05 (95% confidence level), and the entire west and a major portion in the southeast of Iraq at α = 0.01. The minimum decrease was observed in the east of zones II and I at a rate of −1mm/year and the maximum decrease in zone III up to −13 mm/year.
The trends in winter CWA showed almost no change. A significant decrease was observed only at five grids in the west of zone-I at α = 0.05 by MK test. However, the MMK revealed that those were due to the natural variability of climate. A decrease in spring CWA was noticed in the west and the south at α = 0.05 and only in the west at p = 0.01 by MMK test. The rate of declination in spring CWA was observed up to -1.8 mm/year in the northwest. The highest declination in CWA was observed in summer among all the seasons. It was found to decrease for the whole of Iraq, except for Zone III, by MMK test at α = 0.01. The declination was found in the range of −5 to −11 mm/year in most of the country. The trend in autumn CWA was found very similar to spring CWA trend. Decease in autumn CWA was found in the range of −0.3 to −0.6 mm/year only.
A large dissimilarity in the trends estimated using MK and MMK tests was observed. This is due to the inability of the MK test to separate the natural variability to determine the unidirectional trends. Overall, the MMK test revealed a decrease in annual and seasonal CWA in a major portion of Iraq. An increase in CWA was not found to be significant by both MK and MMK test at any grid point. This indicates a gradual increase in irrigation demand for all seasons in Iraq.

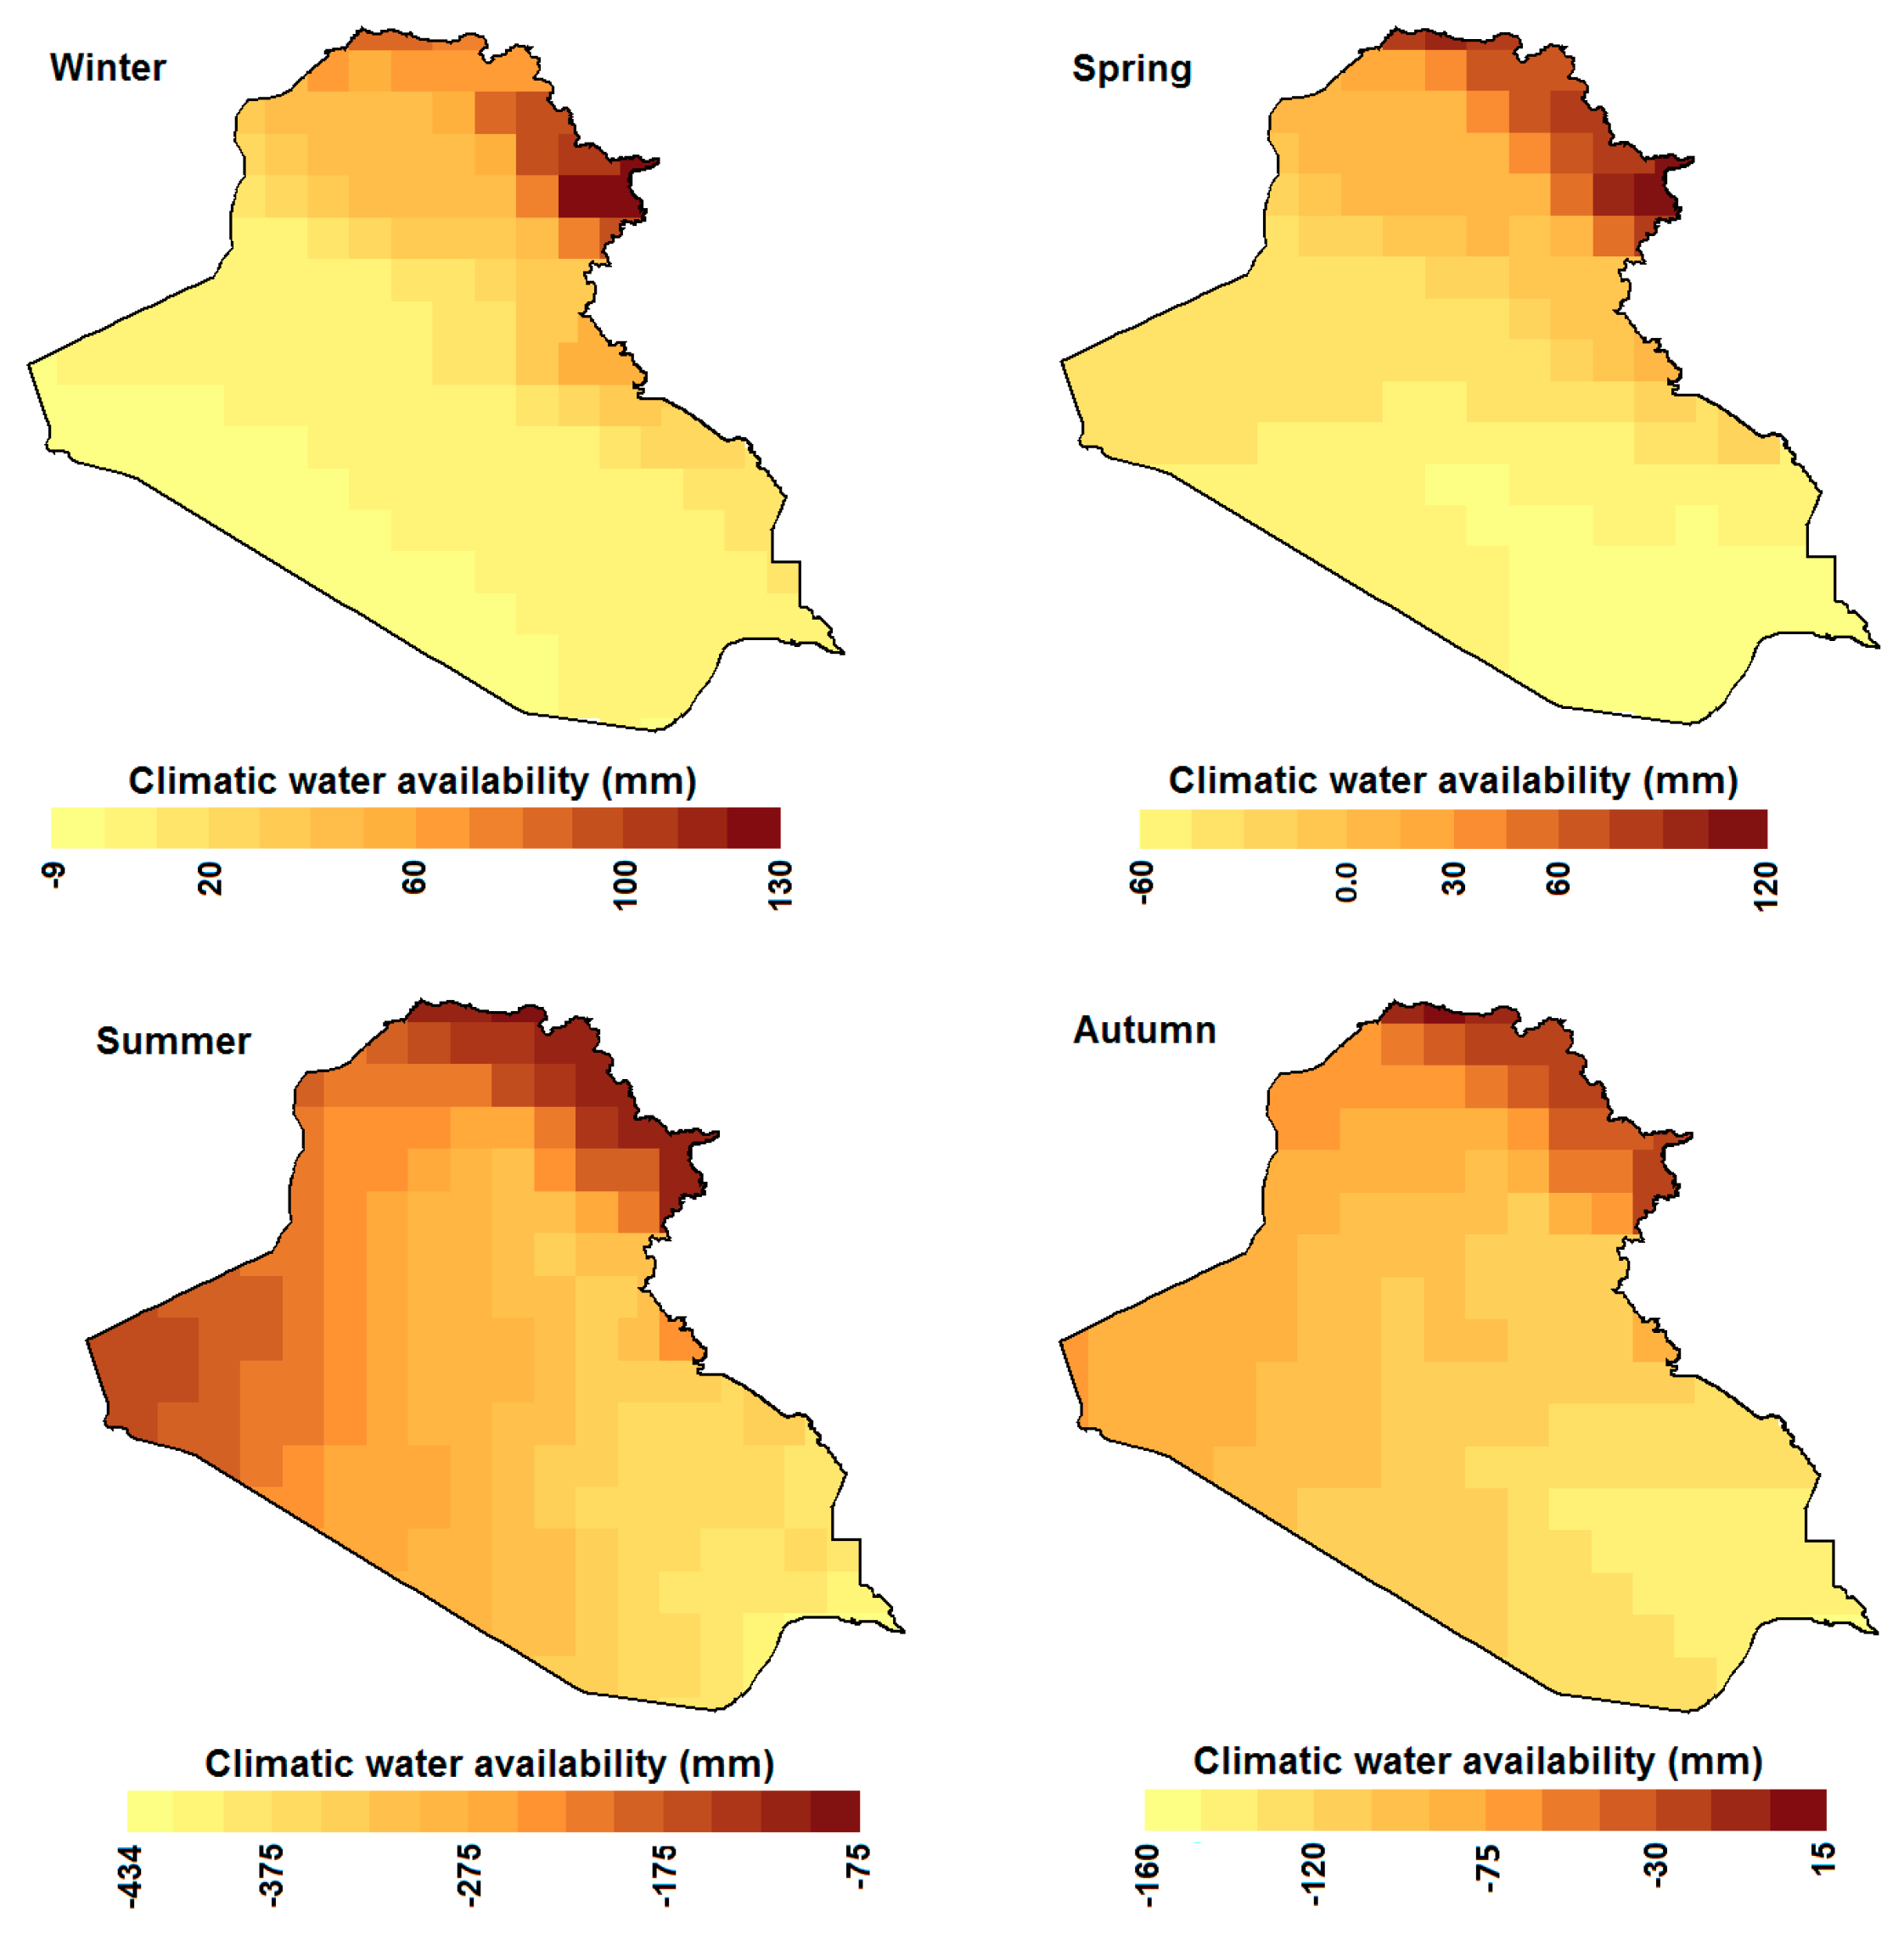
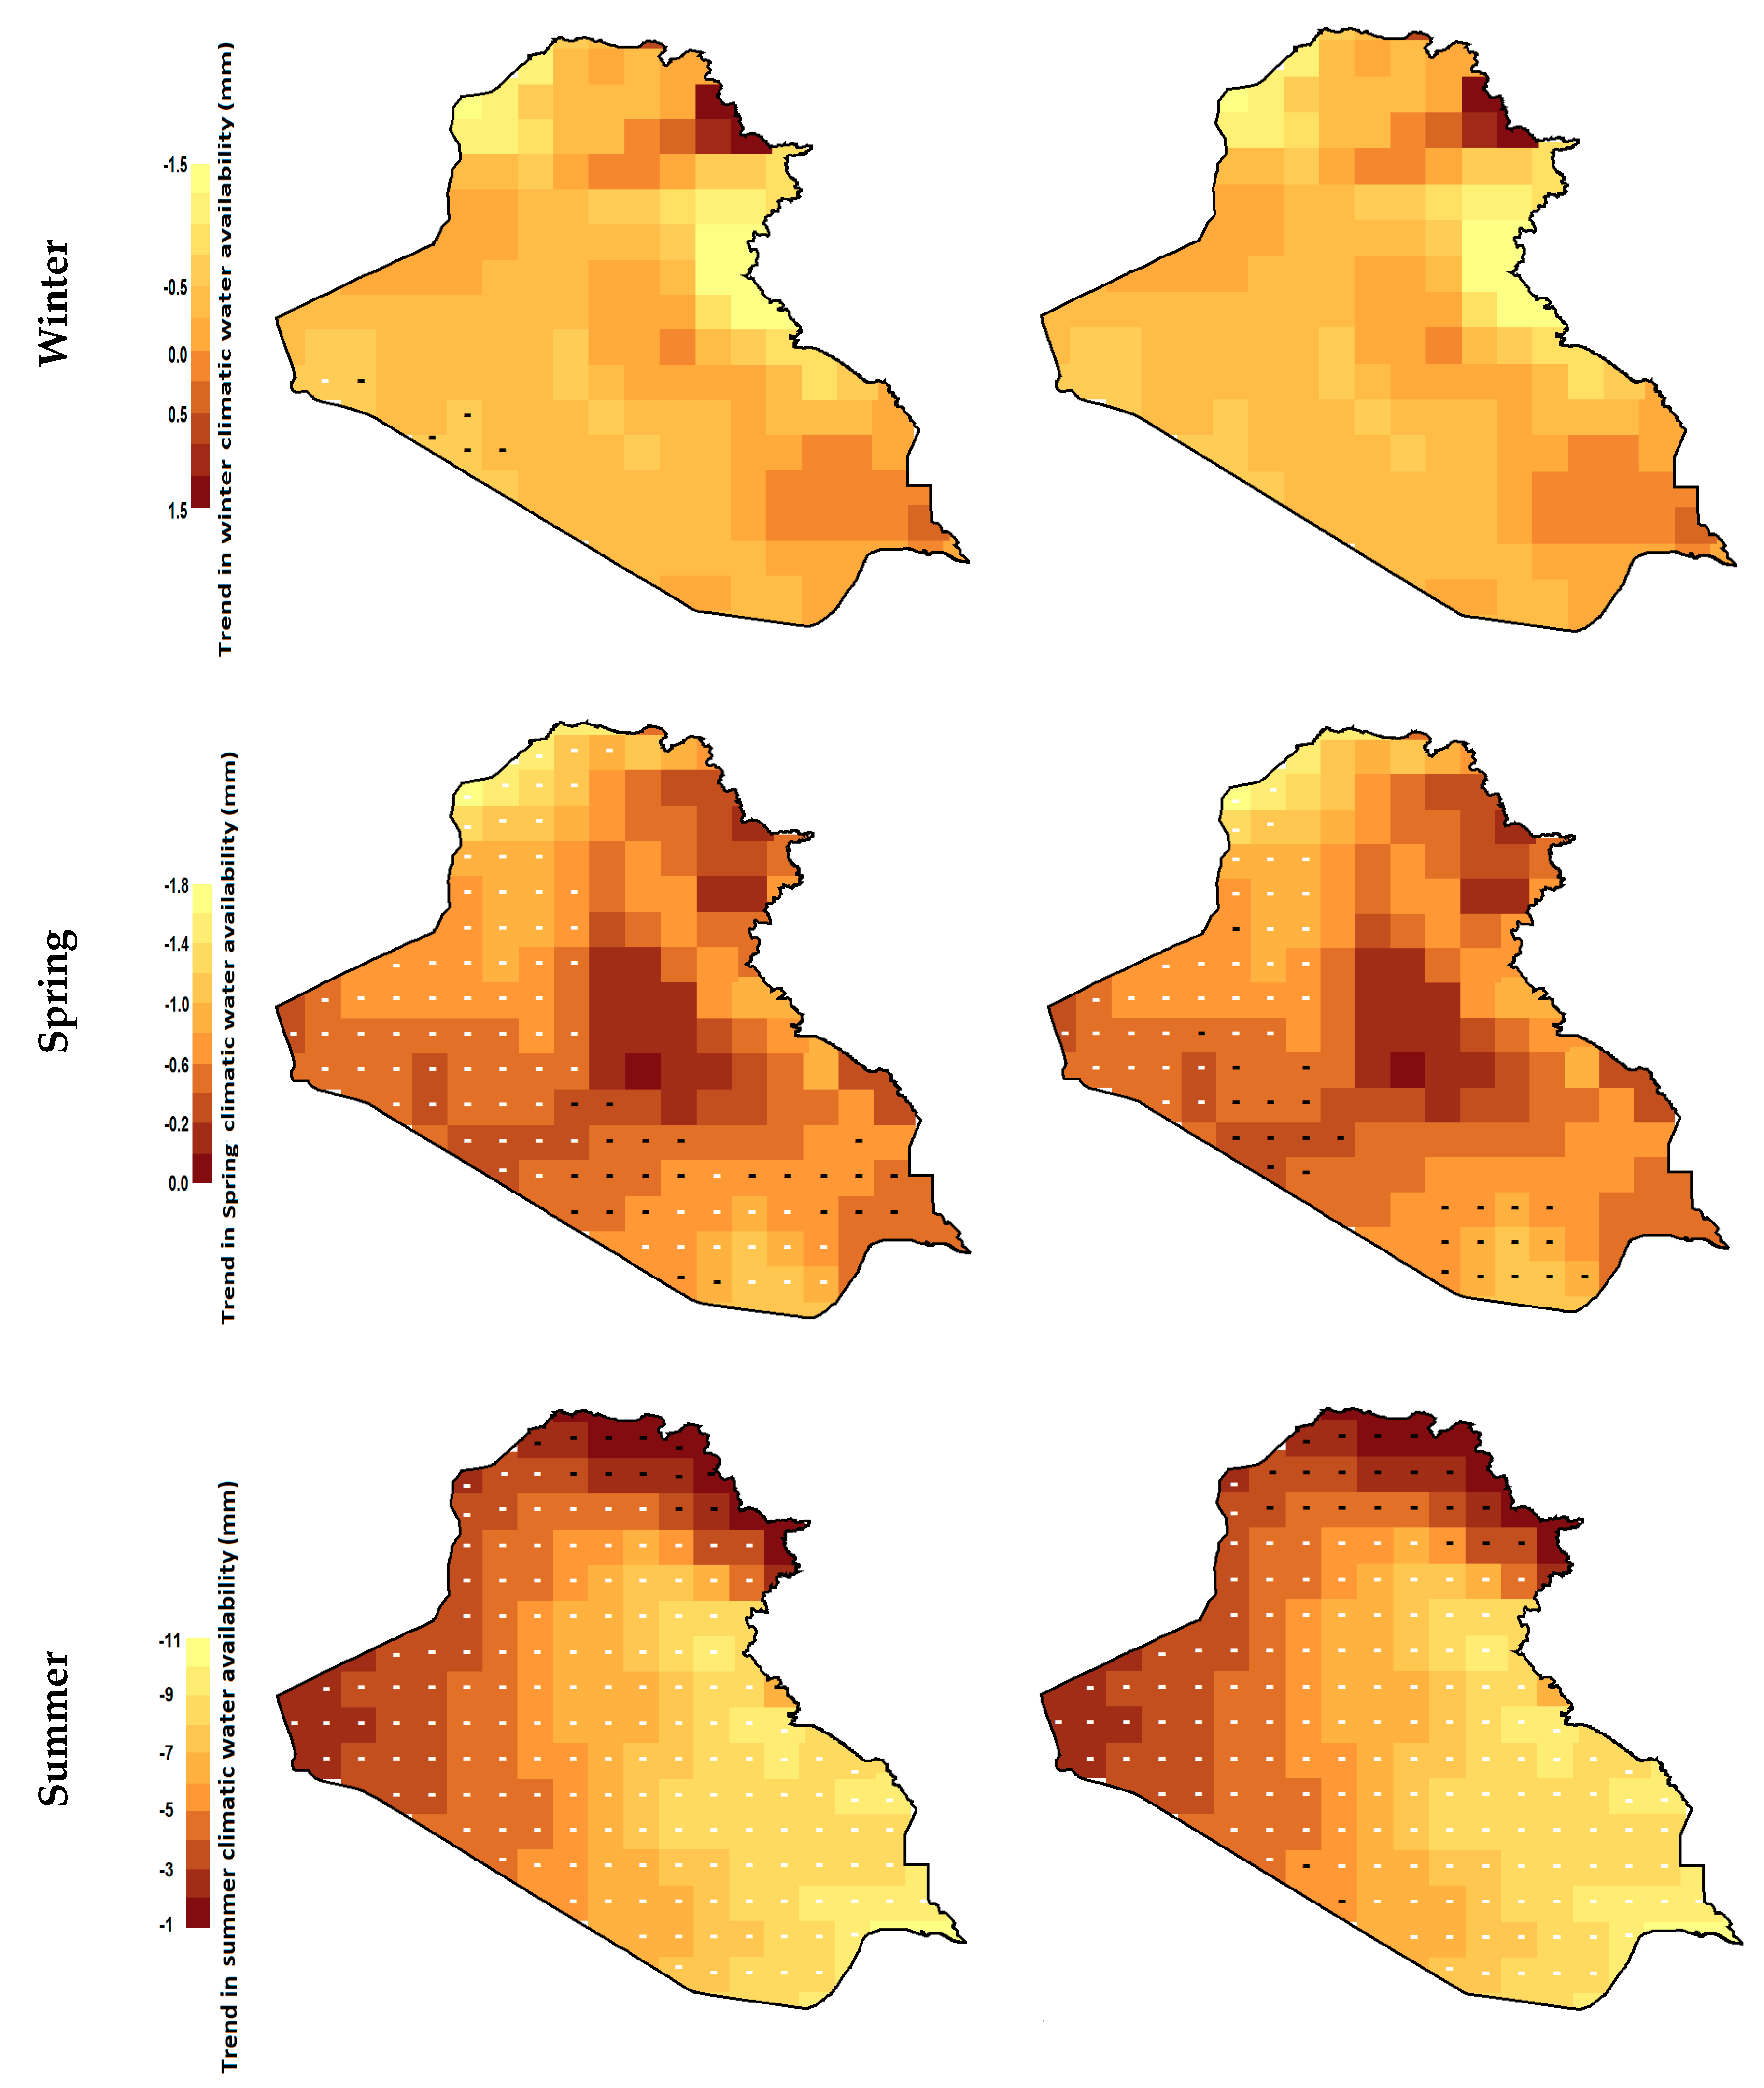
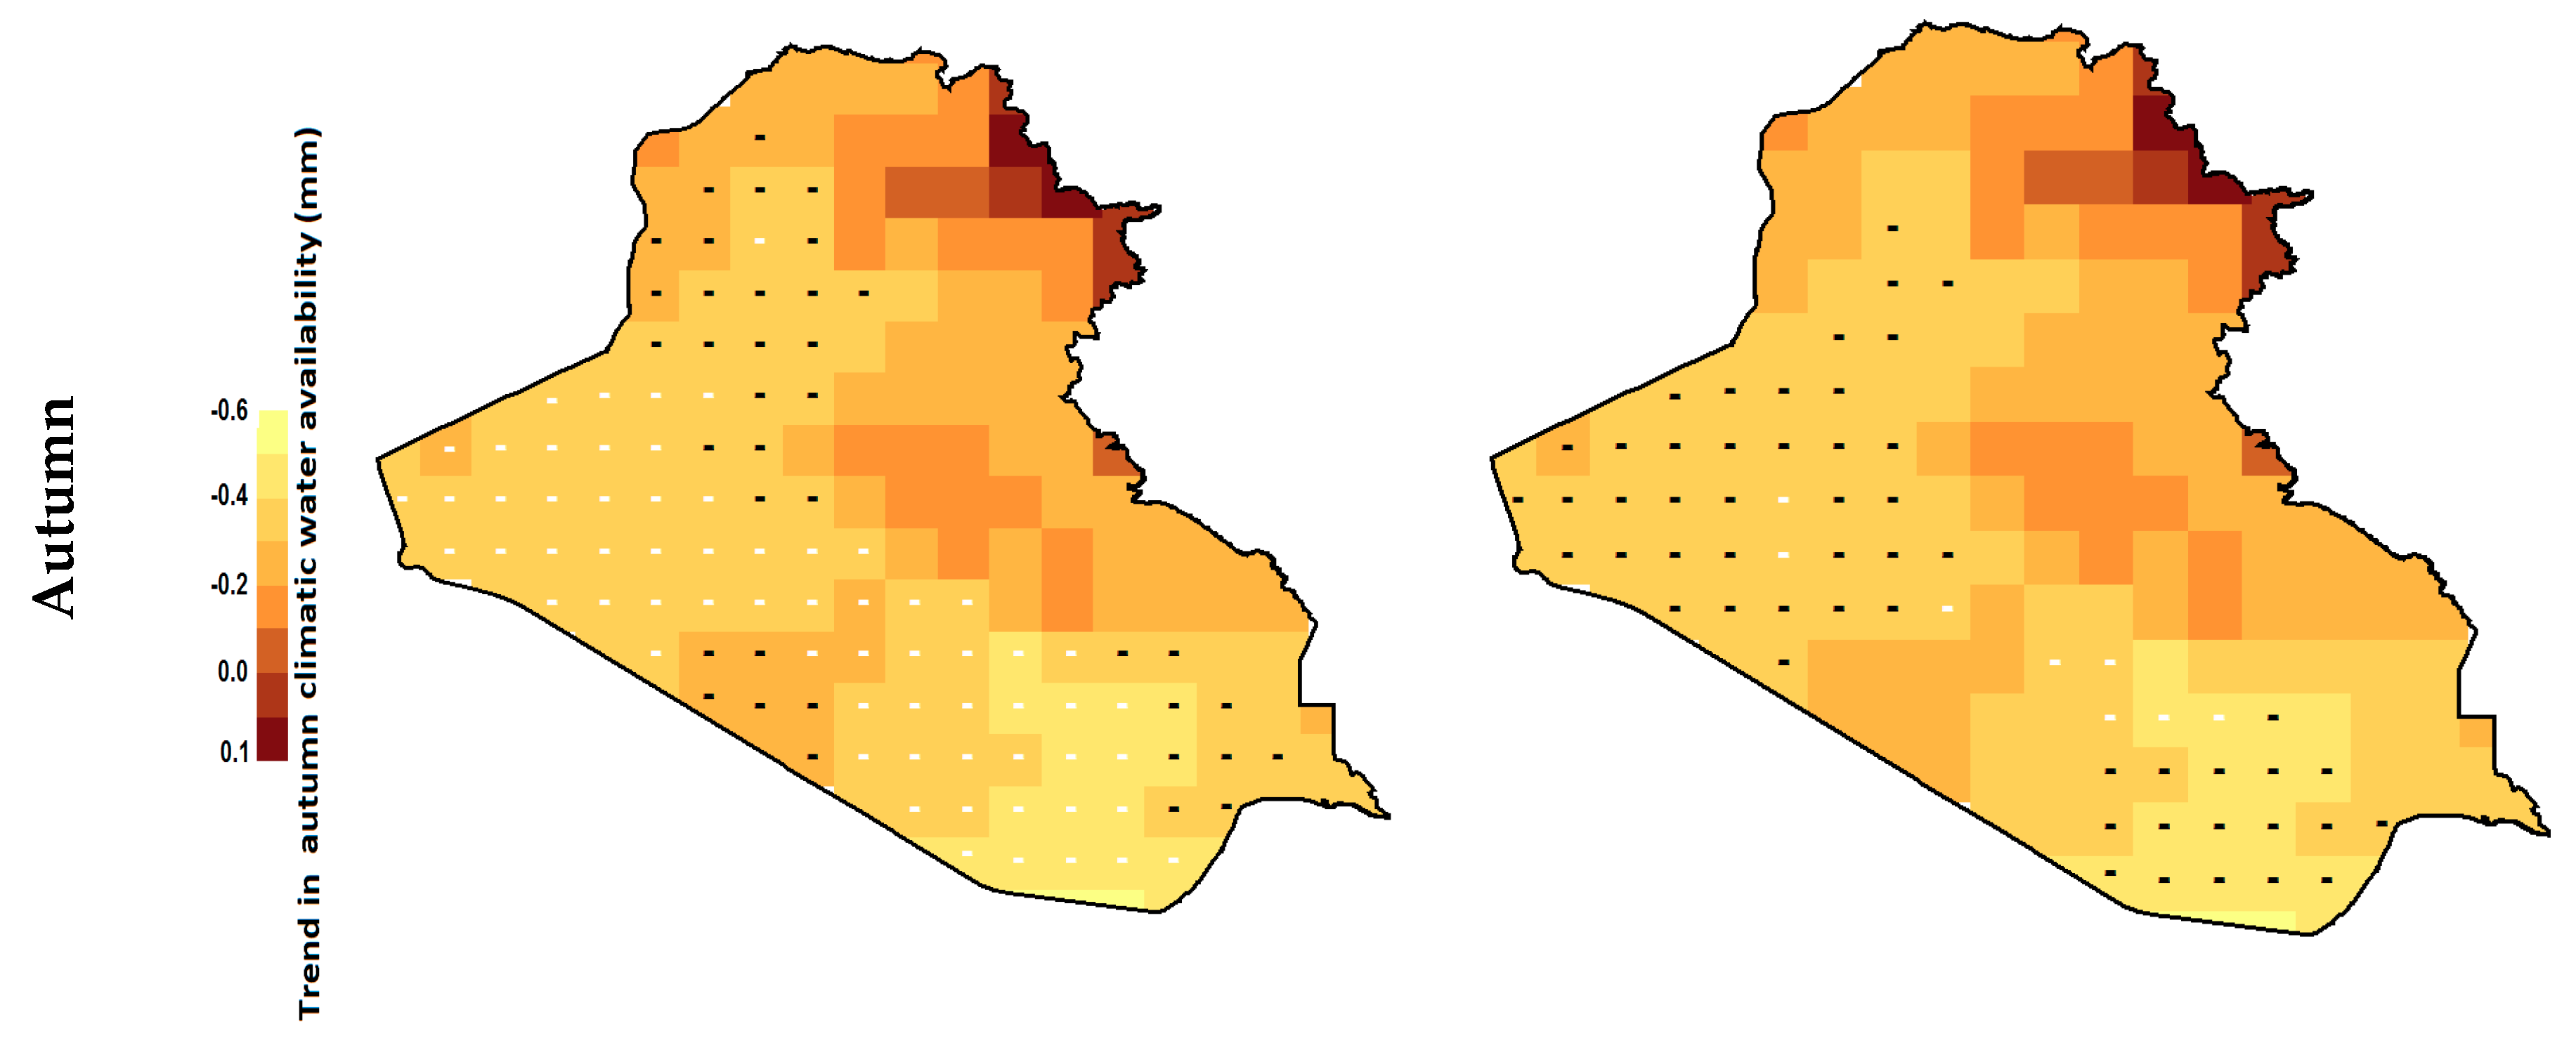
4.3. Trends in Climatic Water Availability during Cropping Seasons

The trends in CWA during different crop growing seasons are presented in Figure 7. Trends in CWA during wheat growing season showed declination in the range of −0.8 to −2.2 mm/year in most of the country at a significance level of 0.01. The MMK test revealed significant trends only in the west and the southeast of the country. The decreasing trend in CWA during the barley growing season was found as significant only in the far west corner of Iraq which is usually not cultivated. The largest decrease in CWA was observed in the millet growing season. It was found to decrease in the range of −1.0 to −8.1 mm/year in all over the country at α = 0.05. The decrease in CWA during sorghum growing season was also found to be high (−2.1 to −5.6 mm/year). It was found to decrease by MMK test in entire country at α = 0.05 except in the northeast. The decrease in CWA during potato growing season was found to be significant by MMK test only in the west and the north at α = 0.05 with a rate of −1.1 to −2.2 mm/year.

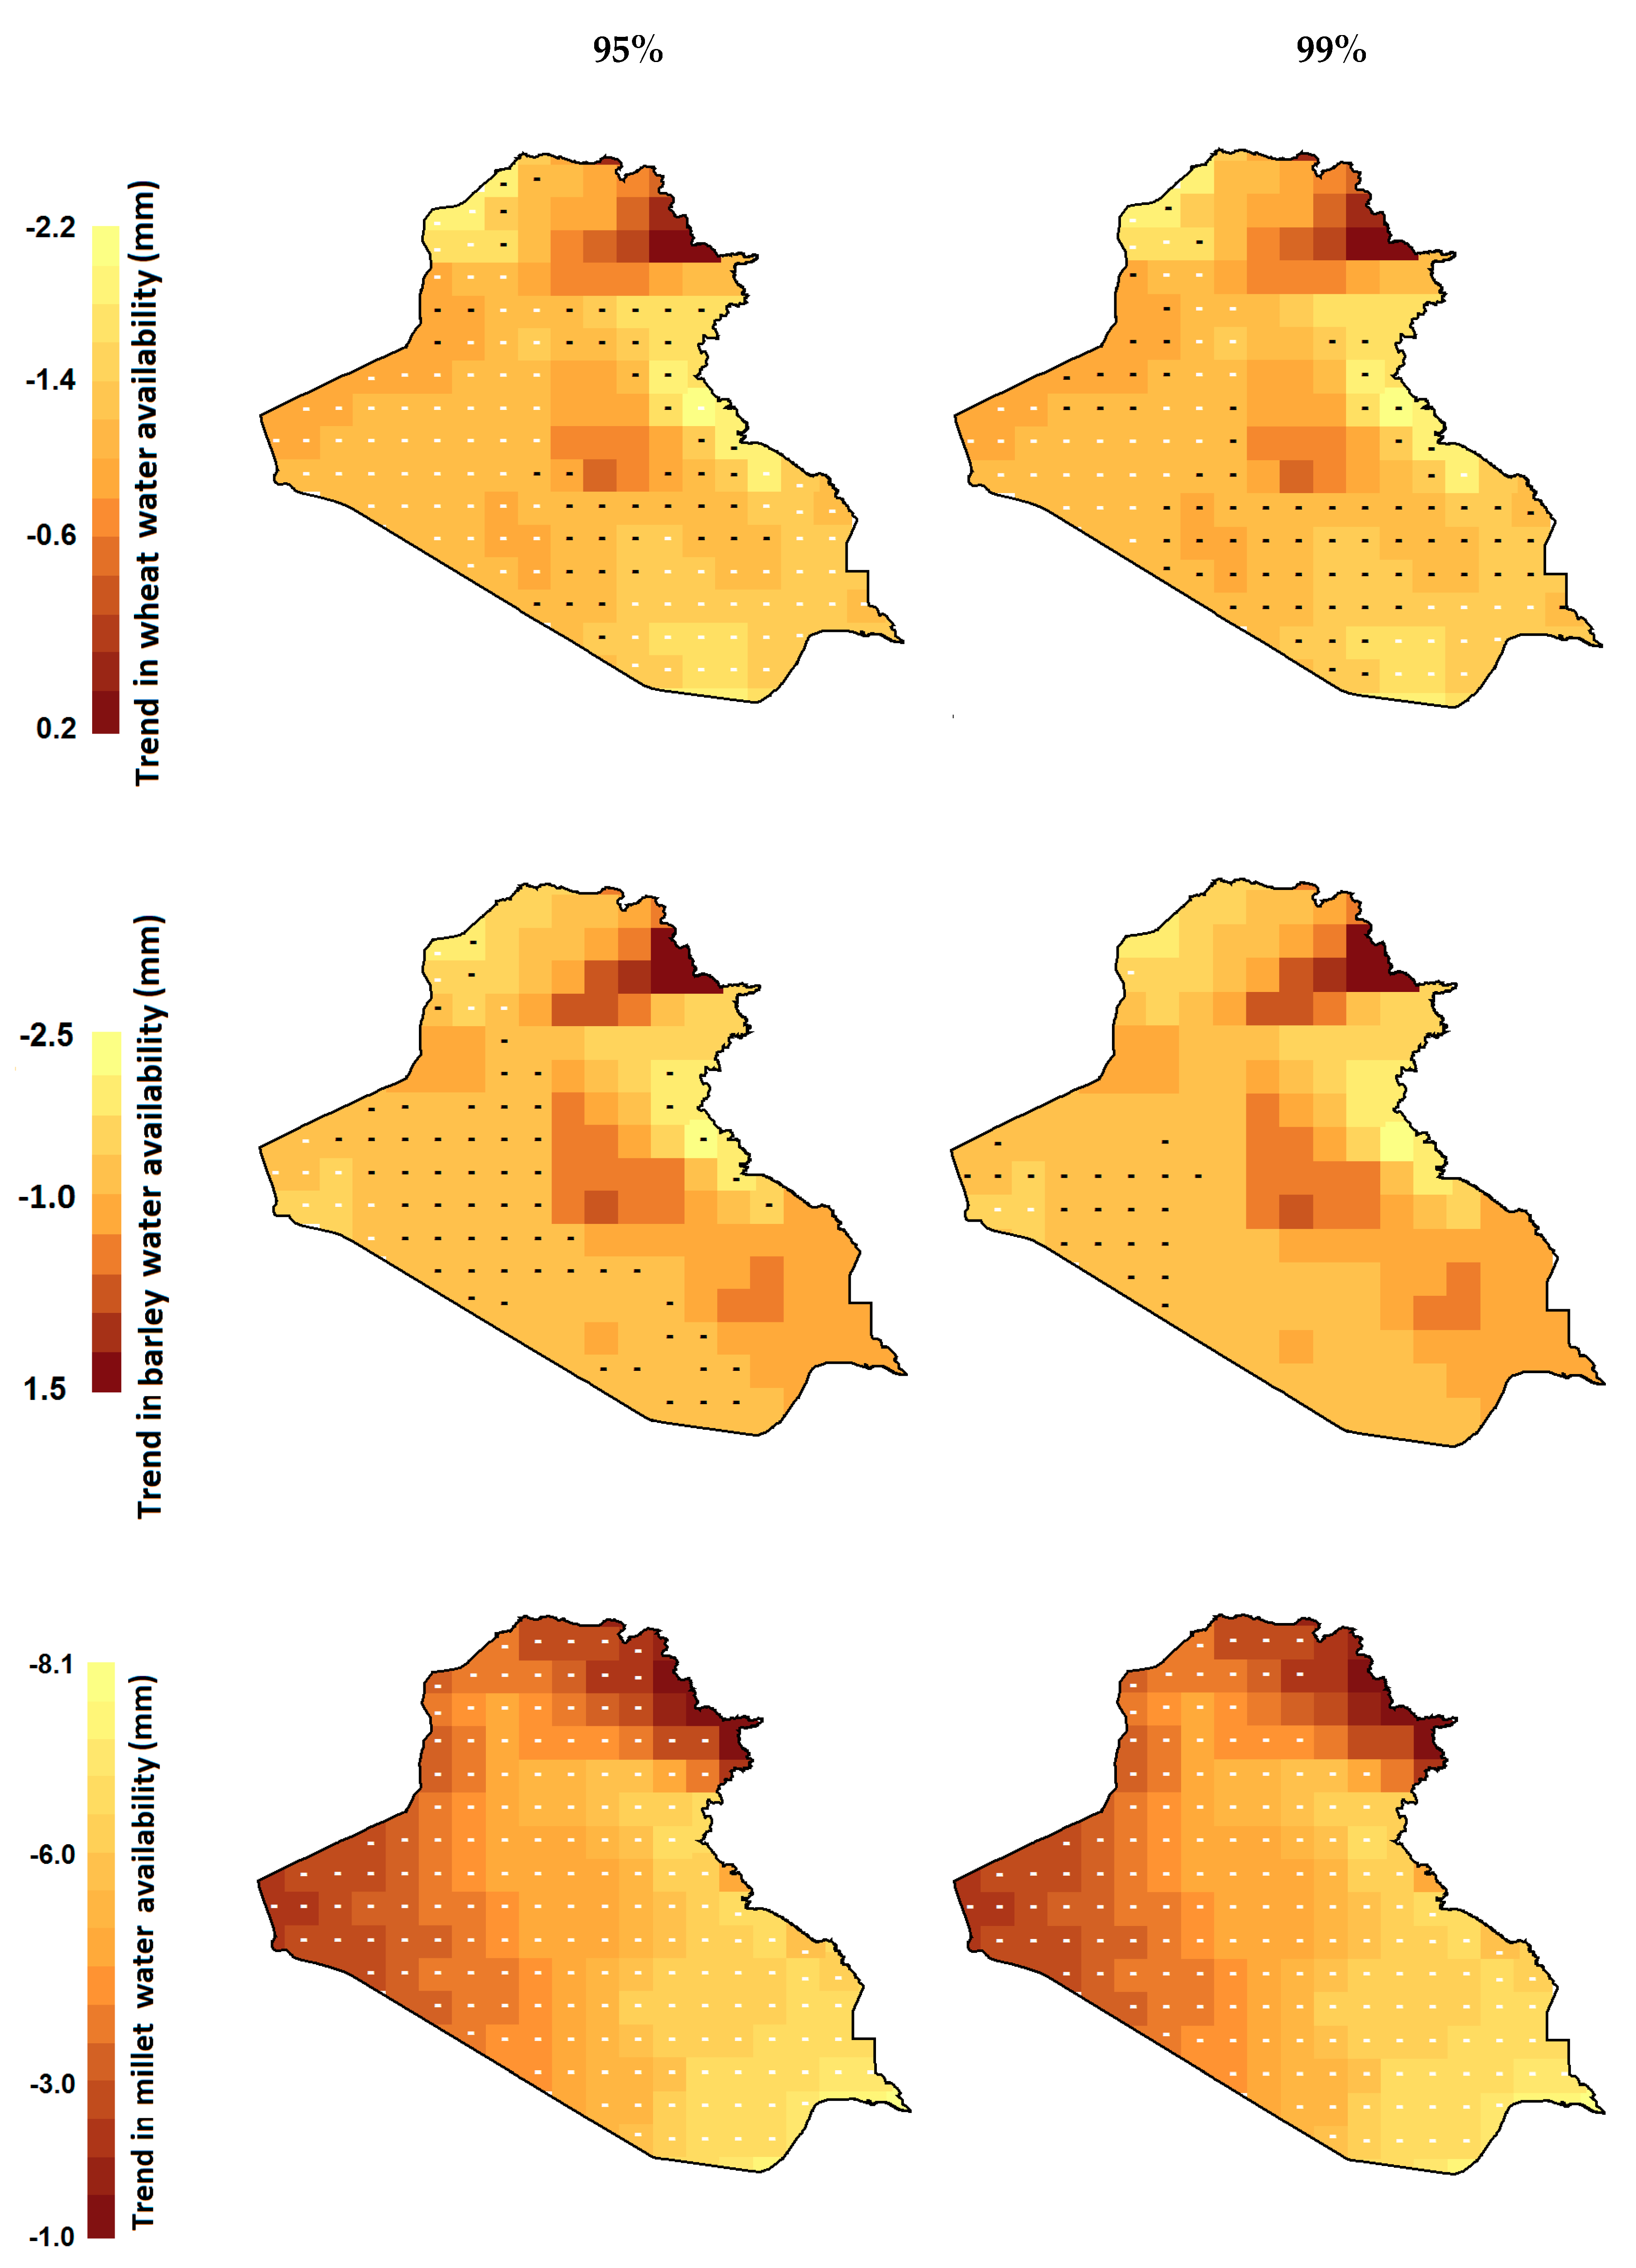
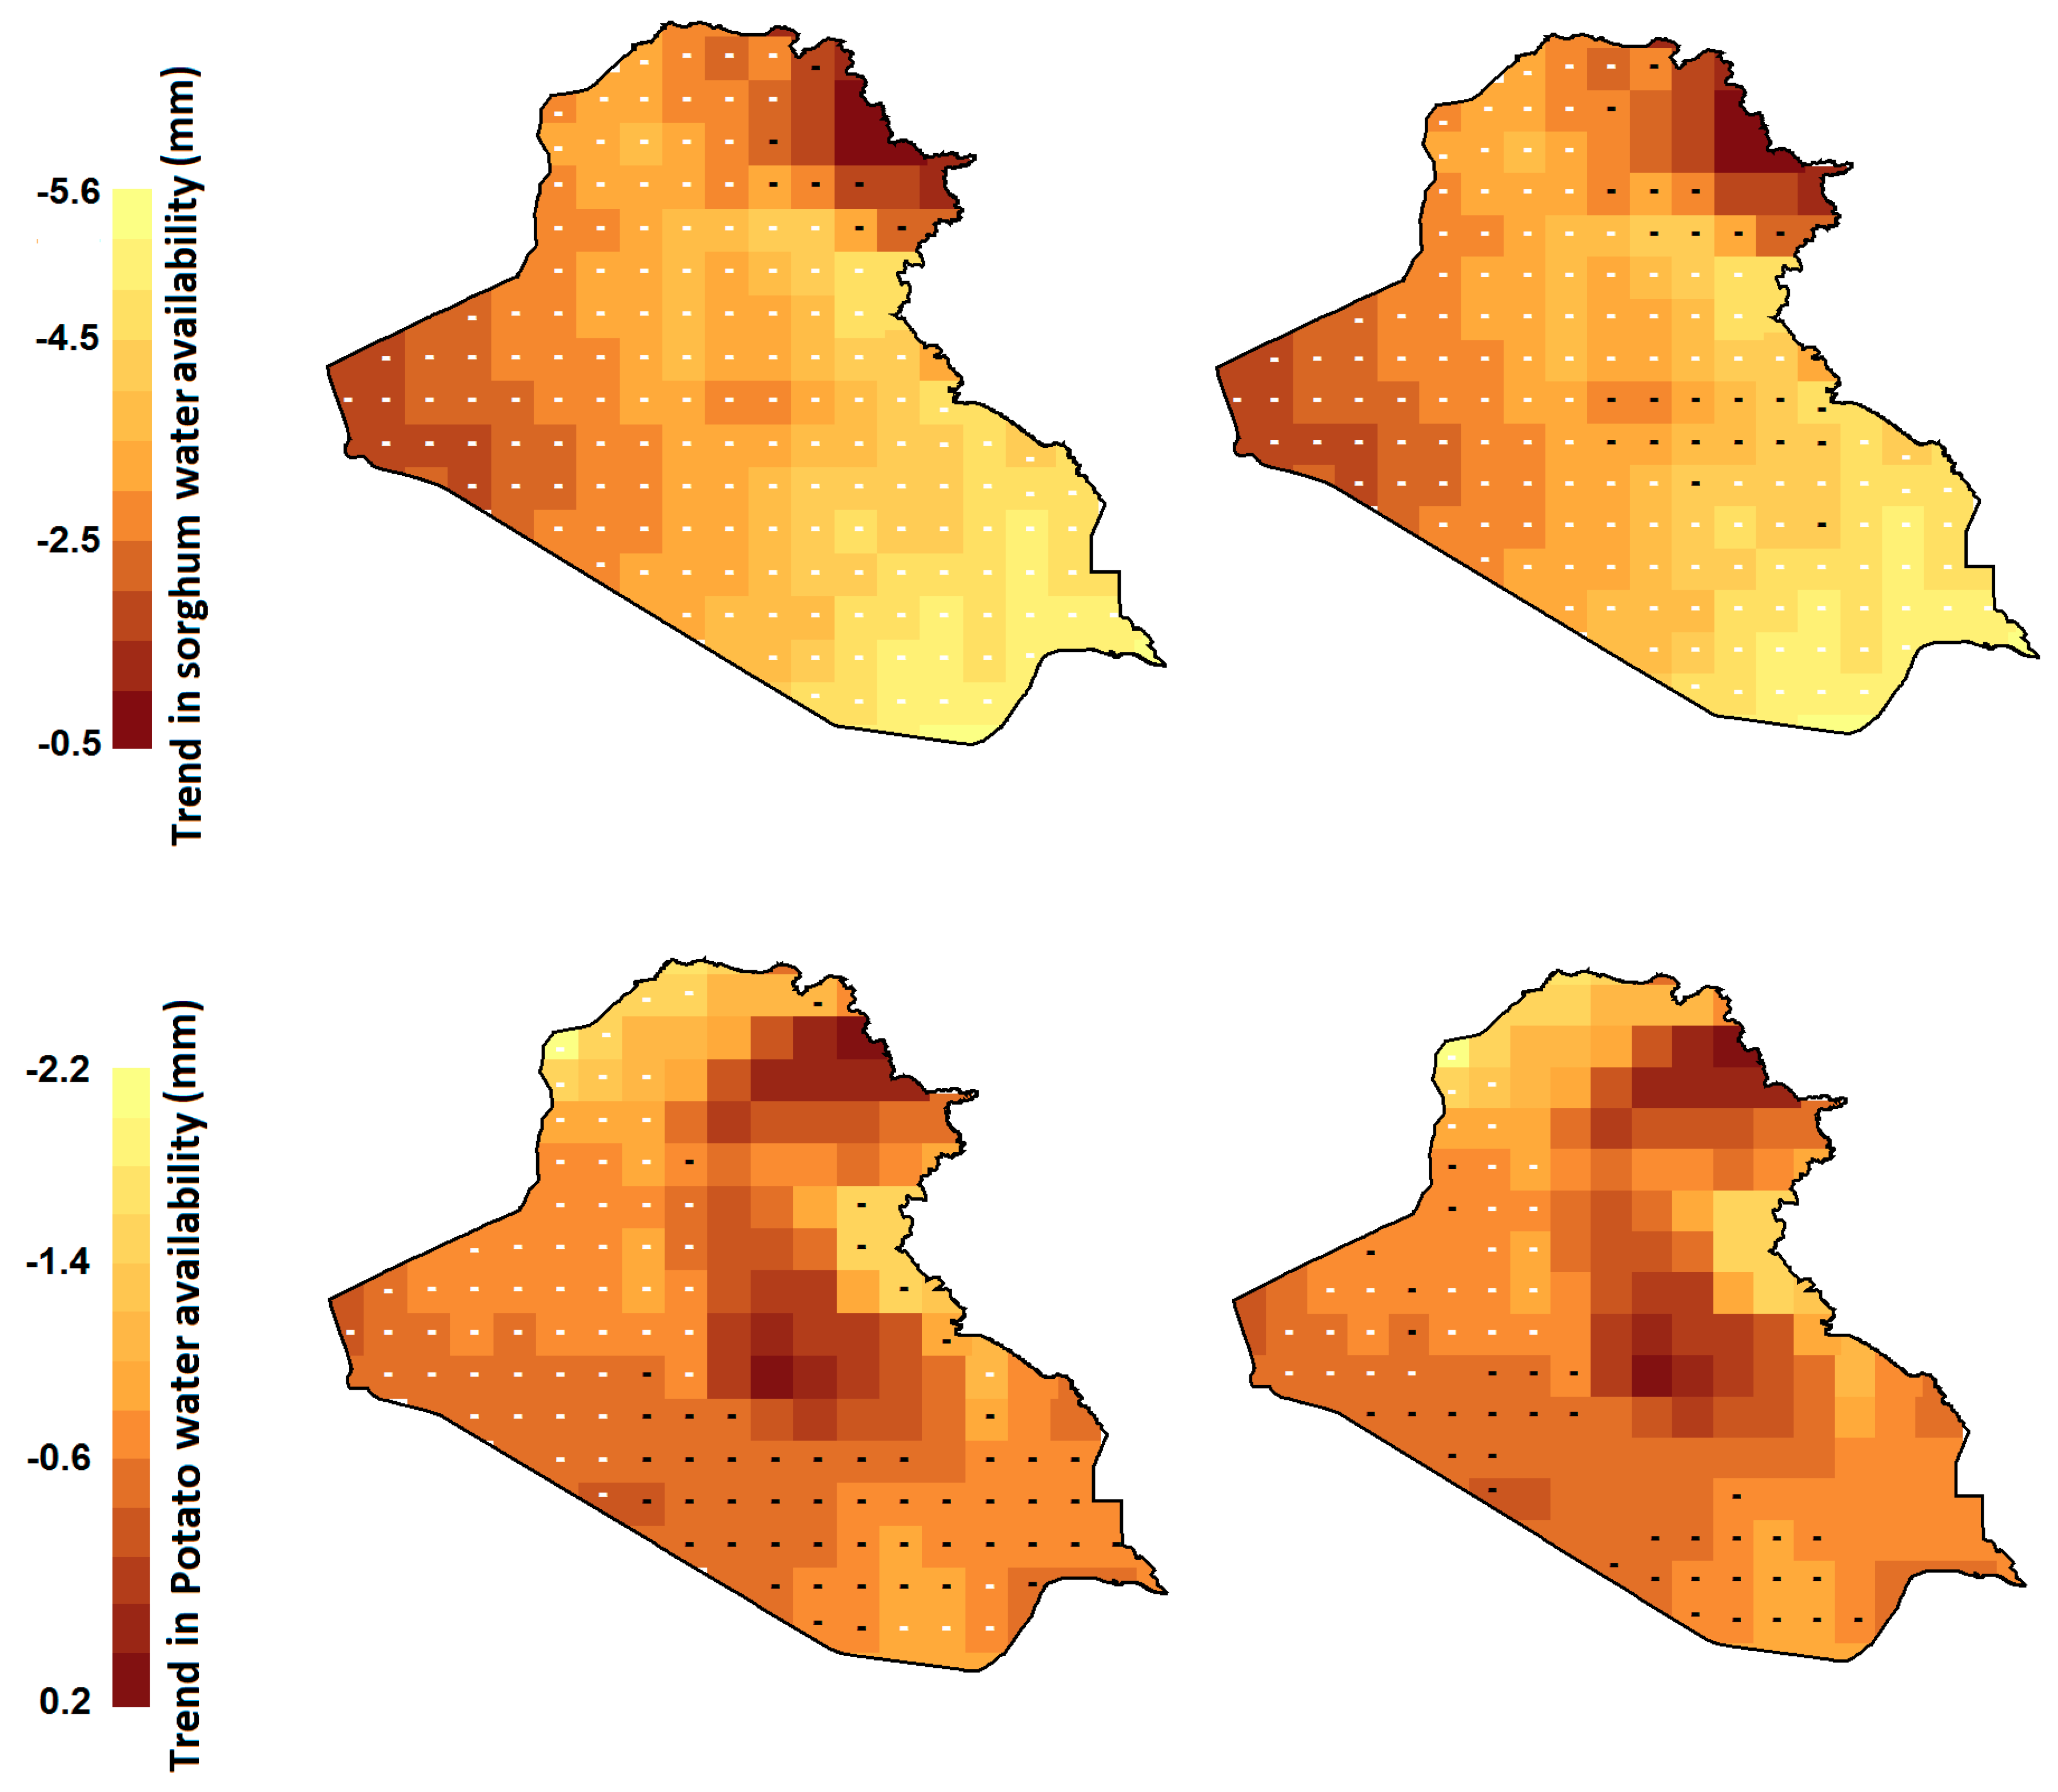
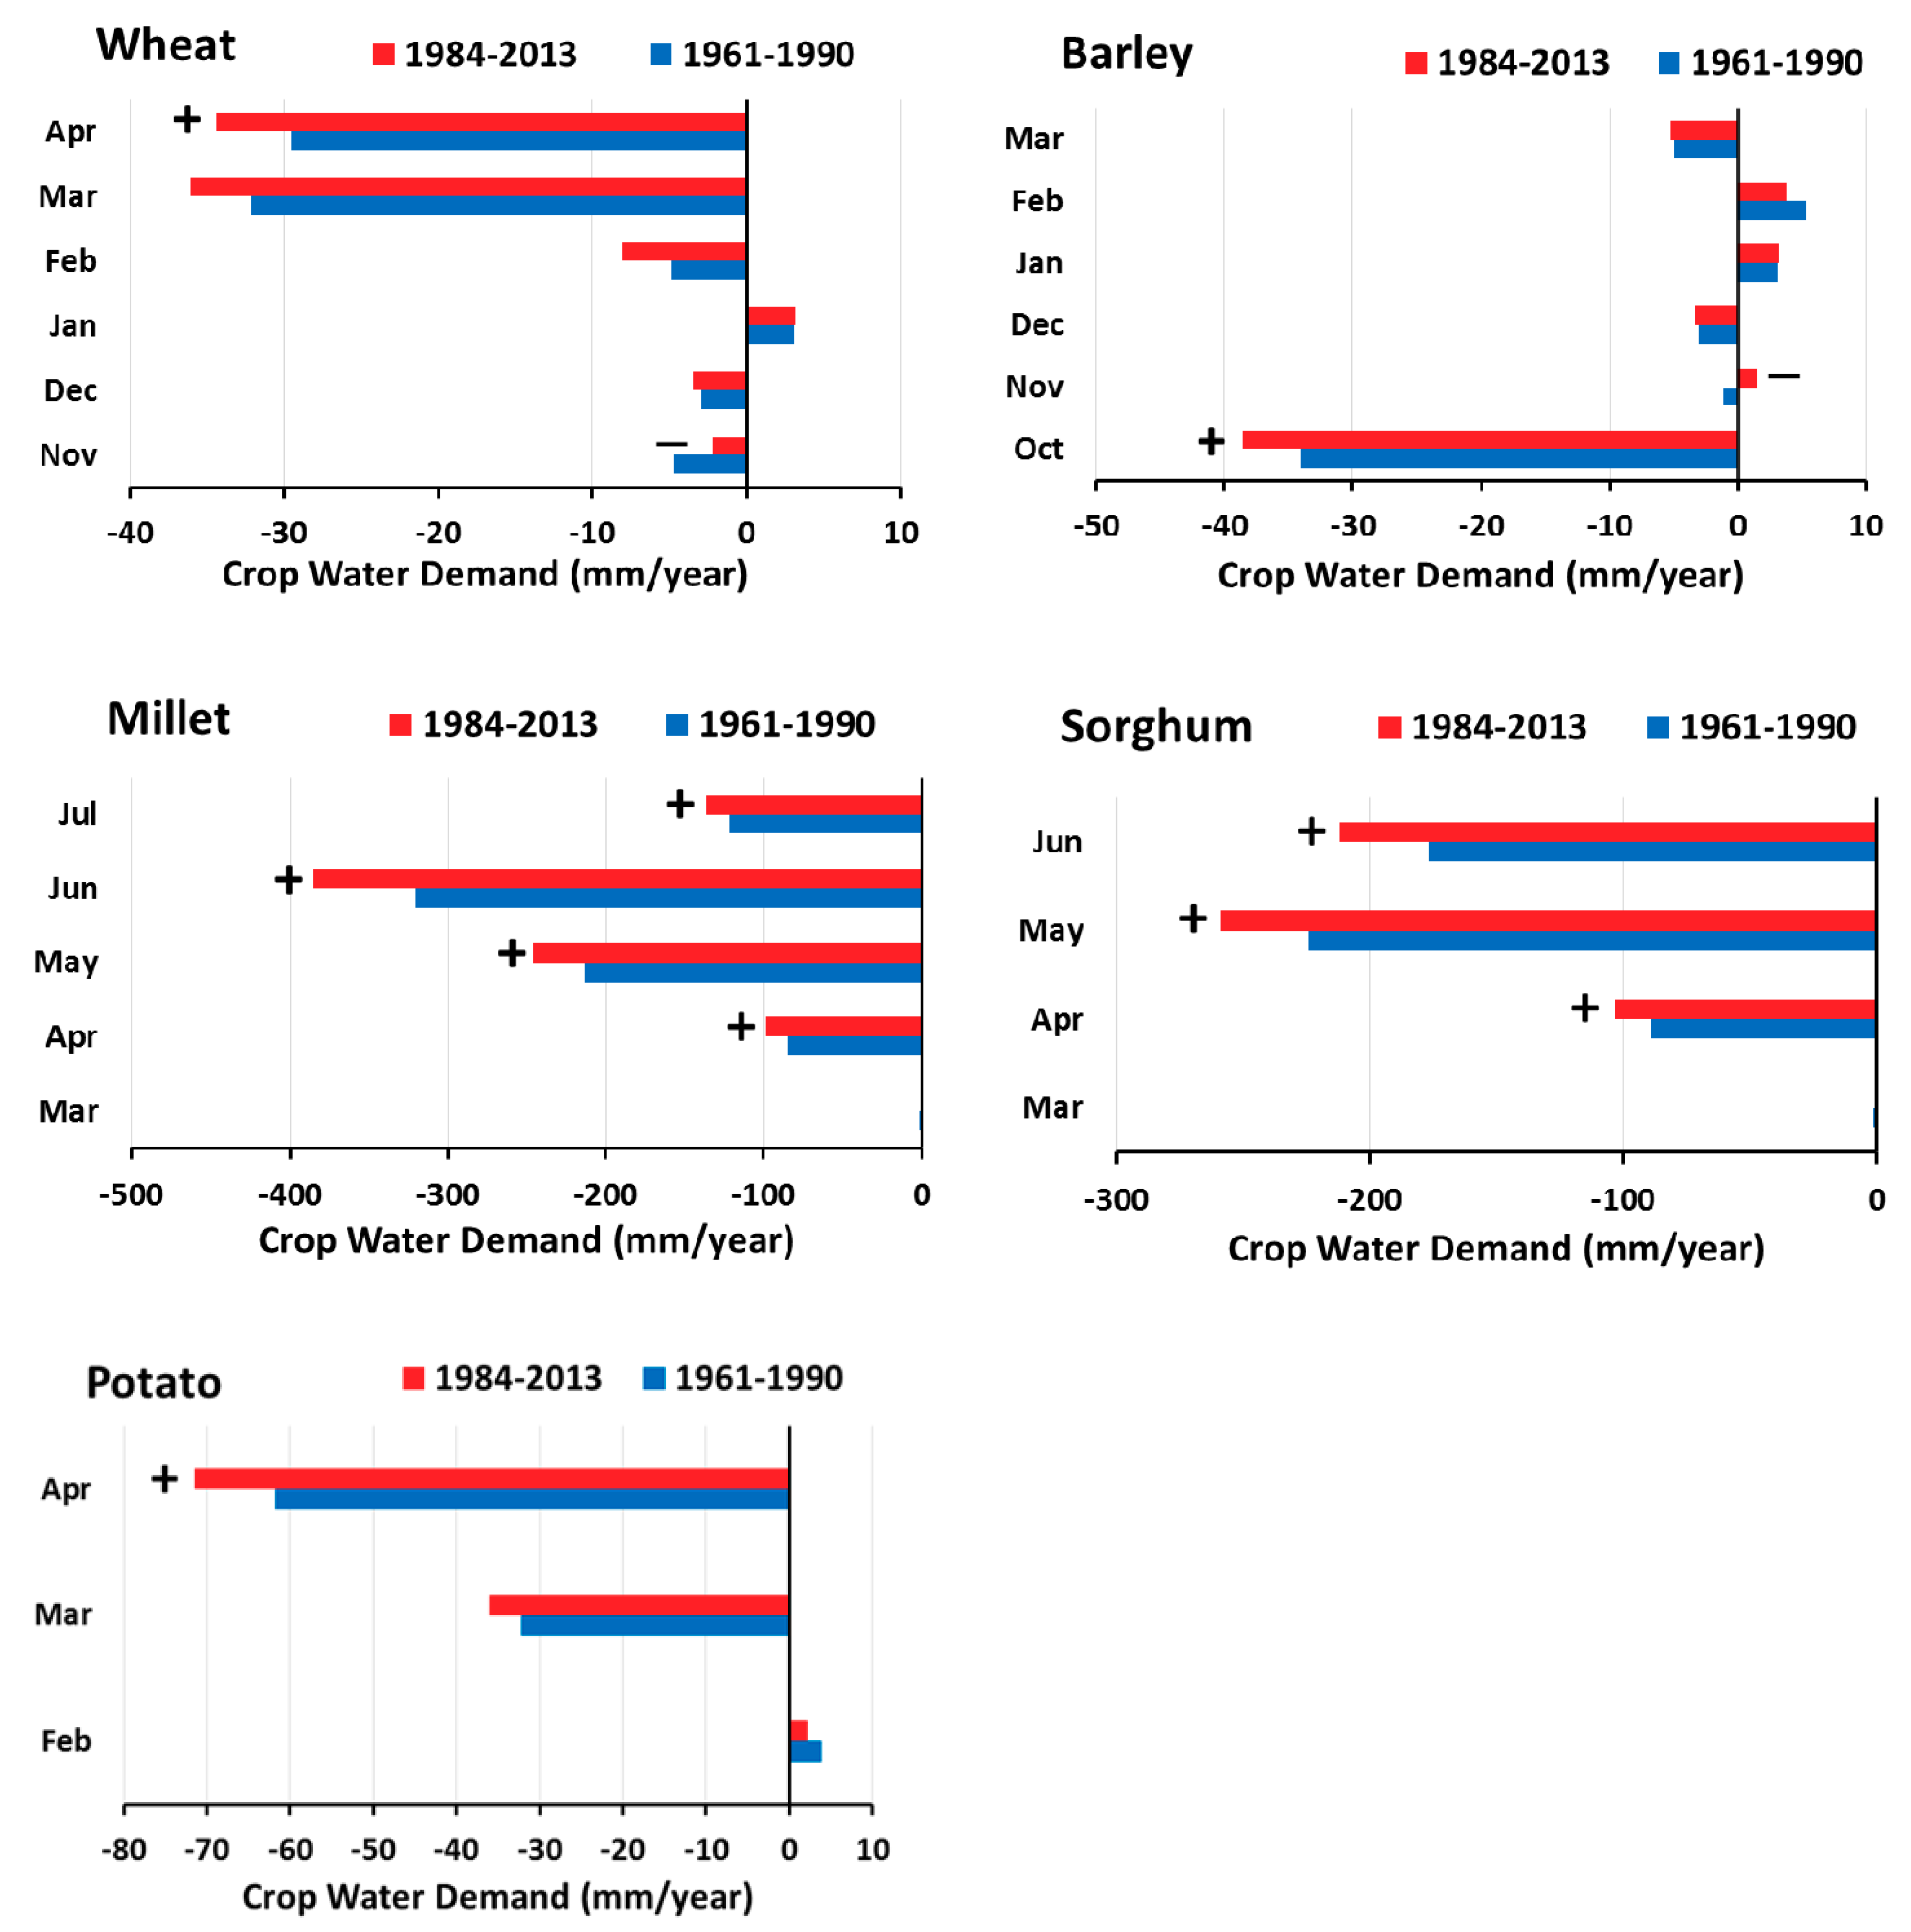
4.4. Crops Water Demand in the Irrigation Area

The changes in CWD for two periods, early 1961–1990 and late 1984–2013 were evaluated using the Wilcoxon rank test. Obtained results for different crops are shown in Figure 8. Significant increases or decreases are shown with + and − symbols, respectively. Figure 8 shows a significant increase in CWD in the late period compared to the early period for sorghum and millet at α = 0.05. The water requirement was also found to increase for all the other crops except wheat. The CWD for wheat was found to decrease in November. The decreases in rainfall and increases in temperature have caused an increase in CWD for most crops of Iraq. The highest increase in CWD was found in April, October, June, June and April for wheat, barley, millet, sorghum and potato, respectively.

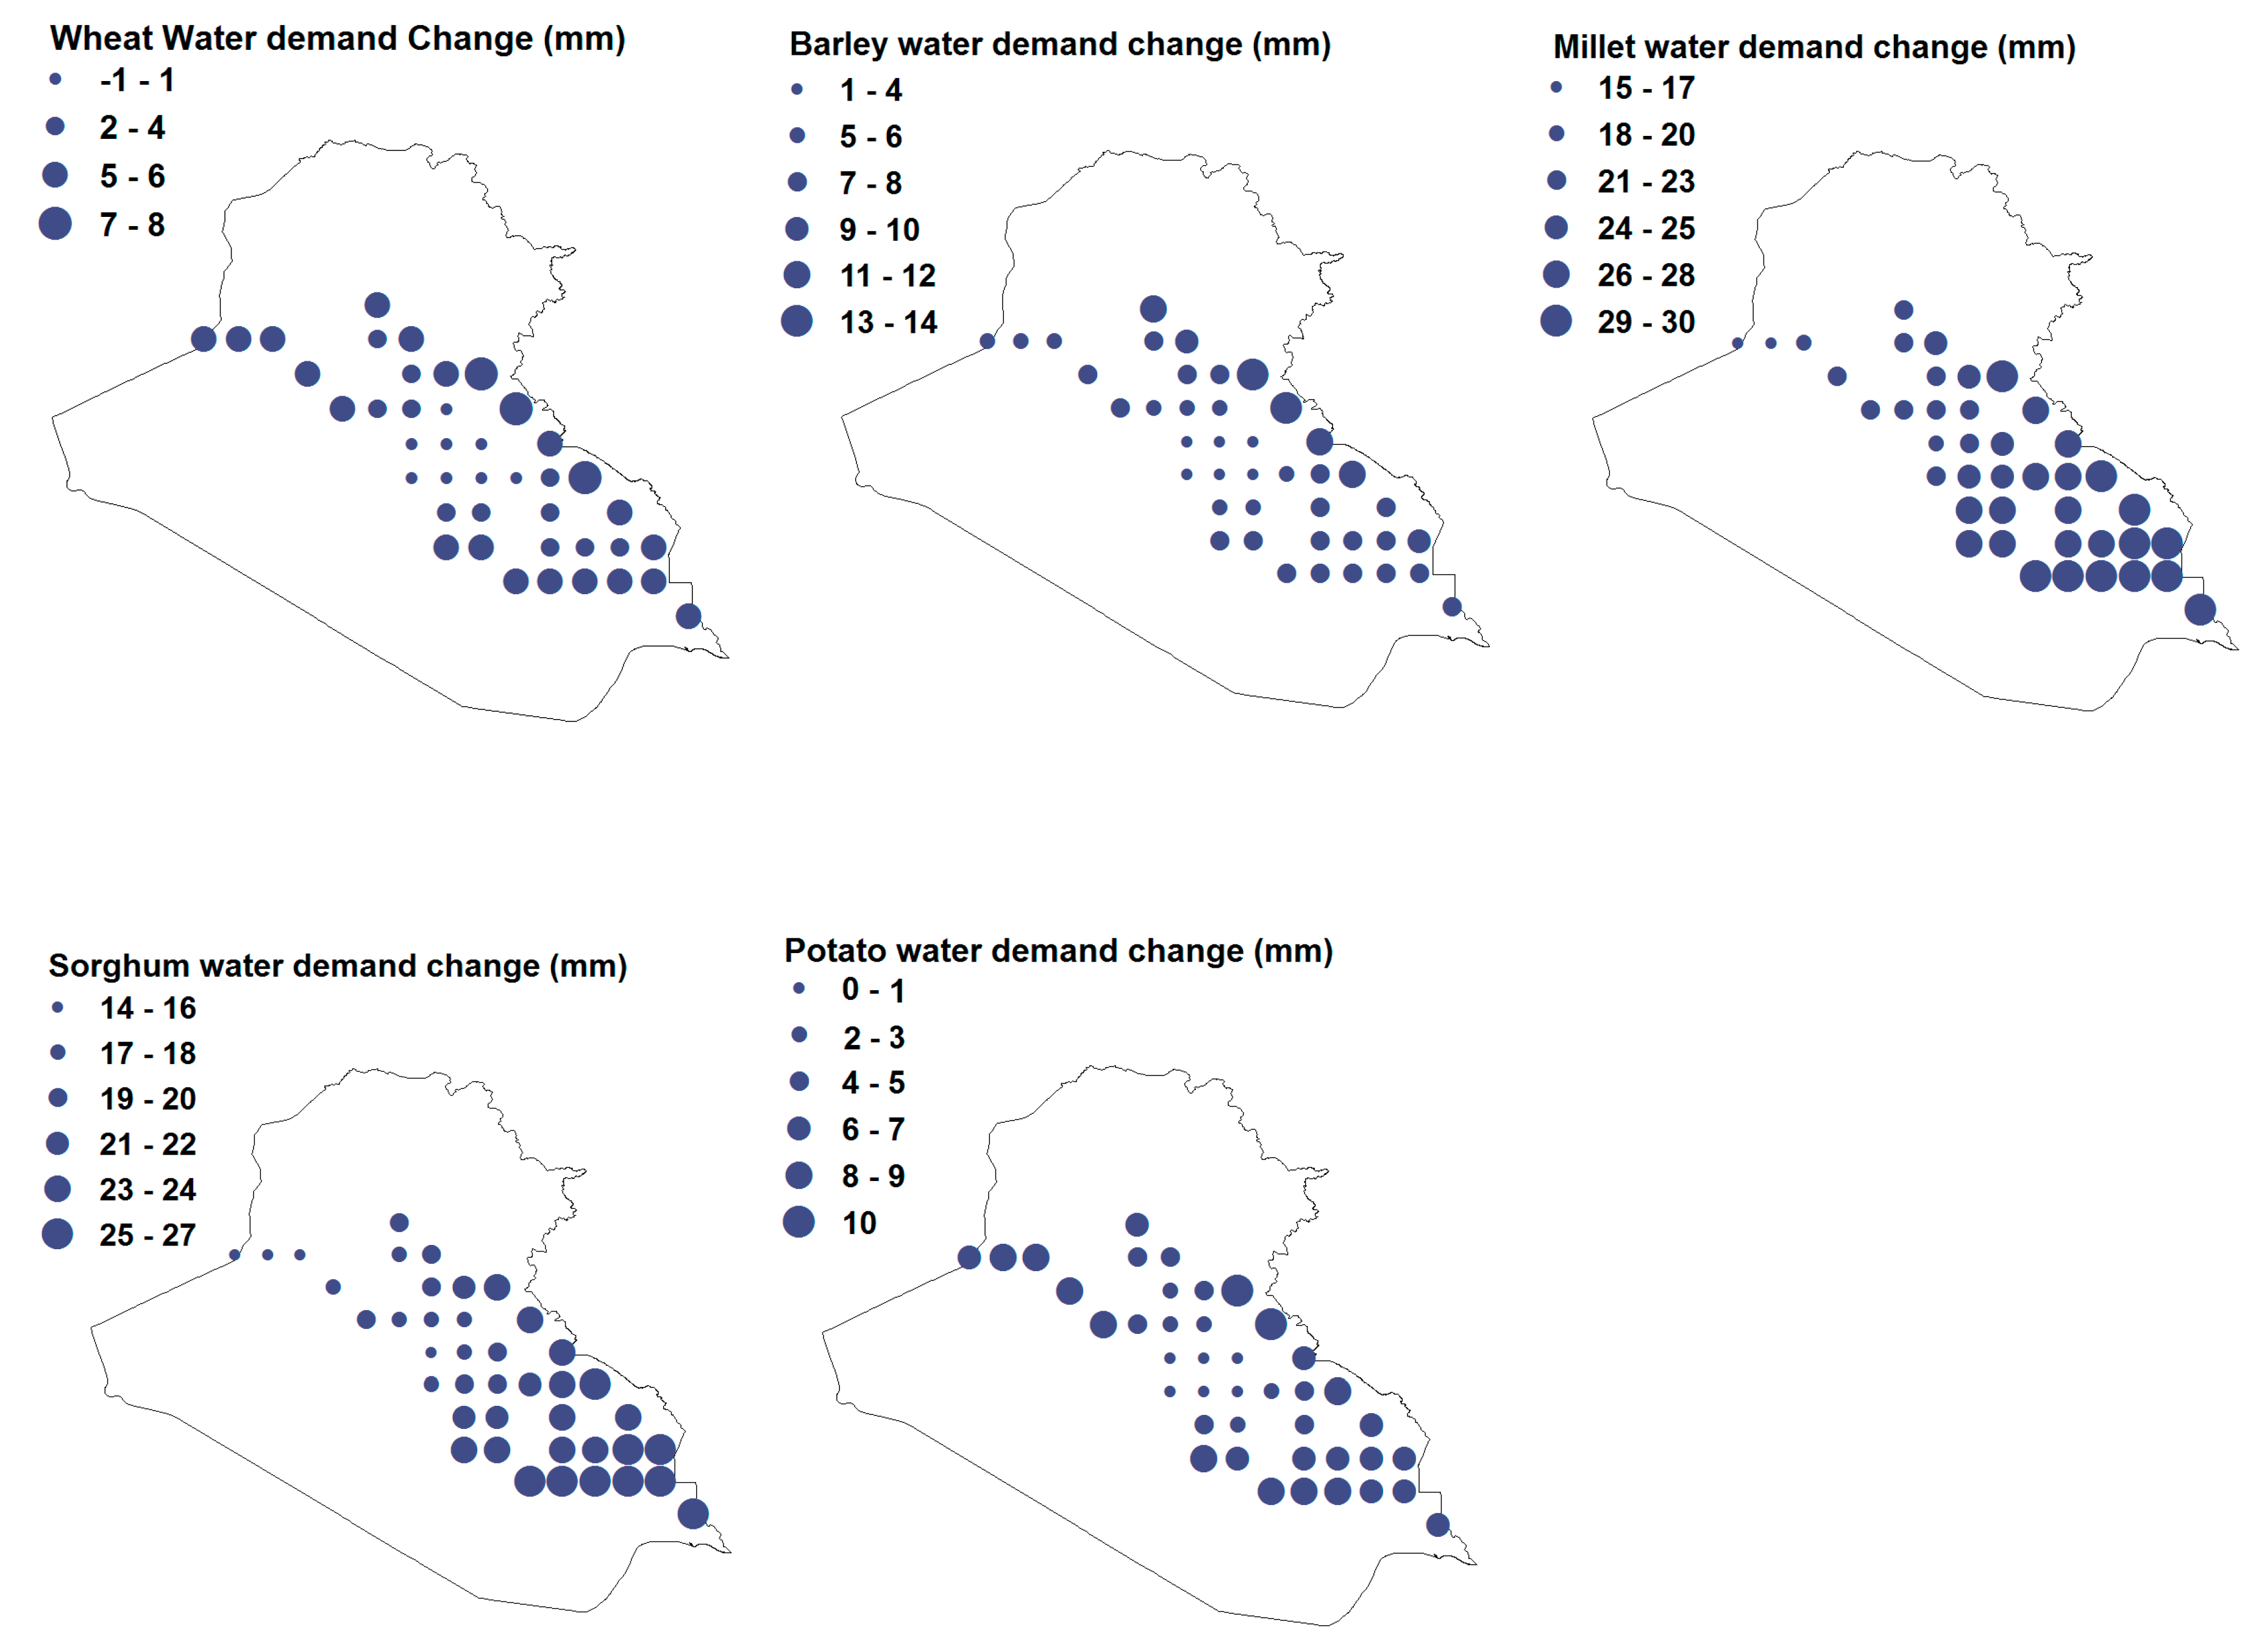
4.5. Spatial Distribution of the Changes in CWD.

The changes in CWD at different grid points in the agriculture region of Iraq between two periods 1961–1990 and 1984–2013 are presented in Figure 9 to show the spatial pattern in the changes of CWD. The size of the circle in the figure indicates the amount of changes in CWD.
Figure 9 shows an increase in CWD for the late period by 1.0–8.0, 1.0–14.0, 15.0–30.0, 14.0–27.0 and 0.0–10.0 mm for wheat, barley, millet, sorghum and potato, respectively. However, a slight decrease in CWD by 1 mm was observed for wheat at a few grids located in the middle of Iraq. Figure 9 also reveals the increase in CWD in the south and the east is more compared to other irrigated regions. The results indicate a higher increase in CWD in the area across the Tigress River compared to that across the Euphrates River.

5. Discussion

The spatial distribution and trends in CWA for different climatic and crop growing seasons for the period 1961–2013 were assessed in this study. The changes in CWD for the major crops in the irrigated regions were also assessed to provide an understanding of how the irrigation requirements for different crops have changed over time.
The results showed declination in annual and seasonal CWA in most parts of Iraq. The obtained results collaborate with the results of earlier studies on the impact of climate change on agriculture water demand in an arid environment. Shen et al. [56] assessed the spatiotemporal variability of irrigation need for five major crops in the arid Northwest part of China. They reported an increase in irrigation need over the past two decades with the highest increase in July and August. The comparison of irrigation need with water availability showed April and May as the most crucial period for ensuring water supply. Ragab and Prudhomme reported an increase in CWD due to a decrease in rainfall by 20–25% in the arid region of the Middle East [57].
Chowdhury et al. [58] investigated climate change impacts on crop water needs in north Saudi Arabia, bordering southwest of Iraq and reported that 1 °C temperature rise may cause an increase in crop water requirement by 2.9%. They also indicated the lesser impact of rainfall compared to temperature on CWD. This also concurs with the results of the present study. The temperature of Iraq is increasing at a higher rate compared to other parts of the globe [43], while the rainfall is reported to change very less [9]. Therefore, a large decrease in CWA and an increase in CWD in Iraq are due to a large increase in temperature.
Climate models projected a continuous rise in temperature in Iraq which would cause a further decrease in CWA and increase in CWD. Azad et al. [13] used Soil and Water Assessment Tool (SWAT) to show the effect of climate change on winter wheat crop in the north of Iran, bordering northeast of Iraq and reported a rise in temperature and reference evapotranspiration in the middle of the last century which would cause an increase in water scarcity. Zamani et al. [12] assessed climate change implications on CWD in the southwest of Iran and reported a large increase in CWD for all scenarios. Sun et al. [59] estimated a decreasing trend in CWD for the main crops (apple, jujube, maize, potato, and soybean) in the arid Loess Plateau of China for different climate change scenarios. The results presented in this study can be utilized for the mitigation of climate change implications in Iraq.
There exists a clear nexus between water and energy in irrigated agriculture [60,61]. An increase in irrigation demand causes an increase in energy needs for irrigation, which in turn can cause an increase in irrigation cost and reduction in farmer’s profit from agriculture. Therefore, increasing CWD can have a significant impact on the livelihood of the large population depending on agriculture in Iraq. Particularly, poor and marginalized farmers will be the most affected if proper adaptation measures are not taken. The higher use of energy for irrigation also increases the carbon emission from agriculture and contribute to global warming [60].
The climate of Iraq is changing rapidly which is also projected to continue due to global warming. A fast rise in temperature and declination of precipitation in most of Iraq has been projected by the majority of climate models under all the climate change scenarios [62]. This indicates that CWA will continue to decrease and CWD will increase over the present century. Continuous increases in CWD and decreases in CWA would cause a gradual increase in water scarcity in agriculture in Iraq. Crop productivity is directly related to the availability of water for irrigation. Therefore, increasing water stress may severely affect crop productivity and food security in Iraq, if appropriate adaptation measures are not taken. A vast population of Iraq depends on agriculture for livelihood. Reduction of crop productivity would certainly affect the economic benefits and livelihood of the population dependent on agriculture. The decreasing precipitation and increasing PET would also cause an increase in aridity in Iraq. Similar trends in Iran were found to cause a shift in arid lands [63]. The shifting of aridity in the cultivated land of Iraq may cause land degradation and reduction of land fertility which in turn may also reduce crop productivity and food security of the country.
Iraq should consider improvements in irrigation practices, advantages of technological development, and changes in the cropping pattern to increase crop water productivity to mitigate the impacts of climate change in water and agriculture. The seasonal precipitation pattern in Iraq is changing due to climate change. The schedule of different crops can be adjusted according to the changes in seasonal precipitation pattern to take advantage of precipitation increase in some months. High water-consuming crops can be replaced with relatively less water-consuming varieties and the advanced irrigation technologies can be used to reduce irrigation needs. Moreover, awareness should be grown among the farmers of looming water scarcity and encourage them to adopt different traditional practices to conserve soil moisture for the reduction of irrigation demand.
Gauge-based gridded precipitation and temperature data of GPCC and CRU, respectively, were used in this study for the assessment of CWD. Though GPCC precipitation and CRU temperature were found to replicate observed precipitation and temperature in Iraq reliably [35], significant uncertainties are still associated with gridded climate data [64,65]. In future, other gridded precipitation and temperature data can be used to assess the uncertainties in CWA and CWD due to gridded climate data. The Thornthwaite method was used for the estimation of PET for the assessment of CWA due to the unavailability of data of different meteorological variables required for other PET methods. However, the Thornthwaite method overestimates PET in a predominantly semi-arid country like Iraq. Future studies can be conducted for the estimation of PET with reliable methods like Penman-Monteith and Hargreaves when other meteorological data are available. The crop calendar was approximated to a monthly scale for the assessment of the changes in CWD and CWA in Iraq. For example, cultivation of some crops like Millet and Sorghum starts in the middle of a month which was approximated to start at the beginning of the month for estimation of CWD using monthly climate data. In future, daily precipitation and temperature data can be used for a more reliable estimation of CWD.

6. Conclusions

The present study was conducted to assess the changes in climatic water availability and irrigation needs in Iraq for the period 1961 – 2013 using GPCC precipitation and CRU temperature data. Obtained result showed sufficient CWA for rain-fed agriculture in the mountainous region in the north of Iraq for all the seasons except the dry summer season. In contrast, a deficit in CWA was noticed in the southwest for all the seasons even in wet winter. Trends in CWA and CWD in Iraq revealed a significant decrease in annual and spring in the west and the south. In winter, it was found to decrease in a small region in the east. CWA revealed a significant decrease during summer crop growing seasons (millet and sorghum) over the entire of Iraq while a decrease in the west and the southeast during winter crop (wheat, barley and Potato) growing seasons was also revealed. The average CWD of the major crops of Iraq showed a significant increase in summer crops water requirement in April, May, June and July between 1961–1990 and 1984–2013. For winter crop, the CWD was found to increase in October and April, decrease in November and to show no significant change in other months. The spatial distribution of CWD in irrigation areas showed an increase in irrigation requirements in recent years compared to past years. The increase was found to be higher for summer crops than the winter crops. It was also observed that CWD in irrigation area along the Tigris River increased more compared to that along the Euphrates River. The highest increase in CWD was found for the summer crops in the south of the Euphrates River. The results revealed a significant negative impact of climate change on climatic water balance and agriculture water requirements in Iraq. This emphasizes the need for new strategies for sustainable water resources management for the mitigation of the implications of climate change in Iraq.

Author Contributions

Conceptualization, S.A.S., S.S., N.A.-A. and Z.M.Y.; Formal analysis, S.A.S., S.S., H.A.A., M.S.S., N.A.-A. and Z.M.Y.; Investigation, S.S., H.A.A., M.S.S. and Z.M.Y.; Methodology, S.A.S. and M.S.S.; Project administration, Z.M.Y.; Software, S.A.S.; Supervision, S.S. and N.A.-A.; Validation, S.A.S., S.S. and H.A.A.; Visualization, S.A.S., H.A.A., M.S.S., N.A.-A. and Z.M.Y.; Writing—original draft, S.A.S., S.S., H.A.A., M.S.S., N.A.-A. and Z.M.Y.; Writing—review and editing, S.A.S., S.S., H.A.A., M.S.S., N.A.-A. and Z.M.Y. All authors have read and agreed to the published version of the manuscript.

Funding

This research received no external funding.

Conflicts of Interest

The authors declare no conflict of interest.

References

  1. Woznicki, S.A.; Nejadhashemi, A.P.; Parsinejad, M. Climate change and irrigation demand: Uncertainty and adaptation. J. Hydrol. Reg. Stud. 2015. [Google Scholar] [CrossRef]
  2. Zhou, Y.; Zwahlen, F.; Wang, Y.; Li, Y. Impact of climate change on irrigation requirements in terms of groundwater resources. Hydrogeol. J. 2010. [Google Scholar] [CrossRef]
  3. Wang, X.J.; Zhang, J.Y.; Ali, M.; Shahid, S.; He, R.M.; Xia, X.H.; Jiang, Z. Impact of climate change on regional irrigation water demand in Baojixia irrigation district of China. Mitig. Adapt. Strateg. Glob. Chang. 2016. [Google Scholar] [CrossRef]
  4. Ahmed, K.; Shahid, S.; bin Harun, S.; Wang, X.J. Characterization of seasonal droughts in Balochistan Province, Pakistan. Stoch. Environ. Res. Risk Assess. 2016, 30, 747–762. [Google Scholar] [CrossRef]
  5. Lessel, J.; Sweeney, A.; Ceccato, P. An agricultural drought severity index using quasi-climatological anomalies of remotely sensed data. Int. J. Remote Sens. 2016. [Google Scholar] [CrossRef]
  6. Lazzara, P.; Rana, G. The crop coefficient (Kc) values of the major crops grown under Mediterranean climate. Ital. J. Agrometeorol. 2010. [Google Scholar] [CrossRef]
  7. Salman, S.A.; Shahid, S.; Ismail, T.; Ahmed, K.; Chung, E.-S.; Wang, X.-J. Characteristics of Annual and Seasonal Trends of Rainfall and Temperature in Iraq. Asia Pac. J. Atmos. Sci. 2019, 55, 429–438. [Google Scholar] [CrossRef]
  8. Salman, S.A.; Shahid, S.; Ismail, T.; Rahman, N.B.A.; Wang, X.; Chung, E.S. Unidirectional trends in daily rainfall extremes of Iraq. Theor. Appl. Climatol. 2018. [Google Scholar] [CrossRef]
  9. Salman, S.A.; Shahid, S.; Ismail, T.; Chung, E.-S.; Al-Abadi, A.M. Long-term trends in daily temperature extremes in Iraq. Atmos. Res. 2017. [Google Scholar] [CrossRef]
  10. Barros, V.; Stocker, T.F.; Qin, D.; Dokken, D.J.; Ebi, K.L.; Mastrandrea, M.D.; Mach, K.J.; Allen, S.K.; Tignor, M. IPCC, 2012-Glossary of Terms. Manag. Risks Extrem. Events Disasters Adv. Clim. Chang. Adapt. 2012. [Google Scholar] [CrossRef]
  11. Al-Najar, H.; Ashour, E.K. The impact of climate change and soil salinity in irrigation water demand on the Gaza Strip. J. Water Clim. Chang. 2013. [Google Scholar] [CrossRef]
  12. Zamani, R.; Akhond-Ali, A.M.; Roozbahani, A.; Fattahi, R. Risk assessment of agricultural water requirement based on a multi-model ensemble framework, southwest of Iran. Theor. Appl. Climatol. 2017. [Google Scholar] [CrossRef]
  13. Azad, N.; Behmanesh, J.; Rezaverdinejad, V.; Tayfeh, H. Climate change impacts modeling on winter wheat yield under full and deficit irrigation in Myandoab- Iran. Arch. Agron. Soil Sci. 2018, 64, 731–746. [Google Scholar] [CrossRef]
  14. Brouziyne, Y.; Abouabdillah, A.; Hirich, A.; Bouabid, R.; Zaaboul, R.; Benaabidate, L. Modeling sustainable adaptation strategies toward a climate-smart agriculture in a Mediterranean watershed under projected climate change scenarios. Agric. Syst. 2018. [Google Scholar] [CrossRef]
  15. De Silva, C.S.; Weatherhead, E.K.; Knox, J.W.; Rodriguez-Diaz, J.A. Predicting the impacts of climate change-A case study of paddy irrigation water requirements in Sri Lanka. Agric. Water Manag. 2007. [Google Scholar] [CrossRef]
  16. Fischer, G.; Tubiello, F.N.; van Velthuizen, H.; Wiberg, D.A. Climate change impacts on irrigation water requirements: Effects of mitigation, 1990–2080. Technol. Forecast. Soc. Chang. 2007. [Google Scholar] [CrossRef] [Green Version]
  17. Shahid, S. Impact of climate change on irrigation water demand of dry season Boro rice in northwest Bangladesh. Clim. Chang. 2011. [Google Scholar] [CrossRef]
  18. Wada, Y.; Wisser, D.; Eisner, S.; Flörke, M.; Gerten, D.; Haddeland, I.; Hanasaki, N.; Masaki, Y.; Portmann, F.T.; Stacke, T.; et al. Multimodel projections and uncertainties of irrigation water demand under climate change. Geophys. Res. Lett. 2013. [Google Scholar] [CrossRef] [Green Version]
  19. Wang, X.-J.; Zhang, J.-Y.; Shahid, S.; Guan, E.-H.; Wu, Y.; Gao, J.; He, R.-M. Adaptation to climate change impacts on water demand. Mitig. Adapt. Strateg. Glob. Chang. 2016, 21, 81–99. [Google Scholar] [CrossRef]
  20. Zaman, M.R.; Morid, S.; Delavar, M. Evaluating climate adaptation strategies on agricultural production in the Siminehrud catchment and inflow into Lake Urmia, Iran using SWAT within an OECD framework. Agric. Syst. 2016, 147, 98–110. [Google Scholar] [CrossRef]
  21. Mann, H.B. Nonparametric Tests Against Trend. Econometrica 1945, 13, 245. [Google Scholar] [CrossRef]
  22. Affonso, R.; Zanin, A.; Brummitt, N.A. Diversity of Scleria (Cyperaceae) in Santa Catarina, Brazil. Rodriguésia 2015, 66, 353–367. [Google Scholar] [CrossRef] [Green Version]
  23. Ahmed, K.; Shahid, S.; Ali, R.O.; Bin Harun, S.; Wang, X. Evaluation of the performance of gridded precipitation products over Balochistan Province, Pakistan. Desalin. Water Treat. 2017. [Google Scholar] [CrossRef]
  24. Hamed, K.H.; Ramachandra Rao, A. A modified Mann-Kendall trend test for autocorrelated data. J. Hydrol. 1998, 204, 182–196. [Google Scholar] [CrossRef]
  25. Yue, S.; Pilon, P.; Cavadias, G. Power of the Mann–Kendall and Spearman’s rho tests for detecting monotonic trends in hydrological series. J. Hydrol. 2002, 259, 254–271. [Google Scholar] [CrossRef]
  26. Yue, S.; Wang, C. The Mann-Kendall Test Modified by Effective Sample Size to Detect Trend in Serially Correlated Hydrological Series. Water Resour. Manag. 2004, 18, 201–218. [Google Scholar] [CrossRef]
  27. Koutsoyiannis, D.; Montanari, A. Statistical analysis of hydroclimatic time series: Uncertainty and insights. Water Resour. Res. 2007, 43. [Google Scholar] [CrossRef]
  28. Salem Nashwan, M.; Shahid, S.; Wang, X. Uncertainty in estimated trends using gridded rainfall data: A case study of bangladesh. Water 2019, 11, 349. [Google Scholar] [CrossRef] [Green Version]
  29. Nashwan, M.S.; Shahid, S.; Abd Rahim, N. Unidirectional trends in annual and seasonal climate and extremes in Egypt. Theor. Appl. Climatol. 2018, 136, 457–473. [Google Scholar] [CrossRef]
  30. Khan, N.; Shahid, S.; Ismail, T.; Ahmed, K.; Nawaz, N. Trends in heat wave related indices in Pakistan. Stoch. Environ. Res. Risk Assess. 2019, 33, 287–302. [Google Scholar] [CrossRef]
  31. Khan, N.; Pour, S.H.; Shahid, S.; Ismail, T.; Ahmed, K.; Chung, E.; Nawaz, N.; Wang, X. Spatial Distribution of Secular Trends in Rainfall Indices of Peninsular Malaysia in the Presence of Long-Term Persistence. Meteorol. Appl. 2019. [Google Scholar] [CrossRef]
  32. Hamed, K.H. Trend detection in hydrologic data: The Mann-Kendall trend test under the scaling hypothesis. J. Hydrol. 2008, 349, 350–363. [Google Scholar] [CrossRef]
  33. Yaseen, Z.M.; Awadh, S.M.; Sharafati, A.; Shahid, S. Complementary data-intelligence model for river flow simulation. J. Hydrol. 2018, 567, 180–190. [Google Scholar] [CrossRef]
  34. Sulaiman, S.O.; Shiri, J.; Shiralizadeh, H.; Kisi, O.; Yaseen, Z.M. Precipitation pattern modeling using cross-station perception: Regional investigation. Environ. Earth Sci. 2018. [Google Scholar] [CrossRef]
  35. Salman, S.A.; Shahid, S.; Ismail, T.; Al-Abadi, A.M.; Wang, X.J.; Chung, E.S. Selection of gridded precipitation data for Iraq using compromise programming. Meas. J. Int. Meas. Confed. 2019. [Google Scholar] [CrossRef]
  36. Al-Ansari, N.A. Management of Water Resources in Iraq: Perspectives and Prognoses. Engineering 2013, 5, 667–684. [Google Scholar] [CrossRef] [Green Version]
  37. Sayl, K.N.; Muhammad, N.S.; Yaseen, Z.M.; El-shafie, A. Estimation the Physical Variables of Rainwater Harvesting System Using Integrated GIS-Based Remote Sensing Approach. Water Resour. Manag. 2016, 30, 3299–3313. [Google Scholar] [CrossRef]
  38. Jaradat, A. Agriculture in Iraq: Resources, potentials, constraints, research needs and priorities. Agriculture 2003, 1, 160. [Google Scholar]
  39. Khosravi, K.; Daggupati, P.; Alami, M.T.; Awadh, S.M.; Ghareb, M.I.; Panahi, M.; Pham, B.T.; Rezaie, F.; Qi, C.; Yaseen, Z.M. Meteorological data mining and hybrid data-intelligence models for reference evaporation simulation: A case study in Iraq. Comput. Electron. Agric. 2019, 167, 105041. [Google Scholar] [CrossRef]
  40. Simmons, J.L. Agricultural development in Iraq: Planning and management failures. Middle East J. 1965, 19, 129–140. [Google Scholar]
  41. Becker, A.; Finger, P.; Meyer-Christoffer, A.; Rudolf, B.; Schamm, K.; Schneider, U.; Ziese, M. A description of the global land-surface precipitation data products of the Global Precipitation Climatology Centre with sample applications including centennial (trend) analysis from 1901-present. Earth Syst. Sci. Data 2013. [Google Scholar] [CrossRef] [Green Version]
  42. Harris, I.; Jones, P.D.; Osborn, T.J.; Lister, D.H. Updated high-resolution grids of monthly climatic observations - the CRU TS3.10 Dataset. Int. J. Climatol. 2014. [Google Scholar] [CrossRef] [Green Version]
  43. Mohammed, N.; Saeed, N.; Hasan, A.S. the Effect of Total Quality Management on Construction Project Performance. J. Sci. Technol. 2012, 17, 11–30. [Google Scholar]
  44. Shiru, M.S.; Shahid, S.; Chung, E.S.; Alias, N. Changing characteristics of meteorological droughts in Nigeria during 1901–2010. Atmos. Res. 2019. [Google Scholar] [CrossRef]
  45. Beguería, S.; Vicente-Serrano, S.M.; Reig, F.; Latorre, B. Standardized precipitation evapotranspiration index (SPEI) revisited: Parameter fitting, evapotranspiration models, tools, datasets and drought monitoring. Int. J. Climatol. 2014, 34, 3001–3023. [Google Scholar] [CrossRef] [Green Version]
  46. Thornthwaite, C.W. An Approach Toward a Rational Classification of Climate. Soil Sci. 1948, 66, 77. [Google Scholar] [CrossRef] [Green Version]
  47. Vicente-Serrano, S.M.; Beguería, S.; López-Moreno, J.I. A Multiscalar Drought Index Sensitive to Global Warming: The Standardized Precipitation Evapotranspiration Index. J. Clim. 2010, 23, 1696–1718. [Google Scholar] [CrossRef] [Green Version]
  48. Jensen, M. Water consumption by agricultural plants. In Water Deficits and Plant Growth: Development, Control, and Measurement; Academic Press: Cambridge, MA, USA, 1968; ISBN 0124241549. [Google Scholar]
  49. Allen, R.G.; Pereira, L.S.; Raes, D.; Smith, M. Crop Evapotranspiration: Guidelines for Computing Crop Water Requirements; FAO: Rome, Italy, 1998; p. 300. [Google Scholar]
  50. Doorenbos, J.; Pruitt, W.O. Guidelines for Predicting Crop Water Requirements; FAO: Rome, Italy, 1977. [Google Scholar]
  51. Brouwer, C.; Heibloem, M. Irrigation water management: Irrigation water needs. In Training Manual; FAO: Rome, Italy, 1986; p. 3. [Google Scholar]
  52. Sen, P.K. Estimates of the Regression Coefficient Based on Kendall’s Tau. J. Am. Stat. Assoc. 1968, 63, 1379–1389. [Google Scholar] [CrossRef]
  53. Koutsoyiannis, D.; Koutsoyiannis, D. Climate change, the Hurst phenomenon, and hydrological statistics. Hydrol. Sci. J. 2003, 48, 3–24. [Google Scholar] [CrossRef]
  54. Wilcoxon, F. Individual comparisons of grouped data by ranking methods. J. Econ. Entomol. 1946, 39, 269–270. [Google Scholar] [CrossRef]
  55. Rey, D.; Neuhäuser, M. Wilcoxon-signed-rank test. Int. Encycl. Stat. Sci. 2011, 1658–1659. [Google Scholar]
  56. Shen, Y.; Li, S.; Chen, Y.; Qi, Y.; Zhang, S. Estimation of regional irrigation water requirement and water supply risk in the arid region of Northwestern China 1989–2010. Agric. Water Manag. 2013. [Google Scholar] [CrossRef]
  57. Ragab, R.; Prudhomme, C. Climate change and water resources management in arid and semi-arid regions: Prospective and challenges for the 21st century. Biosyst. Eng. 2002, 81, 3–34. [Google Scholar] [CrossRef]
  58. Chowdhury, S.; Al-Zahrani, M.; Abbas, A. Implications of climate change on crop water requirements in arid region: An example of Al-Jouf, Saudi Arabia. J. King Saud Univ. Eng. Sci. 2016. [Google Scholar] [CrossRef] [Green Version]
  59. Sun, S.K.; Li, C.; Wu, P.T.; Zhao, X.N.; Wang, Y.B. Evaluation of agricultural water demand under future climate change scenarios in the Loess Plateau of Northern Shaanxi, China. Ecol. Indic. 2018. [Google Scholar] [CrossRef]
  60. Salem, G.S.A.; Kazama, S.; Shahid, S.; Dey, N.C. Impacts of climate change on groundwater level and irrigation cost in a groundwater dependent irrigated region. Agric. Water Manag. 2018, 208, 33–42. [Google Scholar] [CrossRef]
  61. Salem, G.S.A.; Kazama, S.; Komori, D.; Shahid, S.; Dey, N.C. Optimum Abstraction of Groundwater for Sustaining Groundwater Level and Reducing Irrigation Cost. Water Resour. Manag. 2017, 31, 1947–1959. [Google Scholar] [CrossRef]
  62. Salman, S.A.; Shahid, S.; Ismail, T.; Ahmed, K.; Wang, X.-J. Selection of climate models for projection of spatiotemporal changes in temperature of Iraq with uncertainties. Atmos. Res. 2018, 213, 509–522. [Google Scholar] [CrossRef]
  63. Pour, S.H.; Wahab, A.K.A.; Shahid, S. Spatiotemporal changes in aridity and the shift of drylands in Iran. Atmos. Res. 2020. [Google Scholar] [CrossRef]
  64. Hadi Pour, S.; Abd Wahab, A.K.; Shahid, S.; Wang, X. Spatial Pattern of the Unidirectional Trends in Thermal Bioclimatic Indicators in Iran. Sustainability 2019, 11, 2287. [Google Scholar] [CrossRef] [Green Version]
  65. Ahmed, K.; Shahid, S.; Wang, X.; Nawaz, N.; Najeebullah, K. Evaluation of gridded precipitation datasets over arid regions of Pakistan. Water 2019, 11, 210. [Google Scholar] [CrossRef] [Green Version]
Figure 1. The topography and climatic zones of Iraq according to Köppen climate classification.
Sustainability 12 03437 g001
Figure 2. Irrigated area in Iraq including global precipitation climatology center (GPCC)/climate research unit (CRU) grid points.
Sustainability 12 03437 g002
Figure 3. Calendar for the selected major crops of Iraq.
Sustainability 12 03437 g003
Figure 4. The crop coefficients of major crops of Iraq.
Sustainability 12 03437 g004aSustainability 12 03437 g004b
Figure 5. Spatial distribution of annual and seasonal climatic water availability in Iraq.
Sustainability 12 03437 g005aSustainability 12 03437 g005b
Figure 6. Spatial distribution of annual and seasonal climatic water availability trends obtained using MK and MMK trend test. The color ramp is used to show the rate of change and the black and white signs are used to show the significance of change obtained using Mann–Kendall (MK) and modified Mann–Kendall (MMK) tests, respectively. The maps in the left and right side show the significant changes at 95% and 99% confidence level, respectively.
Sustainability 12 03437 g006aSustainability 12 03437 g006bSustainability 12 03437 g006c
Figure 7. Spatial distribution of climatic water availability trends in different cropping seasons of Iraq obtained using MK and MMK trend tests. A black negative sign (+) refers to MK trend test, white negative sign refers to MMK trend test. Left 95% confidence level, right 99% level.
Sustainability 12 03437 g007aSustainability 12 03437 g007b
Figure 8. The changes in CWD for different crops between two periods, early 1961–1990 and late 1984–2013. The plus (+) and minus (-) signs are used to show significant change at a 95% significance level.
Sustainability 12 03437 g008
Figure 9. The spatial distribution of the changes in crop water demand between two periods, (1961–1990) and (1984–2013) over the irrigated region of Iraq.
Sustainability 12 03437 g009
Table 1. The periods for which crop water demand (CWD) of different crops was estimated in this study.
CropsPeriod (day)Season (months)
barley135October–March
Wheat135November–April
Millet105March–July
Sorghum125March–June
Potato125February–April

