Article

Investing in Sustainable Built Environments: The Willingness to Pay for Green Roofs and Green Walls

by
Inês Teotónio
1,
Carlos Oliveira Cruz
2,*,
Cristina Matos Silva
2 and
José Morais
3
1
CERIS, Instituto Superior Técnico, University of Lisbon, 1049-001 Lisbon, Portugal
2
CERIS, Department of Civil Engineering and Architecture and Georesources, Instituto Superior Técnico, University of Lisbon, 1049-001 Lisbon, Portugal
3
Instituto Superior Técnico, University of Lisbon, 1049-001 Lisbon, Portugal
*
Author to whom correspondence should be addressed.
Sustainability 2020, 12(8), 3210; https://doi.org/10.3390/su12083210
Submission received: 28 March 2020 / Revised: 9 April 2020 / Accepted: 13 April 2020 / Published: 16 April 2020
(This article belongs to the Section Economic and Business Aspects of Sustainability)

Abstract

:
Green infrastructure, such as green roofs/walls, plays a key role in addressing urban problems. Despite the well-established sustainable mentality, aspects such as aesthetics, recreation, and welfare are still the main drivers for undertaking such investments. Several studies have focused on proving the benefits of green infrastructure, namely, thermal insulation, air quality, and others. However, significant soft benefits have not yet been properly addressed. It is, therefore, important to understand how much citizens are willing to invest in those mitigating measures and list the aspects that influence that value. This study suggests a methodology based on stated preferences to evaluate the willingness-to-pay of owner/tenants for green roofs/walls in residential buildings and determine the influence of multiple factors. Results show that consumers reveal higher willingness-to-pay for accessible green roofs. Knowledge of benefits and the accessibility of green roofs have a great impact on the willingness-to-pay. Recreation benefit is at the forefront of individuals’ concerns; even more than aesthetics.

1. Introduction

The intense process of urbanization shows no signs of slowing or even breaking, especially with an increasing number of people moving to the cities. Demographic projections keep growing, and 67% of the world population is expected to be living in urban centers by 2050 [1]. This is heading for reduction of green spaces, resource scarcity, climate change, loss of biodiversity, flood risk, urban heat island effect, air and water pollution, among other environmental problems [2].
Green infrastructure has been recognised to tackle and lessen urban impacts. Within this framework, green roofs and green walls offer major improvements in buildings performance, e.g., less energy-consuming because of thermal insulation [3], increase in photovoltaics panels efficiency [4], and others. They also provide several ecosystem services at a city scale [5]. For example, greening the buildings’ roofs reduces the area of impervious surfaces in the cities, reducing the volume of rainwater retention [6]. Also, the vegetation absorbs pollutants and improves air quality by reducing the concentration levels of air pollutants [7]. Consequently, green roofs minimize urban drainage systems overload, decreasing the flooding risk [8]. Among other socio and environmental benefits such as habitats creation and biodiversity preservation [9], the widespread installation of green infrastructure in the urban environment reduces the outdoor noise levels and mitigates the temperature, i.e., the urban heat island effect [10].
Despite the current awareness and acceptance for environmentally friendly behaviours [11], the global acceptance of green infrastructure still faces substantial challenges and these solutions are being confined to specific countries or cities. Economic barriers are the main reasons for the small market share since installation, and maintenance costs are significantly higher than for traditional constructive systems [12,13]. To overcome this situation and prioritize socio-environmental benefits over individual economic interests, it is necessary to promote the spreading of these solutions [14]. It is important to understand society’s perception and preferences on greened solutions and their availability to invest in them [15,16,17].
Several studies examine the willingness-to-pay (WTP) for ecosystem services, such as climate change mitigation [18], reduction of the urban heat island effect [19], sustainable drainage of stormwater in cities [20], environmental benefits [21], and energy efficiency [22]. Others focus on sustainable solutions [14,23,24,25,26,27]. There are only a few studies that approach directly green infrastructure, reporting the preferences of consumers and the maximum amount that they are willing to invest to reap the potential benefits. Those studies cover different profiles of investors and their perception of different types of green roofs/walls. For example, Vanstockem et al. [28] used a discrete choice model to identify the visual characteristics of extensive green roofs (e.g., vegetation gaps, vegetation type) affecting users’ preferences and their impact on choice situations measured in terms of WTP. Tam et al. [29] conducted a questionnaire survey and interviews with the purpose of identifying the concerns of professionals, owners, and end-users when proposing green roofs. The study revealed that about 80% of the respondents are willing to invest at most 208 €/m2 to have these systems installed. The results showed that respondents value more the improvement of buildings aesthetics. Rosenzweig et al. [30] assumed in their study that residents of New York are willing to pay between 8.50 and 43 €/m2 for green roofs/walls as a building amenity. Bianchini and Hewage [31] have also included the aesthetic value of green roofs. They assumed this value in terms of property appreciation, stating that the installation of an extensive and intensive green roof would increase the property value from 2% to 5% and from 5% to 8%, respectively. Studies on green walls are still missing.
Most of the studies abovementioned, in particular Rosenzweig et al. [30] and Bianchini and Hewage [31], used WTP values based on assumptions instead of applying valuation methodologies to better support their study. Nurmi et al. [32] estimated a scenic benefit of green roofs up to 37 €/m2 in Helsinki based on the application of the spacial hedonic price theory in terms of the purchase price per square meter. They used data from 6500 apartment transactions.
In addition, the implementation of green roofs and walls is calling for accurate cost–benefit analysis. Most of the economic evaluations, however, show contrasting results (see [12,31,32,33,34,35,36]). One of the main reasons is that current approaches often disregard some social, environmental, and economic aspects and focus mostly on financial (see the methodology used by Cruz et al. [37]), namely, the impact on the average market value of the real estate. For that, it is also important to determine the value placed by users on soft benefits such as aesthetics.
This study aims to improve the understanding of the behavioural barriers precluding a widespread adoption of green roofs and walls. The study also approximates the parameters representing main sources of resistance in their use, influencing the amount of money that investors are willing to pay. The method applied for measuring the WTP for green roofs and walls consisted of consumer surveys asking directly about the price that consumers are willing to pay for a product. This methodology allows questionnaires with a simple structure and fast data acquisition. However, it has some flaws associated since the results may not represent the real WTP of the consumers. The methodology was applied to Portugal to consider site-specific constraints, such as purchase power, cost of living, and local real estate market.
The paper is organised as follows. First, the methodology and the data collection process are described. Section 3 presents and discusses the statistical results, as both descriptive of variables and bivariate relations between them. The paper ends with the main conclusions and limitations of the study.

2. Methodology

2.1. Survey and Sample Selection

Breidert et al. [38] proposed a classification framework of the existing methods to measure WTP. Figure 1 shows that same framework distinguishing between survey-based techniques (i.e., stated preferences) and actual/simulated price response (i.e., revealed preferences).
Green infrastructure does not play an important role in the Portuguese market yet. There are limited data on actual real estate transactions, making it impossible to measure WTP based on revealed preferences. Because of that, this study collected information on stated preferences of consumers through direct surveys. This implies some uncertainty since the responses may not reflect the real value that consumers are willing to pay. Figure 1 highlights in grey and bold methods to measure the WTP named by Breidert et al. [38] that were used in this study.
An online questionnaire was created on Google Forms platform and made available on social networks, allowing to obtain and analyze the user’s results in a quick and simple manner. It was also sent to personal contacts and via email. This corresponds to a nonprobability sampling method, i.e., convenience sampling, where the participants are previously selected instead of considering the entire population [39,40]. This method is often applied in exploratory and preliminary studies to obtain gross yet inexpensive and fast estimations. However, it may not represent the Portuguese reality since generalizations based on the results may lead to potential bias. Companies related to green roofs and green walls also received a similar questionnaire.
Gathering of consumer surveys dates from 16 January to 23 February, 2018. The final database collected 562 valid responses. It is important to note that this sampling method does not allow to achieve robustness. This was considered in the discussion of the results.

2.2. Questionnaire Design

The consumer survey started with a short introductory note explaining the purpose of the study and the time necessary to complete the information. The respondents were informed on the guarantee of anonymity and confidentiality of the responses.
The main part of the survey was divided into 3 sections with a total of 17 questions. The structure of the survey ensured the standardization of data collection. The first section consisted of three questions concerning consumers’ satisfaction, their indoor thermal comfort and sound insulation in their houses, and the existence of green spaces in the area they live in. All these aspects are related to some of the well-known green infrastructure benefits such as thermal and sound insulation and well-being {Formatting Citation}, and it was important to examine if the view of users on those services affects the total amount they are willing to spend to achieve those improvements. Consumers revealed their current satisfaction on these three factors through a Likert scale with five levels: strongly disagree, disagree, neither agree nor disagree (neutral), agree, and strongly agree.
The second section evaluated knowledge about green infrastructure. It included questions about consumers’ perception/familiarity with the concept of green roofs and walls and respective benefits, with three possible answers: (i) never heard of, (ii) have heard of but unfamiliar with the benefits associated, and (iii) familiar with the concept and benefits of these systems. Section 2 also asked about how much consumers were willing to pay to have those green roofs/walls installed in their houses. This allowed assessing the respondents’ attitude towards green infrastructure. The survey separated green infrastructure into (i) accessible and (ii) inaccessible green roofs and (iii) interior and (iv) exterior green walls. Photographs of each system enlighten the respondents less aware of these solutions. A 6-level scale of 0%, 0%–2.5%, 2.6–5%, 5.1%–7.5%, 7.6%–10%, and over 10% measured the WTP for each of those systems as a percentage of the monthly rent value or monthly bank mortgage. Previous studies presented the WTP as a percentage of the buildings’ value (see Section 1). This study adopted a different approach because it was considered that there is a lack of perception of such values, especially for rent contracts or buildings acquired a few years ago. The following example illustrated what was entailed: “If your monthly rent/bank mortgage is 500 € and if you are willing to pay 6% of that value, this means that you are willing to pay 30 additional € per month”.
The third section included questions about sociodemographic characteristics of the respondents, such as gender (female and male); age (under 18 years old, 18–35 years old, 36–55 years old, and over 55 years old); level of education (lower secondary—second cycle, lower secondary—third cycle, higher secondary education, postsecondary qualification, and highly qualified education such as Bachelor, Master, and PhD); and household size (1, 2, 3, 4, and over 4 persons). The gross income was not considered since it is affected by the taxes paid by each individual. Instead, this study considered the disposable income, this is, the average monthly net income, which was distinguished as no income, 0–500 €, 501–1.000 €, 1.001–1.500 €, 1.501–2.000 €, 2.001–2500 €, and over 2.500 €.
The third section comprised questions about the housing characteristics, such as area of residence (divided into Portuguese districts and islands), house contract (owner-occupied or rented), responsibility on housing expenditures (charges paid by the respondent or not), and housing type. The housing type corresponded to the number of main rooms in the house, excluding the kitchen and bathrooms, and was distinguished in T0, T1, T2, T3, T4, T5, and above (i.e., Ti with 0 ≤ i ≤ 5 as the classification of the apartment or villa).

2.3. Data Analysis

For purposes of analysis, the data collected in the surveys had to be differentiated in terms of dependent variables and independent variables. In this study, the WTP for green roofs and walls corresponded to the dependent variable to be explained (i.e., dependent variables) by the influencing factors (i.e., independent variables). The influencing factors were separated into three main categories: satisfaction, awareness, and sociodemographic characteristics. Most of the variables in this study are defined as categorical (also known as nominal) since they are composed of two or more categories with no intrinsic order. The remaining variables are ordinal since they are numerical (also known as quantitative) and distinguished in classes, therefore, not continuous. This is very restrictive for data analysis.
Data analysis consisted of two phases (descriptive statistics and bivariate correlations) and used IBM SPSS software (Statistical Package for the Social Sciences). First, basic descriptive statistics were performed to all variables. Second, bivariate statistics allowed a more detailed analysis to determine the WTP for green roofs and walls in residential buildings based on data and identify the key aspects influencing that value. This analysis explored potential interactions and correlations between the potential explanatory variables and the response variables (WTP). To this end, this study selected the Chi-square test and Cramer’s V. It was not possible to predict the response variables, i.e., WTP, through a multiple regression in bivariate statistics data analysis since most variables are qualitative.
For the statistical analysis, some variables had to be recoded. For example, the 5-level Likert scale for the satisfaction on thermal, acoustics, and green spaces variables were recoded as follows: strongly disagree = −2, disagree = −1, neither agree nor disagree (neutral) = 0, agree =1, and strongly agree = 2. For the quantitative but interval variables data analysis, the mean value of each interval was assumed, e.g., 750 € monthly income representative of the class of (501 €, 1000 €). In addition, the way that data was collected implied that the bivariate analysis would be performed assessing the WTP for (i) accessible and (ii) inaccessible green roofs and (iii) exterior and (iv) interior green walls. To simplify, it was decided to add the variable “accessibility” when analyzing the WTP for green roofs, distinguishing as accessible = 1 and inaccessible = 0; and to add the variable “system” when analyzing the WTP for green walls, distinguishing as exterior = 1 and interior = 0. Accordingly, it was possible to condense information and perform the bivariate analysis concerning the WTP for (i) green roofs and (ii) walls. The analysis involved, therefore, 14 independent variables instead of 13, assuming one additional explanatory variable as the accessibility of the system (for green roofs) and the type of system (for green walls). This meant the transformation of the original data collected. This is why the bivariate analysis accounted for twice the responses (n = 1124) than that for the descriptive analysis (n = 562).

3. Results and Discussion

3.1. Descriptive Statistics

Table 1 summarizes the results of the consumer surveys regarding the characteristics of the respondents and their overall level of satisfaction with their residences.
Regarding the sociodemographic characteristics, the gender distribution is relatively similar, with men accounting for 44% of the sample. Most respondents are aged between 18 and 35 (about 50% of the sample). Students typically do not have a real income, however, they were not excluded from the analysis since the “income” variable was added to take into consideration budget constraint in a realistic manner. The distribution of the level of education is far from being uniform. Respondents are typically highly qualified education (77%). Just like the age, the level of education does not represent the reality of the Portuguese population. This might have some impact on the results, since people with higher levels of education are more likely to have higher incomes and, consequently, be available to spend more money in the installation of green roofs/walls. Nevertheless, the monthly salaries earned by the majority respondents range from 501 to 1500 €. Note that there is a significant number of respondents with no income (88 individuals), among whom 77 are between 18 and 35 years old and are not responsible for the house expenses.
Besides the income, the responsibility of expenditures has some impact on the stated WTP since respondents without charges show a hardly realistic perception of the value of money. In this case, 61% of individuals pay the expenses of the house, whose responses on the WTP should be more credible.
77% of respondents live in their own house. This affects the WTP as well because it is very likely that people living in rented houses might invest less money in a property that does not belong to them.
In total, the 18 districts of Portugal are covered by the surveys. However, given the nonprobability sampling method (with the restrictions referred in Section 2.1) the predominant location of residence is Lisbon, with 326 respondents (58%). This is one of the main limitations of the present study since it was not possible to perform a separate analysis according to the location, as initially intended. To improve the representativeness of the sample in the national territory, the responses were separated as (i) Lisbon and (ii) other districts (including the islands). This distribution is more homogenous and it was used in the subsequent analysis. Figure 2 presents the distribution of the responses to the surveys, in Portugal, as well as the assumed simplification (in the pie chart).
Finally, and as expected, the typology and the household have similar distributions. The most common typologies are T2 to T4, and the household size is typically of 2 to 4 people.
User’s satisfaction on both thermal comfort and sound insulation shows similar results. The responses are evenly divided between satisfied and unsatisfied, meaning that the distribution of these two variables is symmetrical. The satisfaction with the number of green spaces nearby the current house shows more positive results with 60% of respondents being satisfied, 36% unsatisfied, and 4% of the sample having no opinion regarding this matter.
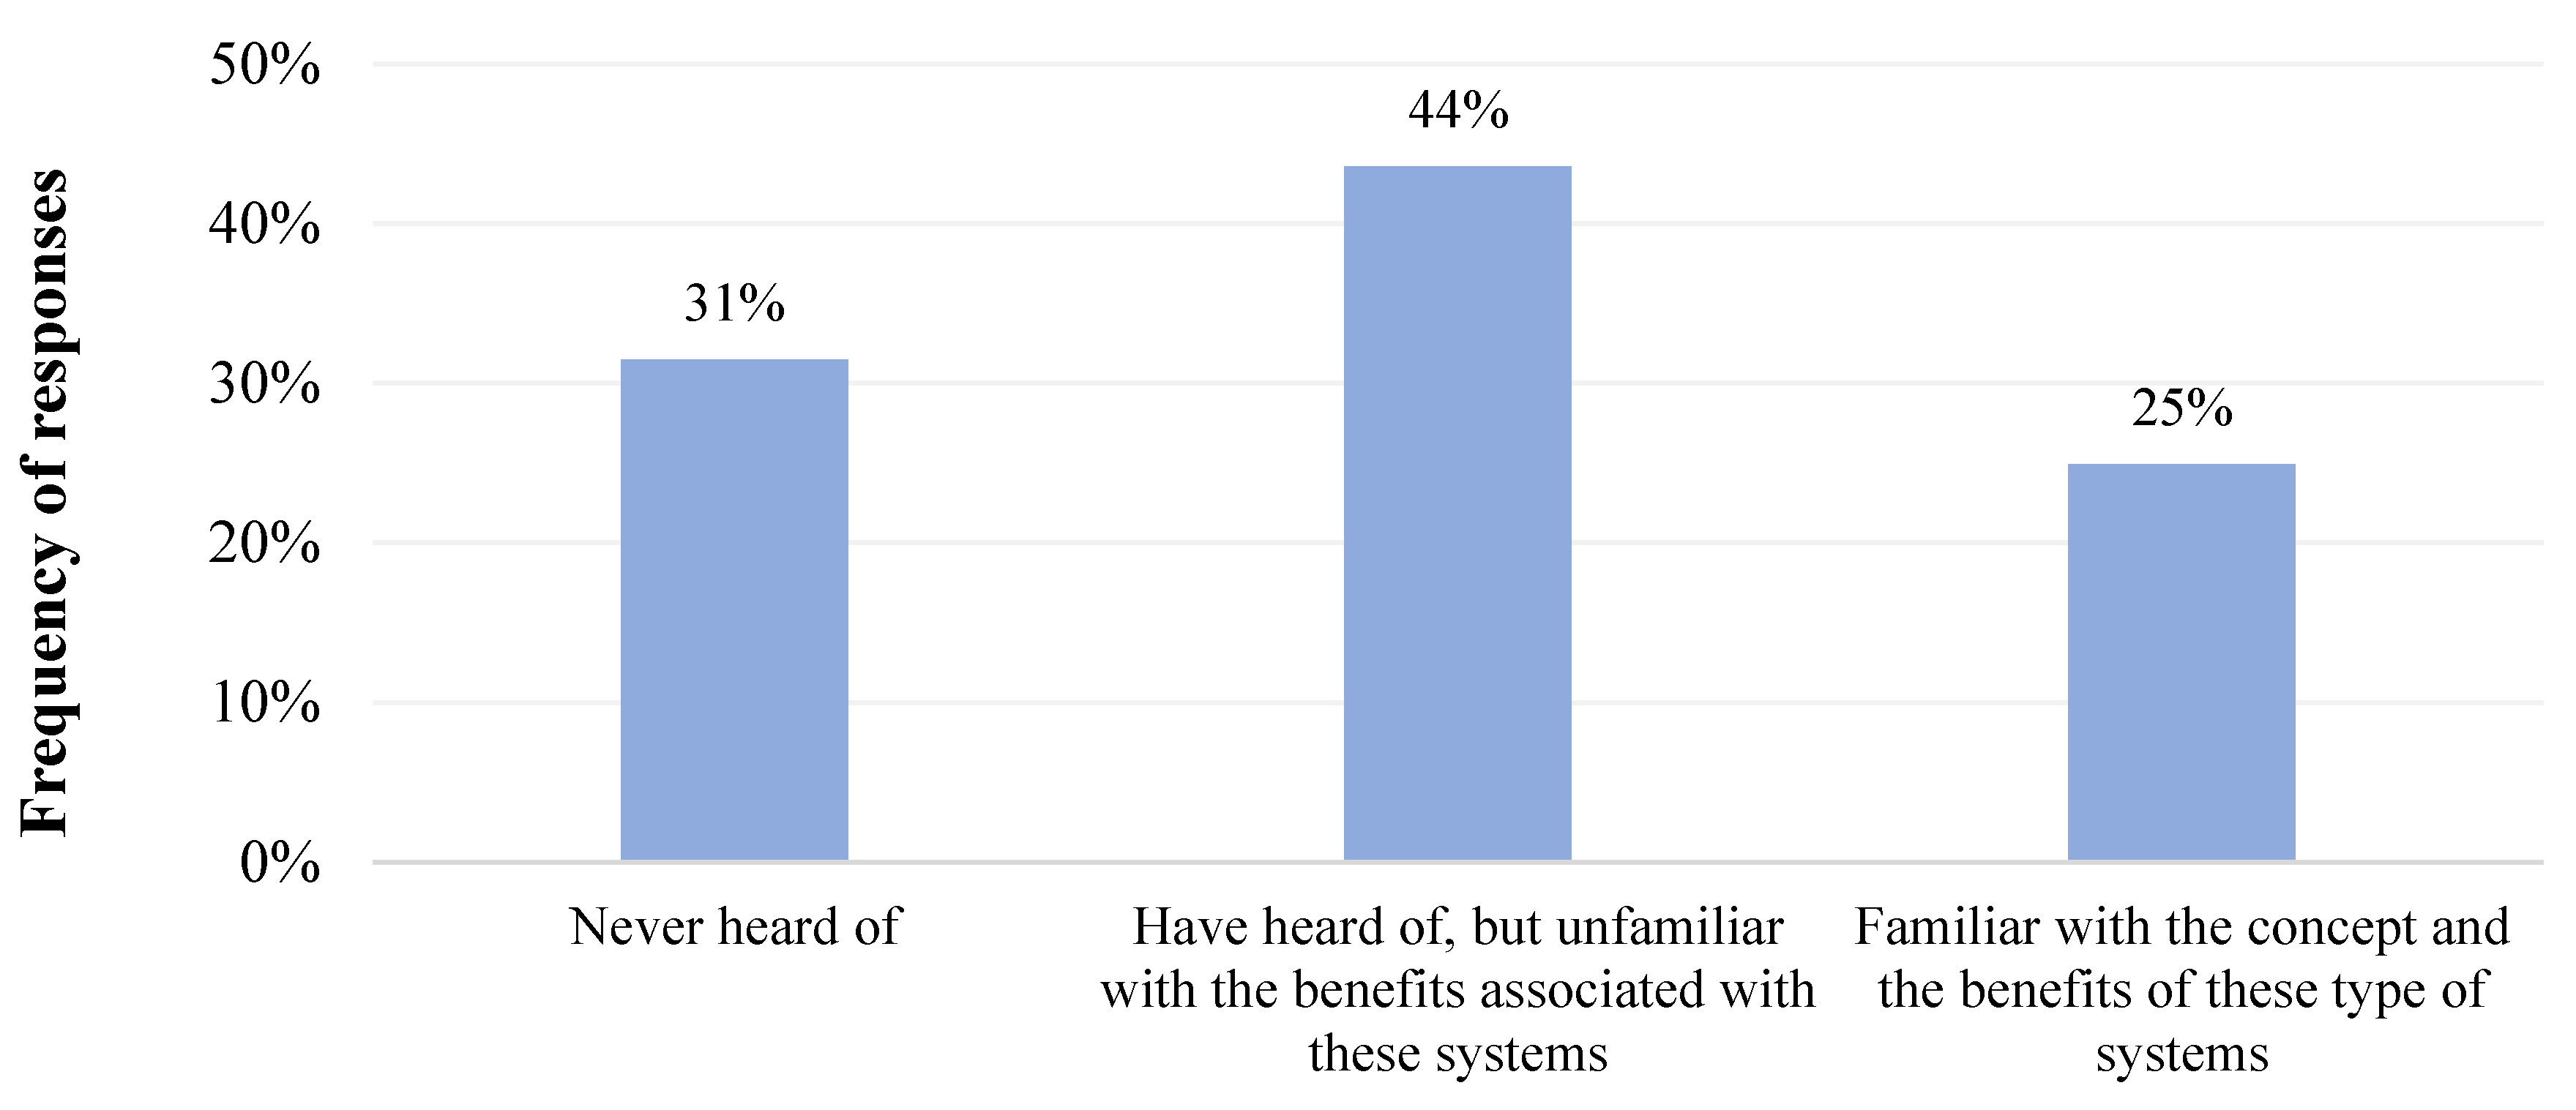
The surveys also show that most individuals are aware of green roof and green wall solutions. The majority have heard about green roofs and walls but are unfamiliar with their benefits (245 respondents). However, the results for this variable are relatively well divided through the three response options, with 140 respondents being familiarized and 177 respondents not having knowledge, as shown in Figure 3. This variable is intended to assess if raising awareness of the real contribution of these systems to achieve more sustainable urban environments helps change the economic behavior of citizens and increases the amount that people are willing to invest.
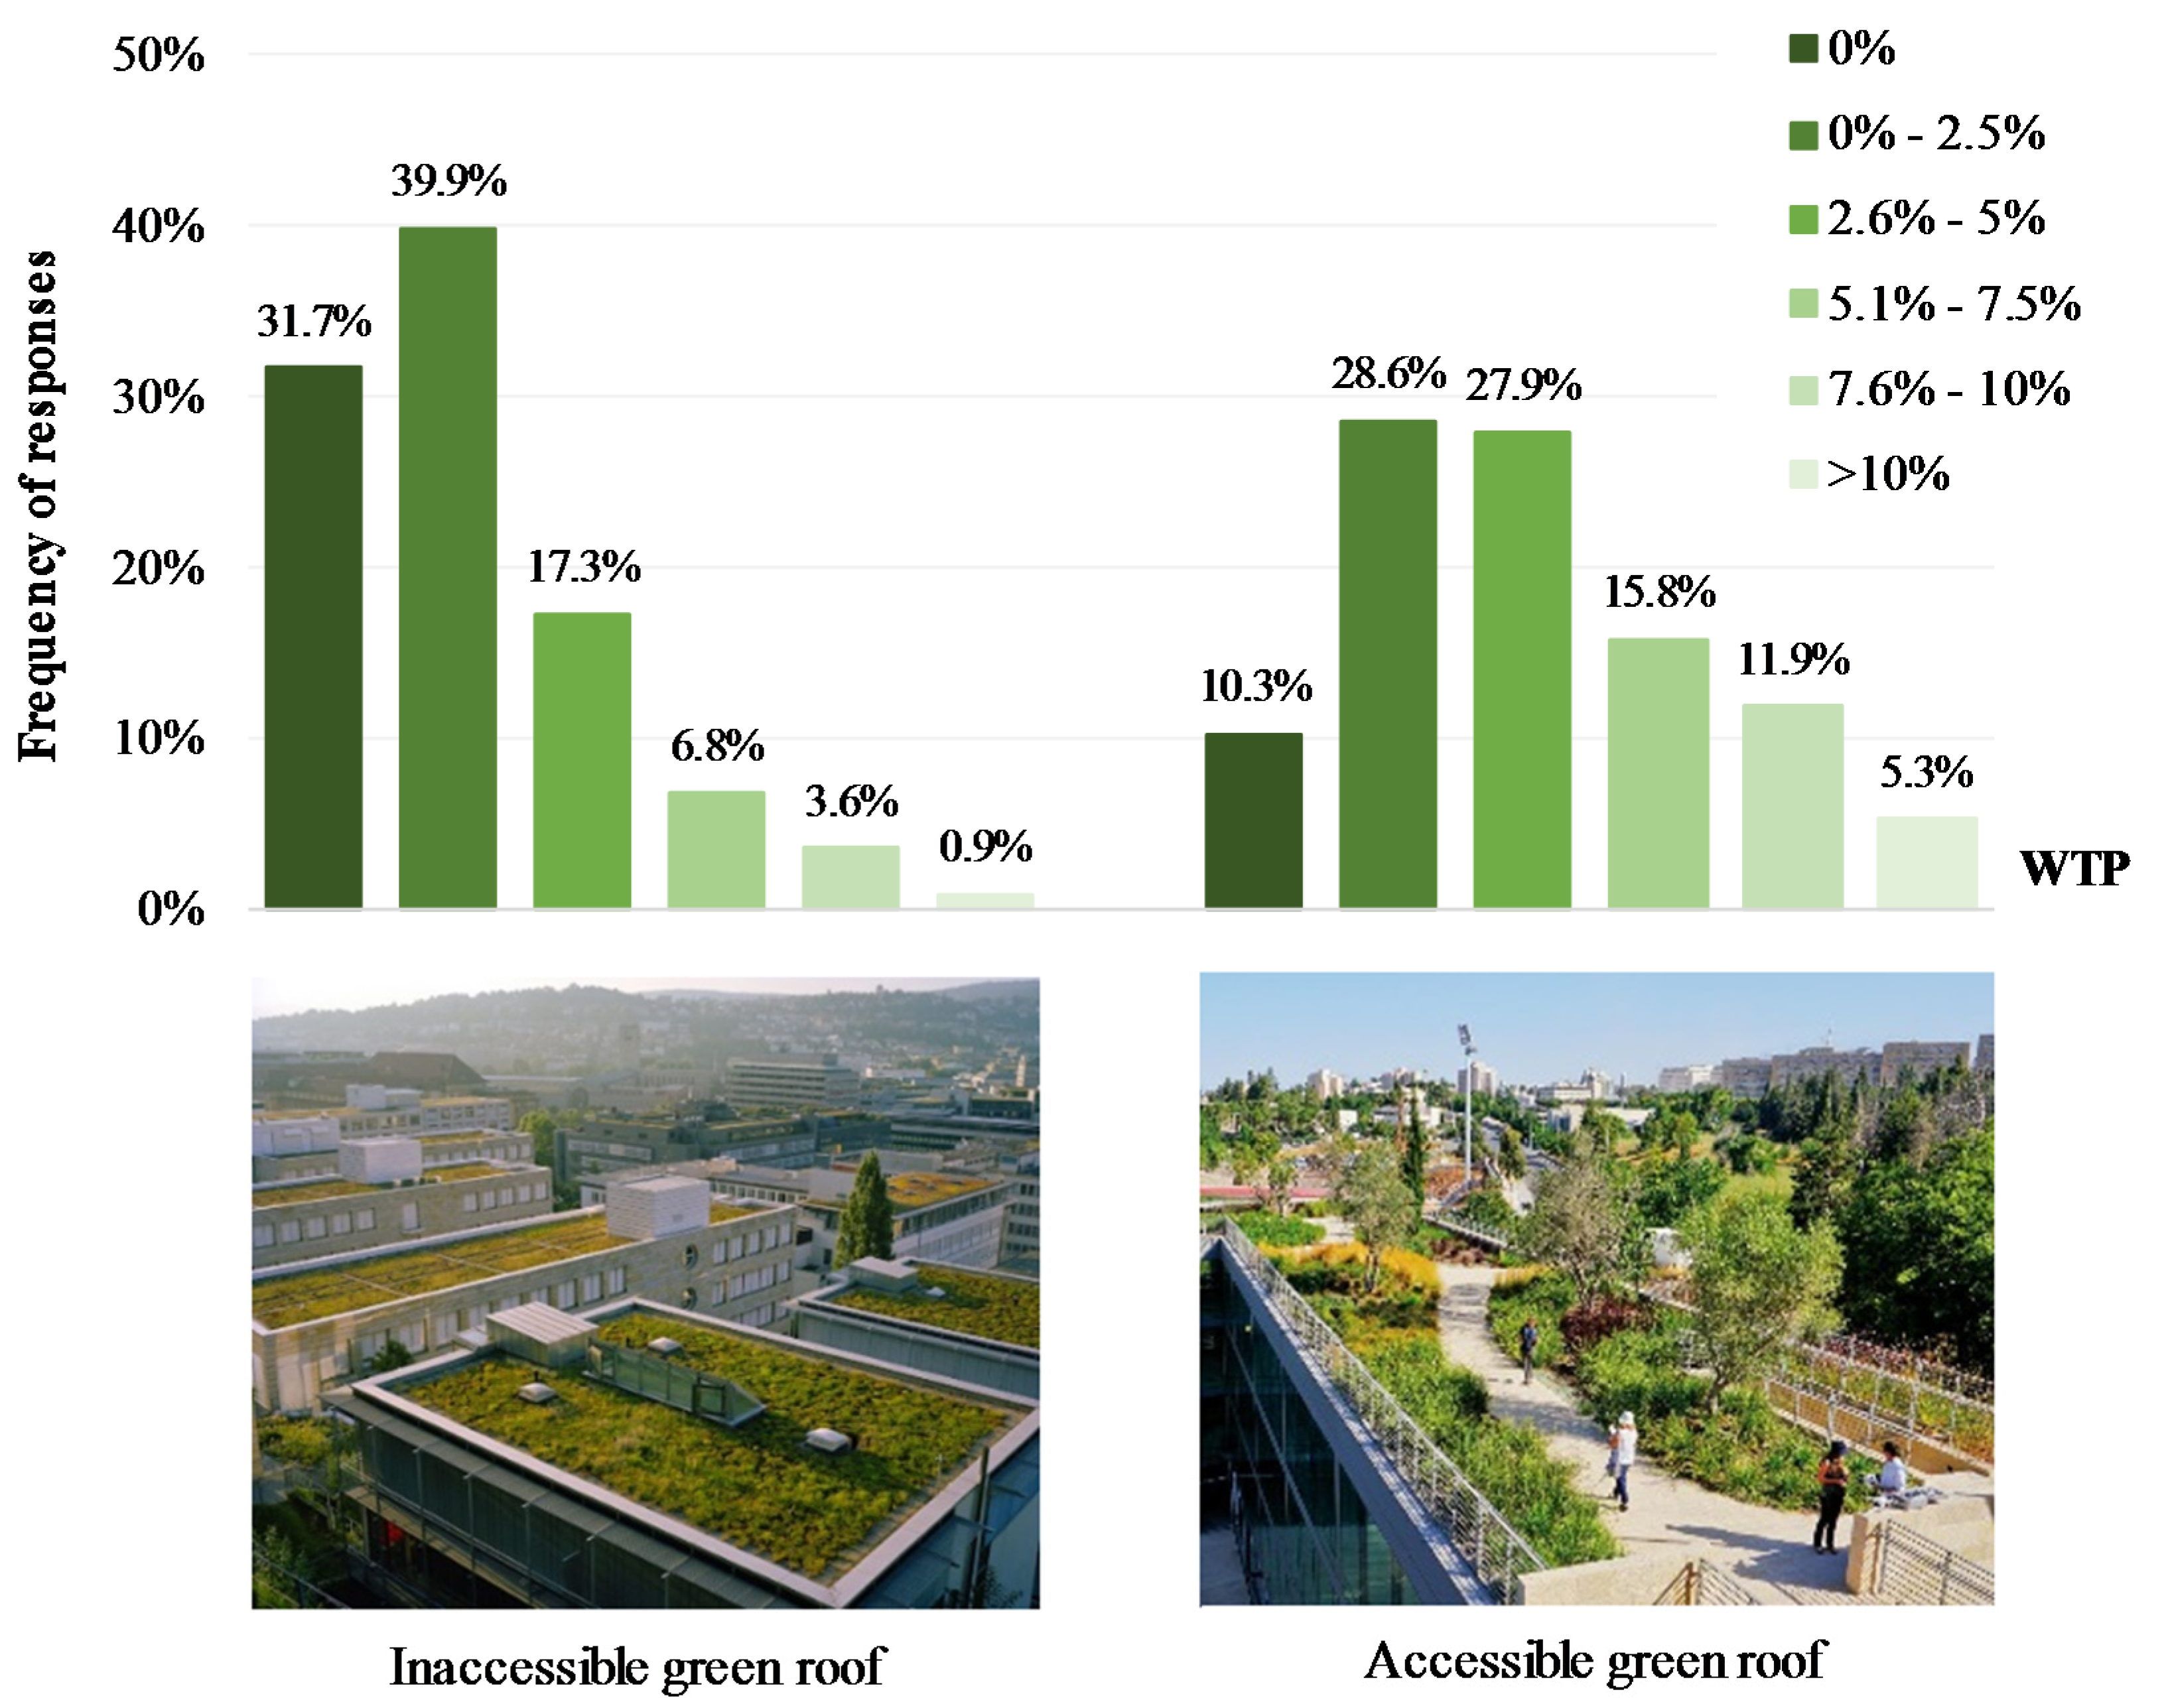
Finally, and most importantly, the survey measures the WTP for green roofs and green walls. Figure 4 presents the results of WTP for green roofs. There is possible a significant difference depending on the accessibility of the system. About 40% of individuals are willing to pay up to a maximum of 2.5% per month of the rent value or bank mortgage for the installation of inaccessible green roofs, and 32% refuse to invest in those systems. However, WTP increases considerably for accessible green roofs. In this latter case, only 10% of respondents will still not invest in accessible green roofs and the majority are willing to spend between 0% and 5% per month of the rent value or bank mortgage. The number of respondents available to pay more than 5% per month is also higher for accessible green roofs (33%) than for inaccessible green roofs (11%).
On the contrary, there is a minor difference in the WTP results for green walls. Figure 5 presents the results for green walls, which are similar to the ones of inaccessible green roofs. About 54% and 48% of respondents are willing to invest up to 5% per month of the rent value or bank mortgage for exterior and interior green walls, respectively.
The distribution of the WTP is approximately normal. The results reveal a consensus of consumers, of which the majority is willing to invest up to 5% for green roofs and green walls. On average, the WTP is lower for green walls than for green roofs. The study shows that investors/users are willing to pay about 2% of the monthly rent value or monthly bank mortgage for the installation of inaccessible green roofs and interior/exterior green walls in their houses. This value almost doubles for accessible green roofs (i.e., 4%). This suggests that users value more the additional recreational space than the improved aesthetics obtained from the greening of the building’s envelope. Overall, the number of respondents willing to invest decreases as WTP values increases. The survey presented Figure 4 and Figure 5 as illustrative images of each green system to support the questions.

3.2. Bivariate Correlations

The bivariate analysis assesses the influence of independent variables on the WTP values through the qui-square test and Cramer’s V. The qui-square test gives information about the relationship between categorical variables (nominal/ordinal). The discussion of significance emphasizes variables with p-values greater than 0.050, meaning that there is no statistically significant association between the variable and the WTP. This means that if the significance level is close to 0, the two variables are likely to be associated. After knowing if the variables are statistically associated or not, Cramer’s V measures that association. Cramer’s V results vary between 0 and 1, and the higher the value the stronger the association. These analyses allow determining the variables which have the most significant effect on the WTP. Table 2 presents the results of both tests for the dependent variables of WTP of both solutions, i.e., green roofs and walls.
Cross-tabulation is very useful in supporting this analysis. This tool sums the frequency of occurrence of specific combinations of categories. The results are not presented in this paper for space management reasons.
Among all variables, accessibility of green roof systems has the highest relation with the WTP of investors/users (χ2 = 0.000; V = 0.364). This is expected since accessible green roofs provide space for leisure in addition to the aesthetics also provided by all the other systems.
The difference between interior and exterior green walls has also a significant influence on the final WTP (χ2 = 0.027; V = 0.106).
Knowledge of green roofs and walls has a statistically significant relationship with WTP, being the most important identified factor for green wall systems (χ2 = 0.000; V = 0.125). As expected, the high value of Cramer’s V means that people that are familiar with these systems and respective benefits are more aware towards sustainable issues, give more importance to environmentally friendly attitudes and, therefore, are willing to pay more. The WTP may also relate to the existence of green spaces. In fact, the satisfaction of the resident population has a significant relationship with the WTP for green roofs, yet is not very strong (V = 0.092). Overall, this correlation between the variable of green spaces and the WTP is negative, which indicates that people are willing to pay more in areas of residence with few green spaces. For green walls, this correlation is not significant. This might be because people value and perceive more easily the benefit of recreation of green roofs than aesthetics.
The WTP can also somewhat related to the area of residence, which has obtained a strong correlation for green roofs as well (χ2 = 0.000; V = 0.159). Individuals living in Lisbon show higher WTP for green solutions. Better work conditions and, consequently, higher incomes are common in urban areas, which can lead to more availability to invest. Survey results prove that income is important when evaluating the WTP as an economic factor. The income variable has a strong and similar relationship for green roofs and walls (χ2 = 0.000; V ≈ 0.110), suggesting an increase in WTP with increasing yields. However, this relation is not linear. Respondents with lower income stated an unusually higher WTP than the ones with medium income, yet lower than the ones with high income, according to what is expected. This may be because most individuals with lower incomes, i.e., between 0 and 500 €, are aged between 18 and 35 (91%), and 92% of those are not responsible for dwelling expenses. The class of age was not sufficiently discretized given the limitations of variable definition, however, it is reasonable to assume that those answers are from younger respondents without a clear notion of the value of money. The lower WTP for respondents with medium income is understandable since 50% of them are individuals responsible for dwelling expenditures that have relatively small amounts of money to invest. Following this logic, respondents that do not pay dwelling expenses reveal greater WTP for green roofs, showing a high association between this variable and WTP (χ2 = 0.015; V ≈ 0.112). However, the same does not appear true for green walls.
The variable of house contract has no statistical significance at the 10% level for both systems and, therefore, this study does not support the hypothesis that those with house ownerships are willing to spend more to have greened solutions installed in their own houses than people renting those buildings.
Lastly, education is positively correlated to the WTP, revealing that individuals with more literary qualifications have higher probabilities of paying larger amounts, probably because they have higher incomes and are more aware of environmental issues. It is important to note that the education level of the sample of this study has a different distribution than the qualifications of the Portuguese population [41].
There is no significant relationship (p ≥ 0.05) for the remaining variables, namely, household size and dwelling type. The responses from surveys indicate a similar WTP for females and males, showing that gender has no association with green roofs and walls. The same happens for age, yet there is slight evidence of appreciation by younger ages. However, there is small evidence of a positive correlation of age with WTP for green walls, with individuals tending invest more as they get older.
As expected, residents of buildings with improved facilities have fewer complaints and, therefore, do not yearn for refurbishments. In such cases, they are less likely to pay for green roofs’ equivalent benefits. There is also a perception that users more satisfied with the levels of thermal and sound insulation in their houses are less probable to aim for green roofs and walls. Despite this expected negative influence on WTP, those variables do not show significant correlation. On the contrary, the WTP tends to increase with the level of satisfaction. This might be because there is still lack of understanding of the benefits of green infrastructure such as the improvement of buildings’ performance.
Overall, Cramer’s V values report a positive association of the studied variables with the WTP, yet weaker than expected. Still, the WTP results are more robust for green roofs than for green walls, which have more explanatory variables.

4. Conclusions and Policy Implications

Several economic evaluations have been carried out to assess the real value of green roofs and walls and promote their widespread use across the world. The measurement of users and investors willingness-to-pay for these systems, however, is still missing.
This study aims to fulfill that gap using the case study of Portugal, providing insights on the current perceptions and attitudes of consumers. The green roofs and walls market in Portugal is developing, and there is still a lack of information regarding the willingness-to-pay of Portuguese population and the factors influencing the amount that they are willing to spend on these solutions. For this reason, this study used the stated preference method through direct surveys of consumers. The sampling method chosen was the nonprobabilistic sampling for convenience, which allows easy access to the survey participants, however, it does not consent generalizations for the population. Thus, the results are only valid for this study sample. A different methodology or sampling method could easily lead to different outcomes.
The willingness-to-pay was measured as an increase in the monthly housing expenses, like rent or banking payments. The results show that willingness-to-pay for green roofs/walls in Portugal is relatively low, even though it is within the range values obtained in previous studies. The average willingness-to-pay reported by respondents is similar for green roofs and walls, of 3% and 2.13%, respectively. Summary statistics indicate that the benefit of recreation is at the forefront of individuals’ concerns, even more than aesthetics.
The consumer survey analyzed several factors that might influence the willingness-to-pay, but most of them do not show a strong relationship. Nevertheless, users value highly the accessibility of green roofs, and significant differences are found in the willingness-to-pay for accessible and inaccessible green roofs, varying from 4% and 2%, respectively. Greater knowledge about the benefits of green roofs and walls leads to greater willingness-to-pay values. Accordingly, the variable “awareness” in this study has the highest correlation coefficient. Other aspects are also correlated with the willingness-to-pay values, such as the area of residence, the monthly income of users, and their responsibility on dwelling expenditures. There is a positive correlation between location and willingness-to-pay, with individuals living in the district of Lisbon being available to pay more. In addition, the amount that users are willing to invest increases with increasing monthly incomes. Lastly, residents that are responsible for the expenses have a different perception of the value of money and are more likely to make lower investments.
The incorporation of the results of this study on cost–benefit analysis to green infrastructure should have significant implications in the decision- and policy-making processes. As such, this information on the behaviour and preferences of users can be used to enact or revise existing regulations and incentives to promote the spreading of sustainable projects such as green roofs and green walls.
It is important to mention that the survey’s structure influences the treatment of results. The present study has some limitations that further studies might overcome. First, the sample was not evenly split in the national territory. Further studies could replicate the methodology for a locally specific analysis and also for other types of buildings besides residences (e.g., commercial) since different users/investors show different preferences. Another limitation is the small size of the sample and the sampling method applied. In different circumstances, greater p-values could be expected for the data analysis. In the future, different sampling methods should be expected. With respect to the methodology applied, the same study could be reproduced using the method of revealed preferences, and then the results of both studies could be compared while discussing the differences. The definition of variables is also important. Variables such as willingness-to-pay, age, and income should be viewed as continuous and not categorical to allow the application of different and more relevant statistical methods. Also, by questioning about the individual’s income instead of the household income, the perception of the available amount to invest per residence is lost. Despite all this, this is not believed to invalidate the findings. Finally, notice that although investors are mainly concerned about green roofs and walls costs, building-scale benefits like the reduction of energy expenses and other social and environmental benefits are also expected to influence the consumer’s willingness to invest in these solutions. However, no information was given in the surveys regarding these benefits in order to analyze the impact of knowledge of benefits in consumers’ willingness-to-pay.

Author Contributions

Conceptualization, C.O.C., C.M.S. and J.M.; Methodology: C.O.C., C.M.S. and J.M.; Software, J.M. and I.T.; Validation, C.O.C. and C.M.S.; Formal Analysis, J.M. and I.T.; Investigation, C.O.C., C.M.S. and J.M.; Supervision, C.O.C. and C.M.S.; Visualization, J.M. and I.T.; Writing—Original Draft Preparation, C.O.C., C.M.S. and J.M.; Writing—Review & Editing, C.O.C., C.M.S. and I.T.; Funding Acquisition, C.O.C. and C.M.S. All authors have read and agreed to the published version of the manuscript.

Funding

This research was funded by the FCT (Portuguese Foundation for Science and Technology) through scholarship PD/BD/135172/2017 and research project GENESIS (PTDC/GESURB/29444/2017).

Acknowledgments

This work was supported by the FCT (Portuguese Foundation for Science and Technology) through scholarship PD/BD/135172/2017 and research project GENESIS (PTDC/GESURB/29444/2017).

Conflicts of Interest

The authors declare no conflict of interest.

References

  1. Raji, B.; Tenpierika, M.; Dobbelsteen, A.V.D. The impact of greening systems on building energy performance: A literature review. Renew. Sustain. Energy Rev. 2015, 45, 610–623. [Google Scholar] [CrossRef] [Green Version]
  2. Grimmond, S. Urbanization and global environmental change: Local effects of urban warming. Geogr. J. 2007, 173, 83–88. [Google Scholar] [CrossRef]
  3. Saiz, S.; Kennedy, C.; Bass, B.; Pressnail, K. Comparative Life Cycle Assessment of Standard and Green Roofs. Environ. Sci. Technol. 2006, 40, 4312–4316. [Google Scholar] [CrossRef] [PubMed]
  4. Chemisana, D.; Lamnatou, C. Photovoltaic-green roofs: An experimental evaluation of system performance. Appl. Energy 2014, 119, 246–256. [Google Scholar] [CrossRef]
  5. Berardi, U.; GhaffarianHoseini, A.; GhaffarianHoseini, A. State-of-the-art analysis of the environmental benefits of green roofs. Appl. Energy 2014, 115, 411–428. [Google Scholar] [CrossRef]
  6. Zhang, Q.; Miao, L.; Wang, X.; Liu, D.; Zhu, L.; Zhou, B.; Sun, J.; Liu, J. The capacity of greening roof to reduce stormwater runoff and pollution. Landsc. Urban Plan. 2015, 144, 142–150. [Google Scholar] [CrossRef]
  7. Yang, J.; Yu, Q.; Gong, P. Quantifying air pollution removal by green roofs in Chicago. Atmos. Environ. 2008, 42, 7266–7273. [Google Scholar] [CrossRef]
  8. Lee, J.; Moon, H.; Kim, T.; Kim, H.; Han, M. Quantitative analysis on the urban flood mitigation effect by the extensive green roof system. Environ. Pollut. 2013, 181, 257–261. [Google Scholar] [CrossRef]
  9. Benvenuti, S. Wildflower green roofs for urban landscaping, ecological sustainability and biodiversity. Landsc. Urban Plan. 2014, 124, 151–161. [Google Scholar] [CrossRef]
  10. Li, X.-X.; Norford, L.K. Evaluation of cool roof and vegetations in mitigating urban heat island in a tropical city, Singapore. Urban Clim. 2016, 16, 59–74. [Google Scholar] [CrossRef]
  11. Thøgersen, J.; Noblet, C. Does green consumerism increase the acceptance of wind power? Energy Policy 2012, 51, 854–862. [Google Scholar] [CrossRef] [Green Version]
  12. Carter, T.; Keeler, A. Life-cycle cost–benefit analysis of extensive vegetated roof systems. J. Environ. Manag. 2008, 87, 350–363. [Google Scholar] [CrossRef] [PubMed]
  13. Oldfield, A. The Future of Sustainable Cities: Critical Reflections. Hous. Stud. 2013, 28, 799–800. [Google Scholar] [CrossRef]
  14. Xie, X.; Lu, Y.; Gou, Z. Green Building Pro-Environment Behaviors: Are Green Users Also Green Buyers? Sustainability 2017, 9, 1703. [Google Scholar] [CrossRef] [Green Version]
  15. Herbes, C.; Friege, C.; Baldo, D.; Mueller, K.-M. Willingness to pay lip service? Applying a neuroscience-based method to WTP for green electricity. Energy Policy 2015, 87, 562–572. [Google Scholar] [CrossRef]
  16. Hu, H.; Geertman, S.; Hooimeijer, P. Green Apartments in Nanjing China: Do Developers and Planners Understand the Valuation by Residents? Hous. Stud. 2014, 29, 26–43. [Google Scholar] [CrossRef]
  17. Koto, P.S.; Yiridoe, E. Expected willingness to pay for wind energy in Atlantic Canada. Energy Policy 2019, 129, 80–88. [Google Scholar] [CrossRef]
  18. Derkzen, M.; Van Teeffelen, A.J.A.; Verburg, P.H. Green infrastructure for urban climate adaptation: How do residents’ views on climate impacts and green infrastructure shape adaptation preferences? Landsc. Urban Plan. 2017, 157, 106–130. [Google Scholar] [CrossRef]
  19. Kim, D.-H.; Ahn, B.-I.; Kim, E.-G. Metropolitan Residents’ Preferences and Willingness to Pay for a Life Zone Forest for Mitigating Heat Island Effects during Summer Season in Korea. Sustainability 2016, 8, 1155. [Google Scholar] [CrossRef] [Green Version]
  20. Chui, T.F.M.; Ngai, W.Y. Willingness to pay for sustainable drainage systems in a highly urbanised city: A contingent valuation study in Hong Kong. Water Environ. J. 2016, 30, 62–69. [Google Scholar] [CrossRef]
  21. Park, M.; Hagishima, A.; Tanimoto, J.; Chun, C. Willingness to pay for improvements in environmental performance of residential buildings. Build. Environ. 2013, 60, 225–233. [Google Scholar] [CrossRef]
  22. Banfi, S.; Farsi, M.; Filippini, M.; Jakob, M. Willingness to pay for energy-saving measures in residential buildings. Energy Econ. 2008, 30, 503–516. [Google Scholar] [CrossRef] [Green Version]
  23. Chau, C.K.; Tse, M.; Chung, K. A choice experiment to estimate the effect of green experience on preferences and willingness-to-pay for green building attributes. Build. Environ. 2010, 45, 2553–2561. [Google Scholar] [CrossRef]
  24. Hu, H.; Geertman, S.; Hooimeijer, P. The willingness to pay for green apartments: The case of Nanjing, China. Urban Stud. 2014, 51, 3459–3478. [Google Scholar] [CrossRef]
  25. Robinson, S.; Simons, R.; Lee, E.; Kern, A. Demand for Green Buildings: Office Tenants’ Stated Willingness-to-Pay for Green Features. J. Real Estate Res. 2006, 38, 423–452. [Google Scholar]
  26. Wiencke, A. Willingness to Pay for Green Buildings-Empirical Evidence from Switzerland. SSRN Electron. J. 2013, 5, 111–133. [Google Scholar] [CrossRef]
  27. Zalejska-Jonsson, A. Stated WTP and rational WTP: Willingness to pay for green apartments in Sweden. Sustain. Cities Soc. 2014, 13, 46–56. [Google Scholar] [CrossRef]
  28. Vanstockem, J.; Vranken, L.; Bleys, B.; Somers, B.; Hermy, M. Do Looks Matter? A Case Study on Extensive Green Roofs Using Discrete Choice Experiments. Sustainability 2018, 10, 309. [Google Scholar] [CrossRef] [Green Version]
  29. Tam, V.W.; Wang, C.; Le, K.N. Thermal insulation and cost effectiveness of green-roof systems: An empirical study in Hong Kong. Build. Environ. 2016, 110, 46–54. [Google Scholar] [CrossRef]
  30. Rosenzweig, C.; Gaffin, S.; Parshall, L. Green Roofs in the New York Metropolitan Region: Research Report; NASA Goddard Institute for Space Studies: New York, NY, USA, 2006.
  31. Bianchini, F.; Hewage, K. Probabilistic social cost-benefit analysis for green roofs: A lifecycle approach. Build. Environ. 2012, 58, 152–162. [Google Scholar] [CrossRef]
  32. Nurmi, V.; Votsis, A.; Perrels, A.; Lehvävirta, S. Green Roof Cost-Benefit Analysis: Special Emphasis on Scenic Benefits. J. Benefit-Cost Anal. 2016, 7, 488–522. [Google Scholar] [CrossRef]
  33. Niu, H.; Clark, C.; Zhou, J.; Adriaens, P. Scaling of Economic Benefits from Green Roof Implementation in Washington, DC. Environ. Sci. Technol. 2010, 44, 4302–4308. [Google Scholar] [CrossRef] [PubMed]
  34. Silva, C.M.; Serro, J.; Ferreira, P.; Teotónio, I. The socioeconomic feasibility of greening rail stations: A case study in lisbon. Eng. Econ. 2019, 64, 167–190. [Google Scholar] [CrossRef]
  35. Sproul, J.; Wan, M.P.; Mandel, B.; Rosenfeld, A.H. Economic comparison of white, green, and black flat roofs in the United States. Energy Build. 2014, 71, 20–27. [Google Scholar] [CrossRef]
  36. Teotónio, I.; Silva, C.M.; Cruz, C.O. Eco-solutions for urban environments regeneration: The economic value of green roofs. J. Clean. Prod. 2018, 199, 121–135. [Google Scholar] [CrossRef]
  37. Cruz, C.O.; Silva, C.M.; Dias, P.V.; Teotónio, I. Economic impact of changing thermal regulation—An application to the city of Lisbon. Energy Build. 2017, 149, 354–367. [Google Scholar] [CrossRef]
  38. Breidert, C.; Hahsler, M.; Reutterer, T. A review on methods for measuring willingness-to-pay. Innov. Mark. 2006, 2, 8–32. [Google Scholar]
  39. Etikan, I.; Musa, S.A.; Alkassim, R.S. Comparison of Convenience Sampling and Purposive Sampling. Am. J. Theor. Appl. Stat. 2016, 5, 1. [Google Scholar] [CrossRef] [Green Version]
  40. Fielding, N.; Lee, R.; Blank, G. The SAGE Handbook of Online Research Methods; SAGE Publications, Ltd.: Thousand Oaks, CA, USA, 2008. [Google Scholar] [CrossRef]
  41. PORTDATA. Base de Dados Portugal Contemporâneo (Portugal Contemporary Database) [WWW Document]. 2017. Available online: http://www.pordata.pt/ (accessed on 29 March 2017).
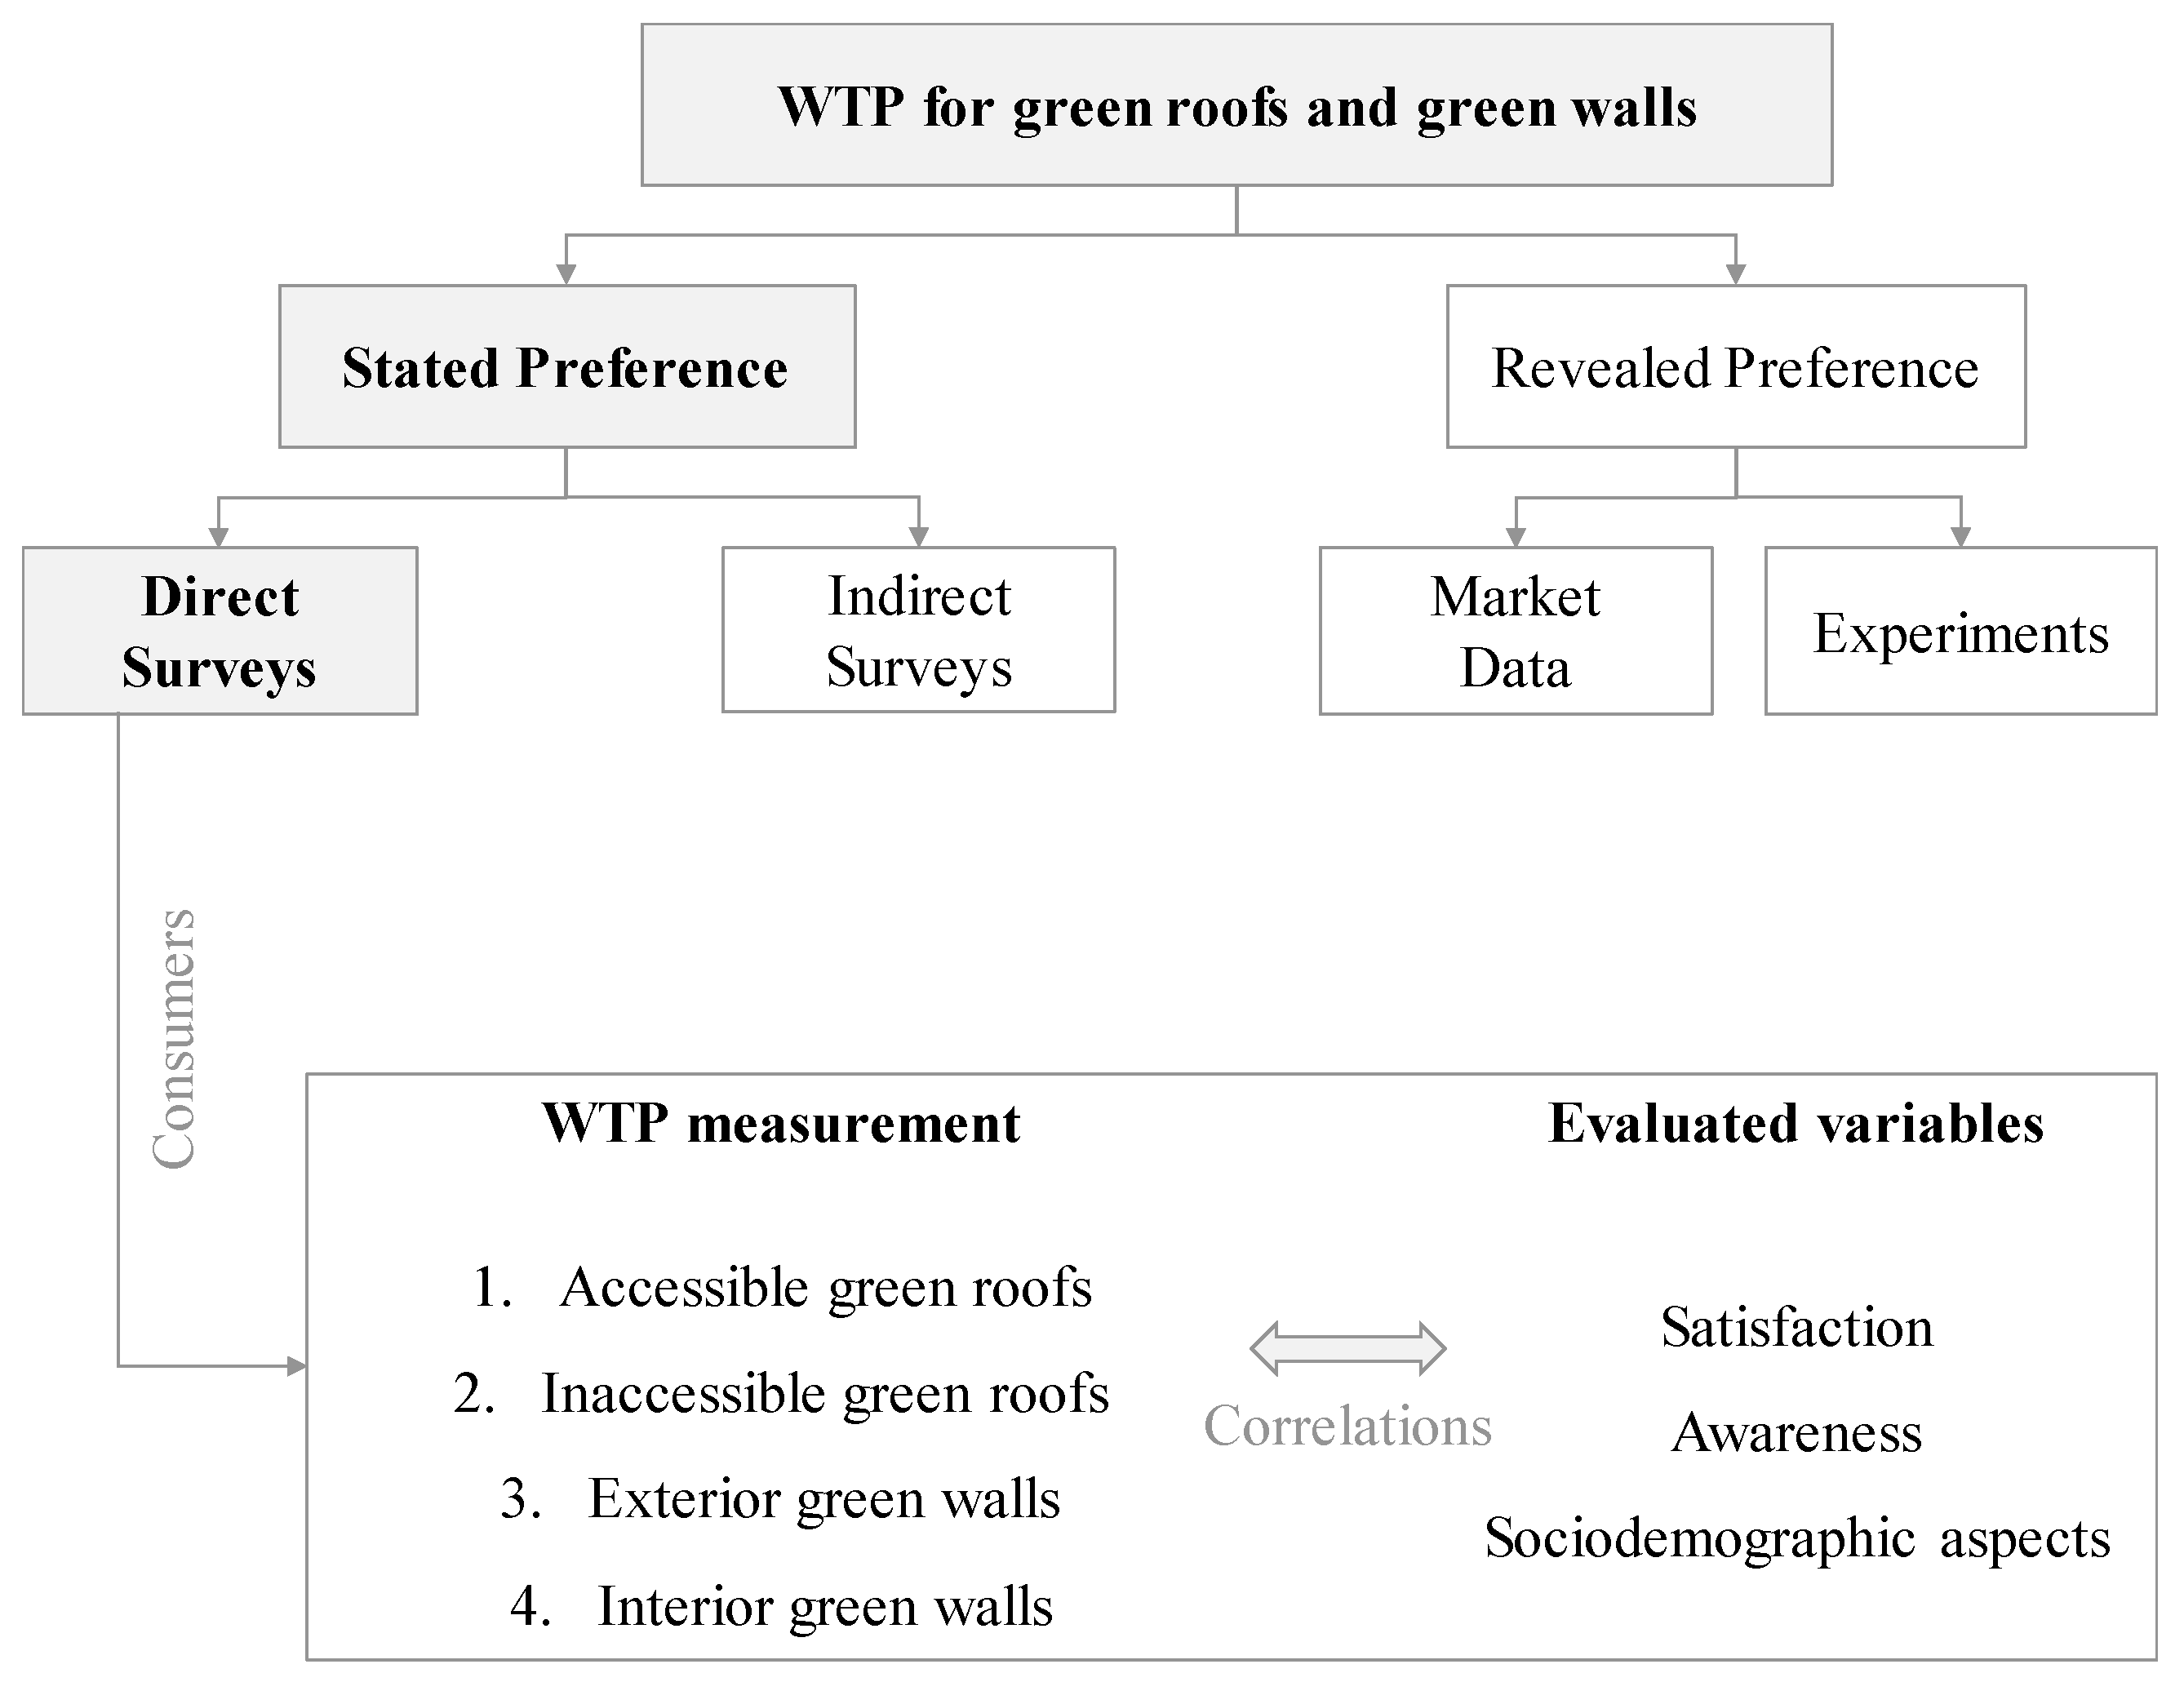
Figure 1. Classification framework for methods to measure willingness-to-pay (WTP) (adapted from Breidert et al. [38]).
Sustainability 12 03210 g001
Figure 2. Distribution of surveys responses by residence area.
Sustainability 12 03210 g002
Figure 3. Familiarity of respondents with green roofs/walls and respective benefits.
Sustainability 12 03210 g003
Figure 4. WTP for green roofs.
Sustainability 12 03210 g004
Figure 5. WTP for green walls.
Sustainability 12 03210 g005
Table 1. Summary statistics on consumer’s judgments: sociodemographic characteristics and user’s satisfaction results (n = 562).
VariableFrequency of Responses
Sociodemographic characteristics
 Gender
  Female317 (56%)
  Male245 (44%)
 Age
  Under 180 (0%)
  18–35 years old281 (50%)
  36–55 years old178 (32%)
  Over 55 years old103 (18%)
 Education
  Lower secondary (second cycle)3 (1%)
  Lower secondary (third cycle)6 (1%)
  Higher secondary76 (13%)
  Postsecondary44 (8%)
  Highly qualified433 (77%)
 Household size
  1 person52 (9%)
  2 persons119 (21%)
  3 persons165 (29%)
  4 persons161 (29%)
  Over 4 persons65 (12%)
 Income
  No income88 (16%)
  0–500 €32 (6%)
  501–1000 €149 (27%)
  1001–1500 €138 (25%)
  1501–2000 €71 (13%)
  2001–2500 €36 (6%)
  Over 2500 €48 (9%)
 House contract
  Owner-occupied434 (77%)
  Rented128 (23%)
 Housing expenditures (responsibility)
  Yes342 (61%)
  No220 (39%)
 Housing type
  T01 (0%)
  T137 (7%)
  T2106 (19%)
  T3208 (37%)
  T4137 (24%)
  T540 (7%)
  > T533 (6%)
User’s current satisfaction
 Thermal comfort
  Strongly disagree107 (19%)
  Disagree167 (30%)
  Neutral10 (2%)
  Agree186 (33%)
  Strongly agree92 (16%)
 Sound insulation
  Strongly disagree106 (19%)
  Disagree170 (30%)
  Neutral19 (3%)
  Agree196 (35%)
  Strongly agree71 (13%)
 Surrounding green spaces
  Strongly disagree83 (15%)
  Disagree120 (21%)
  Neutral24 (4%)
  Agree205 (36%)
  Strongly agree130 (23%)
Table 2. Relationship between WTP and dependent variables (n = 1124).
Response VariablesWTP for Green RoofsWTP for Green Walls
Explanatory Variables Qui-SquareCramer’s VQui-SquareCramer’s V
Sociodemographic characteristics
 Gender0.6100.0560.1810.082
 Age0.1610.0800.020 *0.097
 Education0.007 *0.0930.017 *0.089
 Household size0.1180.0780.1900.075
 Income0.000 *0.1060.000 *0.112
 House contract0.4080.0670.5300.061
 Housing expenditures (responsibility)0.015 *0.1120.0660.096
 Housing type0.3090.0770.5400.071
 Residence area0.000 *0.1590.0660.096
User’s current satisfaction
 Thermal comfort0.2100.0740.4880.066
 Sound insulation0.1050.0790.0910.080
 Surrounding green spaces0.009 *0.0920.2930.071
Awareness0.000 *0.1620.000 *0.125
Greened solution
Accessibility/system0.000 *0.3640.027 *0.106
* significant at the 5% level.