Article

Clustering the Adsorbents of Horizontal Series Filtration in Greywater Treatment

by
Mehdi Bahrami
1,
Mohammad Javad Amiri
1 and
Mohammad Reza Mahmoudi
2,3,*
1
Department of Water Engineering, Faculty of Agriculture, Fasa University, Fasa 74616-86131, Iran
2
Institute of Research and Development, Duy Tan University, Da Nang 550000, Vietnam
3
Department of Statistics, Faculty of Science, Fasa University, Fasa 74616-86131, Iran
*
Author to whom correspondence should be addressed.
Sustainability 2020, 12(8), 3194; https://doi.org/10.3390/su12083194
Submission received: 11 February 2020 / Revised: 17 March 2020 / Accepted: 18 March 2020 / Published: 15 April 2020
(This article belongs to the Special Issue Removal of Emerging Pollutants from Wastewater Effluent)

Abstract

:
One of the important alternative water resources for non-potable purposes is greywater (GW), which must be cleaned of contaminants. In this regard, the clustering analysis of materials consisting of sand (S), zeolite (Z), peat (P) and granular activated carbon (GAC) within a horizontal series filter (HSF) was used for removal of chemical oxygen demand (COD), biochemical oxygen demand (BOD), total dissolved solids (TDS), and turbidity in GW taken from the Fasa University Student Hostel, Iran. The hierarchical clustering technique was applied to classify the adsorbents. The findings indicated that there were significant differences (more than 95%) between these materials. According to the similarity of level 95%, for COD, BOD, TDS, and turbidity removal, these adsorbents could be separately clustered in three, three, two, and three clusters, respectively. In addition, by considering the simultaneous changes of COD, BOD, TDS, and turbidity together, these adsorbents could be clustered in three different clusters. This paper proposed an efficient method to select the best combination of adsorbents for eliminating of COD, BOD, TDS, and turbidity from GW. Generally, based on the quality of treated greywater and literature, reusing greywater can be implemented for agriculture, artificial recharge of aquifers, desertification, and preventing the dust creation in arid areas such as southern Iran.

1. Introduction

Today, reducing the overall urban water demand has become a vital subject for water utilities and regulatory bodies. Usually indoor domestic water demand (excluding landscape, irrigation, toilet flush tank and other purposes that do not require using freshwater) in developed countries varies from 100 to 180 L/d per capita or from 36 to 66 m3/y per capita [1,2]. In this way, a “new” alternative resource is reusing the water. When regarding urban water reuse, on-site greywater (GW) reuse owns the potential to perform a significant role [3].
The various technologies have been examined for GW treatment like coagulation and magnetic ion exchange resin [4], flocculation [5], septic tank followed by intermittent sand filter [6], a moving bed biofilm reactor [7], trickling filters with suspended plastic media [8], slow sand filter and slate waste followed by granular activated carbon [9], drawer compacted sand filter [10], pelletised mine watersludge [11], aerobic attached-growth biomass [12], green roof-top water recycling system constructed wetland [13], biofilter system [14], compact hybrid filter systems [15], a physical treatment system containing coagulation, sedimentation, sand filtration, granular activated carbon filtration, and disinfection [16], and anaerobic filter followed by UV disinfection [17]. Recently, the evolution of greywater recycling operations has been from traditional treatment technologies into more environmentally friendly treatment systems [18,19]. Maimon et al. (2014) assessed the hazards related to on-site GW reuse and the main parameters influencing them. The treatment kind was ascertained to have a meaningful impact on the quality of the treated GW [20]. Oteng-Peprah et al. (2018) resulted that among the traditional treatment technologies, filtration techniques look feasible and have the potential of integration with other methods to obtain target specific treatment [21]. Opher et al. (2017) used an analytical hierarchy process (AHP) to assess the effects of four methods of water reuse on three related stakeholders including public, community, and consumer groups [22]. Amiri et al. (2019) studied the capability of some materials including activated carbon (AC), Iranian natural zeolite (Z), and stabilized nano zero-valent iron (nZVI) in single and combined modes for treating greywater to reuse in landscape irrigation [23]. Therefore, the adsorption batch experiments were performed using greywater samples obtained from the student hostel of Fasa University.
Several nonlinear modeling was performed for predicting target pollutants removal such as Pb(II) ions [24,25], Hg(II) ions [26], and caffeine [27] from aqueous media by selected adsorbents. Since the effectiveness of the target pollutant removal depending on the adsorbent type is not specified, so multidimensional data analysis such as clustering analysis is performed. Unfortunately, such procedures are scarce in the literature. Dacewicz and Chmielowski (2019) ascertained that the multidimensional clustering technique enabled data mining of the input data for assessment of the effectiveness of the elimination of organic compounds (COD and BOD5), suspended solids, and nitrogen from domestic wastewater utilizing a vertical-flow filter with a plastic-waste filling [28].
Because of the unknown relationship between the proposed materials for greywater treatment and consequently a large number of adsorbents structures in a horizontal series filter, it is necessary to introduce the new adsorbents grouping methods. Therefore, the classification of adsorbents in a horizontal series filter can be conducted using Ward clustering methods and the squared Euclidean distances. In addition, the effectiveness of the adsorbents in single, double, and triple combination in a horizontal series filter can be evaluated by the multidimensional clustering method. To the best knowledge of the authors, there are no reports about the greywater purification materials mathematically and statistically.
Therefore, the main purpose of the current study is to introduce a horizontal series filtration system consists of four filters filled with different materials including sand (S), zeolite (Z), peat (P), and granular activated carbon (GAC) in single and combined forms for the removal of COD, BOD, TDS, and turbidity from real greywater. The specific purposes of this research are as follows: (1) compare and cluster the adsorbents based on GW treatment using Ward clustering methods and squared Euclidean distances, (2) evaluate the effectiveness of the Z, P, and GAC in the single, double and triple combinations under continuous closed-loop system for greywater treatment, and (3) investigate the economic aspects of horizontal filtration system in an industrial scale based on the Iranian market with rate of return method (ROR).

2. Materials and Methods

The experimental system included a storage tank and a GW treatment system established at the laboratory of the Fasa University, Fasa, Iran. The horizontal series filtration (HSF) included a sand filter, a granular activated carbon filter, a zeolite filter, and a peat filter (Figure 1).
The horizontal series filters applied for treatment were four PVC cylinders with a length of 80 cm and a diameter of 15 cm, which were filled with desired filters. For optimizing the reactor configuration, various experiments have been done using diverse architectural configurations. The investigation of each combination was conducted using try and error. Finally, the reactor configuration with the highest removal efficiency was designated as the best. The used sand (S) containing four layers in filter one, with D10 = 0.6 mm, D60 = 1.2 mm, Cu = 2, and permeability = 2.7 × 10 10 m 2 arranged from coarse to fine. This filter was produced by recommended standards and guidance for performance, application, design, and operation and maintenance recirculating gravel filter systems by Washington state department of health [29]. The granular activated carbon (GAC) in filter two, purchased from Merck Company, Darmstadt, Germany (product number 1025141000). The zeolite (Z) in the third cylinder originated from a mine in Darab, Fars province, Iran. The peat (P) in the last filter, purchased from Biolan Oy Co., Finland, composed of raw biomaterials and applied for horticultural aims. Characterization and amounts of the applied materials in filters tabulated in Table 1.
This study operated using real GW, effluent from a student dormitory block with 250 residents. The characteristics of raw GW are represented in Table 2. A 100 L tank was used to retain the greywater for 24 h to settle the suspended solids and increasing dissolved oxygen and was also applied for flow regulation before the filters. The greywater was conveyed through a pump to the suggested treatment filter at a constant flow rate equal to 0.034 L s−1 under constant pressure conditions (constant head equal to 0.58 m) applying a flow control tool with a pre-calibrated valve. In addition, a bypass system was considered to divert excess effluent into the sewage disposal system. Afterward, the treated greywater was returned to the tank via a tube from the final filter. The efficiency of the HSF treatment system (E) was measured by analyzing the greywater samples collected prior and after the filters, as follows:
E = C 0 C C 0 × 100
where C0 and C are indicator concentrations before and after the filters in the samples, respectively.
In each experiment, the filtration rate was maintained at 2.94 m3 day−1 and the system operated for six hours. Treated greywater samples were taken in 15, 30, 120, 180, 240, 300, and 360 minutes after the system operation. For studying the purification efficiency of the different filter materials, the performance of the system was assessed every time with two, three or all four filters. Meanwhile, the sand filter operated always on the system and every time one, two or three others were added. The water quality parameters of biochemical oxygen demand (BOD), chemical oxygen demand (COD), total dissolved solids (TDS), and turbidity were analyzed in samples according to the standard methods for the examination of water and wastewater [30]. All experiments were performed with three replications. Subsequently, based on the findings of the effluent water quality, the hierarchical clustering analysis using the Ward clustering method and squared Euclidean distances were applied to classify the studied adsorbents.

Clustering Methodology

A multivariate approach such as cluster analysis (CA) can be utilized to cluster the features or observations [31]. The hierarchical cluster analysis (HCA) is the extensively applied type of CA, which is based on the degree of similarity or dissimilarity of the features or observations, utilizing an amalgamation technique. The degree of similarity or dissimilarity can be estimated in various methods like Euclidean, squared Euclidean, and Manhattan distances. In addition, various amalgamation techniques like between-groups linkage, within-groups linkage, nearest neighbor, furthest neighbor, centroid clustering, median clustering, and Ward’s method can be applied [32].
Since each cluster consists of some points, numerous amalgamation techniques like Ward’s technique, average linkage, complete linkage, and simple linkage can be applied to compute the distance and similarity between different points [32,33,34]. In real-world applications, squared Euclidean distances and Ward’s method are usually selected. Let C i , C j , and C i j as i t h , j t h clusters, and combination of C i and C j . In Ward’s technique, the distance between C i and C j is computed by:
D ( C i . C j ) = i ( x r i ) 2 + j ( x r j ) 2 i . j ( x r i j ) 2
where r i , r j , and r i j are the corresponding centroids of C i , C j , and C i j , respectively. It should be noted that the squared Euclidean distances of x = ( x 1 , , x k ) and y = ( y 1 , , y k ) is defined by i = 1 n ( x i y i ) 2 . The structure of HCA algorithm is summarized in Appendix A.

3. Results and Discussion

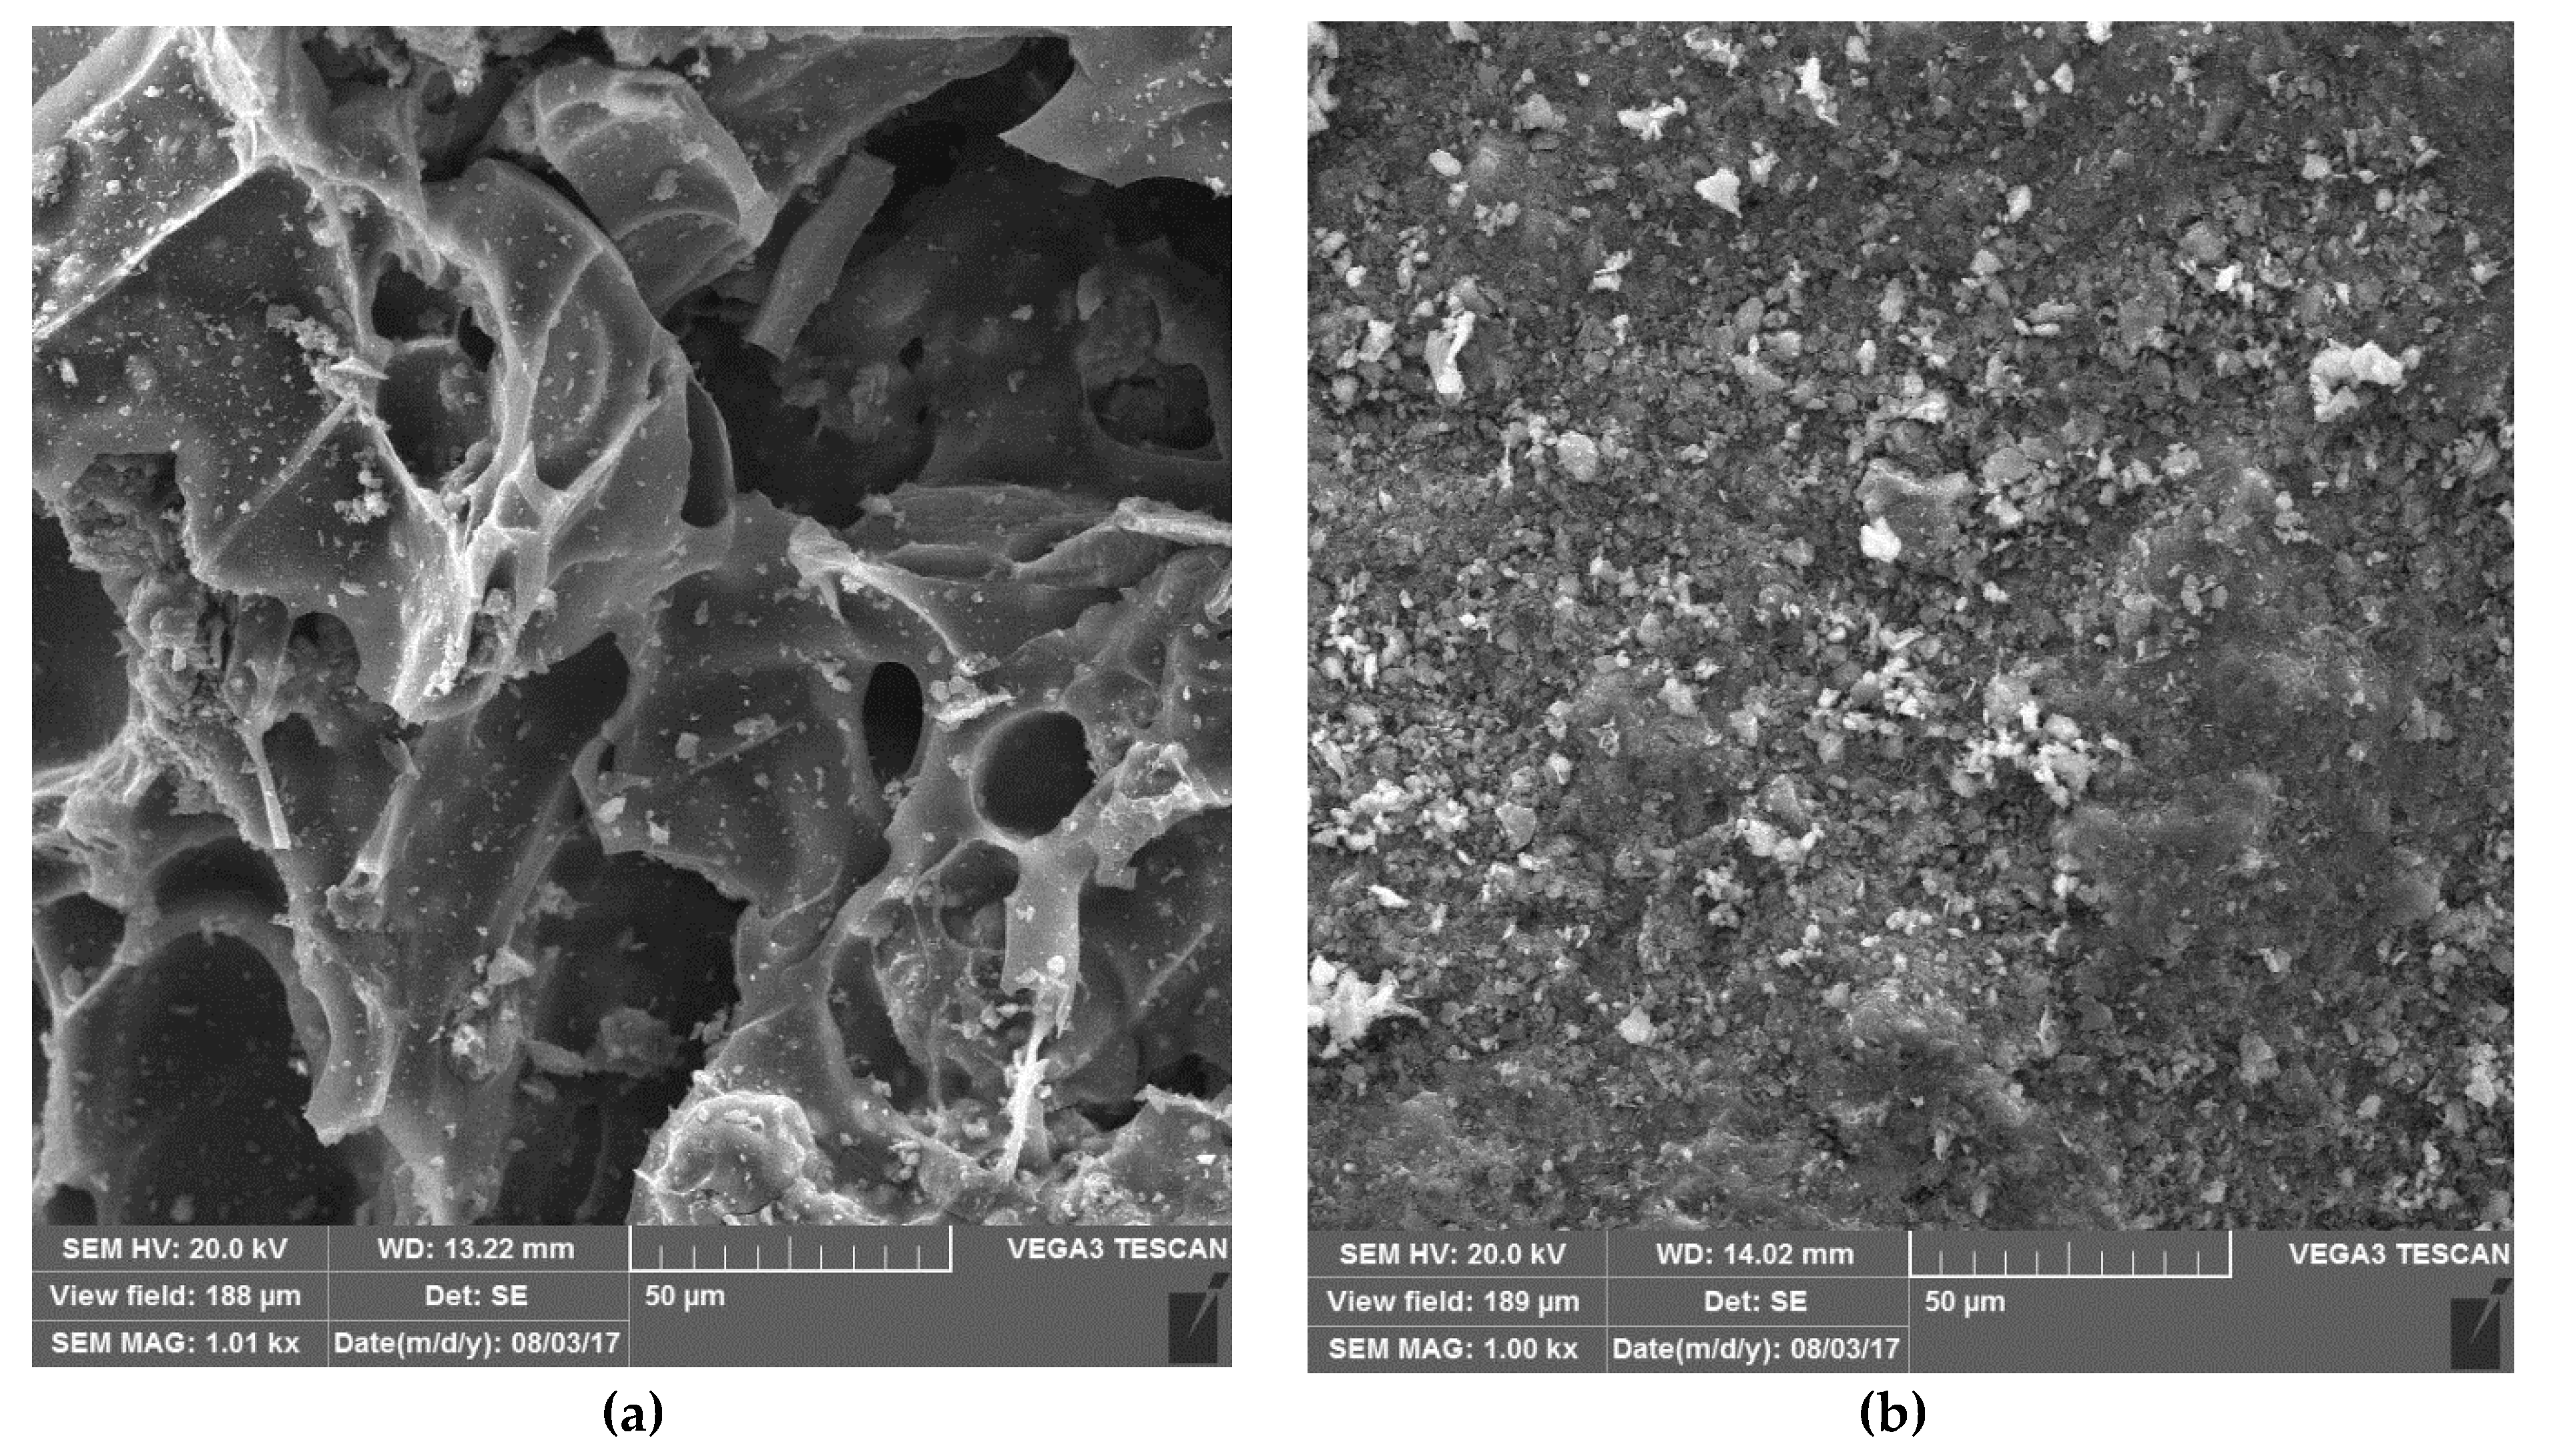
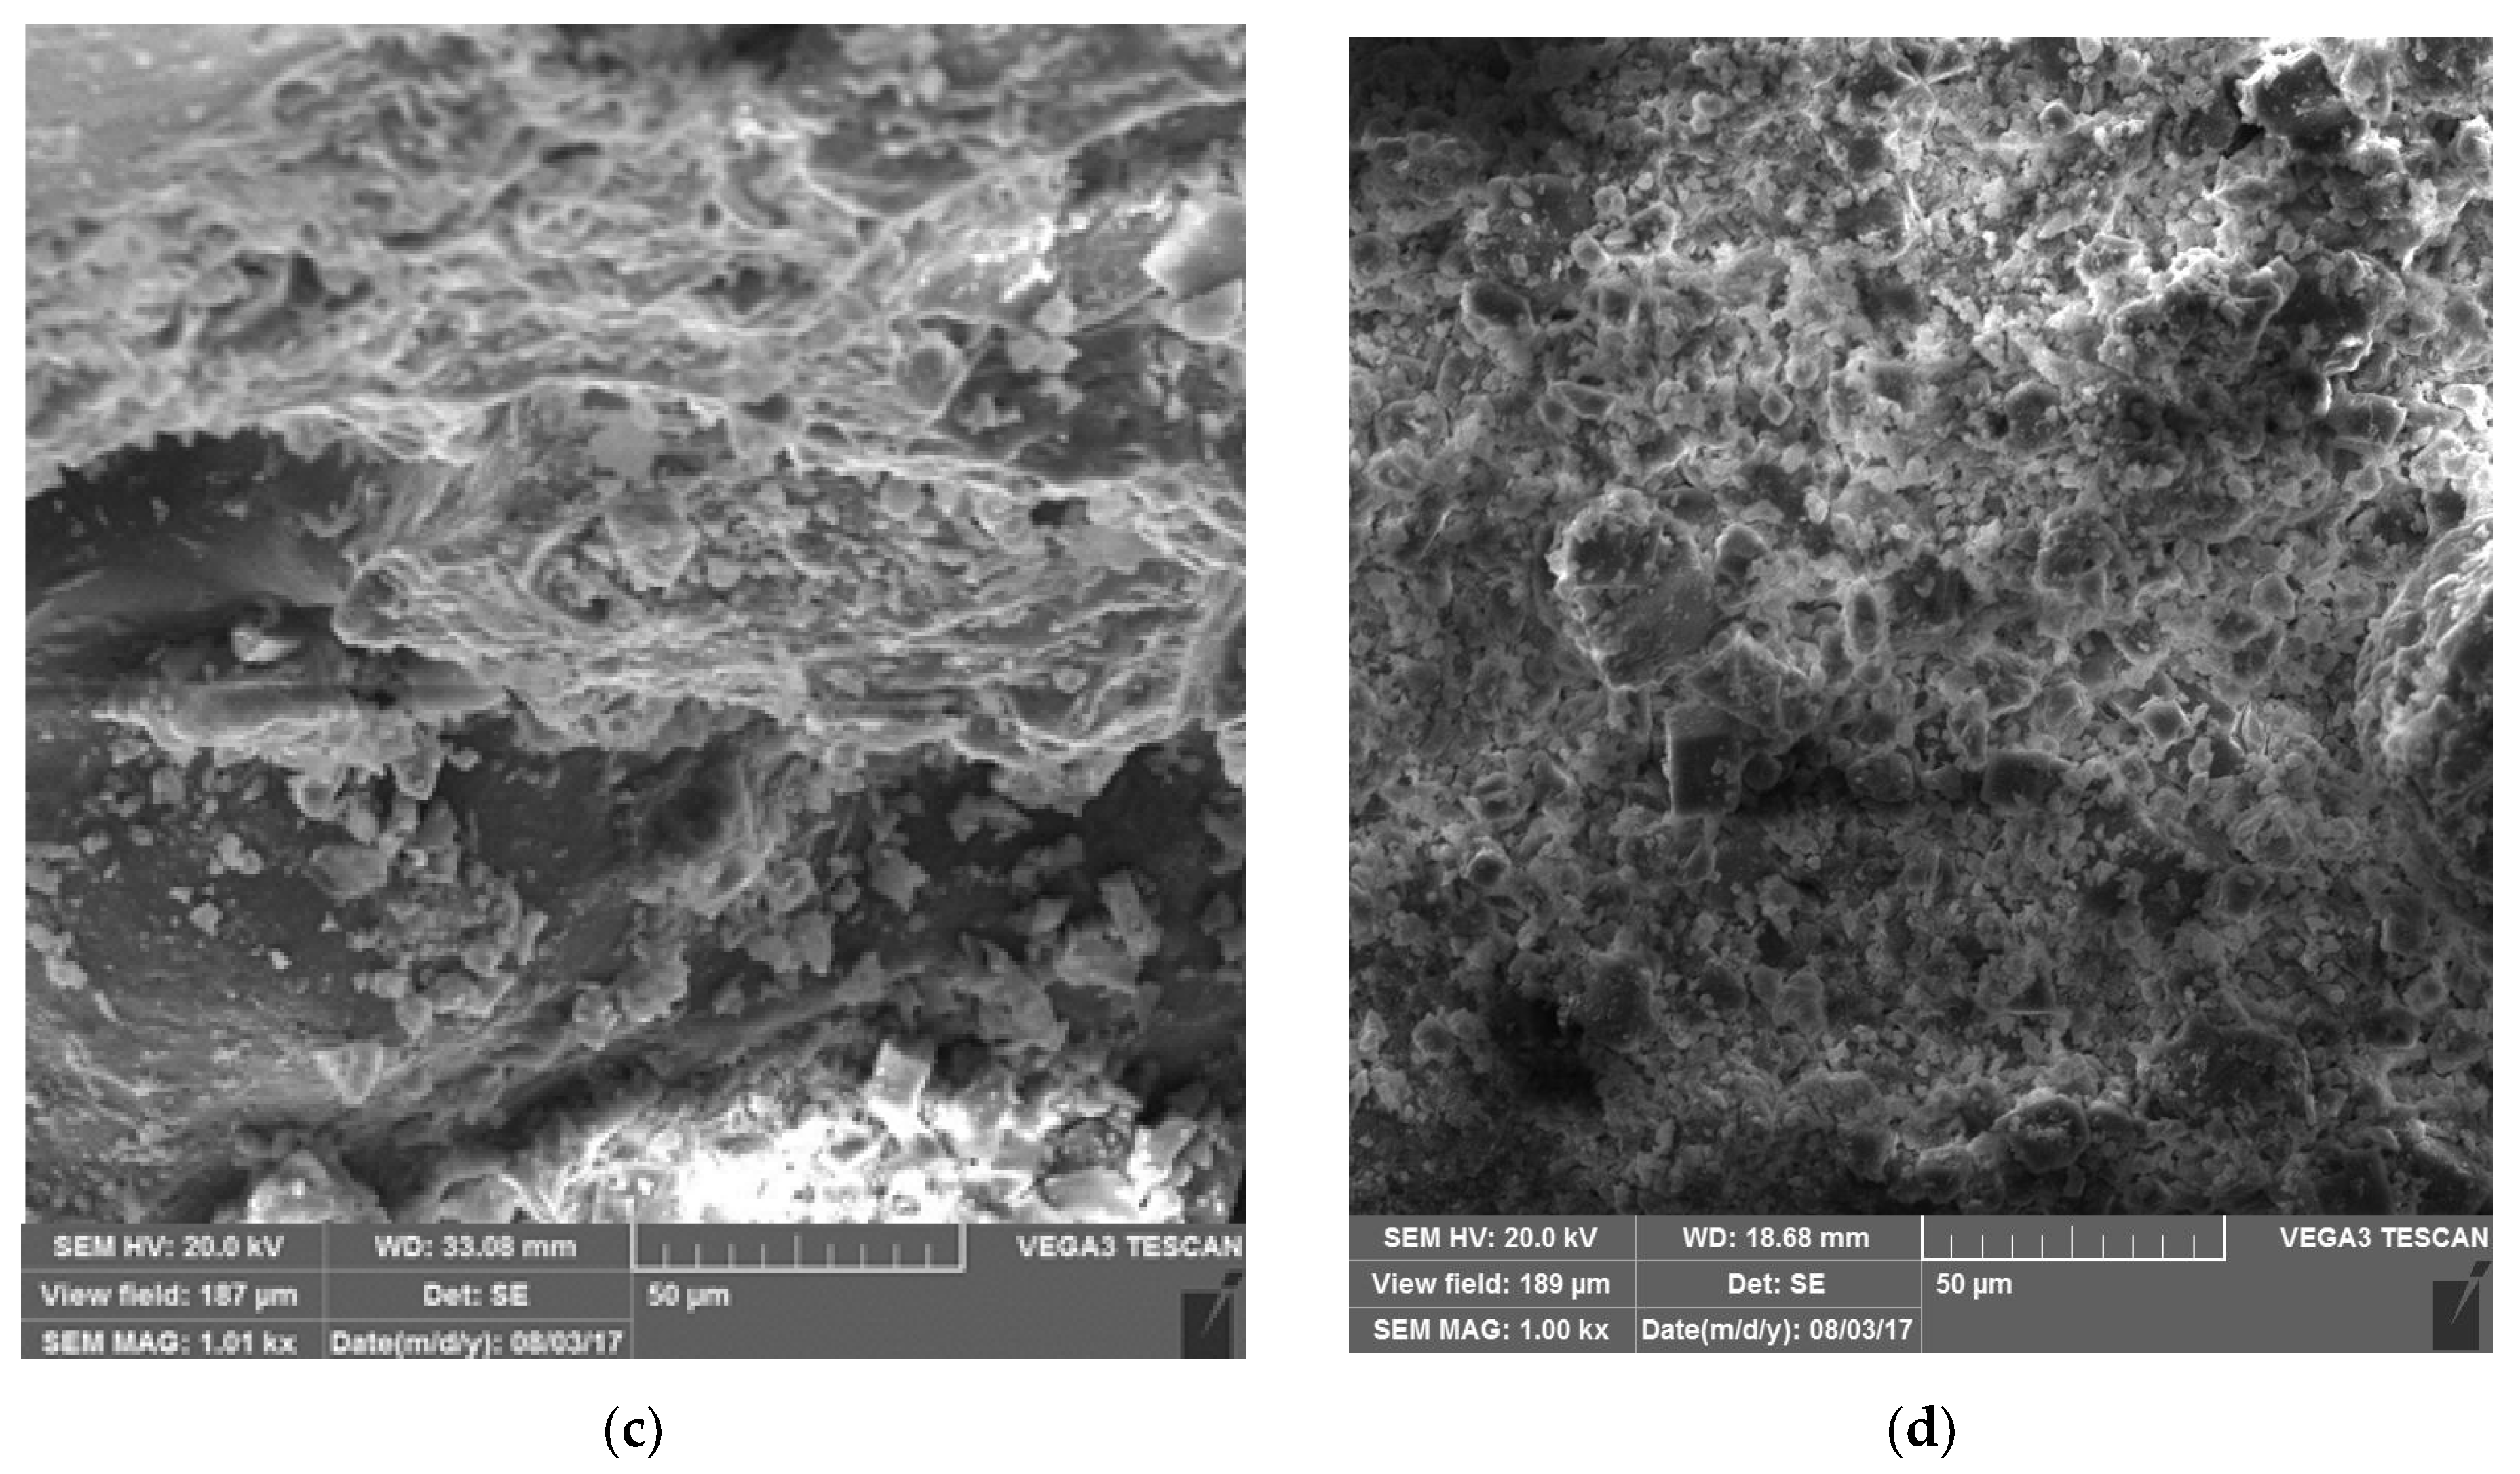
The analysis of the form and geometry of the grains of GAC, Z, P, and sand via scanning electron microscopy (SEM) was represented in Figure 2. The high porosity of GAC and rough surface of Z particles are the most important factors to make them suitable adsorbents. Likewise, less efficiency of sand and P is expected because of their lower porosity level. Anyway, availability and low cost of peat and sand make them inevitable to use.
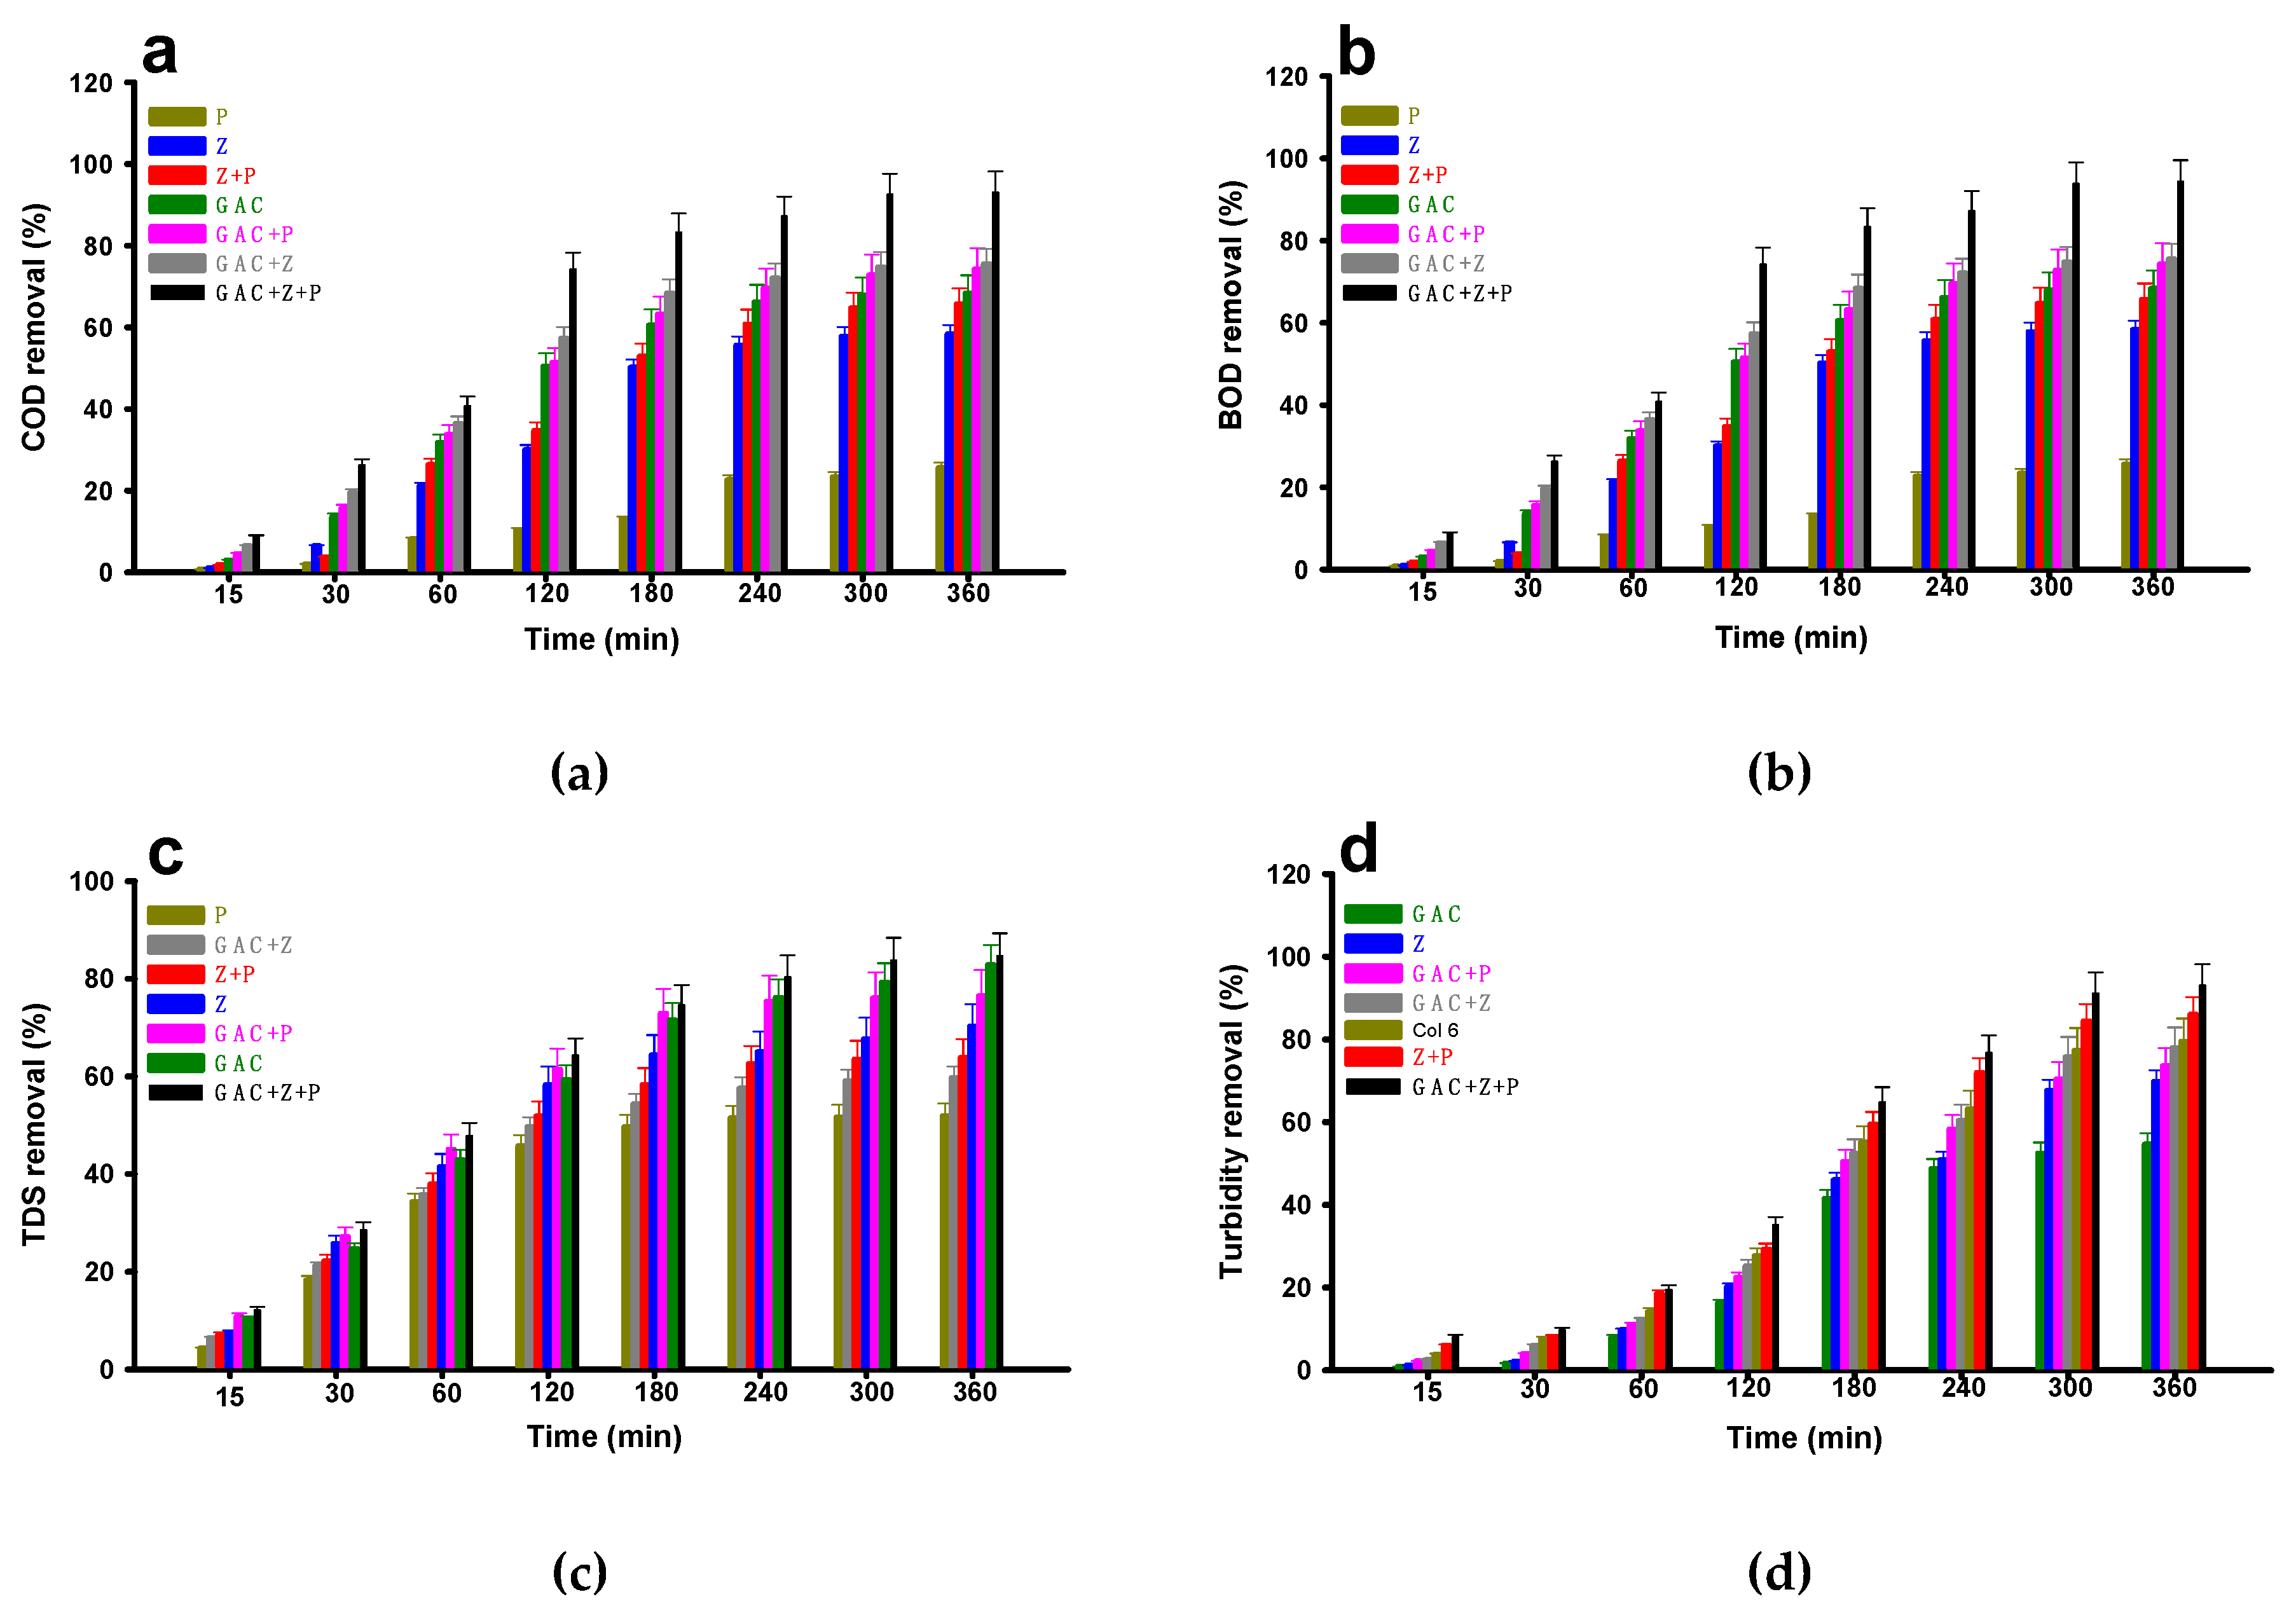
The performance of horizontal series filtration including various combinations of studied adsorbents to remove (%) COD, BOD, TDS, and turbidity overtime, was represented in Figure 3.
Table 3 represents the removal percent of COD, BOD, TDS, and turbidity by various combinations of the studied adsorbents within the HSF system after 6 h. The results indicate that the most removal was carried out in a combination of all three adsorbents. However, GAC that is extensively employed in domestic wastewater treatment is expensive, while, there are lots of natural Z and P. Thus, combining the low and high-cost materials will diminish the costs of wastewater treatment and may amend the adsorption capacity. The superiority of GAC to other materials is due to the most specific surface area (SSA), the great quantity of permeability, and the most porosity. On the other, the combinations containing peat had more removing of turbidity compared with others. The main reason is the sponge-like structure of peat that traps turbidity agents. This system represented better results compared to the researches of [8,9] in GW treatment after 4 h.
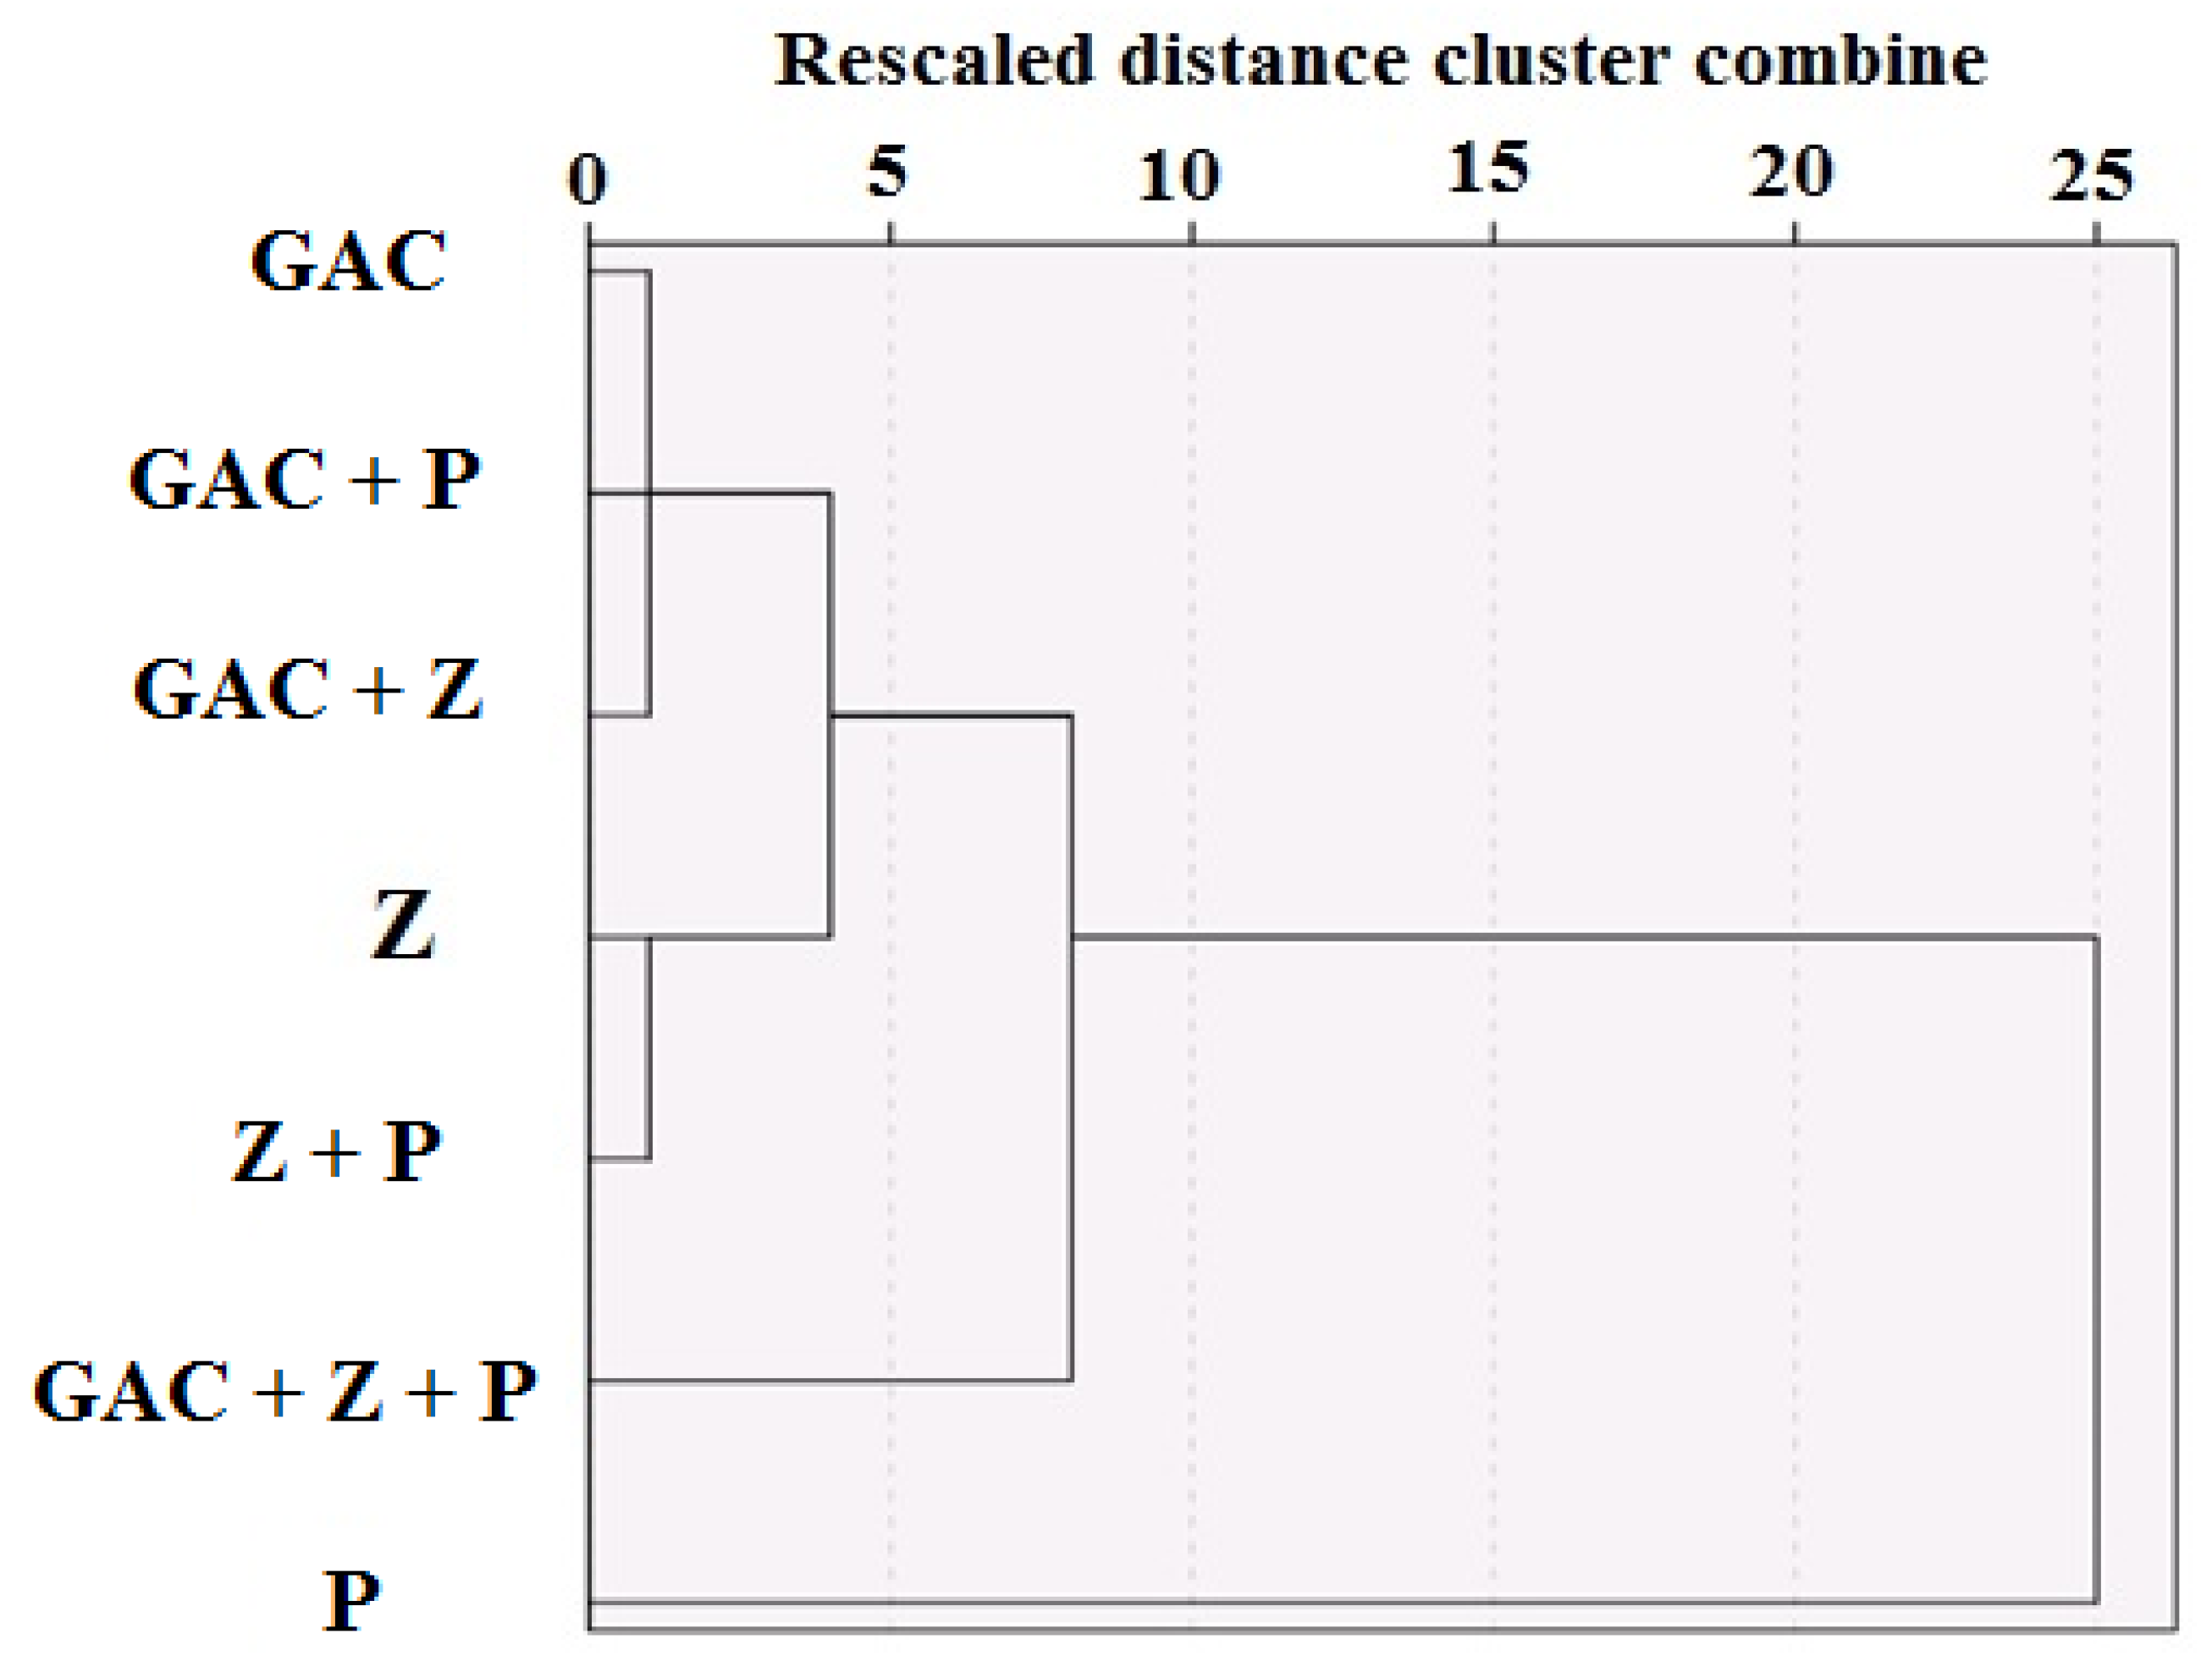
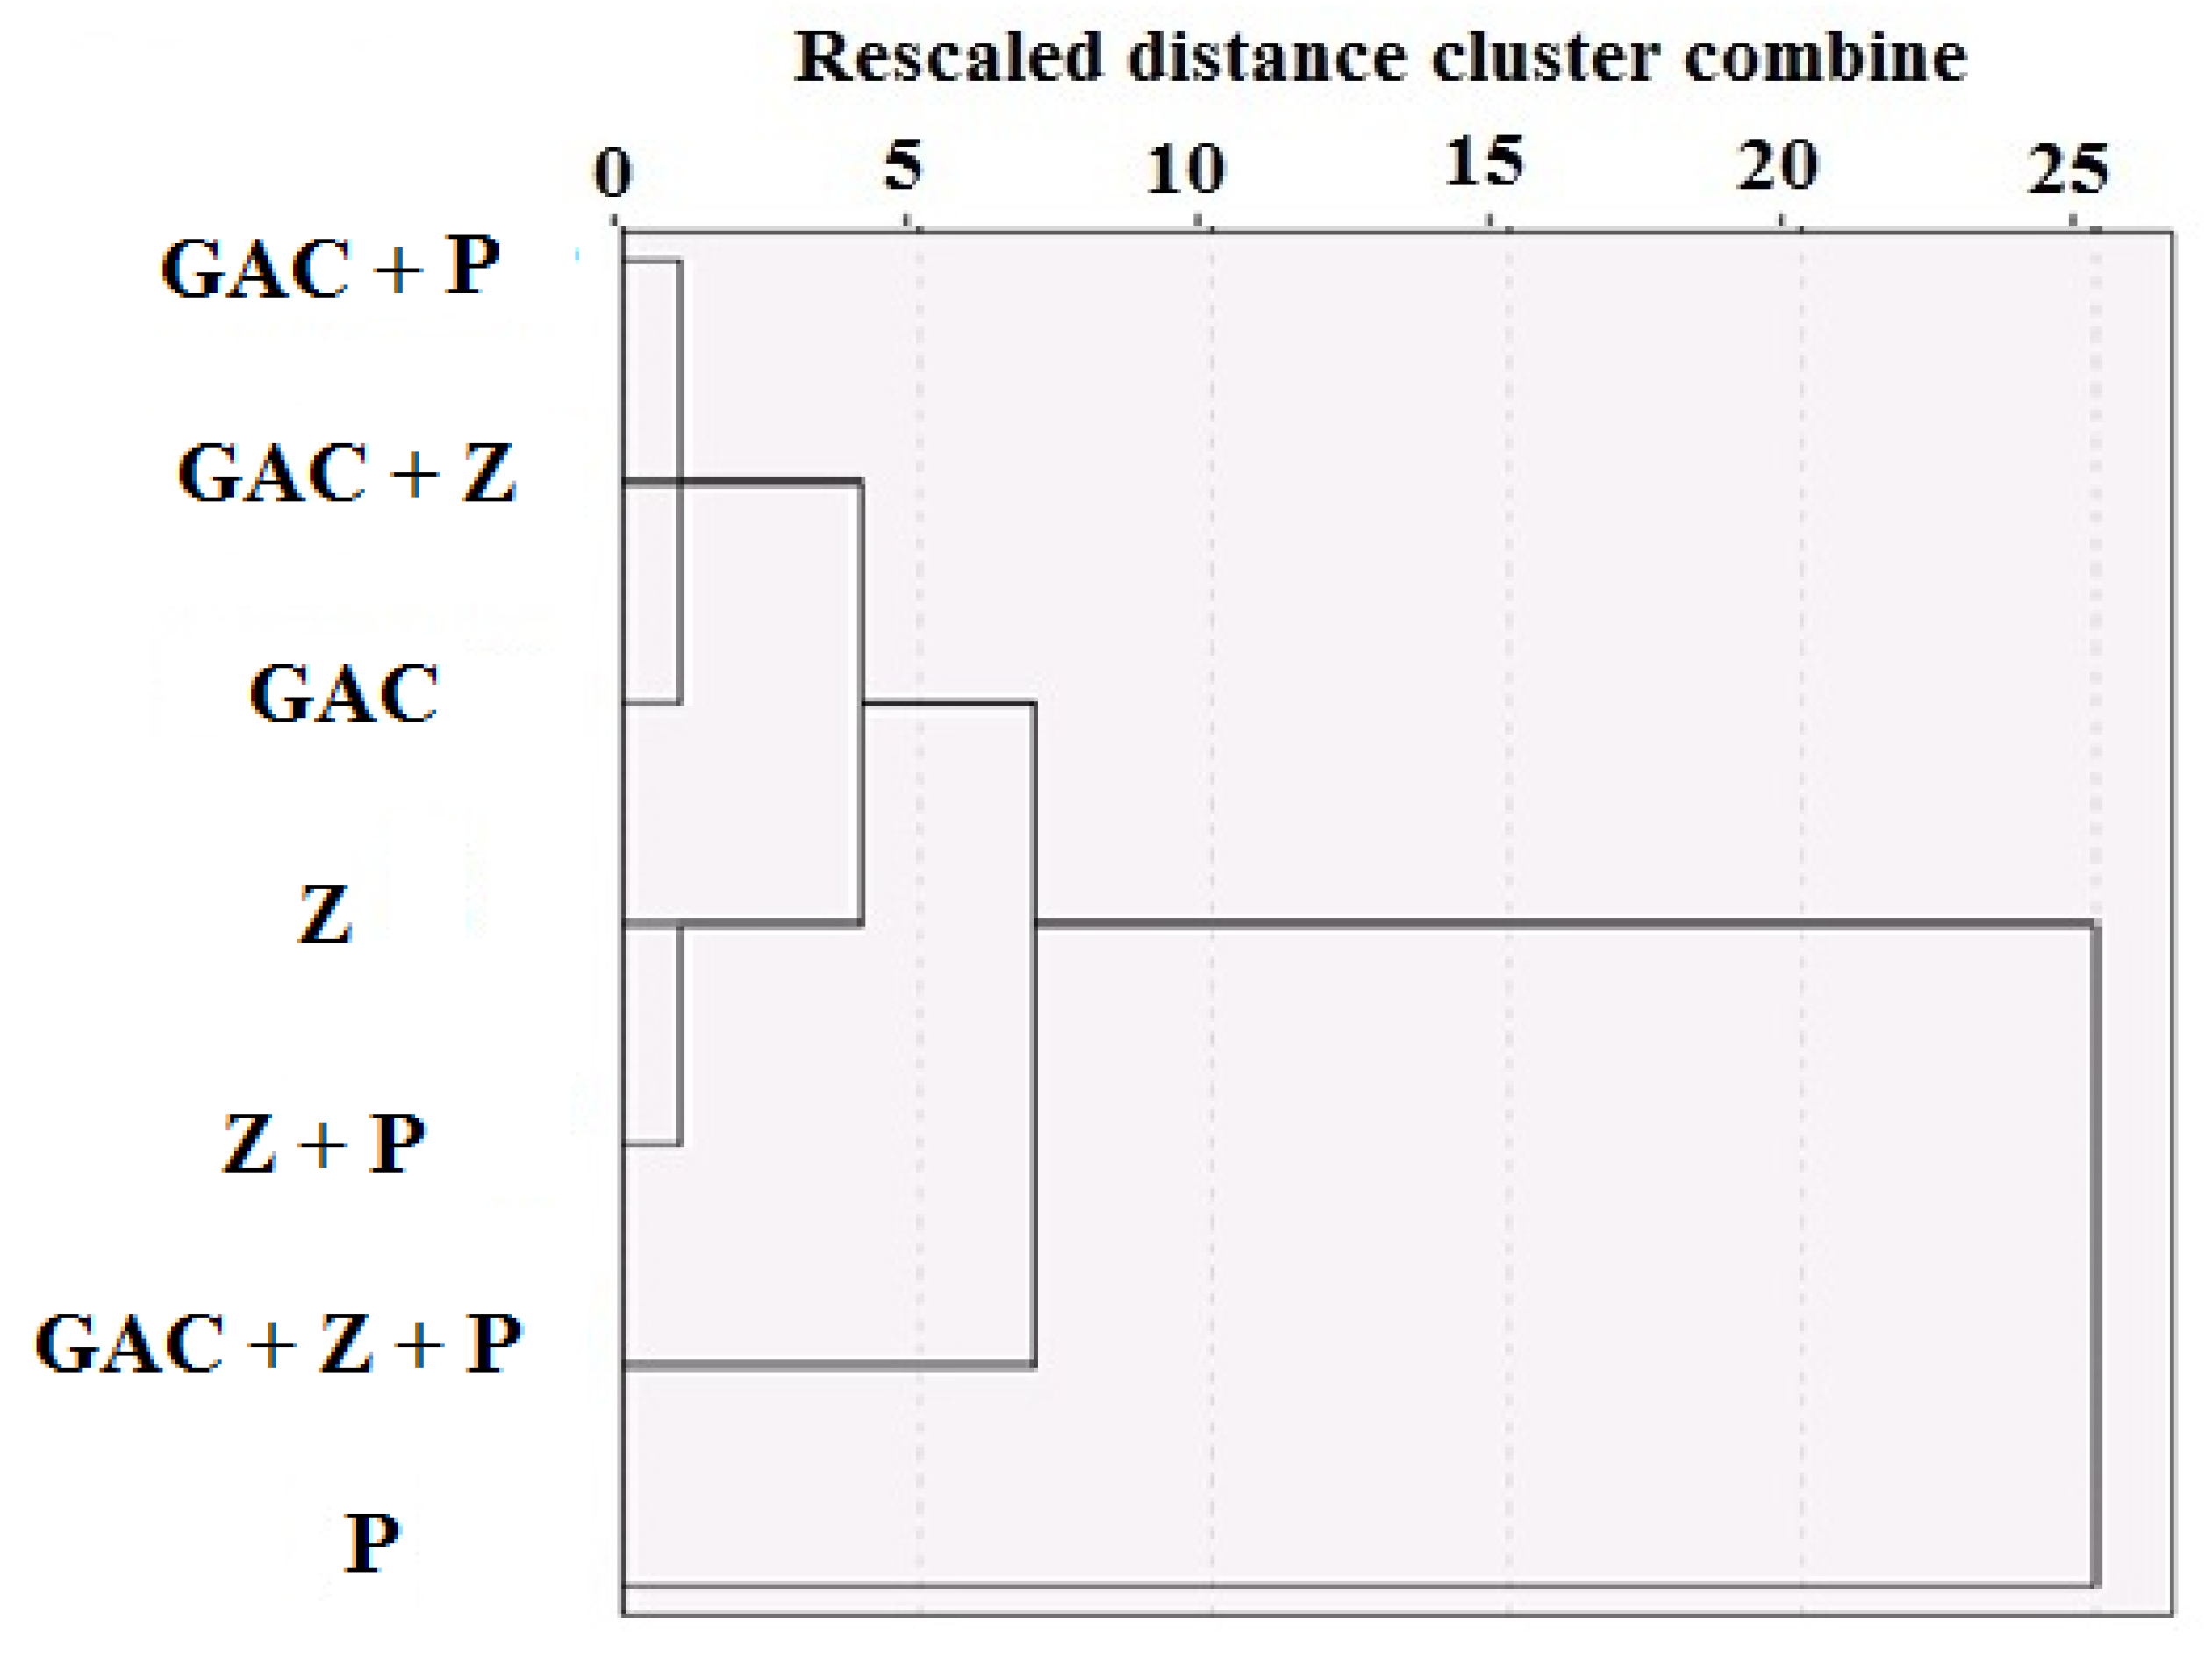
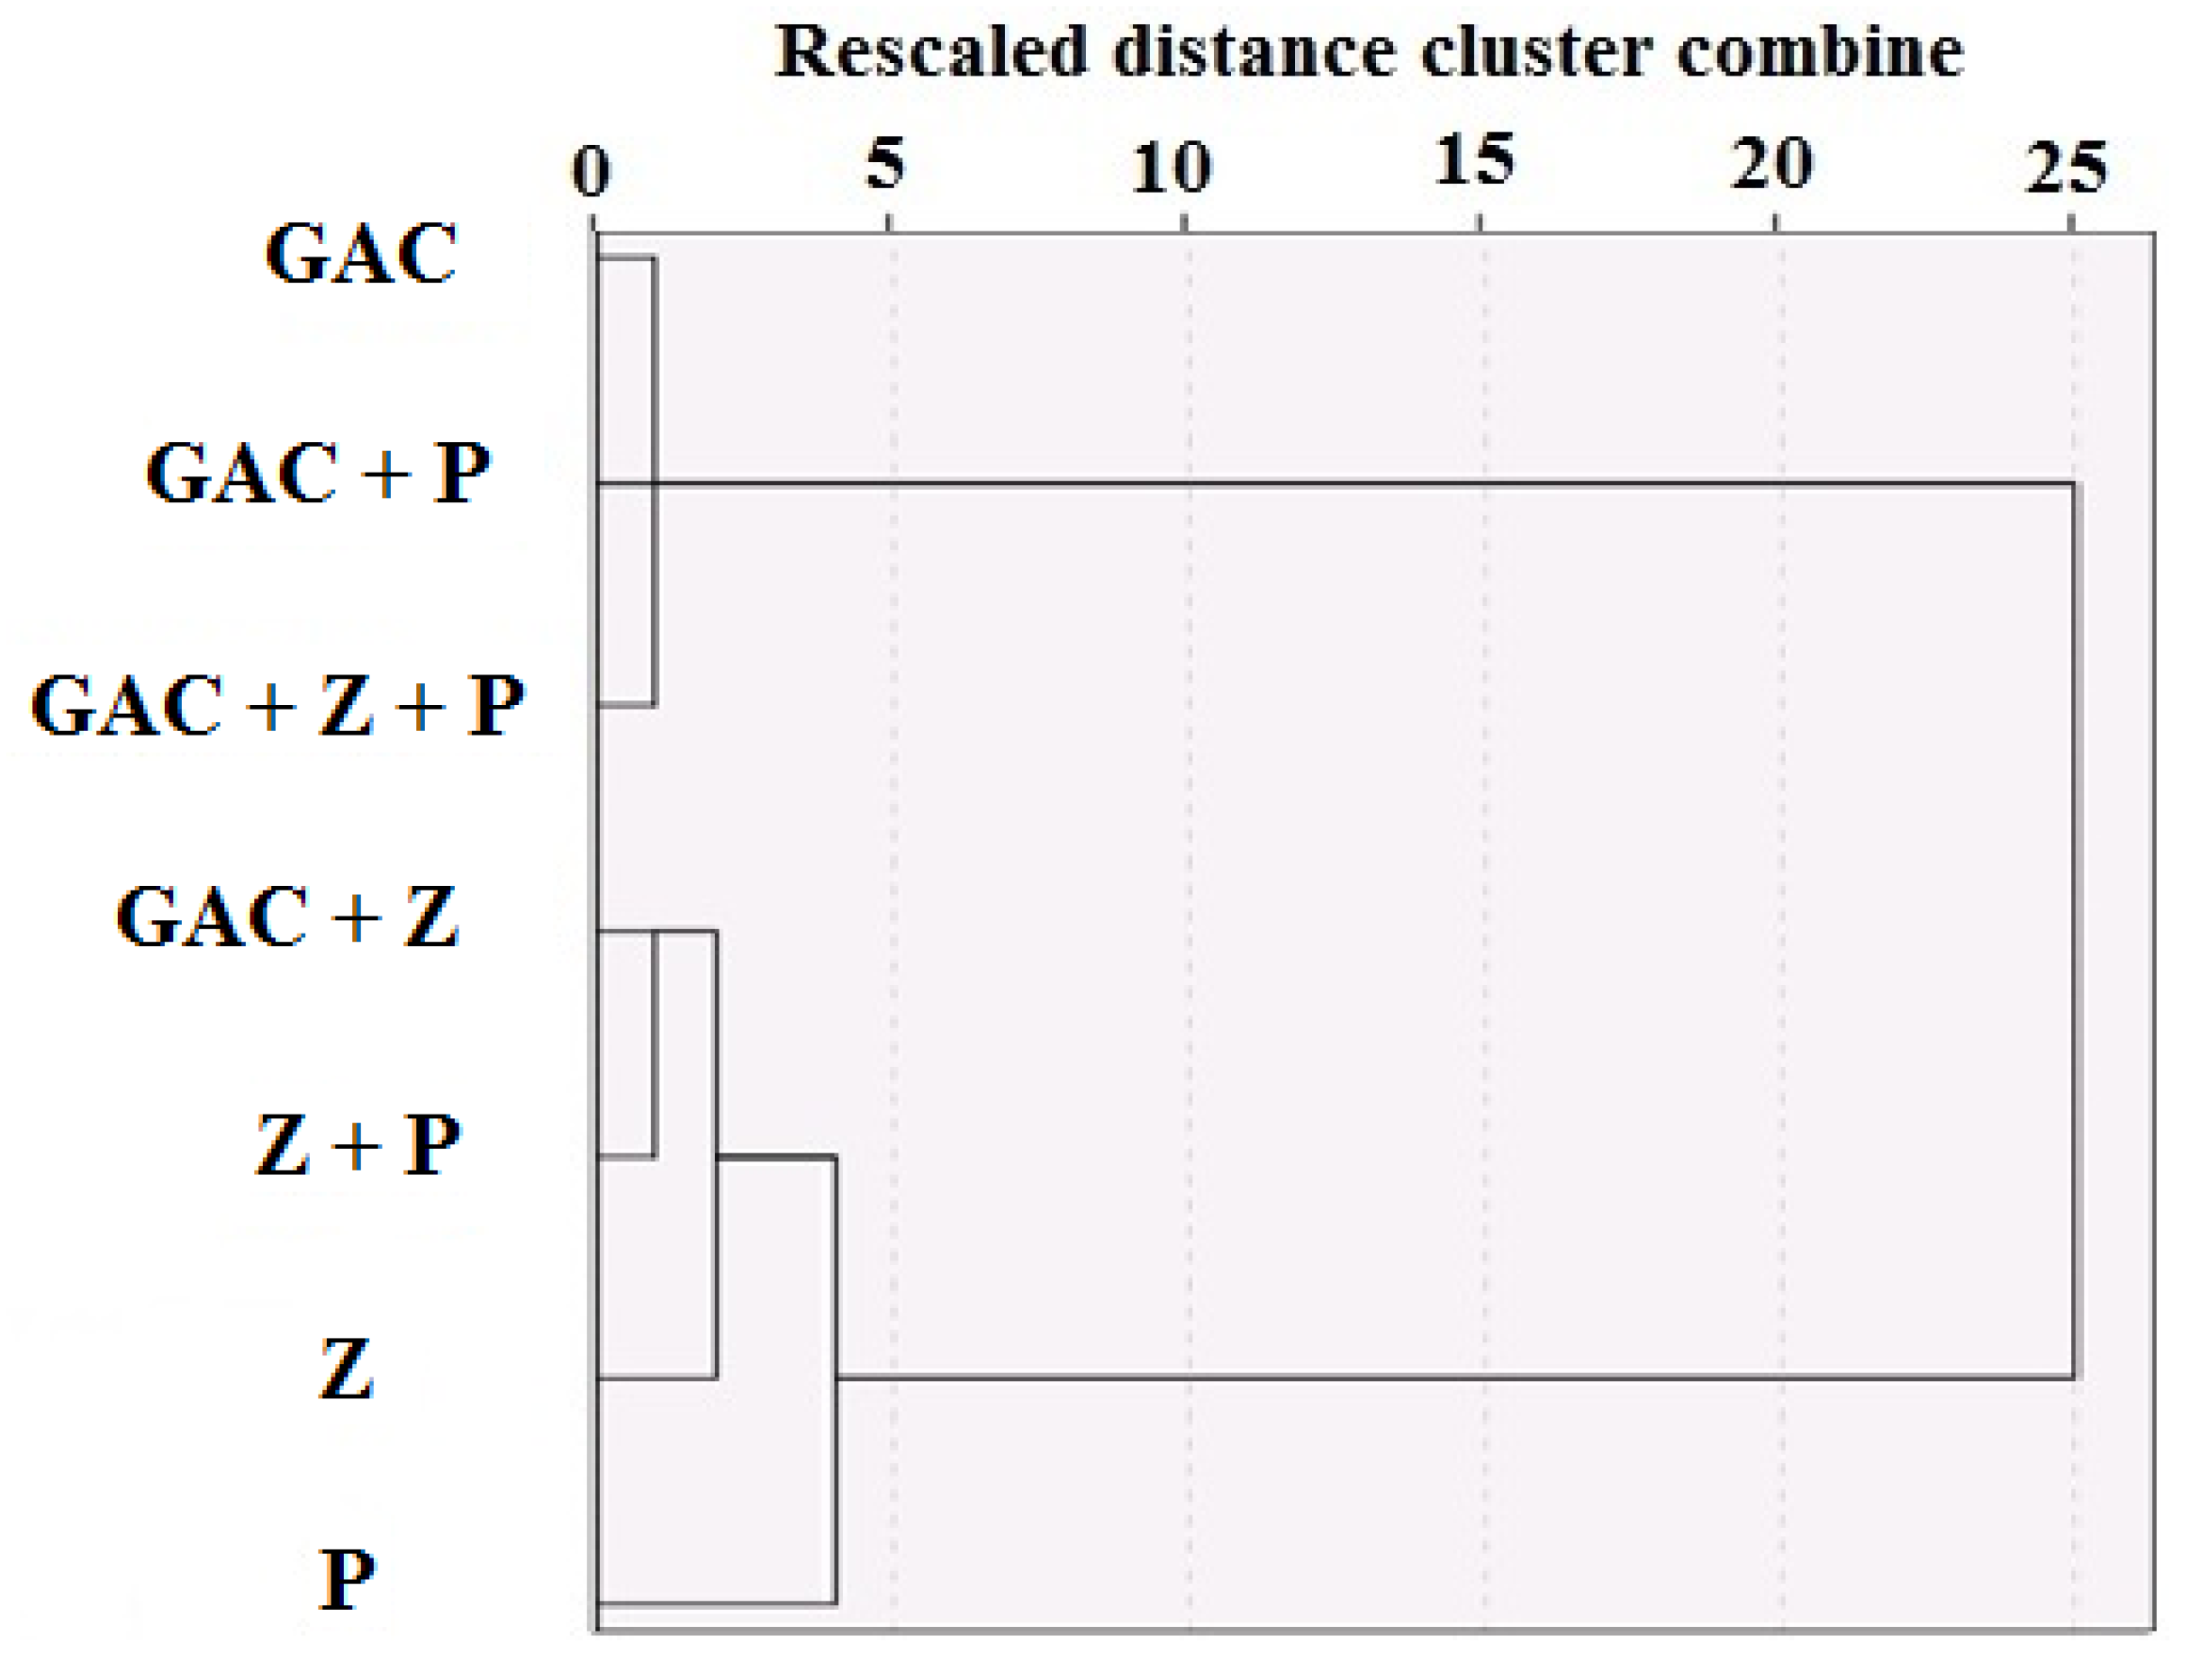
We were interested in clustering the materials based on COD, BOD, TDS, and turbidity. To compare and cluster the materials, the Ward clustering method and squared Euclidean distances were utilized. Figure 4, Figure 5, Figure 6, Figure 7 and Figure 8 summarize the results of the clustering analysis. As these figures indicate, there were significant differences between these materials. Based on the similarity of level 95% (similarity more than 95%, or distance lower than 5%), for COD and BOD (Figure 4 and Figure 5), these materials could be clustered in three clusters including cluster 1: GAC, GAC+P, GAC+Z, Z, and Z+P; cluster 2: GAC+Z+P; cluster 3: P. According to clustering analysis, four treatments of GAC, GAC+P, GAC+Z, and Z have the same COD and BOD adsorption rate. This means that in cluster 1, Z and Z+P treatments as inexpensive materials could be used instead of commercial adsorbents such as GAC for greywater treatment. In Iran, the approximate cost of the zeolite, peat, and granular activated carbon employed for municipal wastewater treatment is about 100, 100, and 900 US$ ton− 1, respectively, while the cost of the GAC+Z+P would be lower than 367 US$ ton−1. The relative cost of the GAC+Z+P used in the current research was much lower than granular activated carbon as a commercial adsorbent. Therefore, by combining the low-cost (zeolite and peat) and high-cost (granular activated carbon) materials, not only the expenses of greywater treatment will be decreased but also the uptake capacity may enhance.
According to Table 3 and Figure 4 and Figure 5, the maximum removal of COD and BOD from greywater (more than 90 percent) occurred by the combination of three adsorbents (GAC+Z+P), among the three clusters. After that, the Z+P combination with removal percent of about 68 was suggested because of the lower cost compared with other combinations in cluster 1. Peat adsorbent in cluster 3 performed the minimum removal of COD and BOD in comparison with other clusters. Indeed, the great potential of GAC+Z+P to eliminate COD and BOD from greywater may be related to the cation exchangeability and the hydrophilic surface of Z and P as well as the hydrophobic surface and great surface area of GAC [23]. It is found that COD and BOD are eliminated from greywater by GAC+Z+P via chemical and physical adsorption mechanisms. Chemical adsorption is predominant for zeolite and peat, whereas physical adsorption is predominant for GAC [23].
For TDS (Figure 6), we reached two clusters including cluster 1: GAC, GAC+P, and GAC+Z+P; and cluster 2: GAC+Z, Z+P, Z, and P. According to Figure 6 and Table 3, performance of GAC adsorbent (with TDS removal of 84.37 percent) is equivalent to combination of three materials (with TDS removal of 84.65 percent) in cluster 1. Some researchers have confirmed this capability of GAC in TDS reduction [35]. After that, among the cluster 2 materials, peat with TDS removal percent of 53.99 was suggested due to the lower cost.
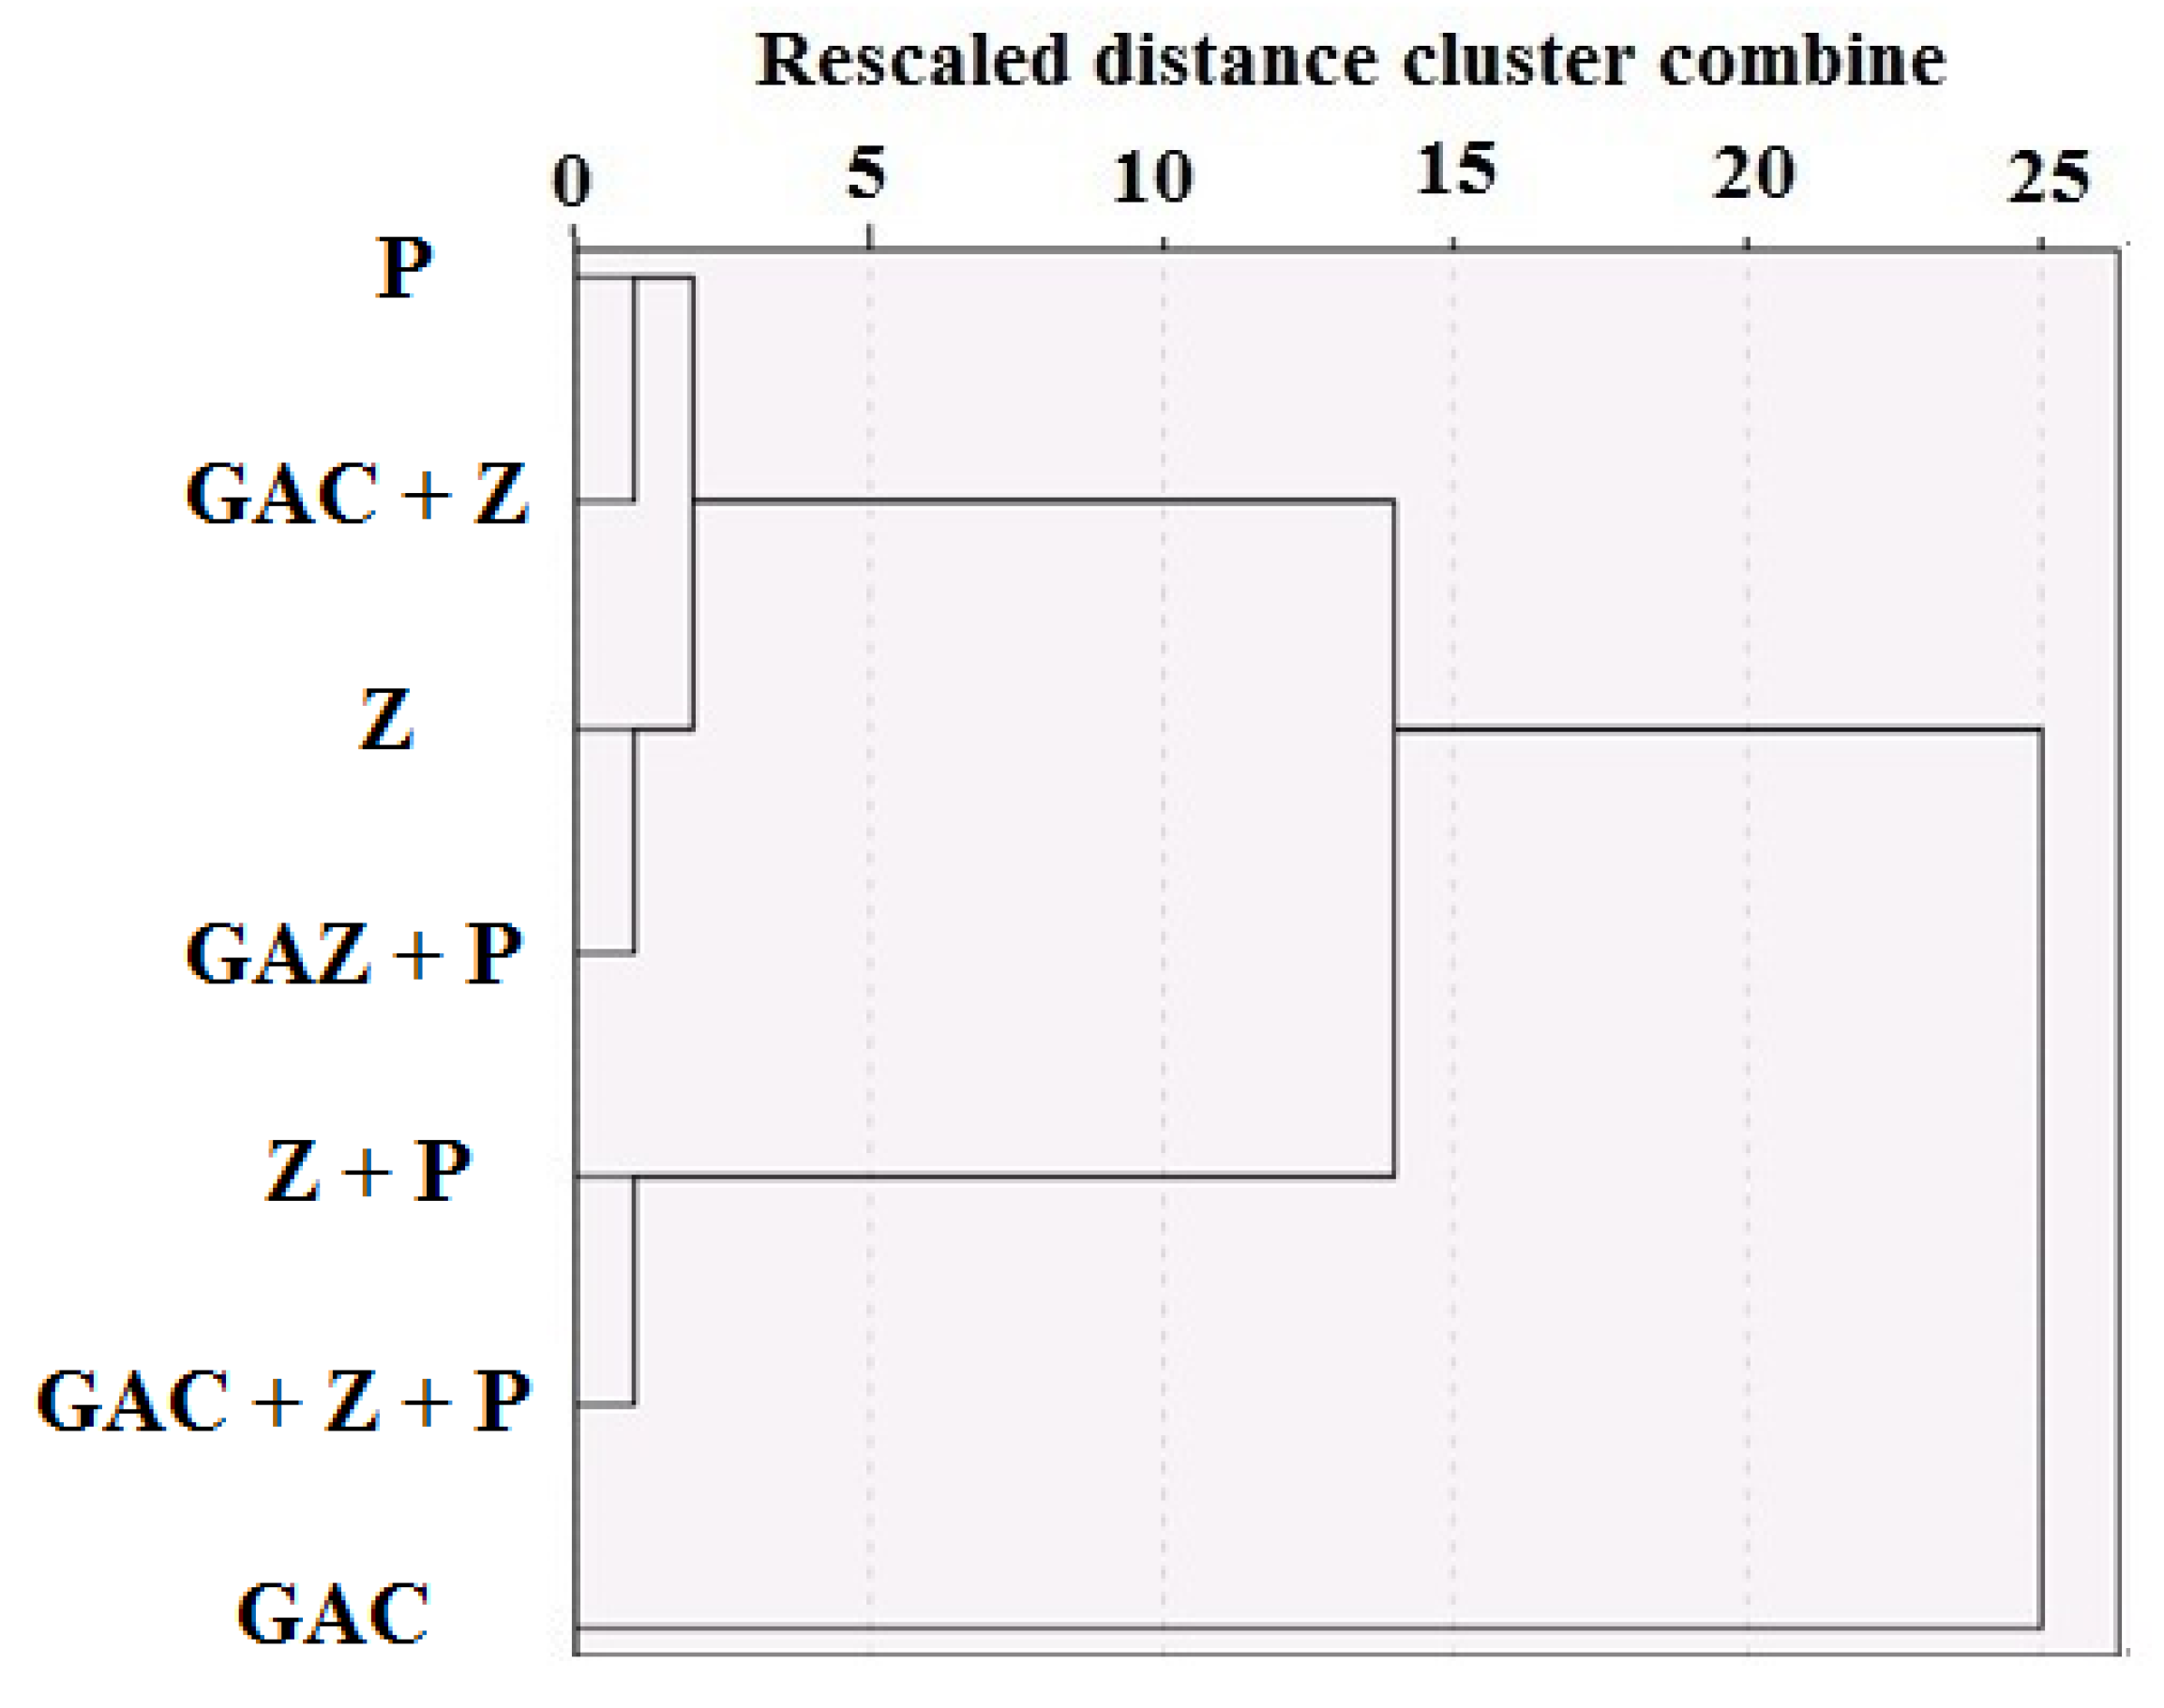
In the case of turbidity (Figure 7), the materials were clustered in three clusters including cluster 1: P, GAC+Z, Z, and GAC+P; cluster 2: Z+P and GAC+Z+P; and cluster 3: GAC. According to Figure 7 and Table 3, cluster 2 had the best performance to reduce the turbidity, in which GAC+Z+P removes about 93.01% of initial turbidity after 360 min. After that, the removal percent of turbidity was 88.03% by Z+P and 81.74 by P that ranked in second and third places, respectively. Indeed, the great potential of GAC+Z+P to eliminate turbidity from greywater may be related to the cation exchangeability and the hydrophilic surface of Z and P as well as the hydrophobic surface and great surface area of GAC [23]. Because of the complex surface of GAC+Z+P that includes a broad range of pore size distribution, multiple mechanisms are involved in the uptake of turbidity from greywater. Therefore, by combining the low-cost (Z and P) and high-cost (GAC) adsorbents, not only the expenses of greywater treatment will be decreased but also the uptake capacity may enhance. From a practical point of view, Z+P combination and P are suggested for turbidity removal from greywater due to the lower cost and acceptable performance.
As Figure 3 indicates, the required time in the equilibrium state in all treatments was about 300 min. The removal percentage of COD, BOD, TDS, and turbidity improved with the contact time and reaches equilibrium after 300 min for GAC+Z+P. 99.45%, 99.45%, 99%, and 98% of initial COD, BOD, TDS, and turbidity concentrations, respectively, were removed by using GAC+Z+P within 300 min of circulation. Therefore, this system should be worked in closed-loop until the treated greywater becomes appropriate to employ for restricted and unrestricted irrigation of landscape as well as groundwater recharge.
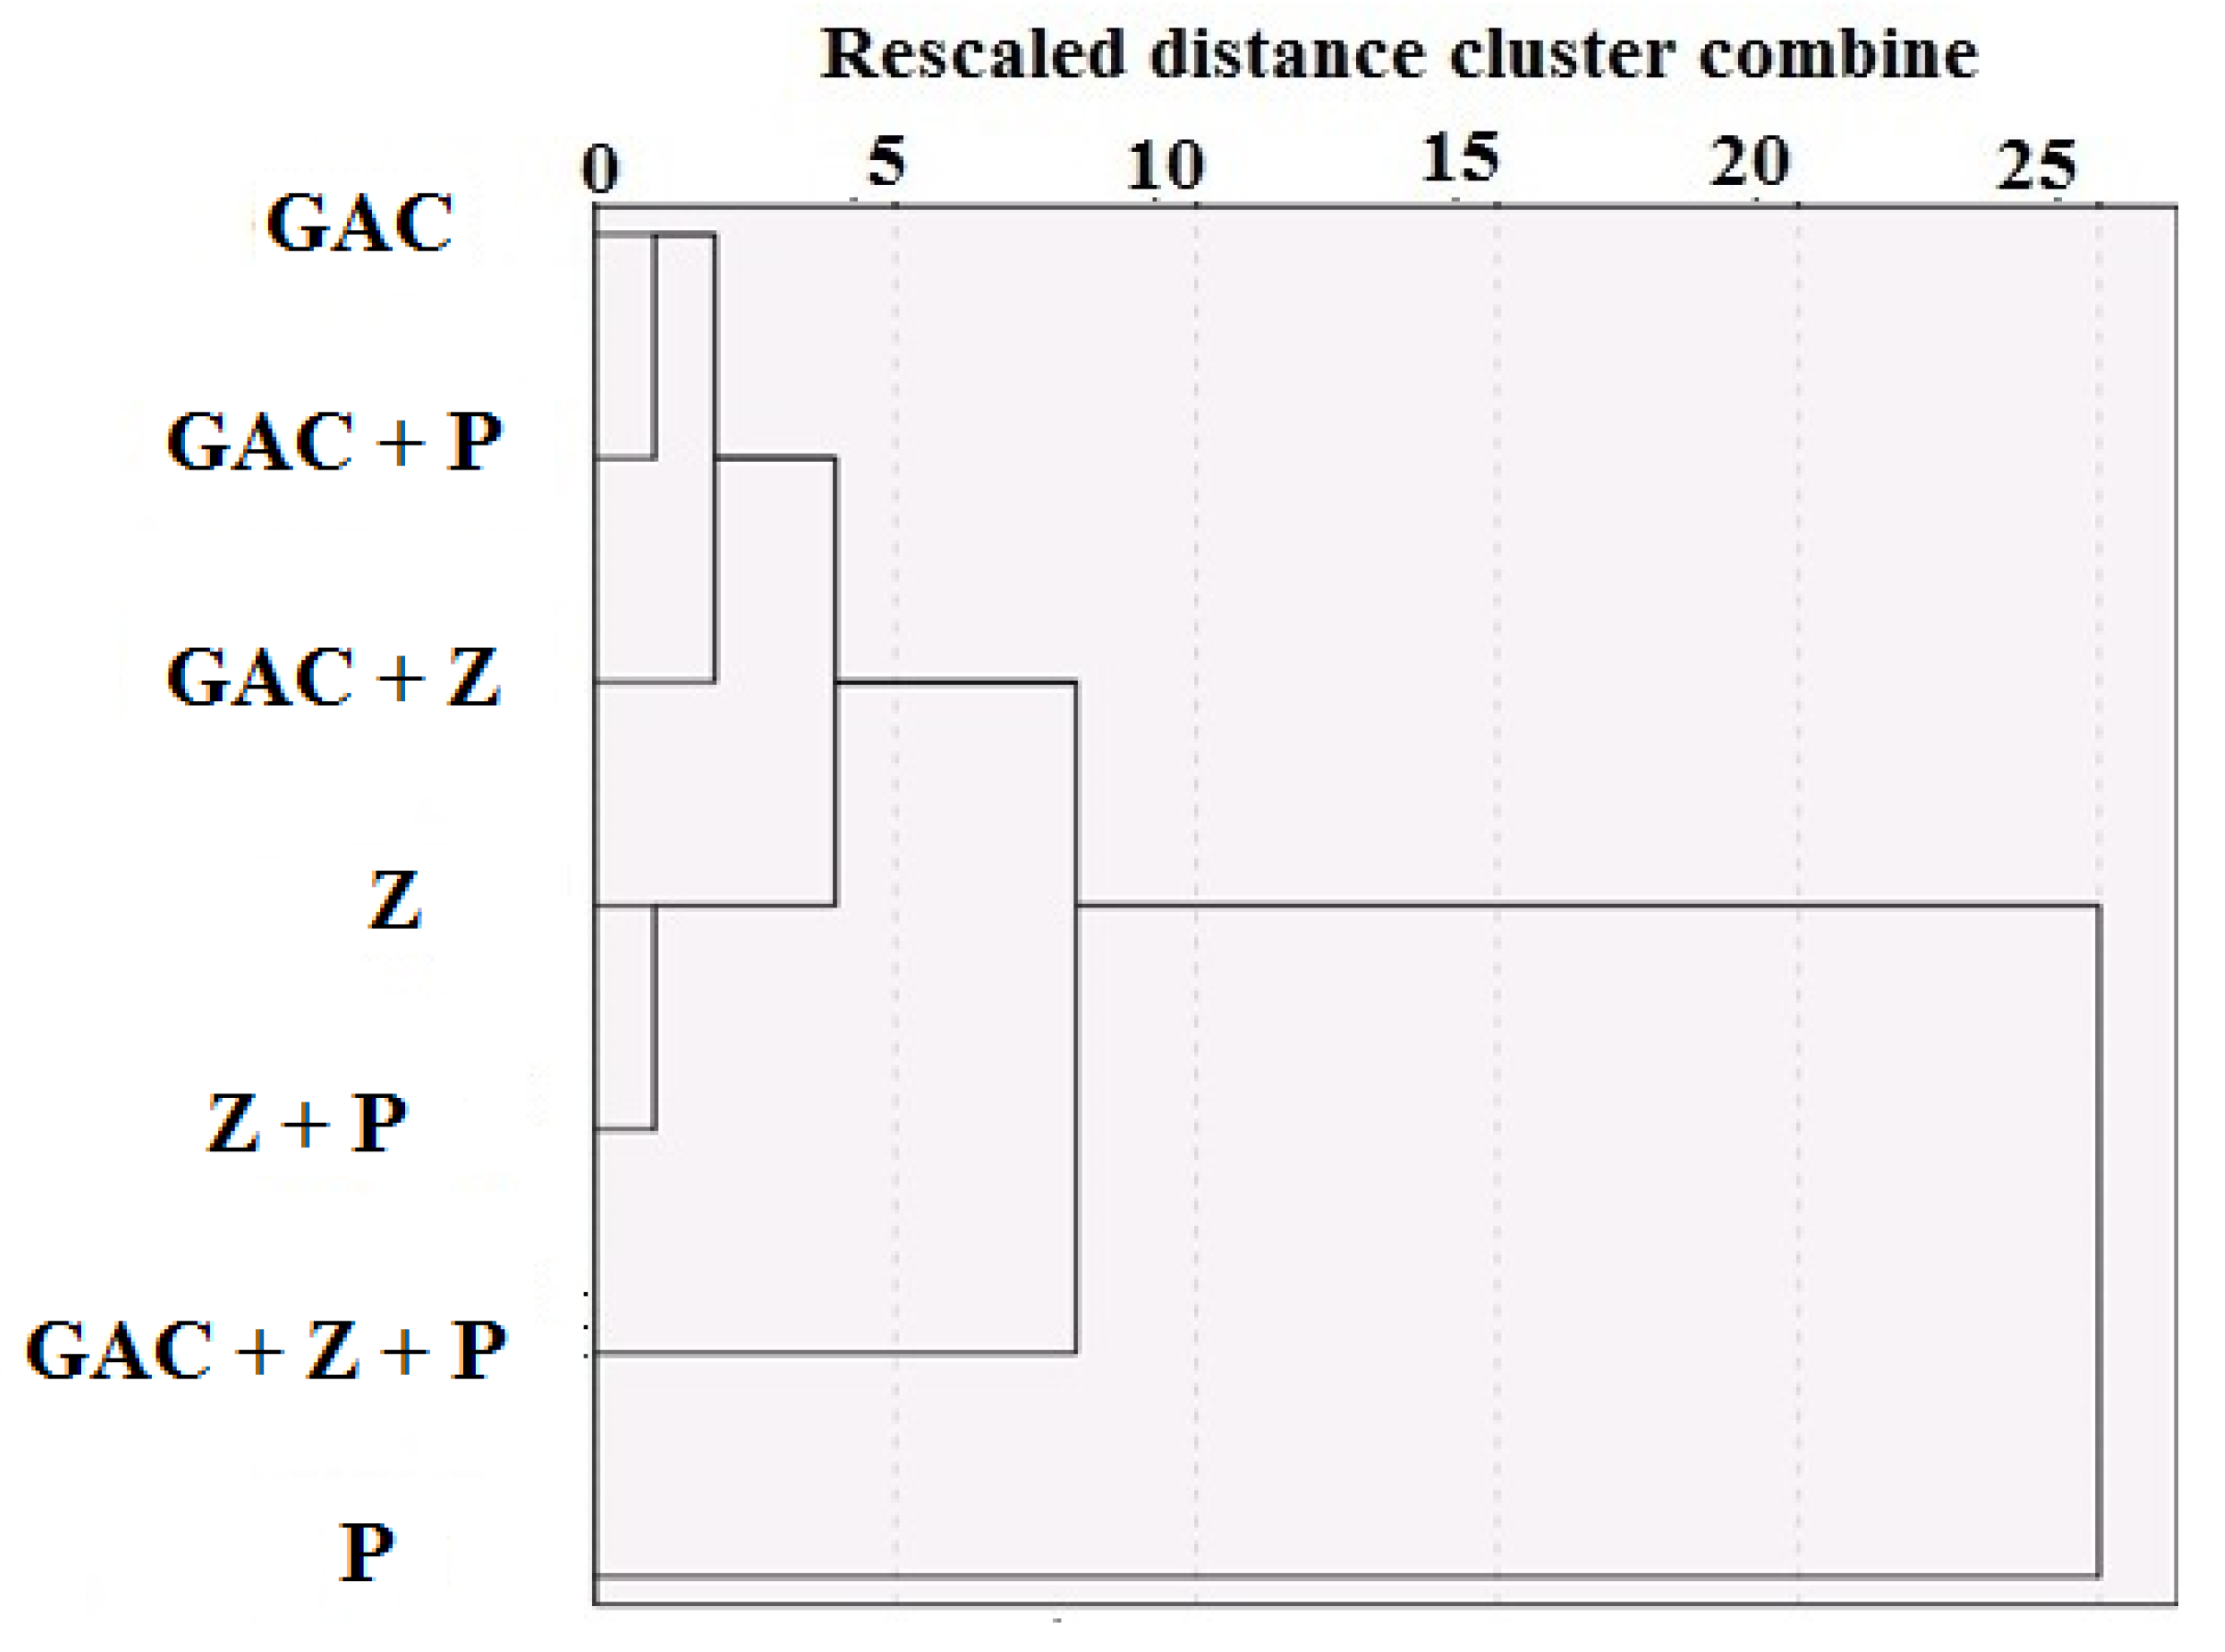
In addition, by considering the simultaneous changes of COD, BOD, TDS, and turbidity together (total features), according to Figure 8 and Table 4, these materials could be clustered in three different clusters including cluster 1: GAC, GAC+P, GAC+Z, Z, and Z+P; cluster 2: GAC+Z+P; and cluster 3: P. According to these results, the existence of GAC in the filter components increased the filter ability to reduce the total features. However, based on the lower cost and more availability of peat and zeolite, the combinations of Z+P and Z can be suggested as the more favorable materials to improve greywater quality. This finding is in agreement with [23] that in studying the greywater treatment using single and combined adsorbents in batch experiments, concluded the best performance of a combination of activated carbon, zeolite, and nano zero-valent iron.
The treated greywater from HSF using GAC+Z+P is proper for employing in restricted and unrestricted irrigation of landscape as well as groundwater recharge according to Iranian standards [23], where the residuals COD, BOD, TDS, and turbidity in treated greywater are 25.29 mg L−1, 15.85 mg L−1, 429.80 mg L−1, and 12.93 NTU, respectively. These results are in agreement with [36] that used the greywater treated by a horizontal sub-surface flow constructed wetland reactor to irrigate the landscape in small communities of Morocco. In comparison between raw greywater and tap water, those irrigated by treated greywater appear to grow faster, because of the richness of this water by nutrients. [37] analyzed and verified the samples experimentally to indicate the improvement of physical, chemical, and biological factors to assure the quality of the treated greywater from an anaerobic filter used in irrigation in Iraq. [38] used a bio-remediation way of greywater recycling in India and concluded that the reuse of the recycled effluents could be prescribed for domestic use, irrigation, and landscaping. [21] indicated that user opinions towards greywater treatment and reuse were only favorable towards non-potable purposes, chiefly because of perceived pollution or lack of trust in the level of treatment suggested by the treatment system. [39] proposed the treated greywater achieved by gravity governed filtration method and disinfection for domestic, agriculture, and also for aquifers artificial recharge to prevent saltwater intrusion along the coastal aquifers in Kuwait. Table 4 summarizes the rate of similarity between the materials for Ward’s method based on COD, BOD, TDS, turbidity, and total features, respectively. The results of Table 4 confirmed the aforementioned output of dendrograms. For example, for COD removal from greywater, the similarities of various combinations were GAC and Z 96%, GAC and P 75%, GAC and GAC+P and GAC+Z 99%, GAC and Z+P 96%, GAC and GAC+Z+P 92%, Z and P 75%, Z and GAC+P and GAC+Z 96%, Z and Z+P 99%, Z and GAC+Z+P 92%, and similarity between P, GAC+P, GAC+Z, Z+P, and GAC+Z+P 92% was 75%. The greater the similarity between the two combinations, the more similar their performance in GW treatment.
An economic analysis of the horizontal series filtration was performed using the rate of return (ROR) method as described in the previous researches [39,40,41]. Briefly, with regard to the comparison between the ROR and the minimum attractive rate of return (MARR), a project can be rejected or accepted. The project is accepted economically when the ROR ≥ MARR and rejected economically when ROR < MARR. To compare two or more projects, extra investment analysis is conducted. To assess the performance of GAC, P, Z, and GAC+Z+P in an industrial horizontal series filter for greywater treatment, the economic analysis based on the Iranian market (Table 5) was carried out. The initial investment, annual cost, annual incomes, salvage value, useful life, and MARR for each project are presented in Table 5. From the results presented in this Table, the net present worth for each project is calculated and set as 0.
N P W G A C = 200 4200 ( P A , i % , 7 ) + 77000 ( P A , i % , 7 ) + 100 ( P F , i % , 7 ) = 0
N P W P = 125 2500 ( P A , i % , 7 ) + 65000 ( P A , i % , 7 ) + 85 ( P F , i % , 7 ) = 0
N P W Z = 150 3200 ( P A , i % , 7 ) + 720000 ( P A , i % , 7 ) + 95 ( P F , i % , 7 ) = 0
N P W G A C + Z + P = 160 3300 ( P A , i % , 7 ) + 87600 ( P A , i % , 7 ) + 935 ( P F , i % , 7 ) = 0
By solving the equations 3 to 6, the RORs for GAC, P, Z, and GAC+Z+P were obtained as 18%, 12%, 12%, and 40%, respectively. The industrial horizontal series filter using P and Z as adsorbents are not economical since their RORs are lower than 15%, whereas the industrial horizontal series filter using GAC and GAC+Z+P as adsorbents are economical since their RORs are higher than 15%. Between GAC and GAC+Z+P adsorbents in an industrial horizontal series filter, GAC+Z+P is selected since its ROR (40%) is higher than GAC (18%). In addition, this triple combined adsorbents have a lower initial investment. The volume of greywater, which can be treated by GAC, P, Z, and GAC+Z+P in an industrial horizontal series filter is 8000, 5600, 6600, and 8760 m3 year−1, respectively. The weight of adsorbents which were used in this system is depended on regeneration efficiency. Thus, more attention should be performed to study the reusability of the GAC, P, Z, and GAC+Z+P in an industrial horizontal series filter. The weight of the GAC, P, Z, and GAC+Z+P to treat this volume of greywater can be approximated 15,480, 124,488, 22,320, and 54,000 kg year−1, respectively. The performance of GAC, P, Z, and GAC+Z+P to treat greywater in an industrial horizontal series filter is 1, 22, 3.3, and 6.16 g L−1, respectively.

4. Conclusions

A horizontal series filtration system including four materials (sand, GAC, zeolite, and peat) was tested to treat the greywater. The analysis of the data from the filtration tests indicated that GAC+Z+P was the best combination for removing COD, BOD, TDS, and turbidity from greywater, while the performance of GAC in BOD, TDS, and especially COD removal was impressive in GAC+Z+P combination. In addition, peat was more advisable to remove turbidity. Thereafter, the hierarchical clustering technique was applied to classify the adsorbents. The results illustrated that there were significant differences between these materials’ performances (similarity more than 95%). Based on the similarity of level 95%, GAC+Z+P combination was suggested for COD and BOD removal, GAC was proposed for TDS reduction, and Z+P combination was preferred to eliminate the greywater turbidity. Generally, considering the adsorbent costs, clustering analysis for simultaneous reduction of COD, BOD, TDS, and turbidity indicated that Z+P and Z combinations were suitable choices. Finally, based on the proper greywater purification operation of the HSF, treated greywater was displayed as a viable water resource for non-potable reuse objectives like irrigation of orchards, pastures, cereals, and other crops by surface or trickle irrigation.

Author Contributions

M.B., M.J.A., and M.R.M. conceived and designed the experiments; M.B. and M.J.A. carried out the experiments; M.R.M. analyzed the data; M.B. and M.J.A. wrote the paper with aid of M.R.M. All authors have read and agreed to the published version of the manuscript.

Funding

This research received no external funding.

Acknowledgments

The authors would like to thank laboratory of water engineering, Fasa University for providing the facilities to perform this research.

Conflicts of Interest

The authors declare no conflict of interest. The sponsors had no role in the design of the study; in the collection, analyses, or interpretation of data; in the writing of the manuscript; or in the decision to publish the results.

Appendix A. Clustering Methodology

Indeed, the most usual methods in clustering are Ward’s method [33] and the squared Euclidean distances technique. In the HCA technique, the features are demonstrated in a dendrogram (a tree-like diagram). Agglomerative HCA and Divisive HCA are two important HCA types. In Agglomerative HCA, at first, each point is considered as a distinct cluster. Next, stepwise, the closest clusters are combined to a larger cluster according to the rate of distance or similarity between the clusters. In Divisive HCA, at first, we consider whole points as a cluster. Then, stepwise, we split the far points to new clusters according to the rate of distance or similarity between the clusters or points. The distance or similarity is estimated by various distances like Manhattan, Euclidean, or squared Euclidean. The structure of HCA algorithm can be summarized as following:
Step (1): consider each point as a distinct cluster. Step (2): compute the distance matrix between the points. Step (3): merge the closest clusters. Step (4): update the distance matrix. Step (5): repeat the third and fourth steps until gaining just one cluster.

References

  1. Friedler, E.; Galil, N.I. On-site greywater reuse in multi-storey buildings: Sustainable solution for water saving. In Proceedings of the 2nd Int. Conf. on Efficient Use and Management of Urban Water Supply, Tenerife, Spain, 2–4 April 2003. [Google Scholar]
  2. Venot, P.; Molle, F.; Hassan, Y. Irrigated Agriculture, Water Pricing and Water Savings in the Lower Jordan River Basin; International Water Management Institute: Colombo, Sri Lanka, 2007. [Google Scholar]
  3. Friedler, E.; Hadari, M. Economic feasibility of on-site greywater reuse in multi-storey buildings. Desalin 2006, 190, 221–234. [Google Scholar] [CrossRef]
  4. Pidou, M.; Avery, L.; Stephenson, T.; Jeffrey, P.; Parsons, S.A.; Liu, S.; Memon, F.; Jefferson, B. Chemical solutions for greywater recycling. Chemosphere 2008, 71, 147–155. [Google Scholar] [CrossRef] [PubMed]
  5. Chang, Y.; Cornel, P.; Wagner, M. Treatment of greywater for urban water reuse. In Proceedings of the IWA Conference– Advanced Sanitation, Aachen, Germany, 12–13 March 2007. [Google Scholar]
  6. Halalsheh, M.; Dalahmeh, S.; Sayed, M.; Suleiman, W.; Shareef, M.; Mansour, M.; Safi, M. Grey water characteristics and treatment options for rural areas in Jordan. Bioresour. Technol. 2008, 99, 6635–6641. [Google Scholar] [CrossRef] [PubMed]
  7. Chrispim, M.C.; Nolasco, M.A. Greywater treatment using a moving bed biofilm reactor at a university campus in Brazi. J. Clean. Prod. 2017, 142, 290–296. [Google Scholar] [CrossRef]
  8. Shamabadi, N.; Bakhtiari, H.; Kochakian, N.; Farahani, M. The investigation and designing of an onsite grey water treatment systems at Hazrat-e-Masoumeh University, Qom, IRAN. Energy Procedia 2015, 74, 1337–1346. [Google Scholar] [CrossRef] [Green Version]
  9. Zipf, M.S.; Pinheiro, I.G.; Conegero, M.G. Simplified greywater treatment systems: Slow filters of sand and slate waste followed by granular activated carbon. J. Environ. Manag. 2016, 176, 119–127. [Google Scholar] [CrossRef]
  10. Assayed, A.; Chenoweth, J.; Pedley, S. Assessing the efficiency of an innovative method for onsite greywater treatment: Drawer compacted sand filter—A case study in Jordan. Ecol. Eng. 2015, 81, 525–533. [Google Scholar] [CrossRef] [Green Version]
  11. Abed, S.N.; Almuktar, S.A.; Scholz, M. Treatment of contaminated greywater using pelletised mine watersludge. J. Environ. Manag. 2017, 197, 10–23. [Google Scholar] [CrossRef]
  12. Song, H.; Alfiya, Y.; Dubowski, Y.; Friedler, E. Sorption and biodegradation of propylparaben in greywater by aerobic attached-growth biomass. Sci. Total Environ. 2017, 598, 925–930. [Google Scholar] [CrossRef]
  13. Ramprasad, C.; Smith, C.S.; Memon, F.A.; Philip, L. Removal of chemical and microbial contaminants from greywater using a novel constructed wetland: GROW. Ecol. Eng. 2017, 106, 55–65. [Google Scholar] [CrossRef] [Green Version]
  14. Moges, M.E.; Todt, D.; Eregno, F.E.; Heistad, A. Performance study of biofilter system for on-site greywater treatment at cottages and small households. Ecol. Eng. 2017, 105, 118–124. [Google Scholar] [CrossRef]
  15. Karabelnik, K.; Kõiv, M.; Kasak, K.; Jenssen, P.D.; Mander, Ü. High-strength greywater treatment in compact hybrid filter systems with alternative substrates. Ecol. Eng. 2012, 49, 84–92. [Google Scholar] [CrossRef]
  16. Noutsopoulos, C.; Andreadakis, A.; Kouris, N.; Charchousi, D.; Mendrinou, P.; Galani, A.; Mantziaras, I.; Koumaki, E. Greywater characterization and loadings- Physicochemical treatment to promote onsite reuse. J. Environ. Manag. 2017, 216, 337–346. [Google Scholar] [CrossRef] [PubMed]
  17. Couto, E.A.; Calijuri, M.L.; Assemany, P.P.; Santiago, A.F.; Lopes, L.S. Greywater treatment in airports using anaerobic filter followed by UV disinfection: An efficient and low cost alternative. J. Clean. Prod. 2015, 106, 372–379. [Google Scholar] [CrossRef]
  18. Oh, K.S.; Poh, P.E.; Chong, M.N.; Chan, E.S.; Lau, E.V.; Saint, C.P. Bathroom greywater recycling using polyelectrolyte-complex bilayer membrane: Advanced study of membrane structure and treatment efficiency. Carbohydr. Polym. 2016, 148, 161–170. [Google Scholar] [CrossRef] [PubMed]
  19. Prodanovic, V.; Hatt, B.; McCarthy, D.; Zhang, K.; Deletic, A. Green walls for greywater reuse: Understanding the role of media on pollutant removal. Ecol. Eng. 2017, 102, 625–635. [Google Scholar] [CrossRef]
  20. Maimon, A.; Friedler, E.; Gross, A. Parameters affecting greywater quality and its safety for reuse. Sci. Total Environ. 2014, 487, 20–25. [Google Scholar] [CrossRef]
  21. Oteng-Peprah, M.; Acheampong, M.A.; deVries, N.K. Greywater characteristics, treatment systems, reuse strategies and user perception—A review. Water Air Soil Pollut. 2018, 229, 255. [Google Scholar] [CrossRef] [Green Version]
  22. Opher, T.; Shapira, A.; Friedler, E. A comparative social life cycle assessment of urban domestic water reuse alternatives. Int. J. Life Cycle Assess. 2017. [Google Scholar] [CrossRef]
  23. Amiri, M.J.; Bahrami, M.; Badkouby, M.; Kalavrouziotis, I.K. Greywater treatment using single and combined adsorbents for landscape irrigation. Environ. Process. 2019, 6, 43–63. [Google Scholar] [CrossRef]
  24. Amiri, M.J.; Abedi-Koupai, J.; Eslamian, S.S.; Mousavi, S.F.; Arshadi, M. Modelling Pb(II) adsorption based on synthetic and industrial wastewaters by ostrich bone char using artificial neural network and multivariate non-linear regression. Int. J. Hydrol. Sci. Technol. 2013, 3, 221–240. [Google Scholar] [CrossRef]
  25. Amiri, M.J.; Abedi-Koupai, J.; Eslamian, S.S.; Mousavi, S.F.; Hasheminejad, H. Modeling Pb(II) adsorption from aqueous solution by ostrich bone ash using adaptive neural-based fuzzy inference system. J. Environ. Sci. Health Part A 2013, 48, 543–558. [Google Scholar] [CrossRef] [PubMed]
  26. Amiri, M.J.; Abedi-Koupai, J.; Jalali, S.M.J.; Mousavi, S.F. Modeling of fixed-bed column system of Hg (II) ions on ostrich bone ash/nZVI composite by artificial neural network. J. Environ. Eng. ASCE 2017, 143, 04017061. [Google Scholar] [CrossRef]
  27. Bahrami, M.; Amiri, M.J.; Mahmoudi, M.R.; Koochaki, S. Modeling caffeine adsorption by multi-walled carbon nanotubes using multiple polynomial regression with interaction effects. J Water Health. 2017, 15, 526–535. [Google Scholar] [CrossRef] [PubMed]
  28. Dacewicz, E.; Chmielowski, K. Application of multidimensional clustering for an assessment of pollutants removal from domestic wastewater using a filter with a plastic waste filling. J. Water Process Eng. 2019, 29, 100794. [Google Scholar] [CrossRef]
  29. Washington State Department of Health. Recommended Standards and Guidance for Performance, Application, Design, and Operation & Maintenance; Intermittent Sand Filter Systems; Washington State Department of Health: Washington, DC, USA, 2016.
  30. Rice, E.W.; Baird, R.B.; Eaton, A.D.; Clesceri, L.S. Standard Methods for the Examination of Water and Wastewater, 22nd ed.; American Public Health Association: American Water Works Association: Water Environment Federation: Washington, DC, USA, 2012. [Google Scholar]
  31. Ares, G. Cluster Analysis: Application in Food Science and Technology. In Mathematical and Statistical Approaches in Food Science and Technology; Granato, D., Ares, G., Eds.; Wiley Blackwell: Oxford, UK, 2014. [Google Scholar]
  32. Johnson, R.A.; Wichern, D. Multivariate Analysis; John Wiley & Sons, Ltd.: Hoboken, NJ, USA, 2002. [Google Scholar]
  33. Ward, J.H. Hierarchical grouping to optimize an objective function. J. Am. Stat. Assoc. 1963, 58, 236–244. [Google Scholar] [CrossRef]
  34. Abbasi, A.R.; Mahmoudi, M.R.; Avazzadeh, Z. Diagnosis and clustering of power transformer winding fault types by cross-correlation and clustering analysis of FRA results. IET Gener. Transm. Distrib. 2018, 12, 4301–4309. [Google Scholar] [CrossRef]
  35. Aghakhani, A.; Mousavi, S.F.; Mostafazadeh-Fard, B.; Rostamian, R.; Seraji, M. Application of some combined adsorbents to remove salinity parameters from drainage water. Desalin 2011, 275, 217–223. [Google Scholar] [CrossRef]
  36. Laaffat, J.; Aziz, F.; Ouazzani, N.; Mandi, L. Biotechnological approach of greywater treatment and reuse for landscape irrigation in small communities. Saudi J. Biol. Sci. 2019, 26, 83–90. [Google Scholar] [CrossRef]
  37. Ghawi, A.H. Development of the greywater domestic treatment unit for irrigation of the garden in rural areas. Ecol. Eng. 2019, 20, 46–56. [Google Scholar] [CrossRef]
  38. Lavanya, V.; Kannan, D.P. Grey water treatment using effective micro-organisms and its impact on water qualities. J. Appl. Sci. 2019, 19, 188–198. [Google Scholar]
  39. Samayamanthula, D.R.; Sabarathinam, C.; Bhandary, H. Treatment and efective utilization of greywater. Appl. Water Sci. 2019, 9, 90. [Google Scholar] [CrossRef] [Green Version]
  40. Amiri, M.J.; Bahrami, M.; Beigzadeh, B.; Gil, A. A response surface methodology for optimization of 2, 4-dichlorophenoxyacetic acid removal from synthetic and drainage water: A comparative study. Environ. Sci. Pollut. Res. 2018, 25, 34277–34293. [Google Scholar] [CrossRef] [PubMed]
  41. Remer, D.; Nieto, A. A compendium and comparison of 25 project evaluation techniques, part 1: Net present value and rate of return methods. Int. J. Prod. Econ. 1995, 42, 72–96. [Google Scholar] [CrossRef]
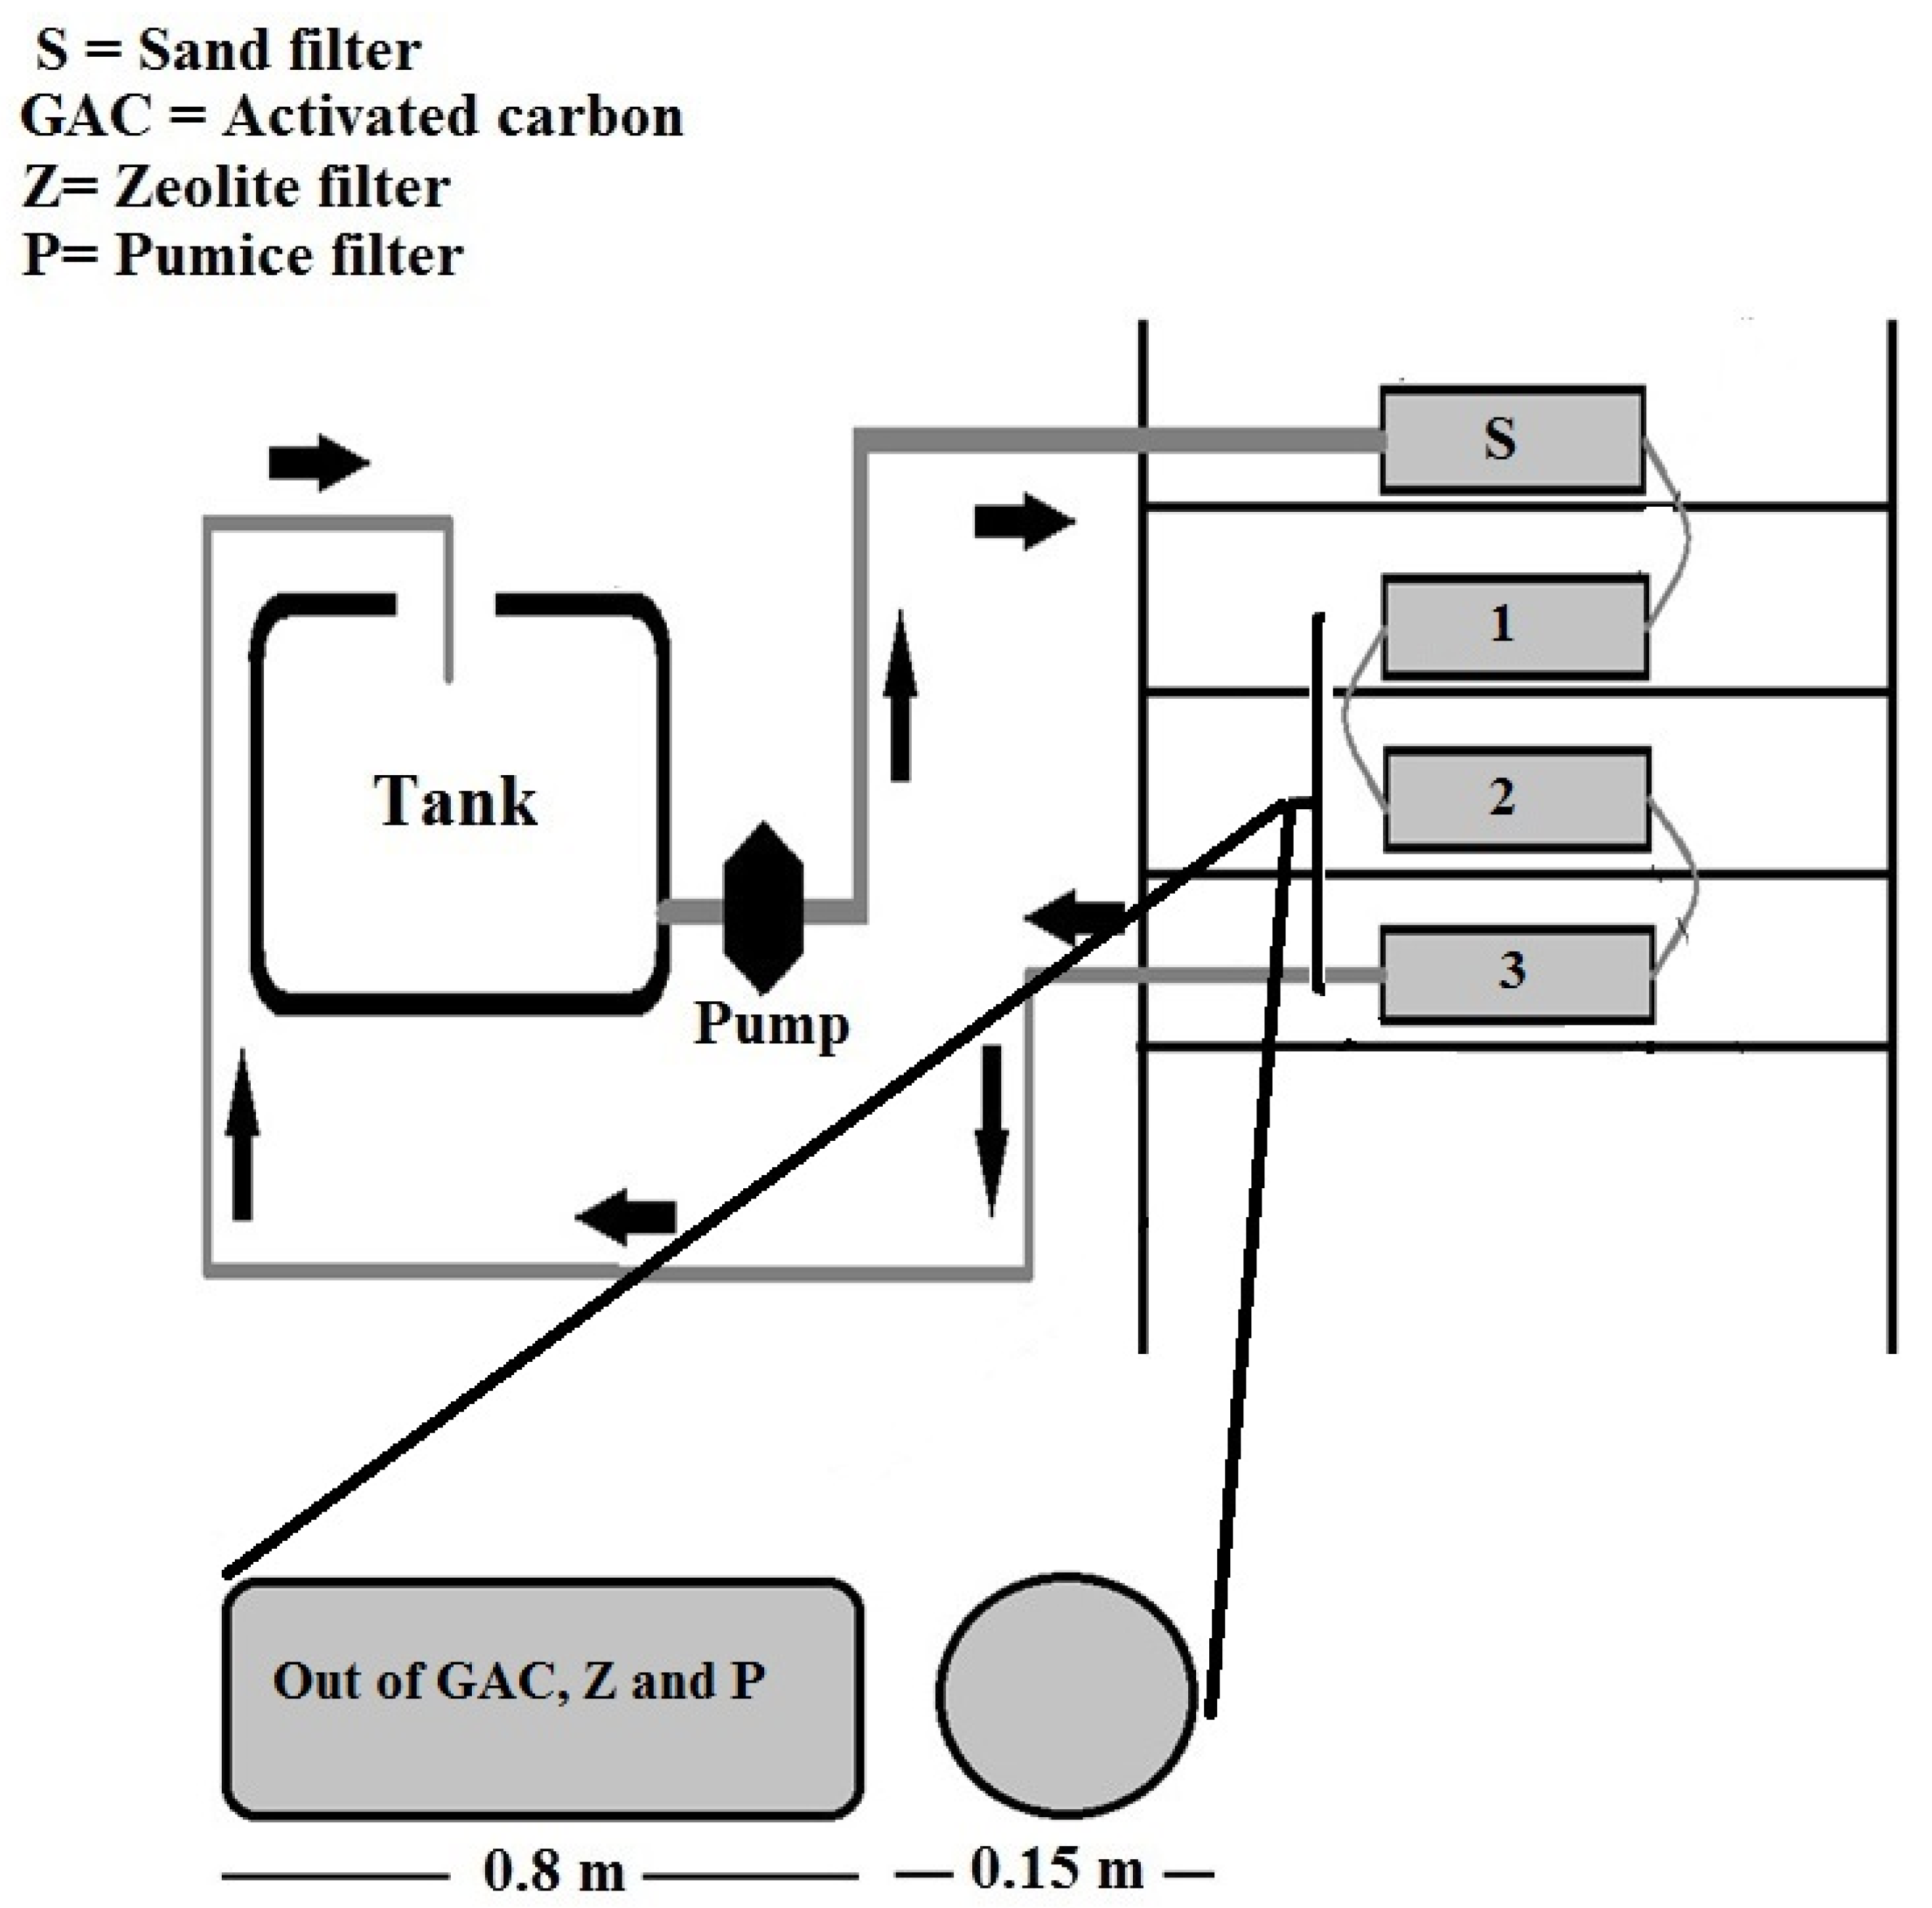
Figure 1. Schematic arrangement of the horizontal series filtration (HSF).
Sustainability 12 03194 g001
Figure 2. SEM images of granular activated carbon (a), zeolite (b), peat (c), and sand (d).
Sustainability 12 03194 g002aSustainability 12 03194 g002b
Figure 3. The performance of various components of applied adsorbents to chemical oxygen demant (COD) (a), biochemical oxygen demand (BOD) (b), total dissolved solids (TDS) (c), and turbidity (d) reduction over time.
Sustainability 12 03194 g003
Figure 4. Ward’s method for clustering the materials based on COD reduction.
Sustainability 12 03194 g004
Figure 5. Ward’s method for clustering the materials based on BOD reduction.
Sustainability 12 03194 g005
Figure 6. Ward’s method for clustering the materials based on TDS removal.
Sustainability 12 03194 g006
Figure 7. Ward’s method for clustering the materials based on turbidity removal.
Sustainability 12 03194 g007
Figure 8. Ward’s method for clustering the materials based on total features.
Sustainability 12 03194 g008
Table 1. Experimental materials characterizations.
MaterialParticle Size (mm)Density (Kg/m3)Specific Surface Area (SSA) (m2/g)Weight (Kg)Volume (m3)Uniformity CoefficientPermeability
(m2)
S-19200.044426.880.014122.7 × 10−10
GAC2–2.830510004.300.01412.11.7 5 × 10⁻⁹
Z0.8–12470805.934.580.01411.63.1 × 10−12
P10–40440144.36.200.01415.869.3 × 10−6
Table 2. Characteristics of raw greywater used in this study.
ParameterInitial Concentration
COD (mg L−1)350 ± 20.35
BOD5 (mg L−1)280 ± 15.73
TDS (mg L−1)2800 ± 200.12
Turbidity (NTU)185 ± 5
DO (mg L−1)
Fecal coliforms (NMP/100 mL)
1.3 ± 0.6
None detected
EC (dS/m)1.55 ± 0.03
pH8.26 ± 0.3
Table 3. Removal percent of different features after 6 h by different combinations of adsorbents.
Adsorbent
FeatureGACZPGAC+PGAC+ZZ+PGAC+Z+P
COD69.2160.2030.5376.1077.3468.1693.06
BOD69.7660.5229.5176.0877.5067.8894.34
TDS84.3772.4653.9979.4461.6365.1884.65
Turbidity56.6171.3781.7475.5579.3988.0393.01
Table 4. The rate of similarity between the materials for Ward’s method based on COD, BOD, TDS, turbidity, and total features.
FeatureMaterialGACZPGAC+PGAC+ZZ+PGAC+Z+P
CODGAC100967599999692
Z 1007596969992
P 10075757575
GAC+P 100999692
GAC+Z 1009692
Z+P 10092
GAC+Z+P 100
BODGAC100967599999693
Z 1007596969993
P 10075757575
GAC+P 100999693
GAC+Z 1009693
Z+P 10093
GAC+Z+P 100
TDSGAC100757599757599
Z 1009675989875
P 10075969675
GAC+P 100757599
GAC+Z 1009975
Z+P 10075
GAC+Z+P 100
TurbidityGAC100757575757575
Z 1009899988686
P 10098998686
GAC+P 100988686
GAC+Z 1008686
Z+P 10099
GAC+Z+P 100
Total FeaturesGAC100967599989692
Z 1007596969992
P 10075757575
GAC+P 100989692
GAC+Z 1009692
Z+P 10092
GAC+Z+P 100
Table 5. Economic information in greywater treatment using the the horizontal series filtration.
Incomes and CostsGACPZGAC+Z+P
Initial investment ($)4800342038004100
Annual Cost ($)2800210025002600
Annual Incomes ($)4000280033004400
Salvage Value ($) 750500500570
Useful Life (year)7777
MARR15151515