Driving Forces of Air Pollution in Ulaanbaatar City Between 2005 and 2015: An Index Decomposition Analysis
Abstract
1. Introduction
2. Literature Review
3. Methods and Data
3.1. Methods
3.2. Data Collection
4. Results
5. Discussions
6. Conclusions
Author Contributions
Funding
Acknowledgments
Conflicts of Interest
Appendix A
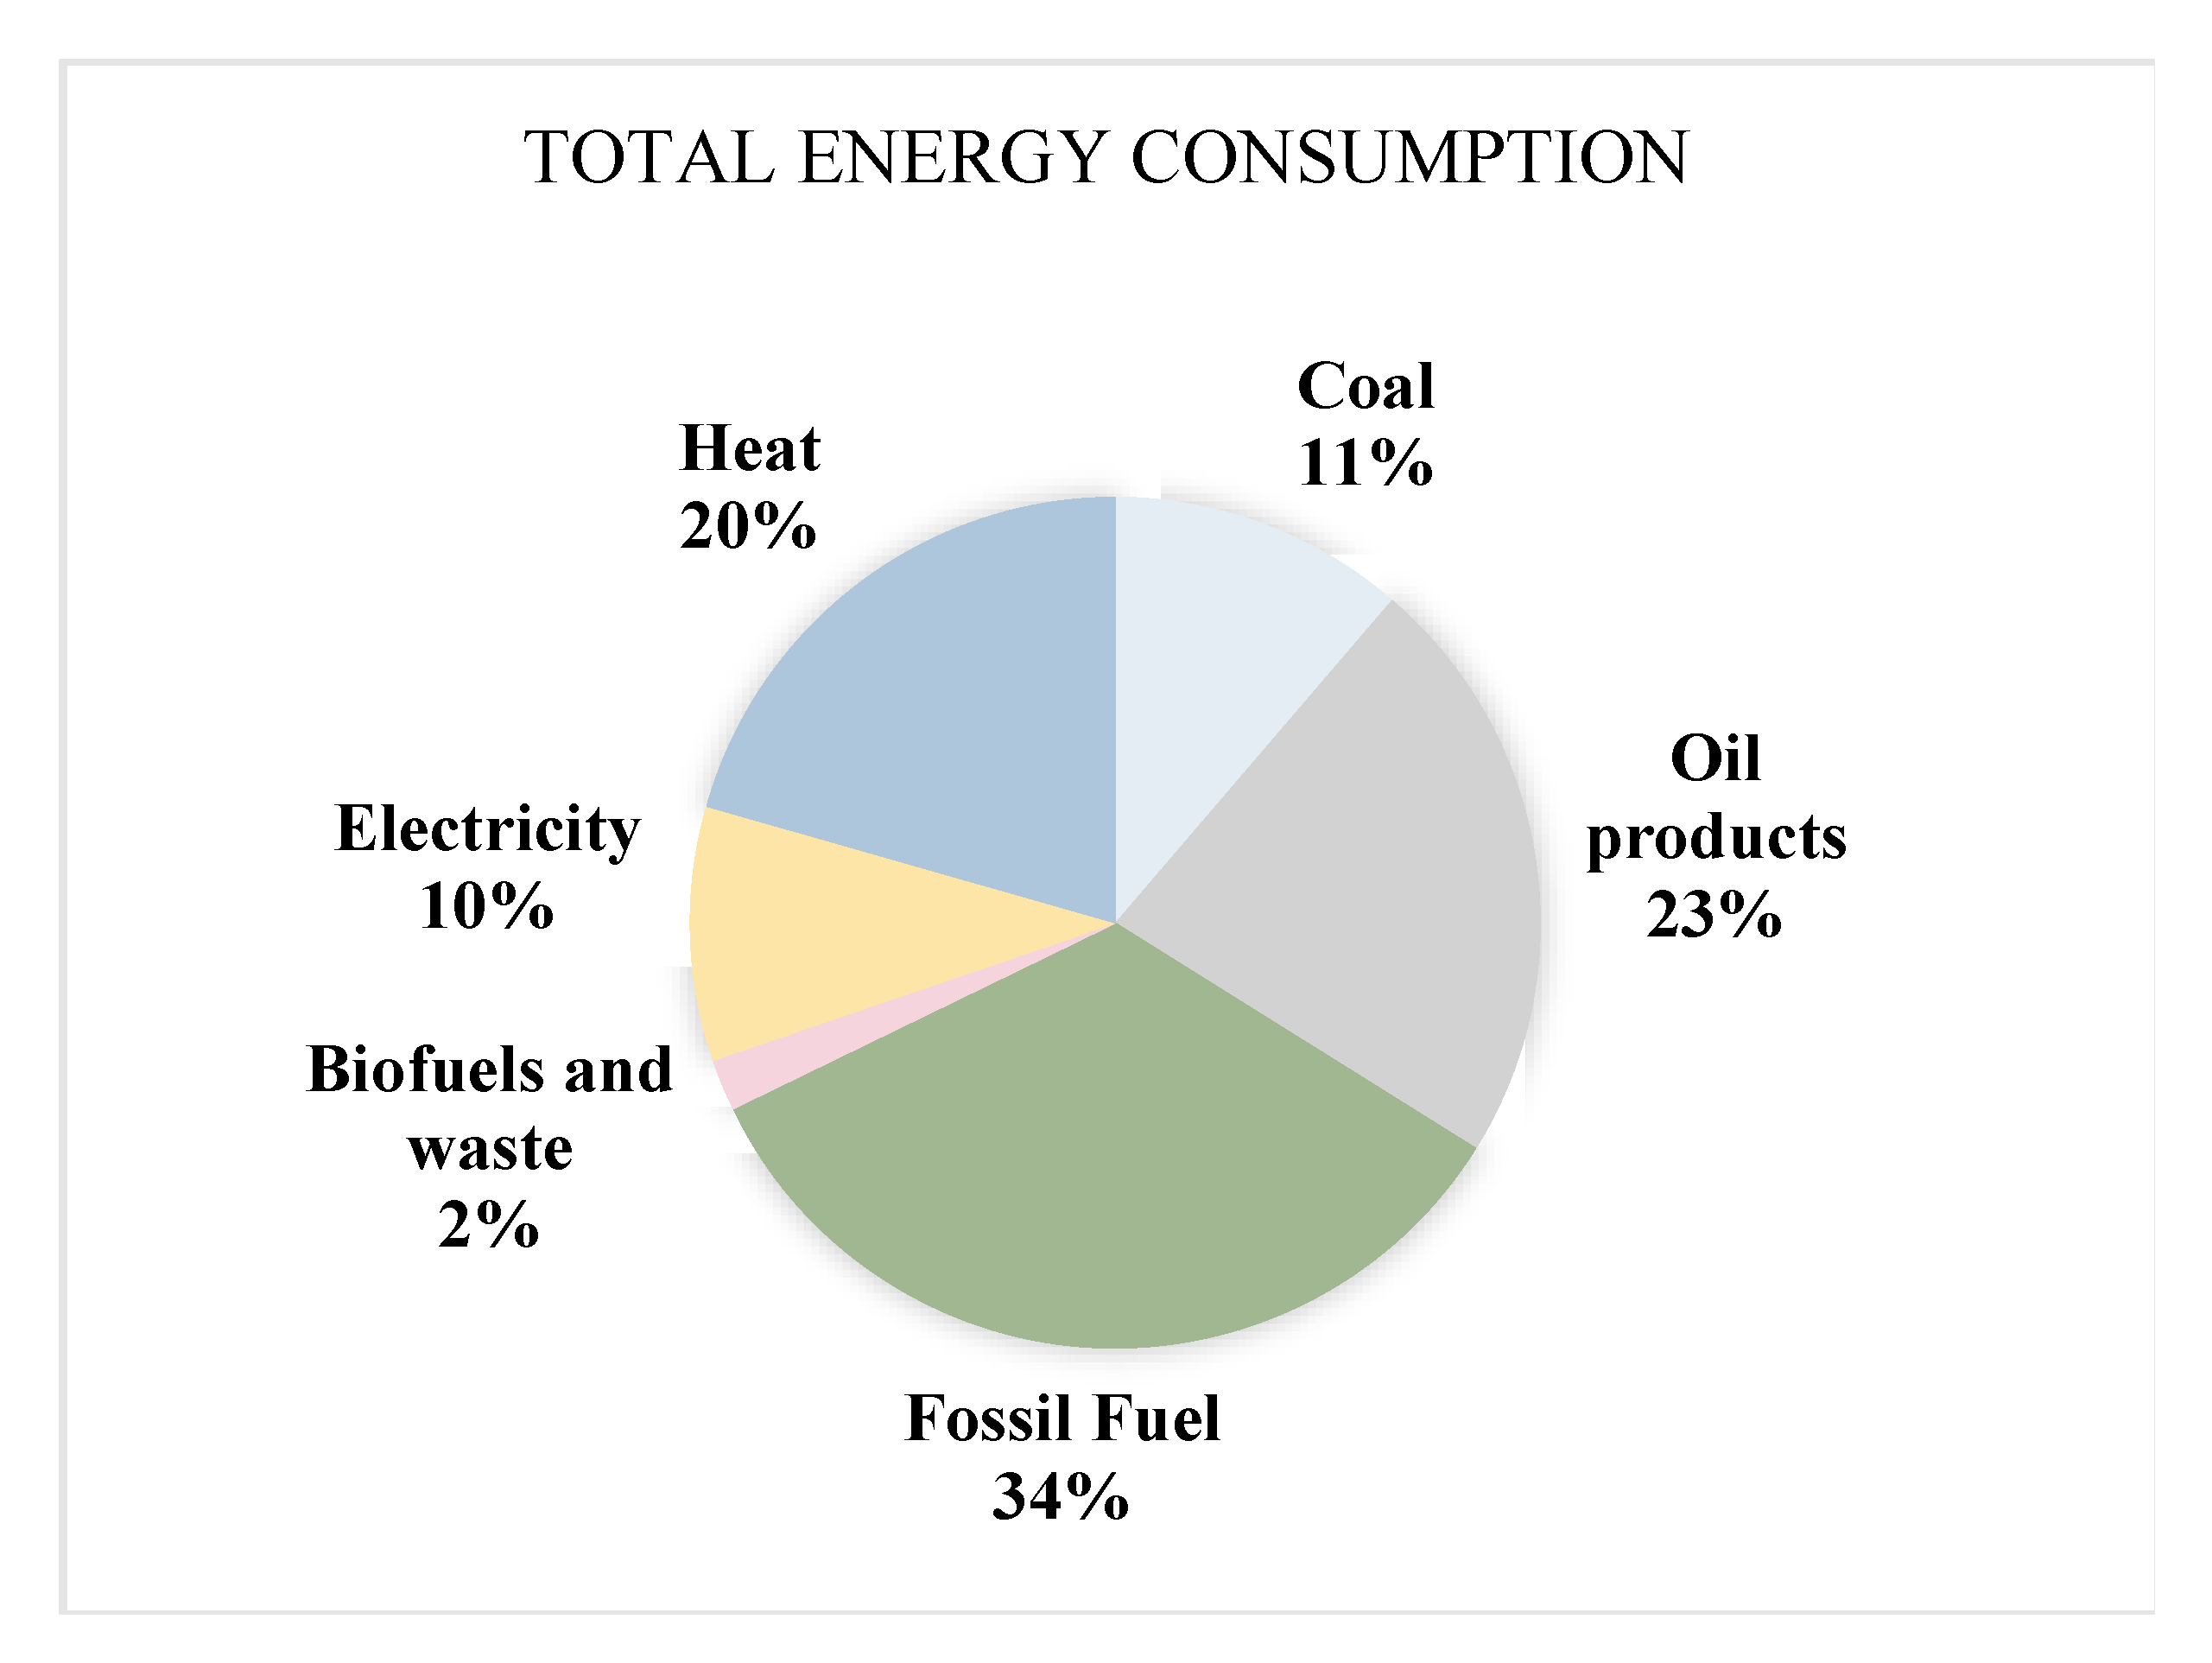
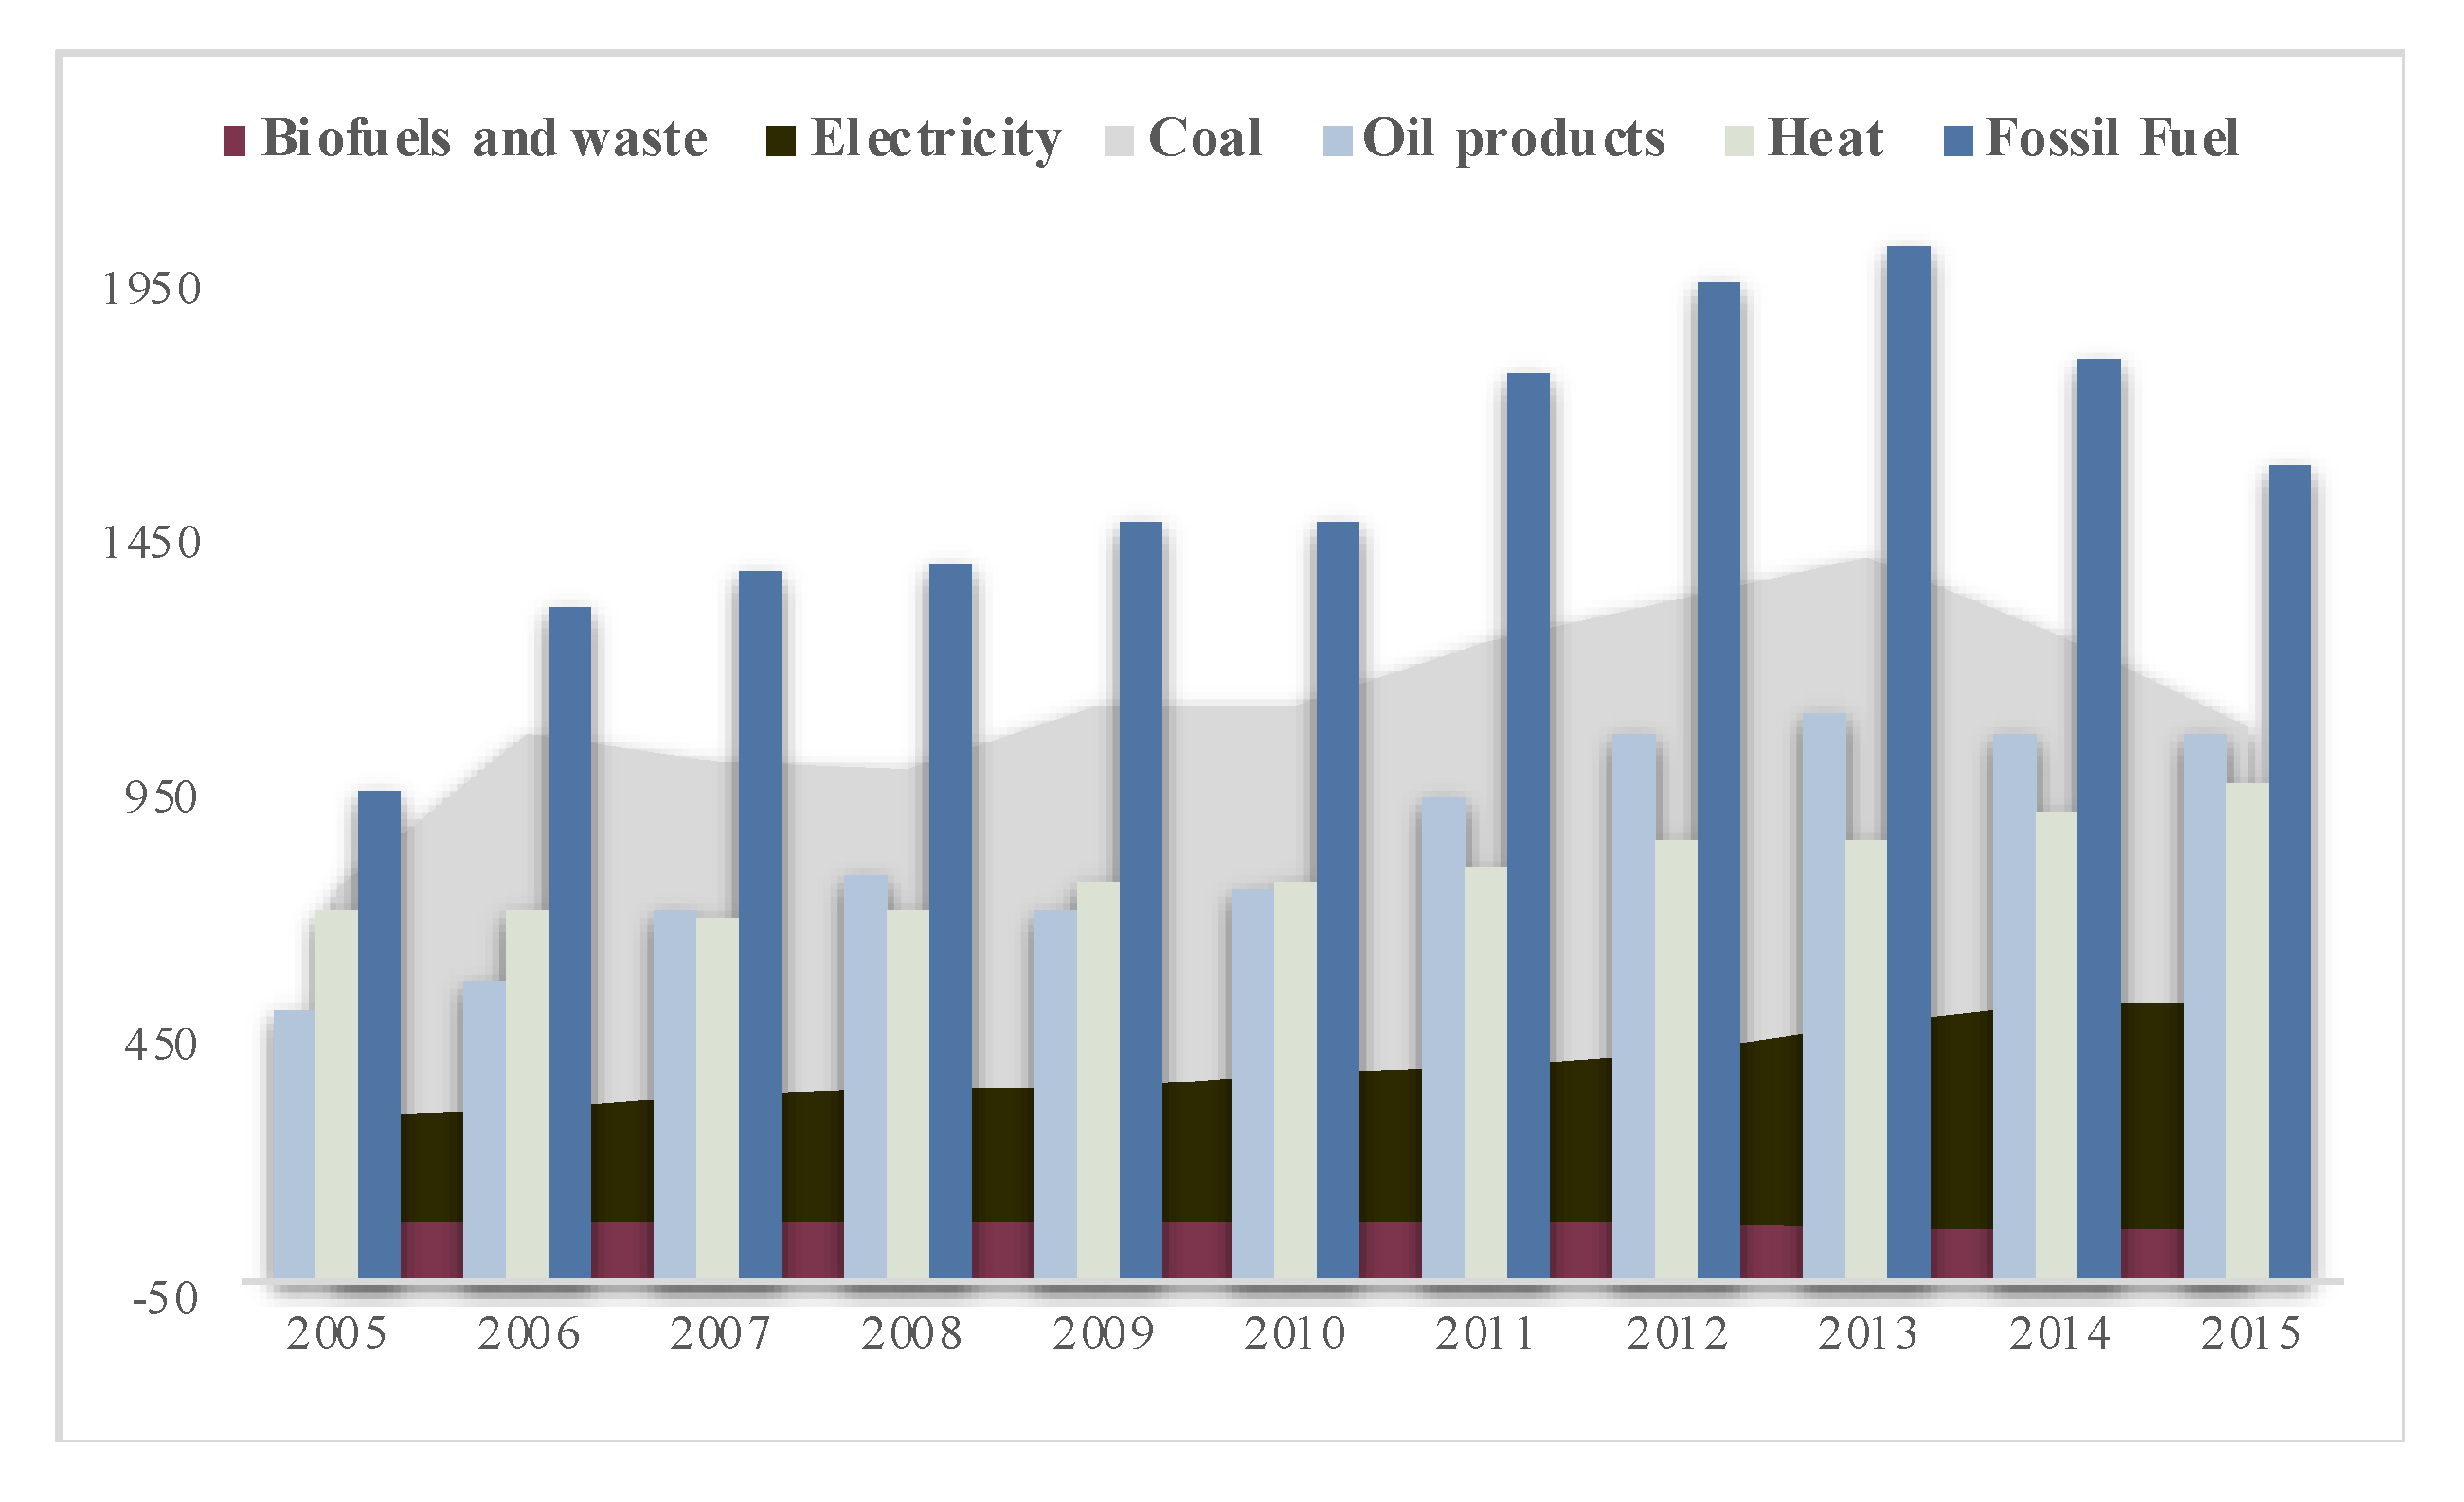
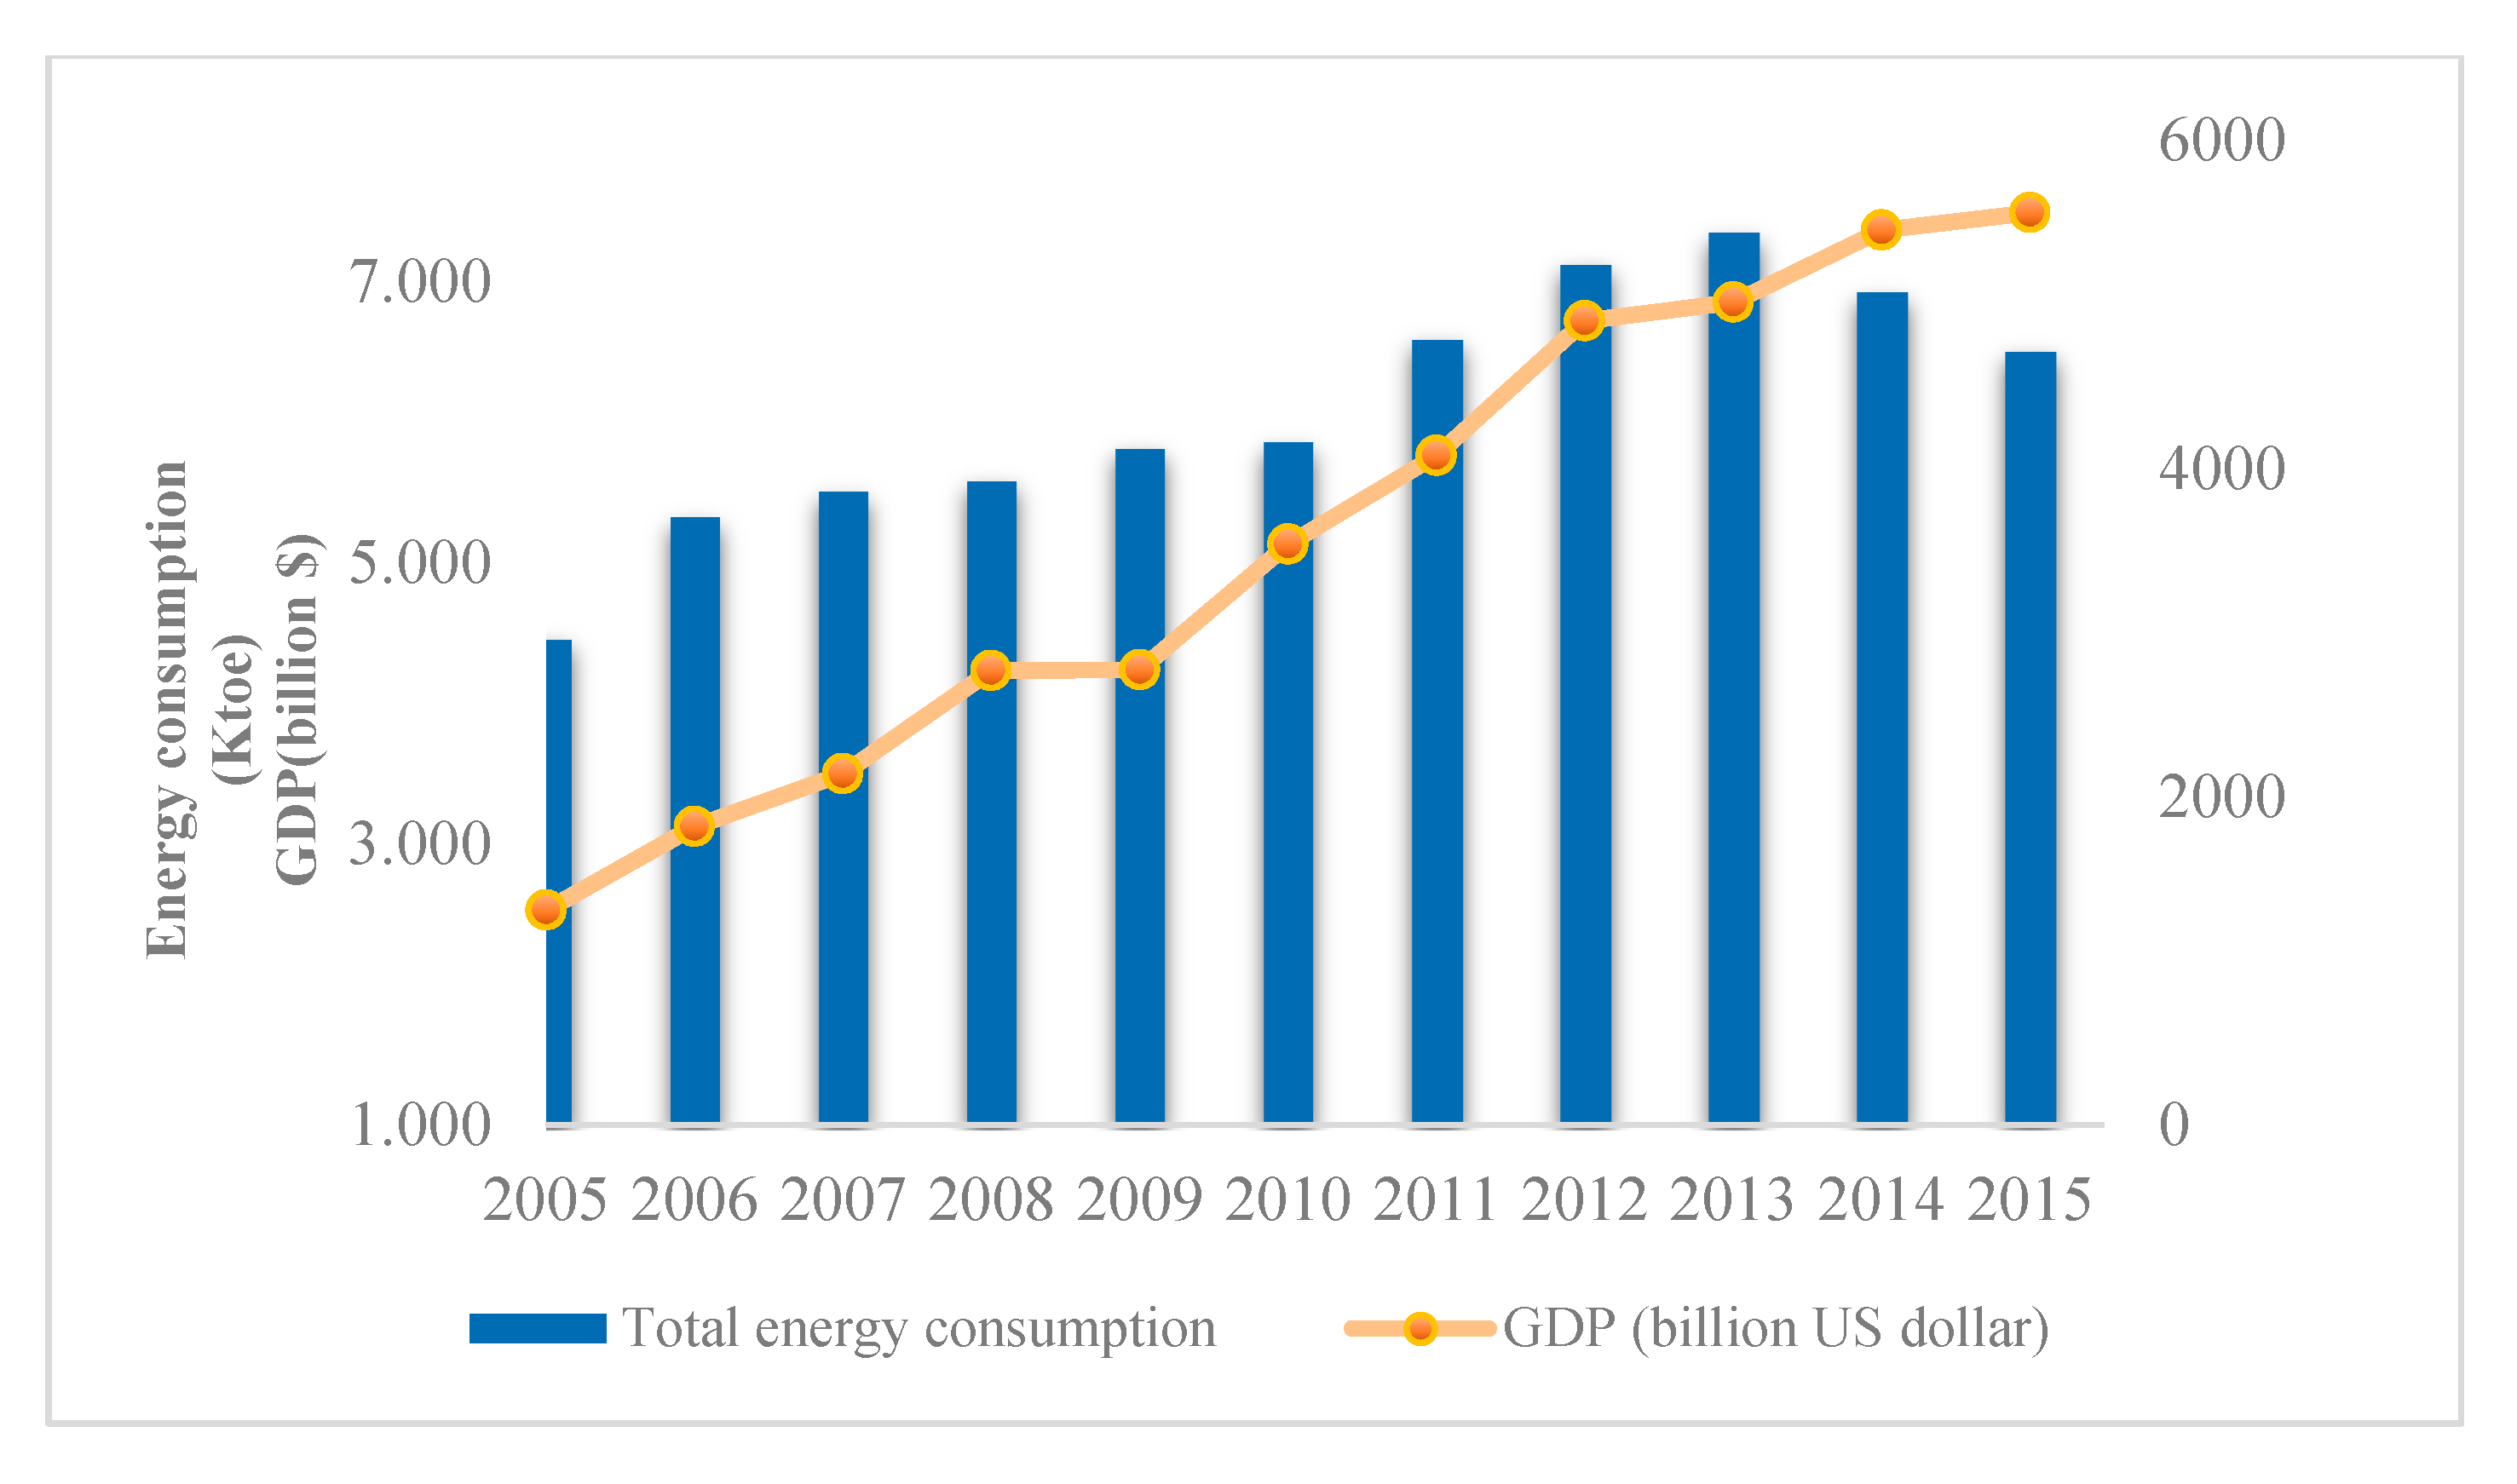
Appendix B
| Year | |||||
|---|---|---|---|---|---|
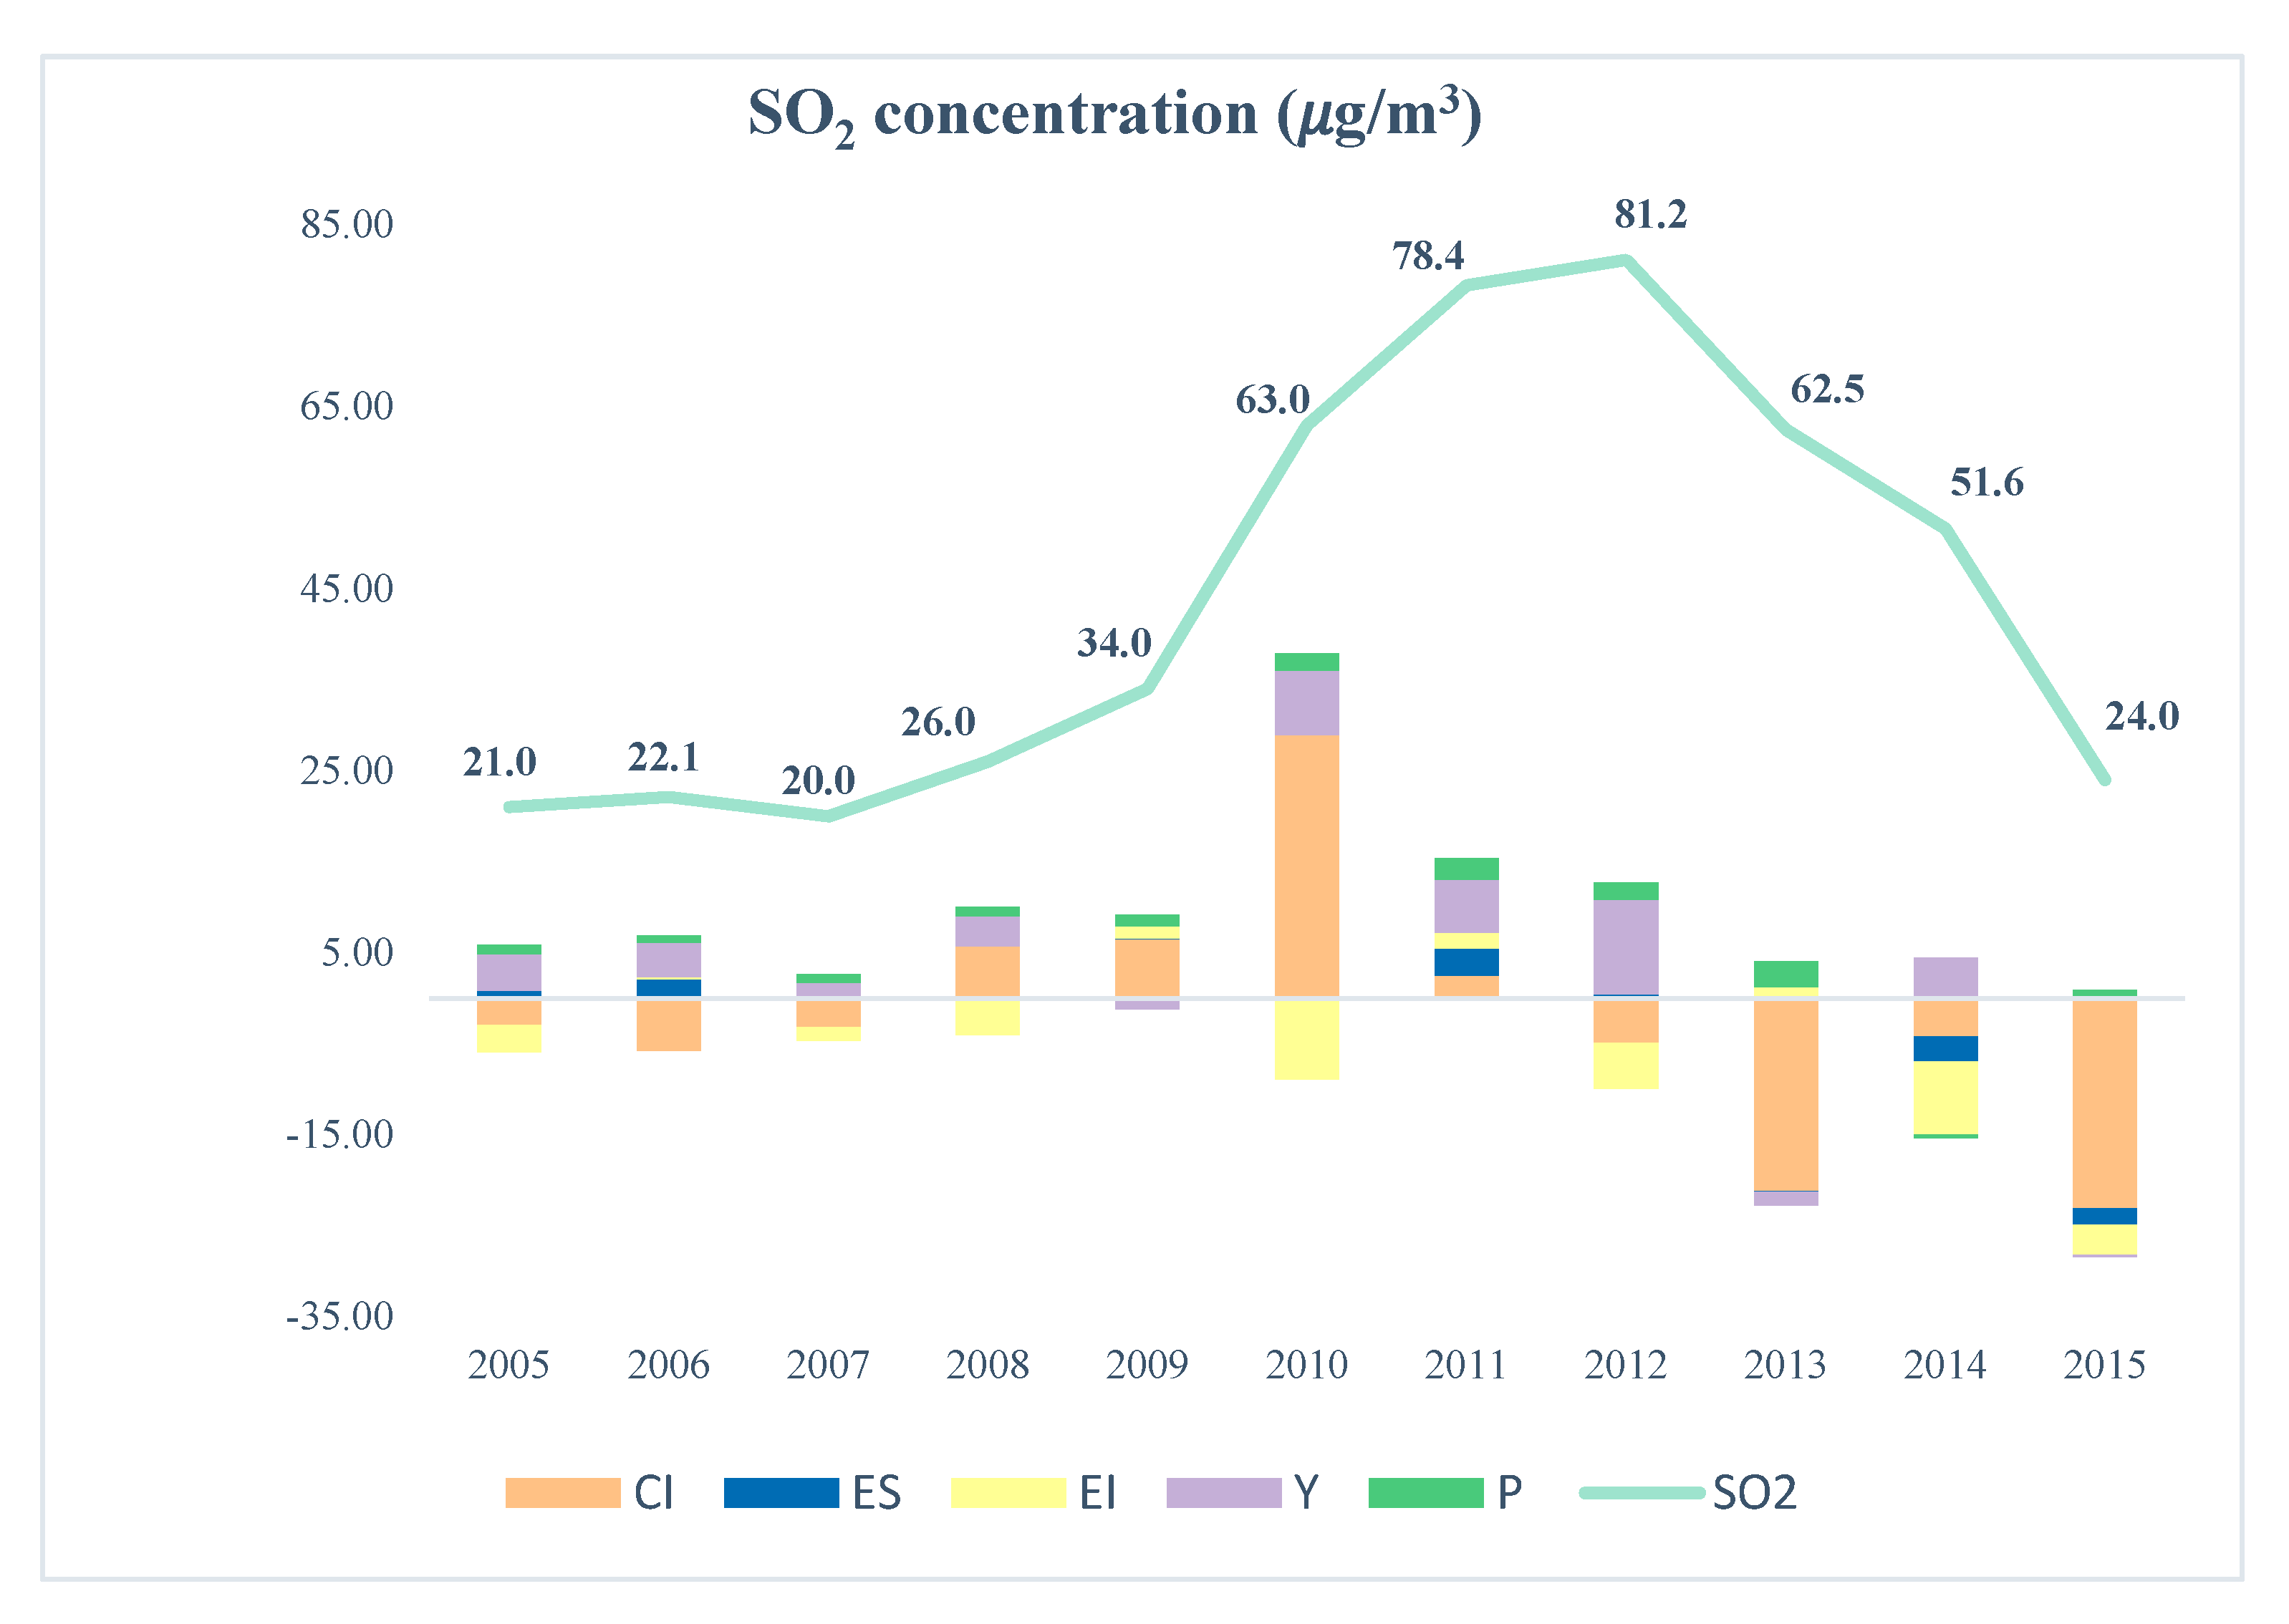
| 2005 | −2.96 | 0.87 | −2.98 | 4.01 | 0.96 |
| 2006 | −5.82 | 2.10 | 0.25 | 3.79 | 0.78 |
| 2007 | −3.19 | 0.22 | −1.52 | 1.50 | 0.89 |
| 2008 | 5.67 | −0.10 | −3.92 | 3.35 | 1.00 |
| 2009 | 6.54 | 0.02 | 1.39 | −1.20 | 1.25 |
| 2010 | 28.90 | −0.29 | −8.61 | 7.16 | 1.84 |
| 2011 | 2.49 | 3.02 | 1.72 | 5.80 | 2.37 |
| 2012 | −4.91 | 0.44 | −5.03 | 10.39 | 1.90 |
| 2013 | −21.20 | −0.14 | 1.23 | −1.45 | 2.86 |
| 2014 | −4.21 | −2.73 | −8.05 | 4.46 | −0.38 |
| 2015 | −23.11 | −1.85 | −3.25 | −0.27 | 0.87 |
| Year | |||||
|---|---|---|---|---|---|
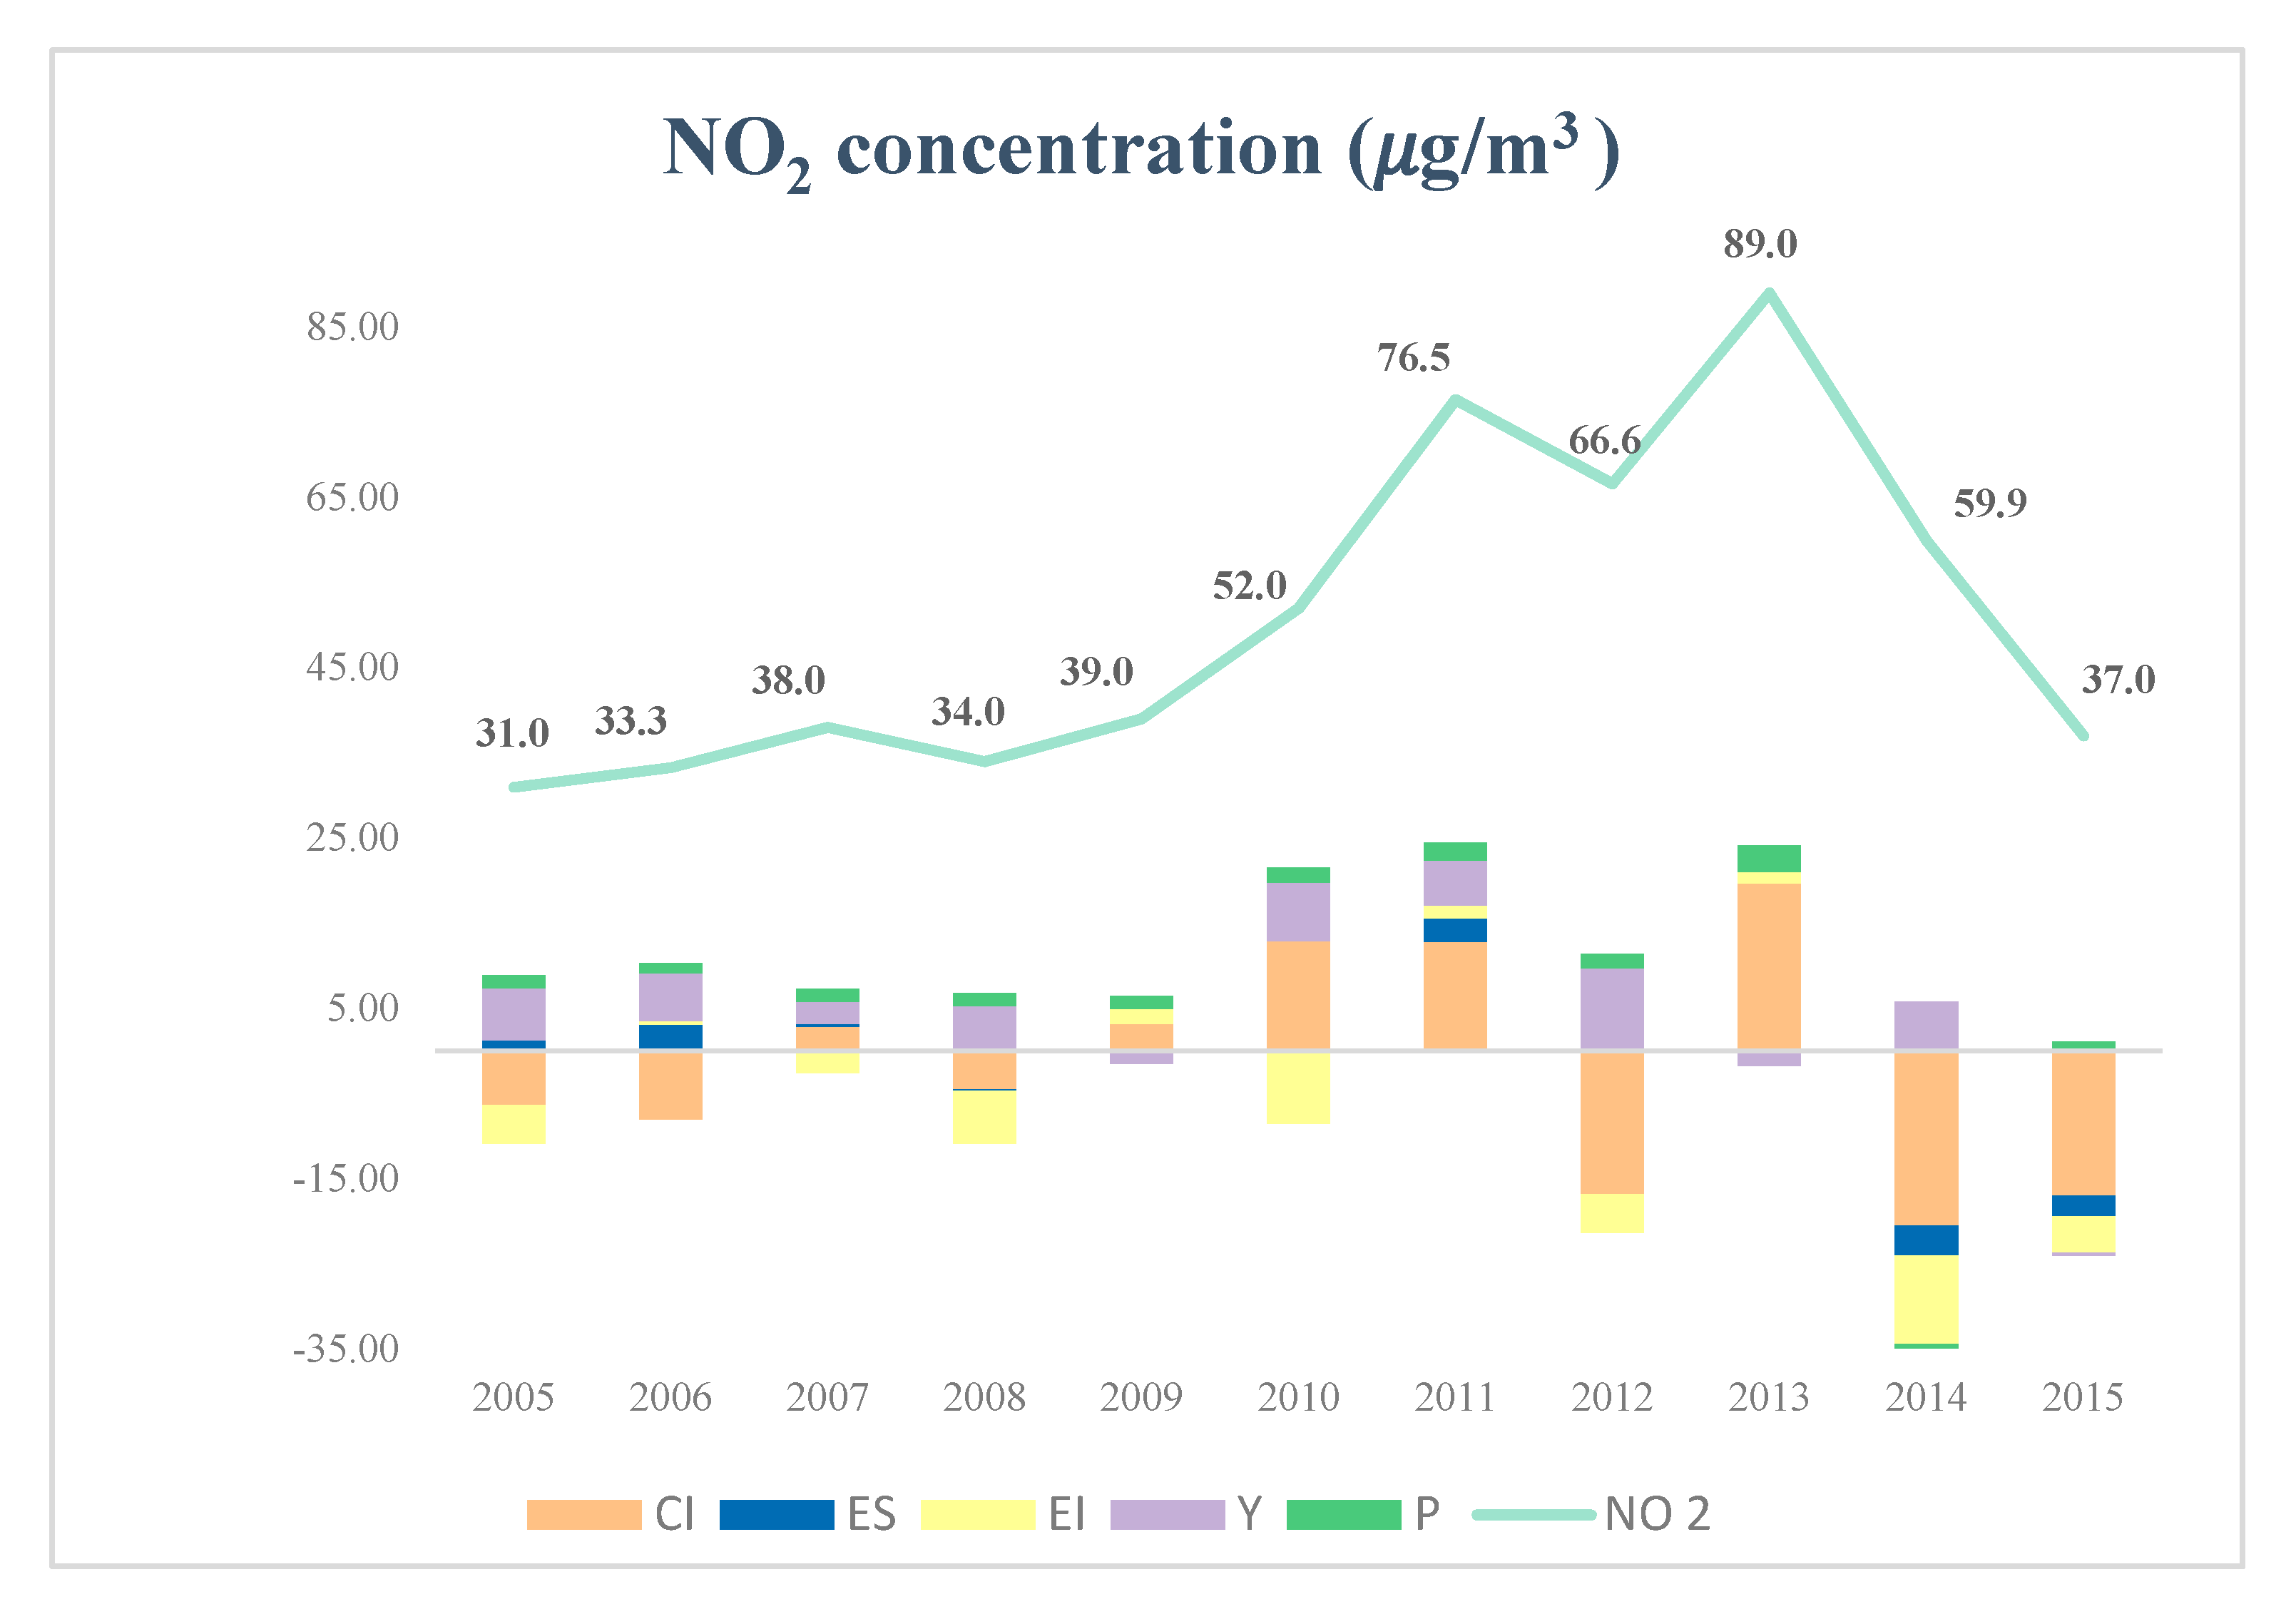
| 2005 | −6.35 | 1.32 | −4.52 | 6.10 | 1.46 |
| 2006 | −8.02 | 3.13 | 0.37 | 5.65 | 1.17 |
| 2007 | 2.86 | 0.37 | −2.57 | 2.54 | 1.50 |
| 2008 | −4.51 | −0.15 | −6.17 | 5.27 | 1.56 |
| 2009 | 3.21 | 0.02 | 1.70 | −1.46 | 1.53 |
| 2010 | 12.91 | −0.28 | −8.28 | 6.89 | 1.76 |
| 2011 | 12.87 | 2.72 | 1.55 | 5.22 | 2.14 |
| 2012 | −16.80 | 0.40 | −4.50 | 9.30 | 1.70 |
| 2013 | 19.70 | −0.15 | 1.33 | −1.57 | 3.10 |
| 2014 | −20.45 | −3.53 | −10.40 | 5.77 | −0.49 |
| 2015 | −16.98 | −2.43 | −4.28 | −0.35 | 1.15 |
| Year | |||||
|---|---|---|---|---|---|
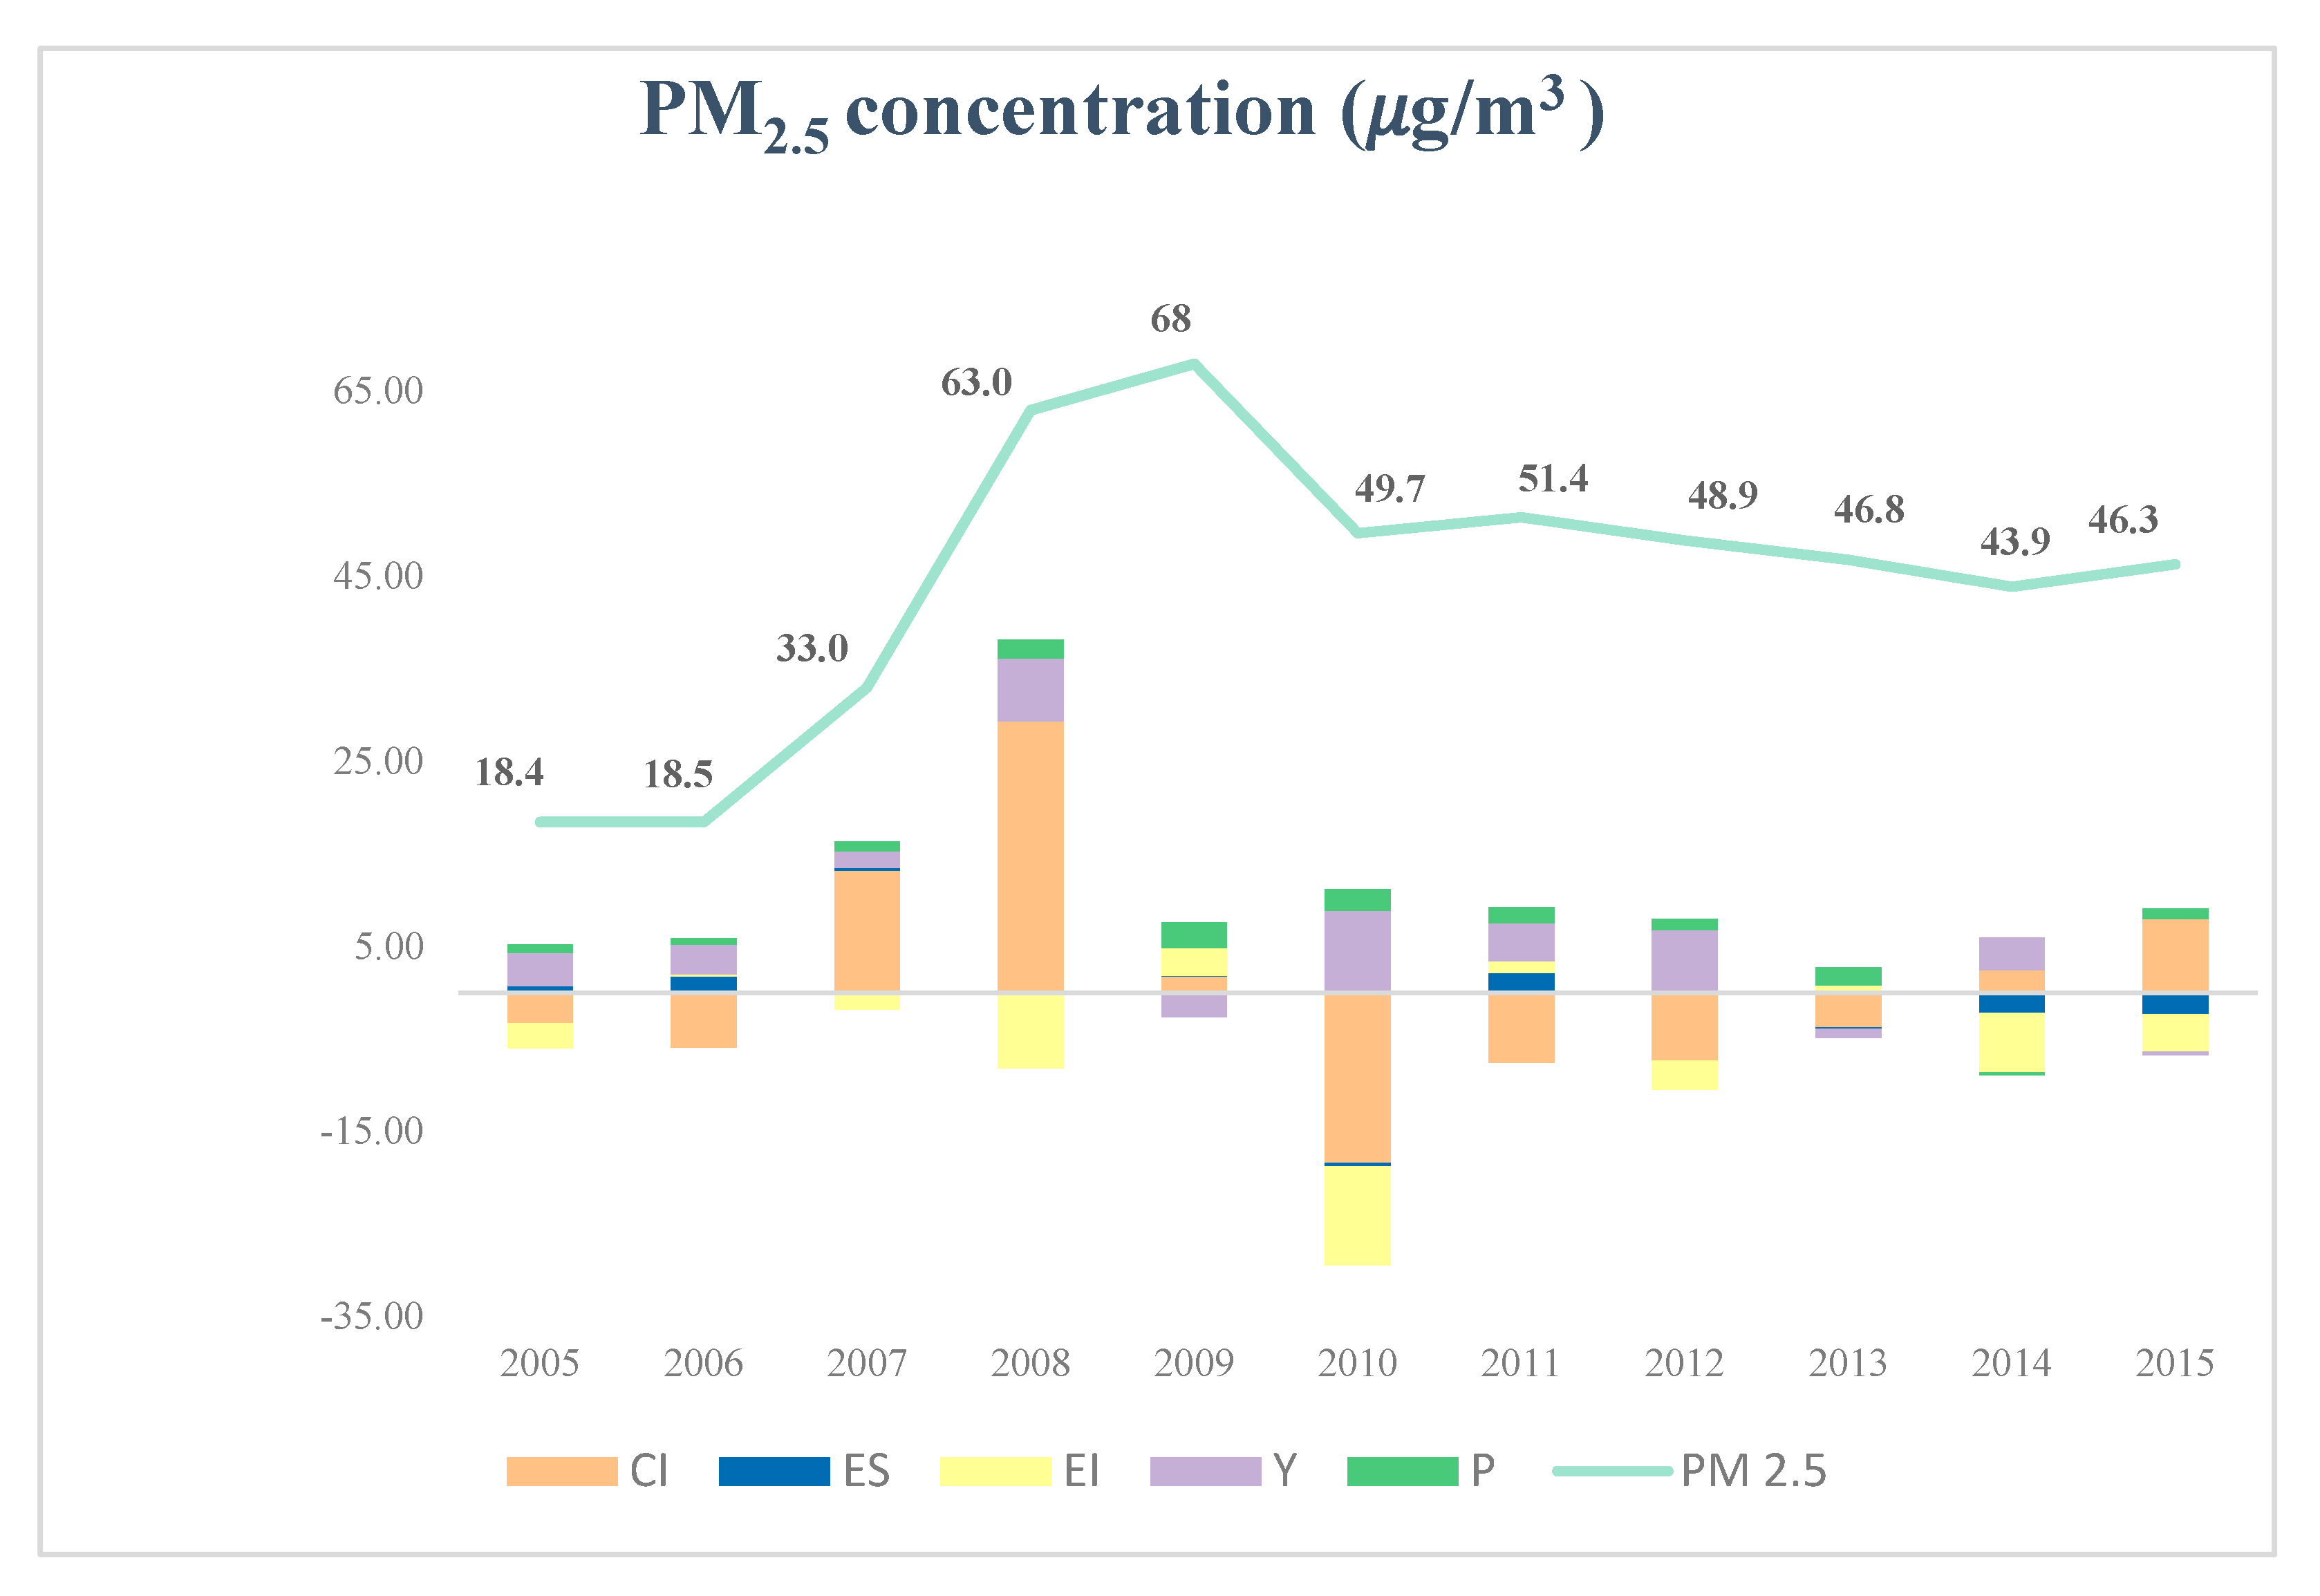
| 2005 | −3.30 | 0.77 | −2.66 | 3.58 | 0.86 |
| 2006 | −5.89 | 1.79 | 0.21 | 3.24 | 0.67 |
| 2007 | 13.26 | 0.26 | −1.81 | 1.79 | 1.05 |
| 2008 | 29.34 | −0.20 | −7.96 | 6.80 | 2.02 |
| 2009 | 1.79 | 0.04 | 3.05 | −2.63 | 2.74 |
| 2010 | −18.42 | −0.36 | −10.69 | 8.89 | 2.28 |
| 2011 | −7.57 | 2.17 | 1.23 | 4.16 | 1.70 |
| 2012 | −7.34 | 0.28 | −3.16 | 6.53 | 1.19 |
| 2013 | −3.77 | −0.09 | 0.82 | −0.97 | 1.92 |
| 2014 | 2.43 | −2.18 | −6.41 | 3.56 | −0.30 |
| 2015 | 8.02 | −2.31 | −4.06 | −0.34 | 1.09 |
| Year | SO2 | NO2 | PM2.5 | |||
|---|---|---|---|---|---|---|
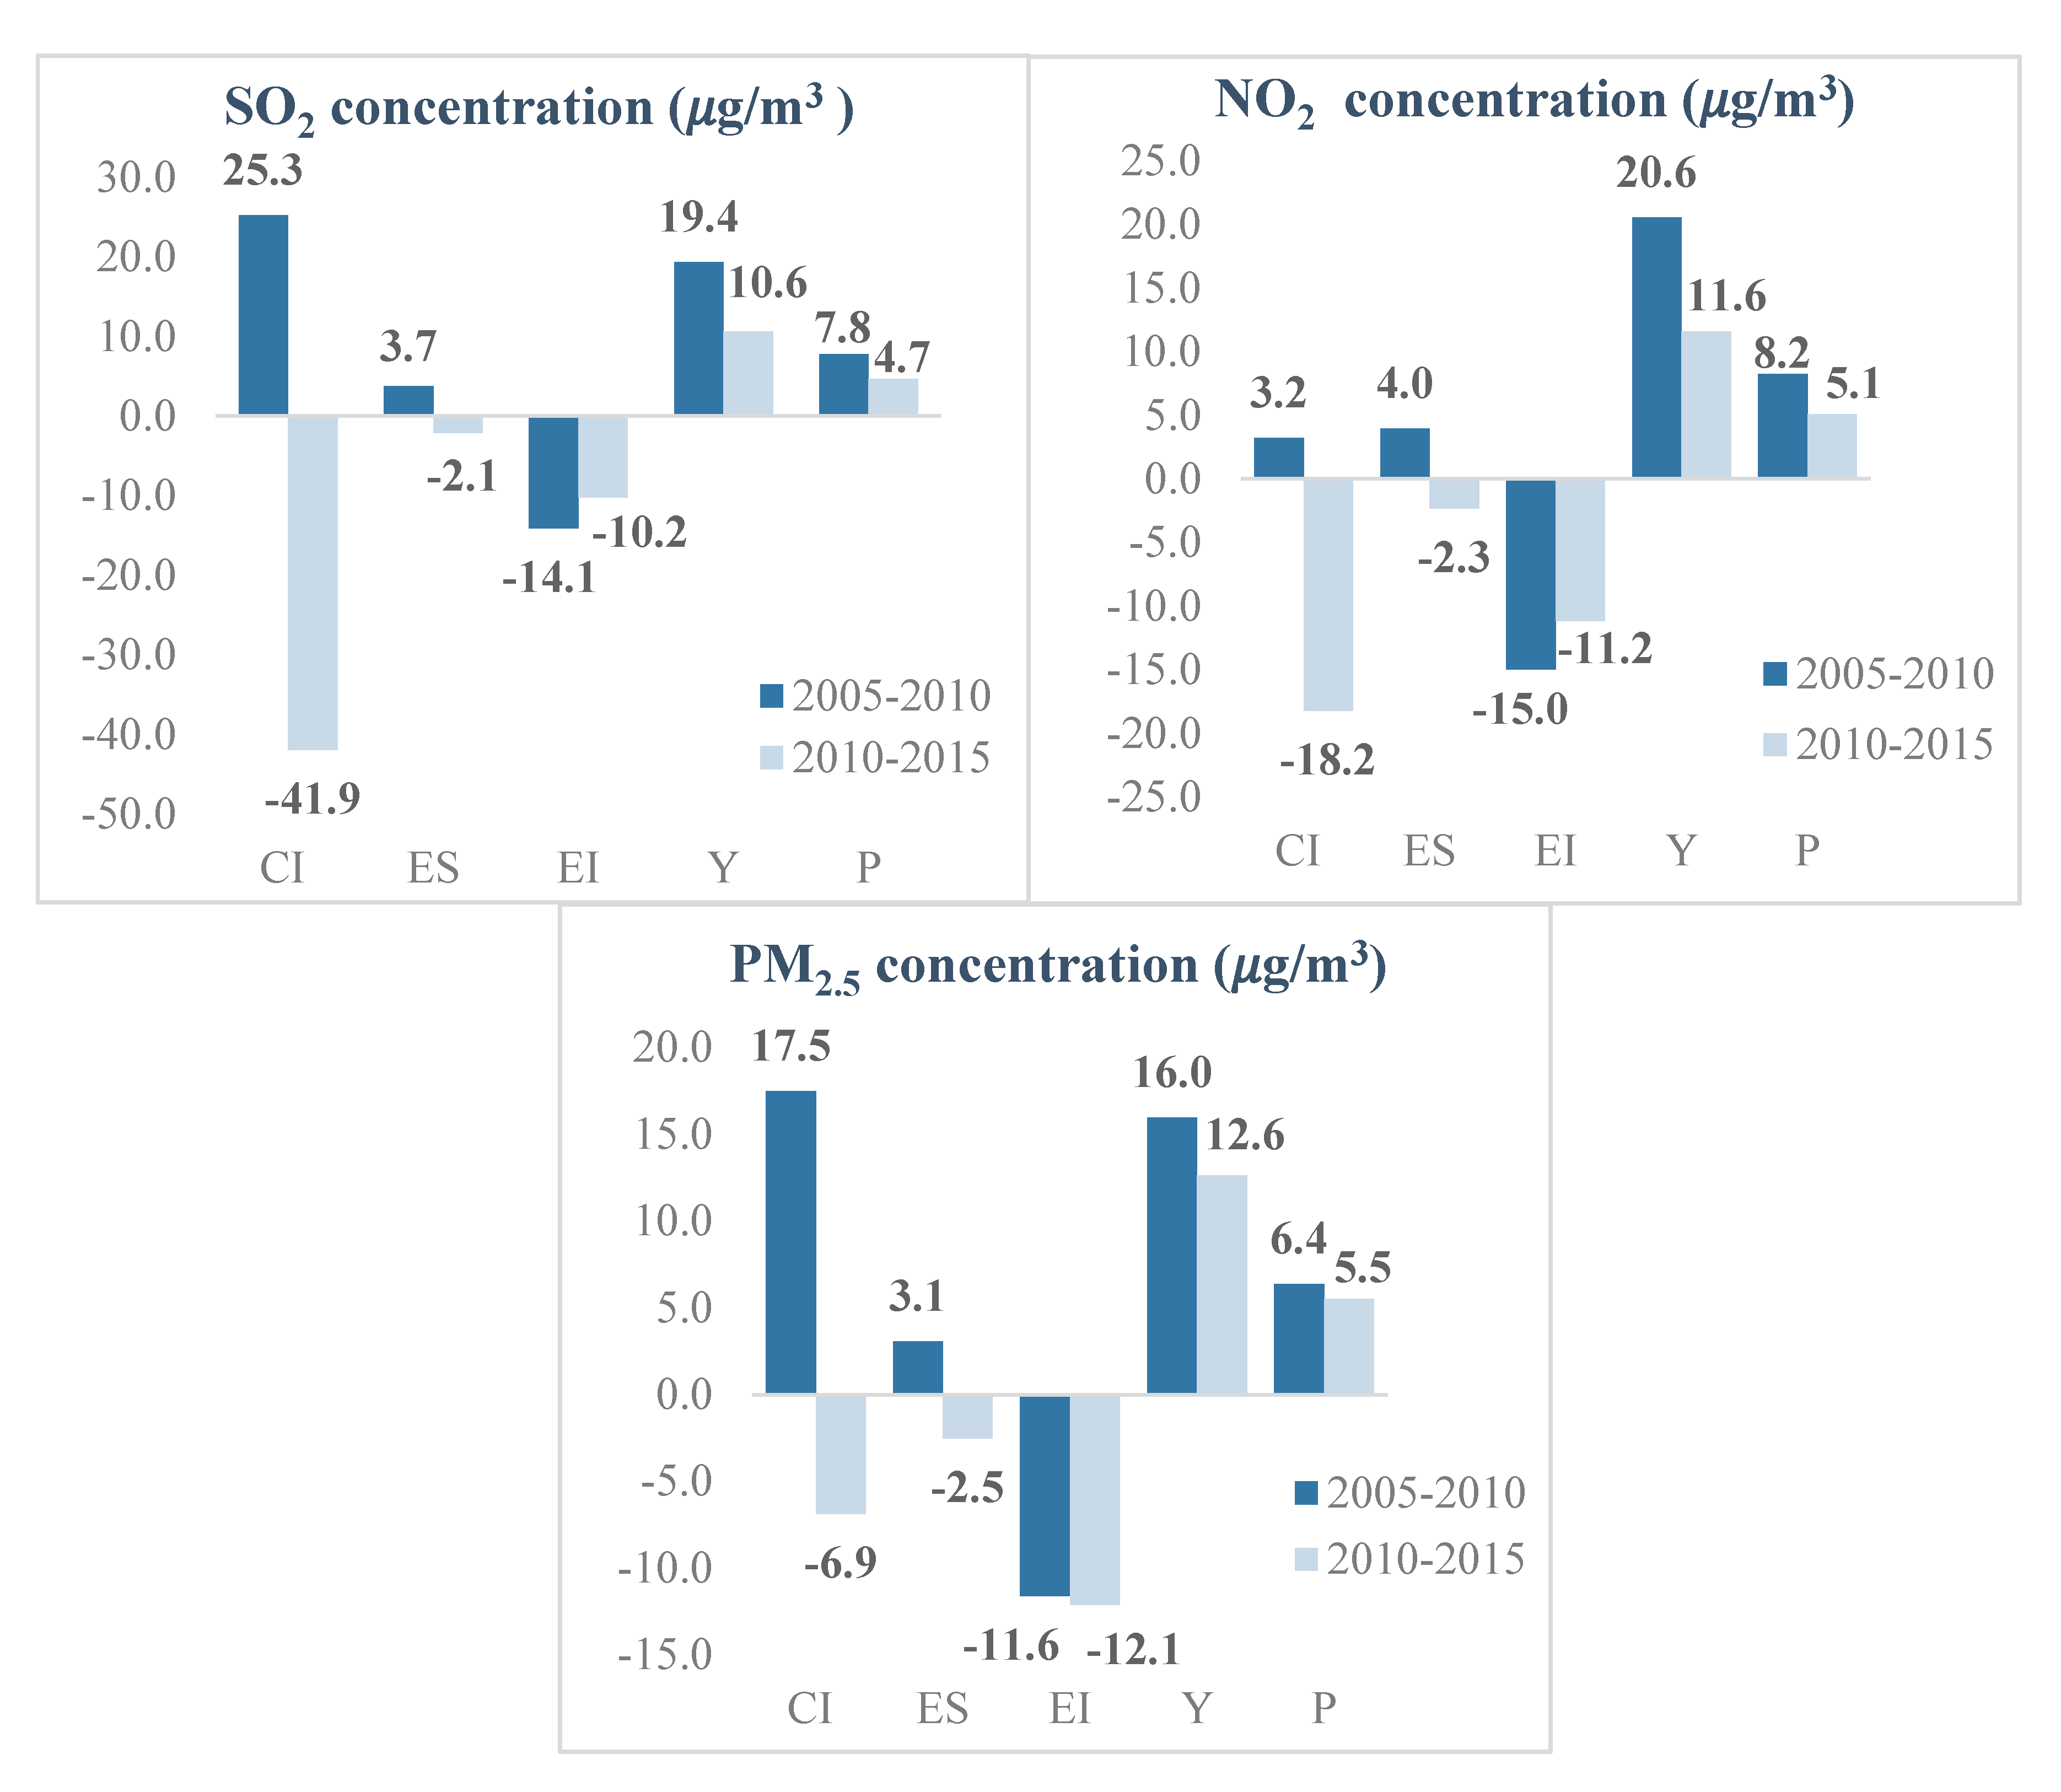
| 2005–2010 | 2010–2015 | 2005–2010 | 2010–2015 | 2005–2010 | 2010–2015 | |
| CI | 25.26 | −41.94 | 3.22 | −18.20 | 17.47 | −6.89 |
| ES | 3.74 | −2.13 | 3.97 | −2.32 | 3.08 | −2.52 |
| EI | −14.11 | −10.22 | −14.98 | −11.15 | −11.63 | −12.14 |
| Y | 19.35 | 10.63 | 20.55 | 11.60 | 15.95 | 12.62 |
| P | 7.76 | 4.65 | 8.236 | 5.074 | 6.39 | 5.52 |
References
- World Bank. Better Air Quality in Ulaanbaatar Begins in Ger Areas. 2018. Available online: https://www.worldbank.org/en/news/feature/2018/06/26/better-air-quality-in-ulaanbaatar-begins-in-ger-areas (accessed on 12 March 2020).
- Byamba, B.; Ishikawa, M. Municipal solid waste management in Ulaanbaatar, Mongolia: Systems analysis. Sustainability 2017, 9, 896. [Google Scholar] [CrossRef]
- World Weather Online. Ulaanbaatar Weather Averages. 2016. Available online: https://www.worldweatheronline.com/ulaanbaatar-weather-averages/ulaanbaatar/mn.aspx (accessed on 8 April 2019).
- World Bank. Ulaanbaatar’s Air Pollution Crisis: Summertime Complacency Won’t Solve the Wintertime Problem. 2010. Available online: https://blogs.worldbank.org/eastasiapacific/ulaanbaatar-s-air-pollution-crisis-summertime-complacency-won-t-solve-the-wintertime-problem (accessed on 19 March 2020).
- World Bank. Mongolia’s Growing Shantytowns: The Cold and Toxic Ger Districts. 2009. Available online: https://blogs.worldbank.org/eastasiapacific/mongolias-growing-shantytowns-the-cold-and-toxic-ger-districts (accessed on 11 March 2020).
- Amarsaikhan, D.; Battsengel, V.; Nergui, B.; Ganzorig, M.; Bolor, G. A study on air pollution in Ulaanbaatar City, Mongolia. GEP 2014, 2, 123–128. [Google Scholar] [CrossRef]
- Davy, P.K.; Guchin, G.; Markwitz, A. Air particulate matter pollution in Ulaanbaatar, Mongolia: Determination of composition, source contributions and source locations. Atmos. Pollut. Res. 2011, 2, 126–137. [Google Scholar] [CrossRef]
- National Geographic. Kids Suffer Most in One of Earth’s Most Polluted Cities. 2019. Available online: https://www.nationalgeographic.com/environment/2019/03/mongolia-air-pollution/ (accessed on 12 March 2020).
- World Data Atlas. Mongolia- Fossil Fuel Energy Consumption as a Share of Total Energy Consumption. 2004. Available online: https://knoema.com/atlas/Mongolia/Fossil-fuel-energy-consumption (accessed on 1 December 2019).
- World Health Organization (WHO). Air Quality Guidelines- Global Update. 2005. Available online: https://www.who.int (accessed on 3 December 2019).
- Franklin, M.; Chau, K.; Kalashnikova, V.O.; Garay, J.M.; Enebish, T.; Sorek-Hamer, M. Using multi-angle imaging spectroradiometer aerosol mixture properties for air quality assessment in Mongolia. Remote Sens. 2018, 10, 1317. [Google Scholar] [CrossRef]
- Guttikunda, S.; Lodoisamba, S.; Bulgansaikhan, B.; Dashdondog, B. Particulate Pollution in Ulaanbaatar, Mongolia. Air Qual. Atmos. Health 2013, 6, 589–601. [Google Scholar] [CrossRef]
- World Bank, Development Research Center of the State Council. Urban China: Toward Efficient, Inclusive, and Sustainable Urbanization. 2014. Available online: https://www.worldbank.org/en/country/china/publication/urban-china-toward-efficient-inclusive-sustainable-urbanization (accessed on 15 October 2019).
- Guttikunda, S. Urban Air Pollution Analysis for Ulaanbaatar. The World Bank. 2017. Available online: http://documents.worldbank.org/curated/en/900891468276852126/pdf/660820v10revis00Mongolia0Report0Web.pdf (accessed on 23 May 2019).
- Hauck, M. Epiphytic lichens indicate recent increase in air pollution in the Mongolian capital Ulan Bator. Lichenologist 2008, 40, 165–168. [Google Scholar] [CrossRef]
- Nishikawa, M.; Matsui, I.; Batdorj, D.; Jugder, D.; Mori, I.; Shimizu, A.; Sugimoto, N.; Takahashi, K. Chemical composition of urban airborne particulate matter in Ulaanbaatar. Atmos. Environ. 2011, 45, 5710–5715. [Google Scholar] [CrossRef]
- Nishikawa, M.; Matsui, I.; Mori, I.; Batdorj, D.; Sarangerel, E.; Onishi, K.; Shimizu, A.; Sugimoto, N. Chemical characteristics of airborne particulate matter during the winter season in Ulaanbaatar. Earozoru Kenyu 2015, 30, 126–133. [Google Scholar] [CrossRef]
- Zhu, S.; Horne, J.; Mac Kinnon, M.; Samuelsen, G.; Dabdub, D. Comprehensively assessing the drivers of future air quality in California. Environ. Int. 2019, 125, 386–398. [Google Scholar] [CrossRef]
- Mac Kinnon, M.; Zhu, S.; Carreras-Sospedra, M.; Soukup, J.V.; Dabdub, D.; Samuelsen, G.S.; Brouwer, J. Considering future regional air quality impacts of the transportation sector. Energy Policy 2019, 124, 63–80. [Google Scholar] [CrossRef]
- Ji, X.; Yao, Y.; Long, X. What causes PM2.5 pollution? Cross-economy empirical analysis from socioeconomic perspective. Energy Policy 2018, 119, 458–472. [Google Scholar] [CrossRef]
- National Statistical Information Service, Ulaanbaatar, Mongolia. Average Concentration of Air Pollution by Station. Available online: http://www.1212.mn/tables.aspx?tbl_id=DT_NSO_2400_015V2&IND_AIR_select_all=0&IND_AIRSingleSelect=&IND_AIR1_select_all=0&IND_AIR1SingleSelect=_19&YearM_select_all=0&YearMSingleSelect=_201909&viewtype= (accessed on 14 March 2020).
- Zhang, M.; Mu, H.; Ning, Y.; Song, Y. Decomposition of energy-related CO2 emission over 1991-2006 in China. Ecol. Econ. 2009, 68, 2122–2128. [Google Scholar] [CrossRef]
- Andreoni, V.; Galmarini, S. Decoupling economic growth from carbon dioxide emissions: A decomposition analysis of Italian energy consumption. Energy 2012, 44, 682–691. [Google Scholar] [CrossRef]
- Wu, Y.; Chau, K.; Lu, W.; Shen, L.; Shuai, C.; Chen, J. Decoupling relationship between economic output and carbon emission in the Chinese construction industry. Environ. Impact Assess.Rev. 2018, 71, 60–69. [Google Scholar] [CrossRef]
- Guan, D.; Su, X.; Zhang, Q.; Peters, G.P.; Liu, Z.; Lei, Y. The socioeconomic drivers of China’s primary PM2.5 emissions. Environ. Res. 2014, 9, 024010. [Google Scholar] [CrossRef]
- Yang, X.; Wang, S.; Zhang, W.; Li, J.; Zhou, Y. Impacts of energy consumption, energy structure, and treatment technology on SO2 emissions: A multi-scale LMDI decomposition analysis in China. Appl. Energy 2016, 184, 714–726. [Google Scholar] [CrossRef]
- Chang, M.; Zheng, J.; Inoue, Y.; Tian, X.; Chen, Q.; Gan, T. Comparative analysis on the socioeconomic drivers of industrial air-pollutant emissions between Japan and China: Insights for the further-abatement period based on the LMDI method. J. Clean. Prod. 2018, 1189, 240–250. [Google Scholar] [CrossRef]
- Lyu, W.; Li, Y.; Guan, D.; Zhao, H.; Zhang, Q.; Liu, Z. Driving forces of Chinese primary air pollution emissions: An index decomposition analysis. J. Clean. Prod. 2016, 133, 136–144. [Google Scholar] [CrossRef]
- Xie, Y.; Dai, H.; Dong, H.; Hanaoka, T.; Masui, T. Economic impacts from PM2.5 pollution-related health effects in China: A provincial-level analysis. Environ. Sci. Technol. 2016, 50, 4836–4843. [Google Scholar] [CrossRef]
- Zhang, Y.; Shuai, C.; Bian, J.; Chen, X.; Wu, Y.; Shen, L. Socioeconomic factors of PM2.5 concentrations in 152 Chinese cities: Decomposition analysis using LMDI. J. Clean. Prod. 2019, 218, 96–107. [Google Scholar] [CrossRef]
- Hoekstra, R.; Van Den Bergh, J.C.J.M. Comparing structural decomposition analysis and index. Energy Econ. 2003, 25, 39–64. [Google Scholar] [CrossRef]
- Su, B.; Ang, B.W. Structural decomposition analysis applied to energy and emissions: Some methodological developments. Energy Econ. 2012, 34, 177–188. [Google Scholar] [CrossRef]
- Ang, B.W. LMDI decomposition approach: A guide for implementation. Energy Policy 2015, 86, 233–238. [Google Scholar] [CrossRef]
- Wang, H.; Ang, B.W.; Su, B. Multiplicative structural decomposition analysis of energy and emission intensities: Some methodological issues. Energy 2017, 123, 47–63. [Google Scholar] [CrossRef]
- Dietzenbacher, E.; Hoen, A.; Los, B. Labor productivity in Western Europe 1975-1985: An intercountry, interindustry analysis. J.Reg.Sci. 2000, 40, 425–452. [Google Scholar] [CrossRef]
- Rose, A.; Chen, C.Y. Source of change in energy use in the US economy, 1972-1982: A structural decomposition analysis. Resour. Energy Econ. 1991, 13, 1–21. [Google Scholar] [CrossRef]
- Cansino, M.J.; Roman, R.; Ordonez, M. Main drivers of changes in CO2 emissions in the Spanish economy: A structural decomposition analysis. Energy Policy 2016, 89, 150–159. [Google Scholar] [CrossRef]
- Yamakawa, A.; Peters, G.P. Structural decomposition analysis of greenhouse gas emissions in Norway 1990-2002. Econ. Syst. Res. 2011, 23, 303–318. [Google Scholar] [CrossRef]
- Ang, B.W.; Zhang, F.Q. A survey of index decomposition analysis in energy and environmental studies. Energy 2000, 25, 1149–1176. [Google Scholar] [CrossRef]
- Bhattacharyya, S.C.; Ussanarassame, A. Decomposition of energy and CO2 intensities of Thai industry between 1981 and 2000. Energy Econ. 2004, 26, 765–781. [Google Scholar] [CrossRef]
- Hammond, G.P.; Norman, J.B. Decomposition analysis of energy-related carbon emissions from UK manufacturing. Energy 2012, 41, 220–227. [Google Scholar] [CrossRef]
- Enkhtsolmon, O.; Matsumoto, T.; Tseveen, E. Cost benefit analysis of air pollution abatement options in the Ger Area, Ulaanbaatar, and health benefits using contingent valuation. IJESD 2016, 7, 330–334. [Google Scholar] [CrossRef]
- Lim, M.; Myagmarchuluun, S.; Ban, H.; Hwang, Y.; Ochir, C.; Lodoisamba, D.; Lee, K. Characteristics of indoor PM2.5 concentrations in gers using coal stoves in Ulaanbaatar, Mongolia. Int. J. Environ. Res. Public Health 2018, 15, 2524. [Google Scholar] [CrossRef] [PubMed]
- Ang, B.W. Decomposition analysis for policymaking in energy: Which is the preferred method? Energy Policy 2004, 32, 1131–1139. [Google Scholar] [CrossRef]
- Gao, Z.; Geng, Y.; Wu, R.; Chen, W.; Tian, X. Analysis of energy-related CO2 emissions in China’s pharmaceutical industry and its driving forces. J. Clean. Prod. 2019, 223, 94–108. [Google Scholar] [CrossRef]
- Ang, B.W. The LMDI approach to decomposition analysis: A Practical Guide. Energy Policy 2005, 33, 867–871. [Google Scholar] [CrossRef]
- World Energy Balances. Total Final Consumption by Source, Mongolia 1990–2019. 2019. Available online: https://www.iea.org/data-and-statistics?country=MONGOLIA&fuel=Energy%20consumption&indicator=Total%20final%20consumption%20(TFC)%20by%20source (accessed on 19 July 2019).
- World Bank National Accounts Data. GDP (current US$)-Mongolia. 2018. Available online: https://data.worldbank.org/indicator/NY.GDP.MKTP.CD?locations=MN (accessed on 23 December 2019).
- Statistic Department of Ulaanbaatar. Population by Khoroo. 2018. Available online: http://ubstat.mn/JobTables.aspx (accessed on 23 March 2019).
- Sharma, N. The Decoupling of GDP and Energy Growth: A CEO Guide 2019. Available online: https://www.mckinsey.com/industries/electric-power-and-natural-gas/our-insights/the-decoupling-of-gdp-and-energy-growth-a-ceo-guide (accessed on 9 December 2019).
- National Statistical Information Service, Ulaanbaatar, Mongolia. Population Growth. 2018. Available online: http://www.1212.mn/stat.aspx?LIST_ID=976_L03 (accessed on 23 January 2019).
- Green Development Strategic Action Plan for Ulaanbaatar. British Embassy Ulaanbaatar and The Asia Foundation. 2020. Available online: https://asiafoundation.org/resources/pdfs/GreenDevelopment%20StrategicActionPlanforUlaanbaatar2020.pdf (accessed on 10 January 2020).
- Urban Air Pollution Analysis for Ulaanbaatar, Mongolia. 2008. Available online: https://papers.ssrn.com/sol3/papers.cfm?abstract_id=1288328 (accessed on 19 March 2020).
- Cousins, S. Bulletin of the World Health Organization. Air Pollution in Mongolia. 2008. Available online: https://www.who.int/bulletin/volumes/97/2/19-020219/en/ (accessed on 10 January 2020).
- International Energy Agency. Renewables Share in Final Energy Consumption (SDG 7.2) in Mongolia. 2016. Available online: https://www.iea.org/data-and-statistics?country=MONGOLIA&fuel=Renewables%20and%20waste&indicator=Renewable%20share%20in%20final%20energy%20consumption%20(SDG%207.2)%20 (accessed on 23 May 2019).
- Geng, Y.; Sarkis, J.; Wang, X.B.; Zhao, H.Y.; Zhong, Y.G. Regional application of ground source heat pump in China: A case of Shenyang. Renew. Sustain. Energ. Rev. 2013, 18, 95–102. [Google Scholar] [CrossRef]
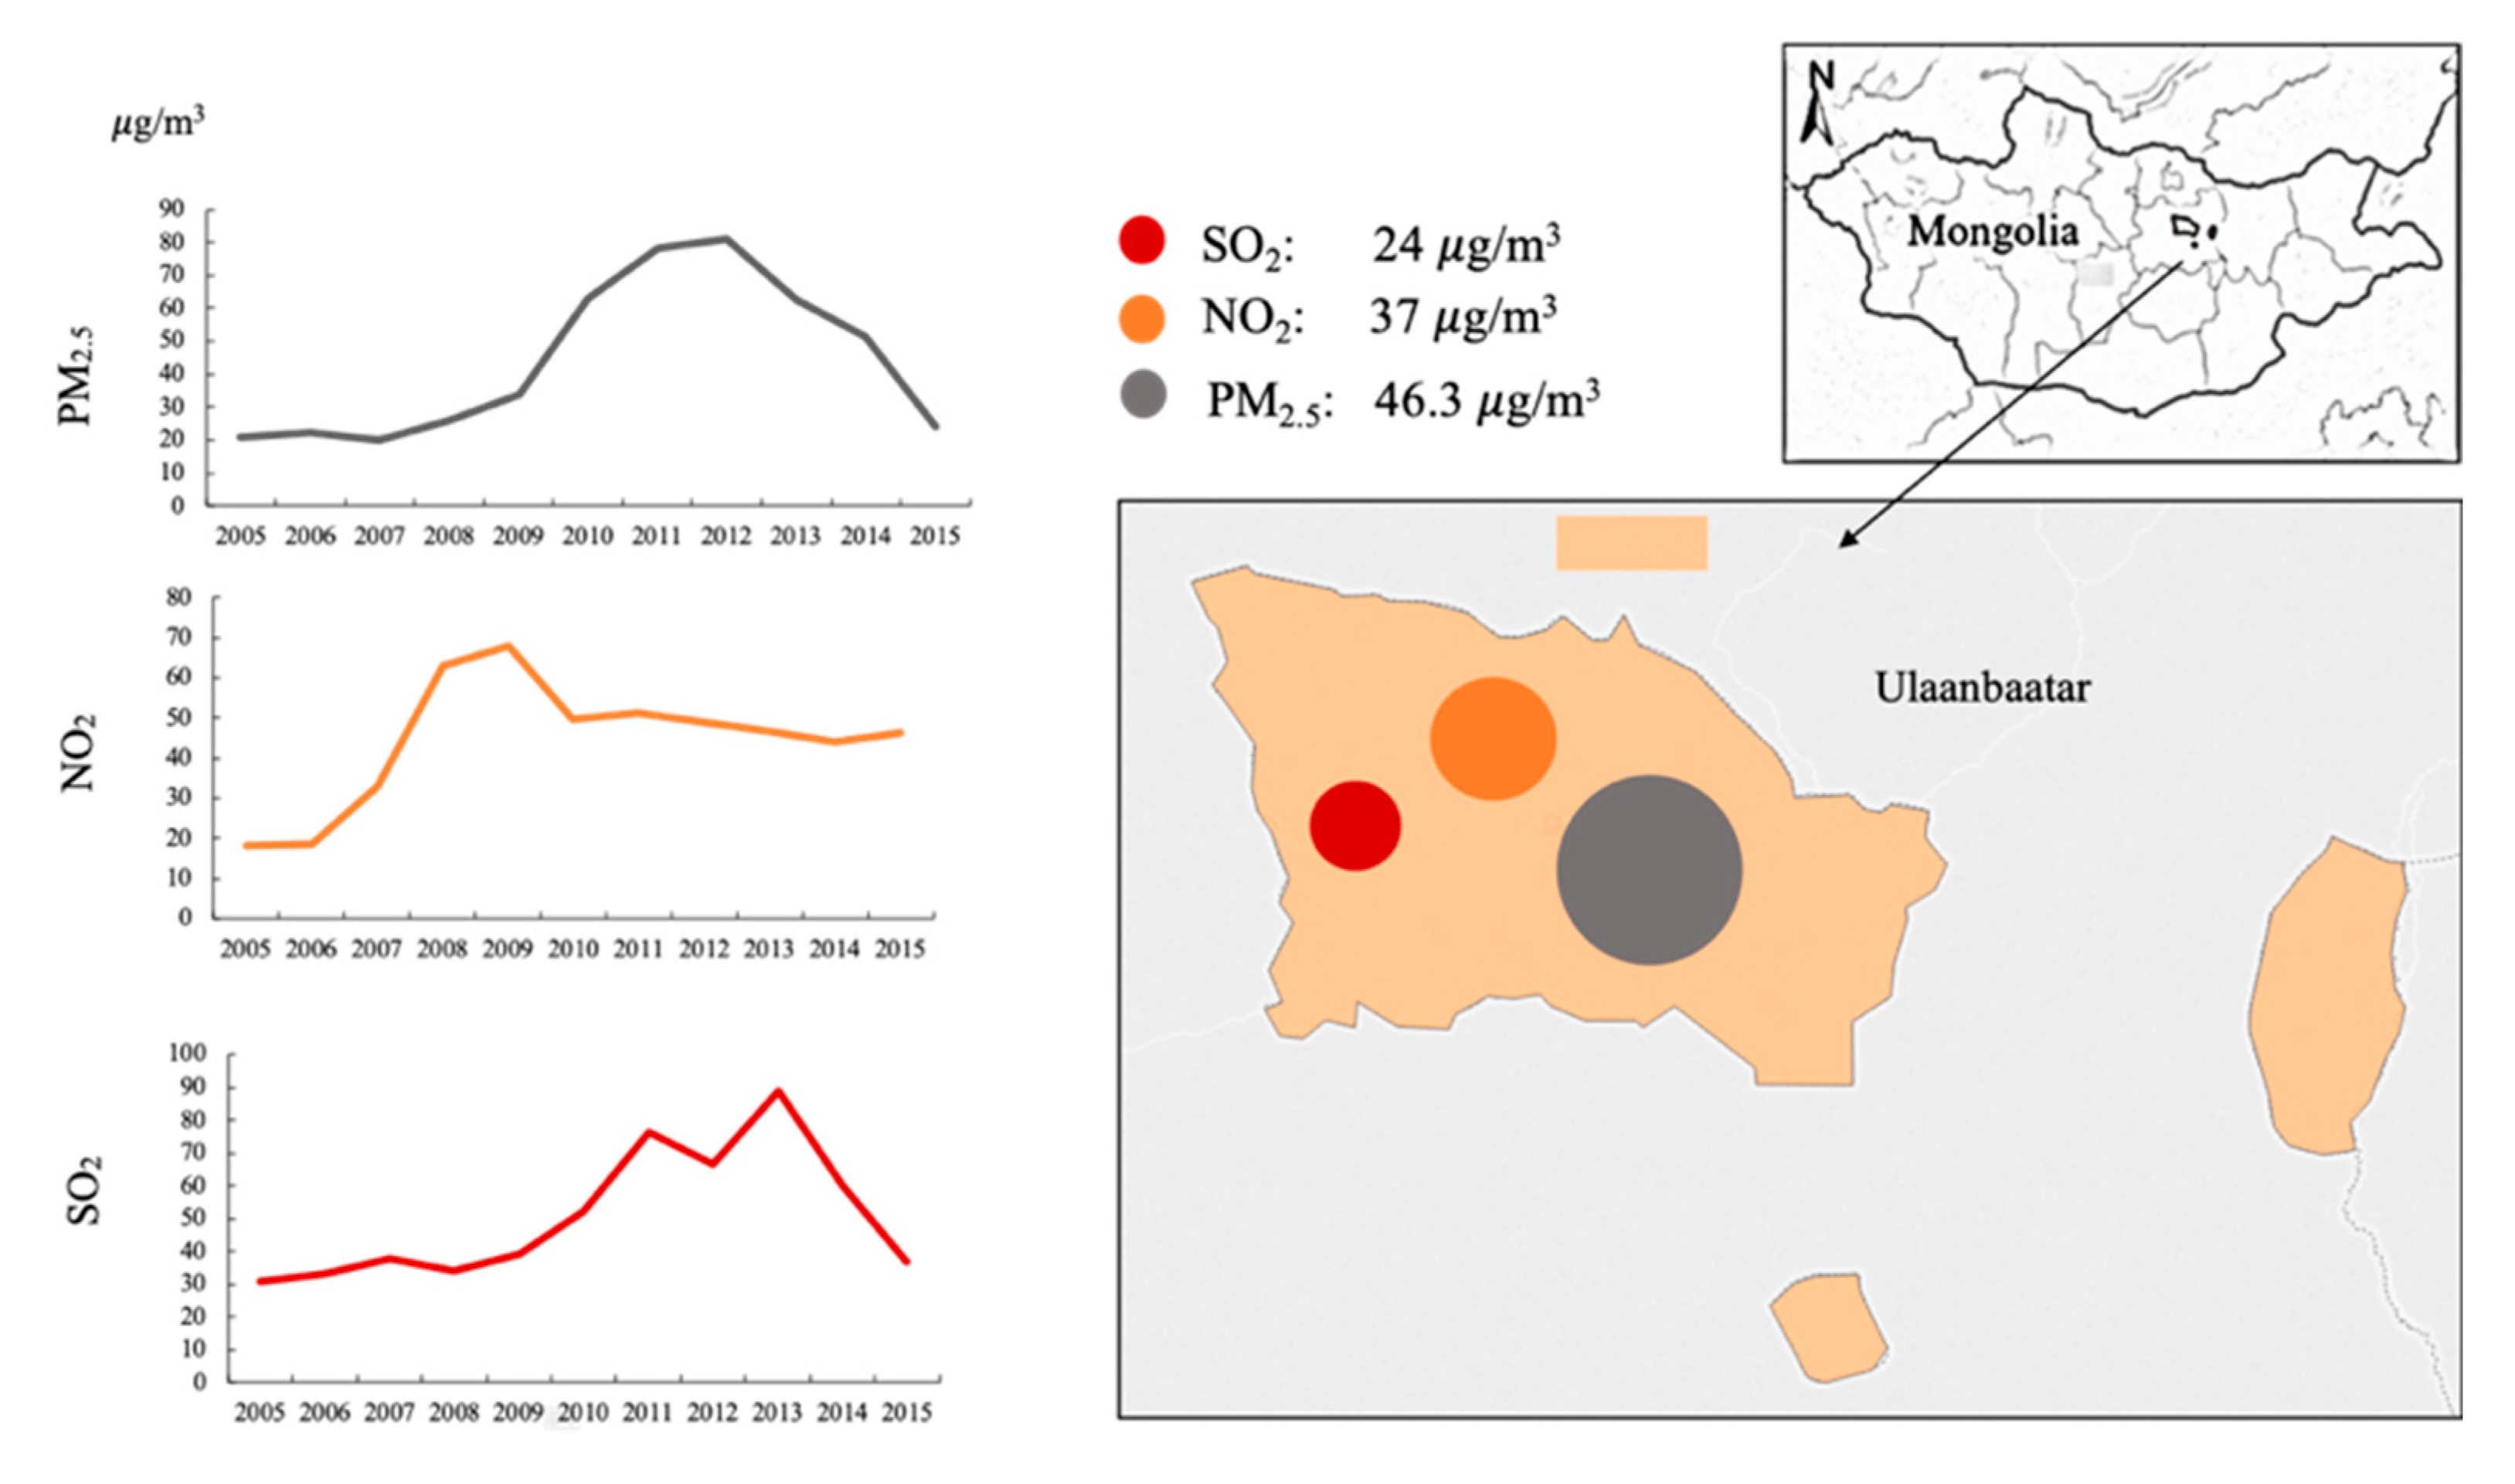
| Variable | Determinant | Unit | Description | Description and Definition |
|---|---|---|---|---|
| CI | C/F | g/m3 (micrograms per cubic meter)/kilotons of oil equivalent (ktoe) | Pollution intensity | measures the amount of air pollutant concentrated per unit of fossil fuel |
| F/E | ktoe/ktoe | Energy structure | stands for the energy structure effect | |
| E/GDP | ktoe/billion dollar | Energy intensity | measures the energy consumption per unit of GDP, representing the energy intensity effect | |
| GDP/P | billion dollar/thousand people | Economic growth | presents the economic growth scale; for example, measures the GDP per capita of P | |
| P | thousand people | Population growth | measures the population growth |
© 2020 by the authors. Licensee MDPI, Basel, Switzerland. This article is an open access article distributed under the terms and conditions of the Creative Commons Attribution (CC BY) license (http://creativecommons.org/licenses/by/4.0/).
Share and Cite
Enkhbat, E.; Geng, Y.; Zhang, X.; Jiang, H.; Liu, J.; Wu, D. Driving Forces of Air Pollution in Ulaanbaatar City Between 2005 and 2015: An Index Decomposition Analysis. Sustainability 2020, 12, 3185. https://doi.org/10.3390/su12083185
Enkhbat E, Geng Y, Zhang X, Jiang H, Liu J, Wu D. Driving Forces of Air Pollution in Ulaanbaatar City Between 2005 and 2015: An Index Decomposition Analysis. Sustainability. 2020; 12(8):3185. https://doi.org/10.3390/su12083185
Chicago/Turabian StyleEnkhbat, Enkhjargal, Yong Geng, Xi Zhang, Huijuan Jiang, Jingyu Liu, and Dong Wu. 2020. "Driving Forces of Air Pollution in Ulaanbaatar City Between 2005 and 2015: An Index Decomposition Analysis" Sustainability 12, no. 8: 3185. https://doi.org/10.3390/su12083185
APA StyleEnkhbat, E., Geng, Y., Zhang, X., Jiang, H., Liu, J., & Wu, D. (2020). Driving Forces of Air Pollution in Ulaanbaatar City Between 2005 and 2015: An Index Decomposition Analysis. Sustainability, 12(8), 3185. https://doi.org/10.3390/su12083185


