Article

Xanthomonas Wilt of Banana Drives Changes in Land-Use and Ecosystem Services Across Infected Landscapes

1
The Alliance of Bioversity International and CIAT, P.O. Box 24384, Kampala, Uganda
2
Farming Systems Ecology, Wageningen University, P.O. Box 563, 6700 AN Wageningen, The Netherlands
3
Agroecology, Environment and Systems Group, Instituto de Investigaciones Forestales y Agropecuarias de Bariloche (IFAB), San Carlos de Bariloche 8400, Río Negro, Argentina
4
Groningen Institute of Evolutionary Life Sciences, Groningen University, Nijenborgh 7, 9747 AG Groningen, The Netherlands
5
International Institute of Tropical Agriculture (IITA), P.O. Box 7878, Kampala, Uganda
6
The Alliance of Bioversity International and CIAT, P.O. Box 1860, Bukavu, South Kivu, Democratic Republic of Congo
7
INERA, Mulungu, Research Station, Bukavu, South Kivu, P.O. Box 2037, Kinshasa 1, Democratic Republic of Congo
8
IITA, Kalambo, P.O. Box 1222, Bukavu, South Kivu, Democratic Republic of Congo
9
The Alliance of Bioversity International and CIAT, P.O. Box 5689, Addis Ababa, Ethiopia
*
Author to whom correspondence should be addressed.
Sustainability 2020, 12(8), 3178; https://doi.org/10.3390/su12083178
Submission received: 18 November 2019 / Revised: 18 January 2020 / Accepted: 23 January 2020 / Published: 15 April 2020
(This article belongs to the Section Sustainable Agriculture)

Abstract

:
Changes in land-use have been observed in banana-based systems in the African Great Lakes region affected by Xanthomonas wilt disease (XW) of banana. Through focus group discussions (FGDs) and the 4-cell method (to map the area under production and the number of households involved), changes in land-use were assessed in 13 XW-affected landscapes/villages along a 230 km transect from Masisi (where XW arrived in 2001) to Bukavu (XW arrived around 2014) in the Eastern Democratic Republic of Congo. Farmers’ perceptions on the sustainability of new land uses were also documented. Soil nutrient content and erosion levels were measured for five major land-use options/trajectories on 147 fields across 55 farms in three landscapes along the transect. From banana being ranked the most important crop (92% of landscapes) before XW outbreaks, its importance had declined, with it grown on smaller farms by most households in 36% of the landscapes, while in 64% of cases by few households on smaller plots. Farmers uprooted entire banana mats or fields, expanding land under other crops. Species richness did not change at landscape level, although 21 crops were introduced at farm level. Banana is, however, still perceived as more sustainable due to its multi-functional roles. Soils under banana had better chemical attributes, while high erosion levels (Mg ha−1 year−1) occurred under cassava (1.7–148.9) compared with banana (0.3–10.7) and trees (0.3–5.9). The shifts from banana could thus affect supply of key services and sustainability of the farming systems. This study offers a good basis for interventions in XW-affected landscapes.

1. Introduction

Musa spp. (banana and plantain, hereafter banana) is an important food and income fruit crop the world over [1]. The crop ranks sixth in production, with an annual world production of about 144.6 million Mg [2]. The East and Central African Great Lakes region contributes one-third of the world production, with production estimates of 5.2, 1.8, 1.4 and 1.4 million Mg ha−1 year−1 reported for Uganda, Rwanda, Burundi, and the Democratic Republic of Congo, respectively [2]. In this region, banana provides above 25% of food energy needs of over 70 million people [3,4] and is also important for income generation through market sales [5,6]. The region is a secondary centre of diversity for the East African Highland bananas (AAA genome) and plantains (AAB genome) [7,8]. Banana in the region, is mainly grown as a perennial crop/permanent vegetation and plantations that are 30 to 50 years old are very common [9,10].
The crop is grown across a wide range of agroecological zones either as the sole crop or in association with various annual or perennial crops, offering a broad range of ecosystem services in addition to food, feed and fibre [11]. The thick year-round canopy offered by its broad leaves, the mulch cover provided by dead leaves, leaf sheaths and harvested plant parts and an extended superficial root system help reduce soil erosion [12,13,14], hence contributing to the resilience of the agroecosystems. The banana crop could thus be considered as a foundation species in this part of the world. A foundation species is a common/abundant species whose attributes (structural or functional) define an ecological community or ecosystem [15]. Tampering with a foundation species can potentially affect the socio-cultural, economic, and ecological resilience of a landscape. Modest to dramatic decline has been observed over the past two decades in the lifespan and productivity of banana plantations, and food and income security of banana-dependent households has been severely affected by pests (weevils and nematodes) and diseases (mainly Xanthomonas wilt, banana bunchy-top disease and Fusarium wilt).
The banana Xanthomonas wilt disease (XW), which is the most recent of the biotic constraints, has been particularly devastating to banana production in this period in the region. First observed in Ethiopia in 1939 [16], XW was reported in Uganda and the Eastern DR Congo in 2001 [17,18] and has since spread to the entire East and Central Africa region, compromising plantations, and food and income security at local, national and regional levels [19]. The disease causes the death of affected plants and makes infected bunches inedible. As a control measure, or out of frustration, there has been widespread cutting and uprooting of diseased mats or fields. In response to the disease, farmers have also been reported to have diversified into other crop species and off-farm activities [20]. Thus, in addition to XW effects on food and income security, the disease has been postulated to be accompanied by changes in land-use and crop species composition at farm and landscape level, with potential positive or negative effects on the food systems and other ecosystem services. These changes have not been systematically documented as a basis for evaluating the repercussions to livelihood outcomes and ecosystem services in the affected landscapes.
This study analysed the (i) trajectories of change in land-use patterns in response to XW in the XW-affected landscapes, (ii) changes in production, consumption and marketing of banana and other key crop species in the landscape, (iii) soil nutrient content and amount of soil erosion for major land-use types and (iv) farmers’ perceptions on the sustainability of the new land uses. Objectives (i) and (ii) were achieved through recall studies in landscapes exposed to XW disease for time periods varying between 1 to 14 years. Objectives (iii) and (iv) were attained through field measurements and interviews across farms.

2. Materials and Methods
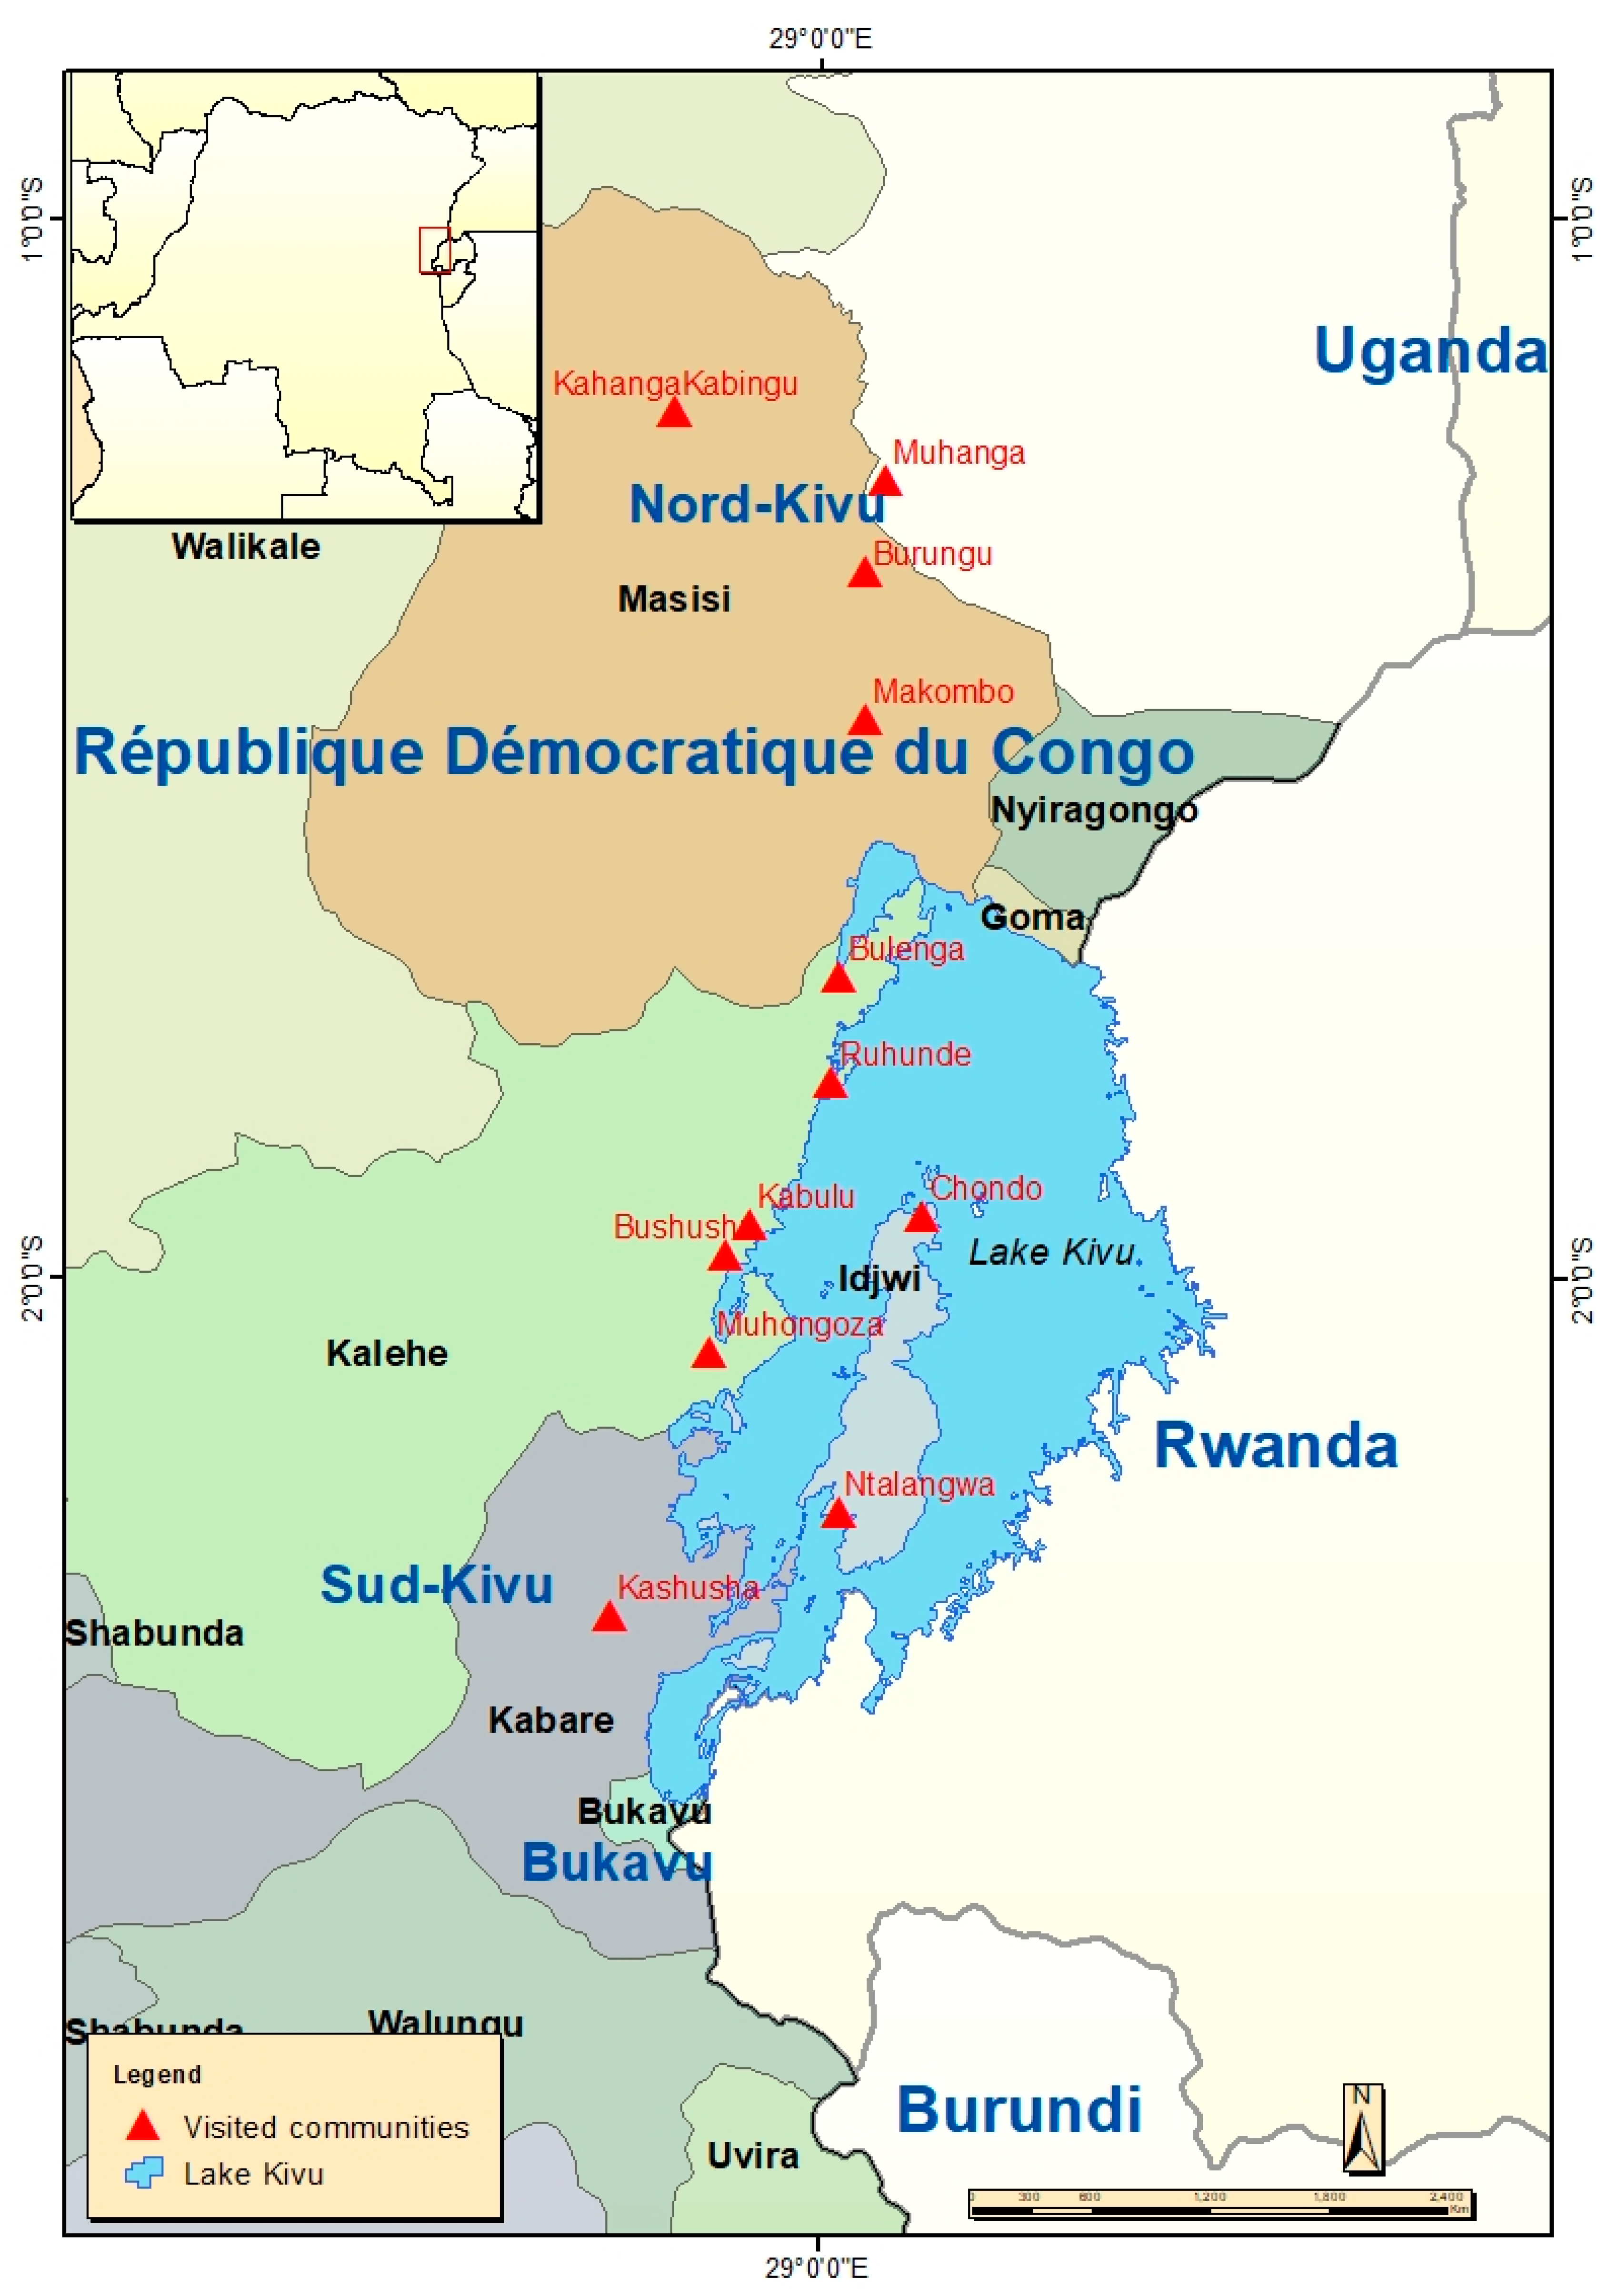
2.1. Study Area

This study was conducted in the eastern part of the Democratic Republic of Congo (DR Congo) that comprises two provinces, North Kivu and South Kivu. The province of North Kivu covers an area of 59,631 km2 and has 4.9 million inhabitants. It is located between 0°58′ latitude North to 02°03′ latitude South and 27°14′–29°58′ longitude East [21], mean annual rainfall ranges between 1268 mm and 1556 mm and an altitude range of 909–1803 meters above sea level (m) [22]. South Kivu is located between 1°36′–5° latitude South and 26°47′–29°20′ longitude East and has an area of 69,130 km2 and a population of 3.9 million people [21]. Annual rainfall in South Kivu varies between 1437 mm and 1661 mm and an altitude range varying between 950 to 2019 m [22]. The mean annual temperature across the study region varies between 23 and 24 °C (https://www.accuweather.com/en/cd/democratic-republic-of-the-congo-weather).
In this predominantly highland region, agriculture is the main basis of livelihoods of the rural and peri-urban population, with most of them farming at a subsistence level. Banana and plantain are important staple and cash crops contributing to the food and income security of over five million people [23]. For example, banana/plantain and their products (e.g., beer) were reported to provide about 80 percent of incomes in South Kivu (Food for the Hungry, 2013 as cited in [24]).

2.2. Land-Use Trajectories and Food Systems

The study was conducted along a 230 km-long axis from Masisi in North Kivu province to Bukavu in South Kivu province (Figure 1) in 2015. This transect was selected as a case study because it starts at a disease front and comprises sites with various timespans of high disease presence/pressure.
A land-use class in this study is described by its purpose for different crop species. de Bie [25] describes a land-use class as a taxon entirely based on information on land-use purpose and operation sequence. The land-use data for this study was collected using a total of 13 village-level focus group discussions (FGDs). Eleven of the 13 FGDs were conducted at approximately 20 km intervals along the 230 km axis starting from Kahanga-Kabingu village in Masisi territory to Kashusha village in Bukavu, while the other two FGDs were conducted on Idjwi Island (i.e., Idjwi North and Idjwi South) located in Lake Kivu, South-Kivu province (Figure 1, Table 1). Xanthomonas wilt disease was first reported at Masisi in the year 2001, while it arrived at Bukavu, the last FGD location, in 2014 (Figure 1, Table 1).
The snowball sampling technique was used for the identification of parishes affected by XW along the study transect. With the snowball sampling technique [26], the existing study objects inform the recruitment of the subsequent subjects based on their acquaintance. Within the parishes, villages affected by XW were purposively sampled for the FGDs through interaction with community leaders, key informants and extension agents in the study area (Table 1).
A total of 10 farmers in a sex ratio 1:1, each at least 30 years of age participated in each FGD. Precaution was taken to select only farmers that had been fully active in the study sites for a period of over 10 years. It was postulated that this category of farmers had a better understanding/experience with the impact of the biotic stresses, especially XW, and understanding of the changes and trajectories in the crop diversification and food systems at these sites. The distribution of the FGDs in the study area is detailed in Table 1 below.
The FGDs were guided using a structured questionnaire (S1). The facilitator used a checklist to elicit information from the participants and probed for triangulation of the responses whenever necessary. Care was also taken to ensure full participation of all the FGD participants. A four-cell chart [27,28] was used to retrospectively rank the land-use for crop species or cultivar diversification trajectories and changes in the landscapes affected by XW. The four-cell is a participatory rapid rural appraisal technique created to assess agrobiodiversity and local food system flows [28,29]. It allows for a quick identification and assessment of changes in food security and diet diversity [28]. The four-cell chart ranks species abundance and distribution by looking at area under production and the number of households involved in production. This results into four cells or groupings, i.e., a species being grown on: (i) a large acreage and being produced by many households; (ii) large acreage but by few households; (iii) small acreage but by many households and (iv) small acreage and few households (Figure 2).
Through the FGDs, farmers perceptions on the future role of banana and the ability of the major land-use trajectories to fill the gap left by the banana crop were also obtained. FGD participants were specifically asked to give the comparative advantage of the alternative crops in terms of food security and nutrition, incomes, susceptibility to biotic and abiotic shocks, labour demand and supply of selected ecosystem services.
Data collected through the FGDs were coded and analysed using both quantitative and qualitative methods. Descriptive statistics were carried out using STATA and GenStat v. 16 software [30]. The qualitative information was either used to explain and interpret the quantitative information provided by the respondents during the group discussions or compiled and sorted through a coding process to generate descriptive tables and figures.

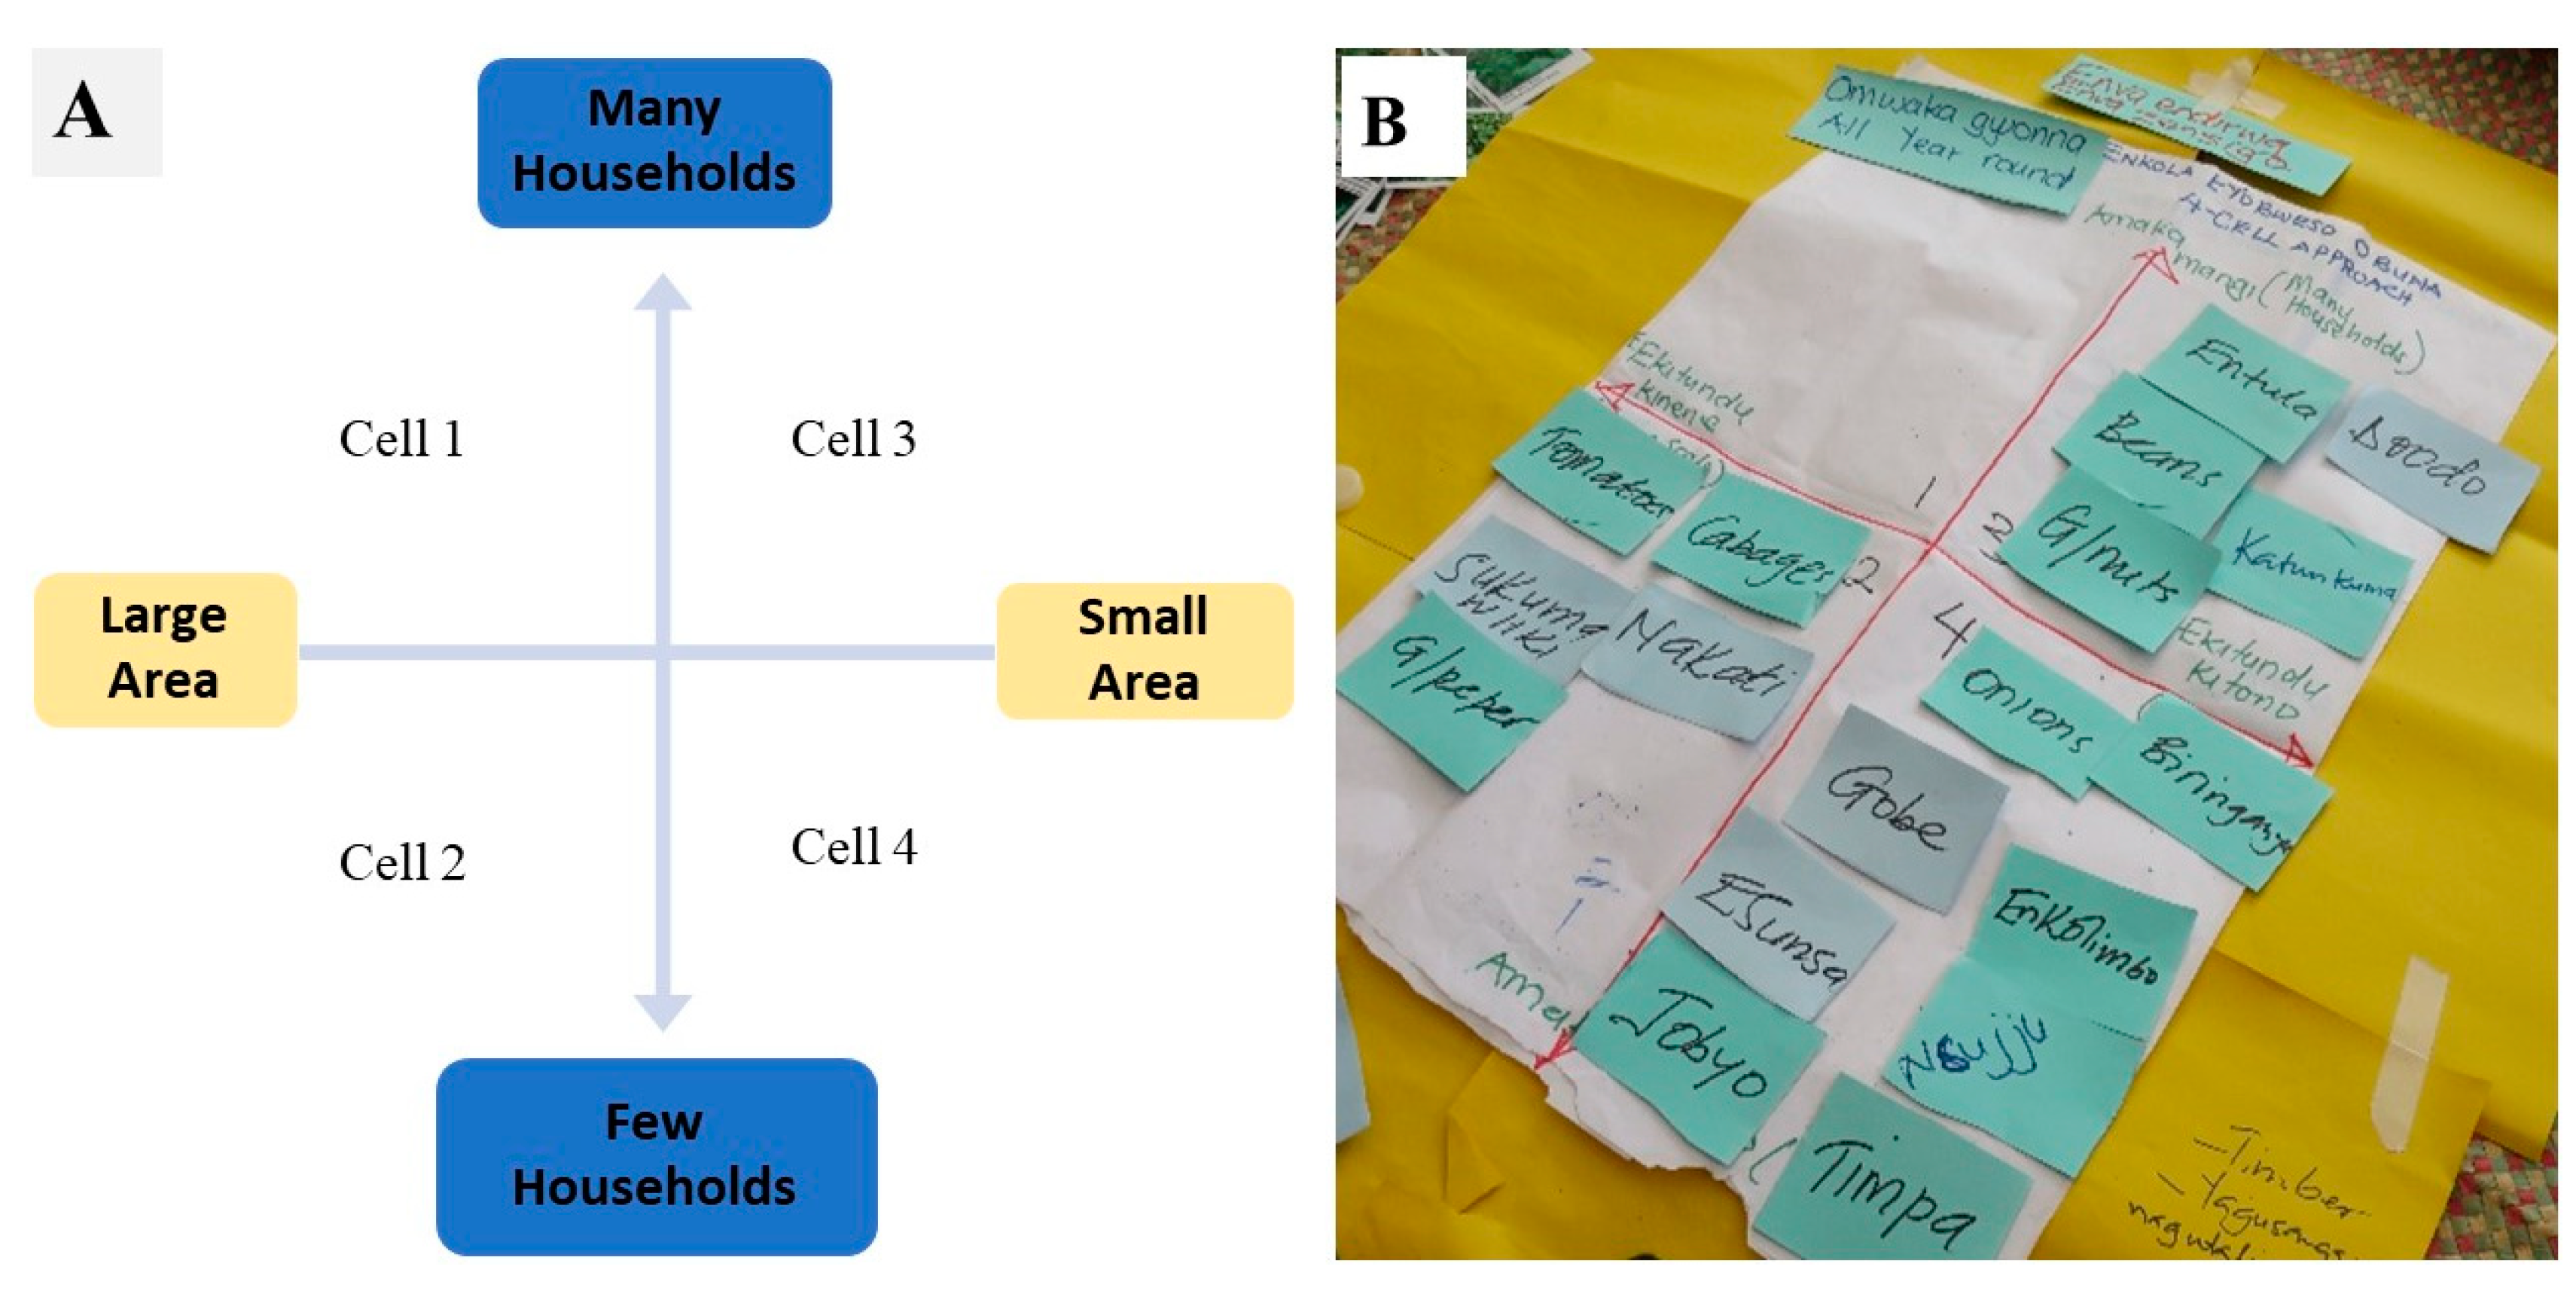
2.3. Effect of XW Driven Land-Use Trajectories of Change on Selected Supporting and Regulatory Ecosystem Services

To determine the potential effect of land-use changes and trajectories towards other crop species other than banana on selected supporting and regulatory services (objective iv), 147 fields on 55 different farms across three landscapes in South Kivu province along the transect, namely Idjwi North (Northern part), Katana (midway) and Mushinga (southern part) were examined. Soil physio-chemical properties and soil erosion rates were determined for the land-use options on these fields to infer the potential effect of the land-use changes due to XW on ecosystem services. Soil chemical properties served as a proxy for nutrient recycling, an import supporting ecosystem function, while soil erosion rates served as proxy for erosion control, an important regulatory service in the landscape. Soil-related agroecosystem services such as pest and disease regulation, nutrient flows, soil formation and structure are provided by several interrelated processes that govern decomposition, soil formation, soil structure, erosion control, soil moisture and aeration, and cycling of mineral nutrients and carbon [31]. These soil variables are reported to be good measures of the effect of farm management on soil health and a good proxy for soil ecosystem services [31,32,33].

2.3.1. Soil Carbon and Nutrients

The content of soil organic matter (SOM), total nitrogen (N), available phosphorus and exchangeable bases (K and Ca) were measured as indicators for soil quality and were used to compare different land-use options and to infer the potential impact of the land-use trajectories. Composite samples of five soil cores (2 cm in diameter and 15 cm deep; using a soil auger) were collected diagonally in fields under different land uses (crops or plant species) in the middle of the main growing season (i.e., October 2016). Each sample was air dried, sieved to pass through a 2 mm mesh and analysed for soil pH and nutrient composition at the National Agricultural Research Laboratories, Kawanda, in Central Uganda. The exchangeable cations and available phosphorus were extracted using Mehlich 3 extraction method at a pH of 2.5 [34] and then determined using an atomic absorption spectrophotometer. Soil organic carbon content was determined using the colorimetric method at 600 nm after digestion with potassium dichromate and sulphuric acid (i.e., Walkley–Black method). Nitrogen was extracted using sulphuric/selenium digestion mixture, at 330 ℃ and later quantified colorimetrically using the salicylate method. pH was read from a 1:2.5 soil:water extract. Soil texture was determined using the Bouyoucos hydrometer method [35].
Mean levels of SOM, N, available phosphorus and exchangeable bases across the different land-use options were analysed through Analysis of Variance (ANOVA), with means separation using Least Significant Difference (LSD) at 5%. The GenStat statistical package v.16 [30] was used for the analysis.

2.3.2. Soil Erosion Losses

Erosion rates for different land uses were determined using the revised universal soil loss equation (RUSLE) [36,37,38]. RUSLE estimates the annual erosion rate in a field based on field slope, rainfall intensity, soil type, crop characteristics and management practices. It is expressed as [36]:
A = R × K × LS × C × P
where: A = estimated average soil loss (Mg ha−1 year−1); R = rainfall-runoff erosivity factor (MJ mm ha−1 h−1 year−1); K = soil erodibility factor (Mg h MJ−1 mm−1); L = slope length factor; S = slope steepness factor; C = cover-management factor; and P = support practice factor.
Rainfall-runoff erosivity (R) is a measure of erosion potential of a rainfall event and is influenced by duration and intensity of the event; and R for the study site were in the order of 3750 MJ mm ha−1 h−1 year−1, as calculated by Vrieling et al. [39]. Soil erodibility factor K is a measure of the susceptibility of soil particles to detachment and transport by rainfall and water runoff. K was determined using the method developed by Kassam et al. [40] for Kenyan soils. Using this approach, soil texture results for each land-use unit/field (see Section 2.3.1) and soil units for the study areas were used as input for determining the K classes and the associated K values. The soil units for Mushinga, Katana and Idjwi were, respectively, haplic Acrisols, humic Cambisols and haplic Ferralsols [41,42]. On-farm data for input in the RUSLE included the slope length (L) and steepness (i.e. % slope, S) of fields, main crop species grown on fields, tillage practices and supportive field management practices. The lengths for each field or segment, was measured using a 100 m length tape measure whereas the % slope was computed using the equation:
S = Rise of slope/Run of slope × 100%
The rise (m) was obtained from the difference between the elevations of the upper and lower parts of the field along the length of the slope measured using global positioning unit (GPS, Garmin -GPSMAP 64s; www.garmin.com), whereas run of slope was obtained using the Pythagoras theorem (i.e., Run of slope2 = L2 − Rise of slope2).
LS, which is the proportion of soil loss under a given condition compared to that of a site with a standard slope steepness of 9% and length 22.13 m was determined as described by Stone and Hilborn [38] using:
LS = [0.065 + 0.0456 (S) + 0.006541 (S)2] (L ÷ constant) N
where: S = slope steepness in %; L = length of slope (m); constant = 22.13 m; and N= N values of 0.2, 0.3, 0.4 and 0.5, respectively, correspond to S values of <1, 1 ≤ slope < 3, 3 ≤ slope < 5, and ≥5.
The crop management and tillage factor (C) determines the relative effectiveness of crop and soil management in prevention of soil erosion and was computed as the product of the crop type factor (score of 0 to 1) and the tillage method (score of 0 to 1) [38]. The plant/crop canopy cover factor (ranging between 0 and 1) was estimated using Equation (4) [36,43]:
Crop type factor = 1 – Fc × exp (−0.1 × H)
where Fc is the proportion of the ground covered by the canopy, H (ft) is the distance the raindrops fall after hitting the canopy. Fc and H were captured through visual assessments and estimations on-farm. For the assessment of canopy height (H) in intercropped fields, one species was considered if dominant, otherwise an average was considered where two or more species had a more or less equal share of the land cover. Thus, the crop type factor was influenced by the level of species diversity and the attributes of the species complex. The tillage method factor was scored between ‘0’ and ‘1’ (‘0’ denoting good practice while ‘1’ a bad practice) as described by Stone and Hilborn [38]. The supportive practice factor P is the ratio of soil loss through a supportive practice to that through farming up and down the slope and varies between a scale of ‘0’ (good practice) to ‘1’ (bad practice) [38,43].
The tillage method factors, crop type/cover factor, the support practices and the soil erosion rates were compared across the dominant land-use options using ANOVA and the means separated as described in the Section 2.3.1 above. Due to an unequal distribution of land-use options across the sites and the lack of interaction between the sites and land-use options, ANOVA was only computed for the land-use options.

3. Results and Discussion

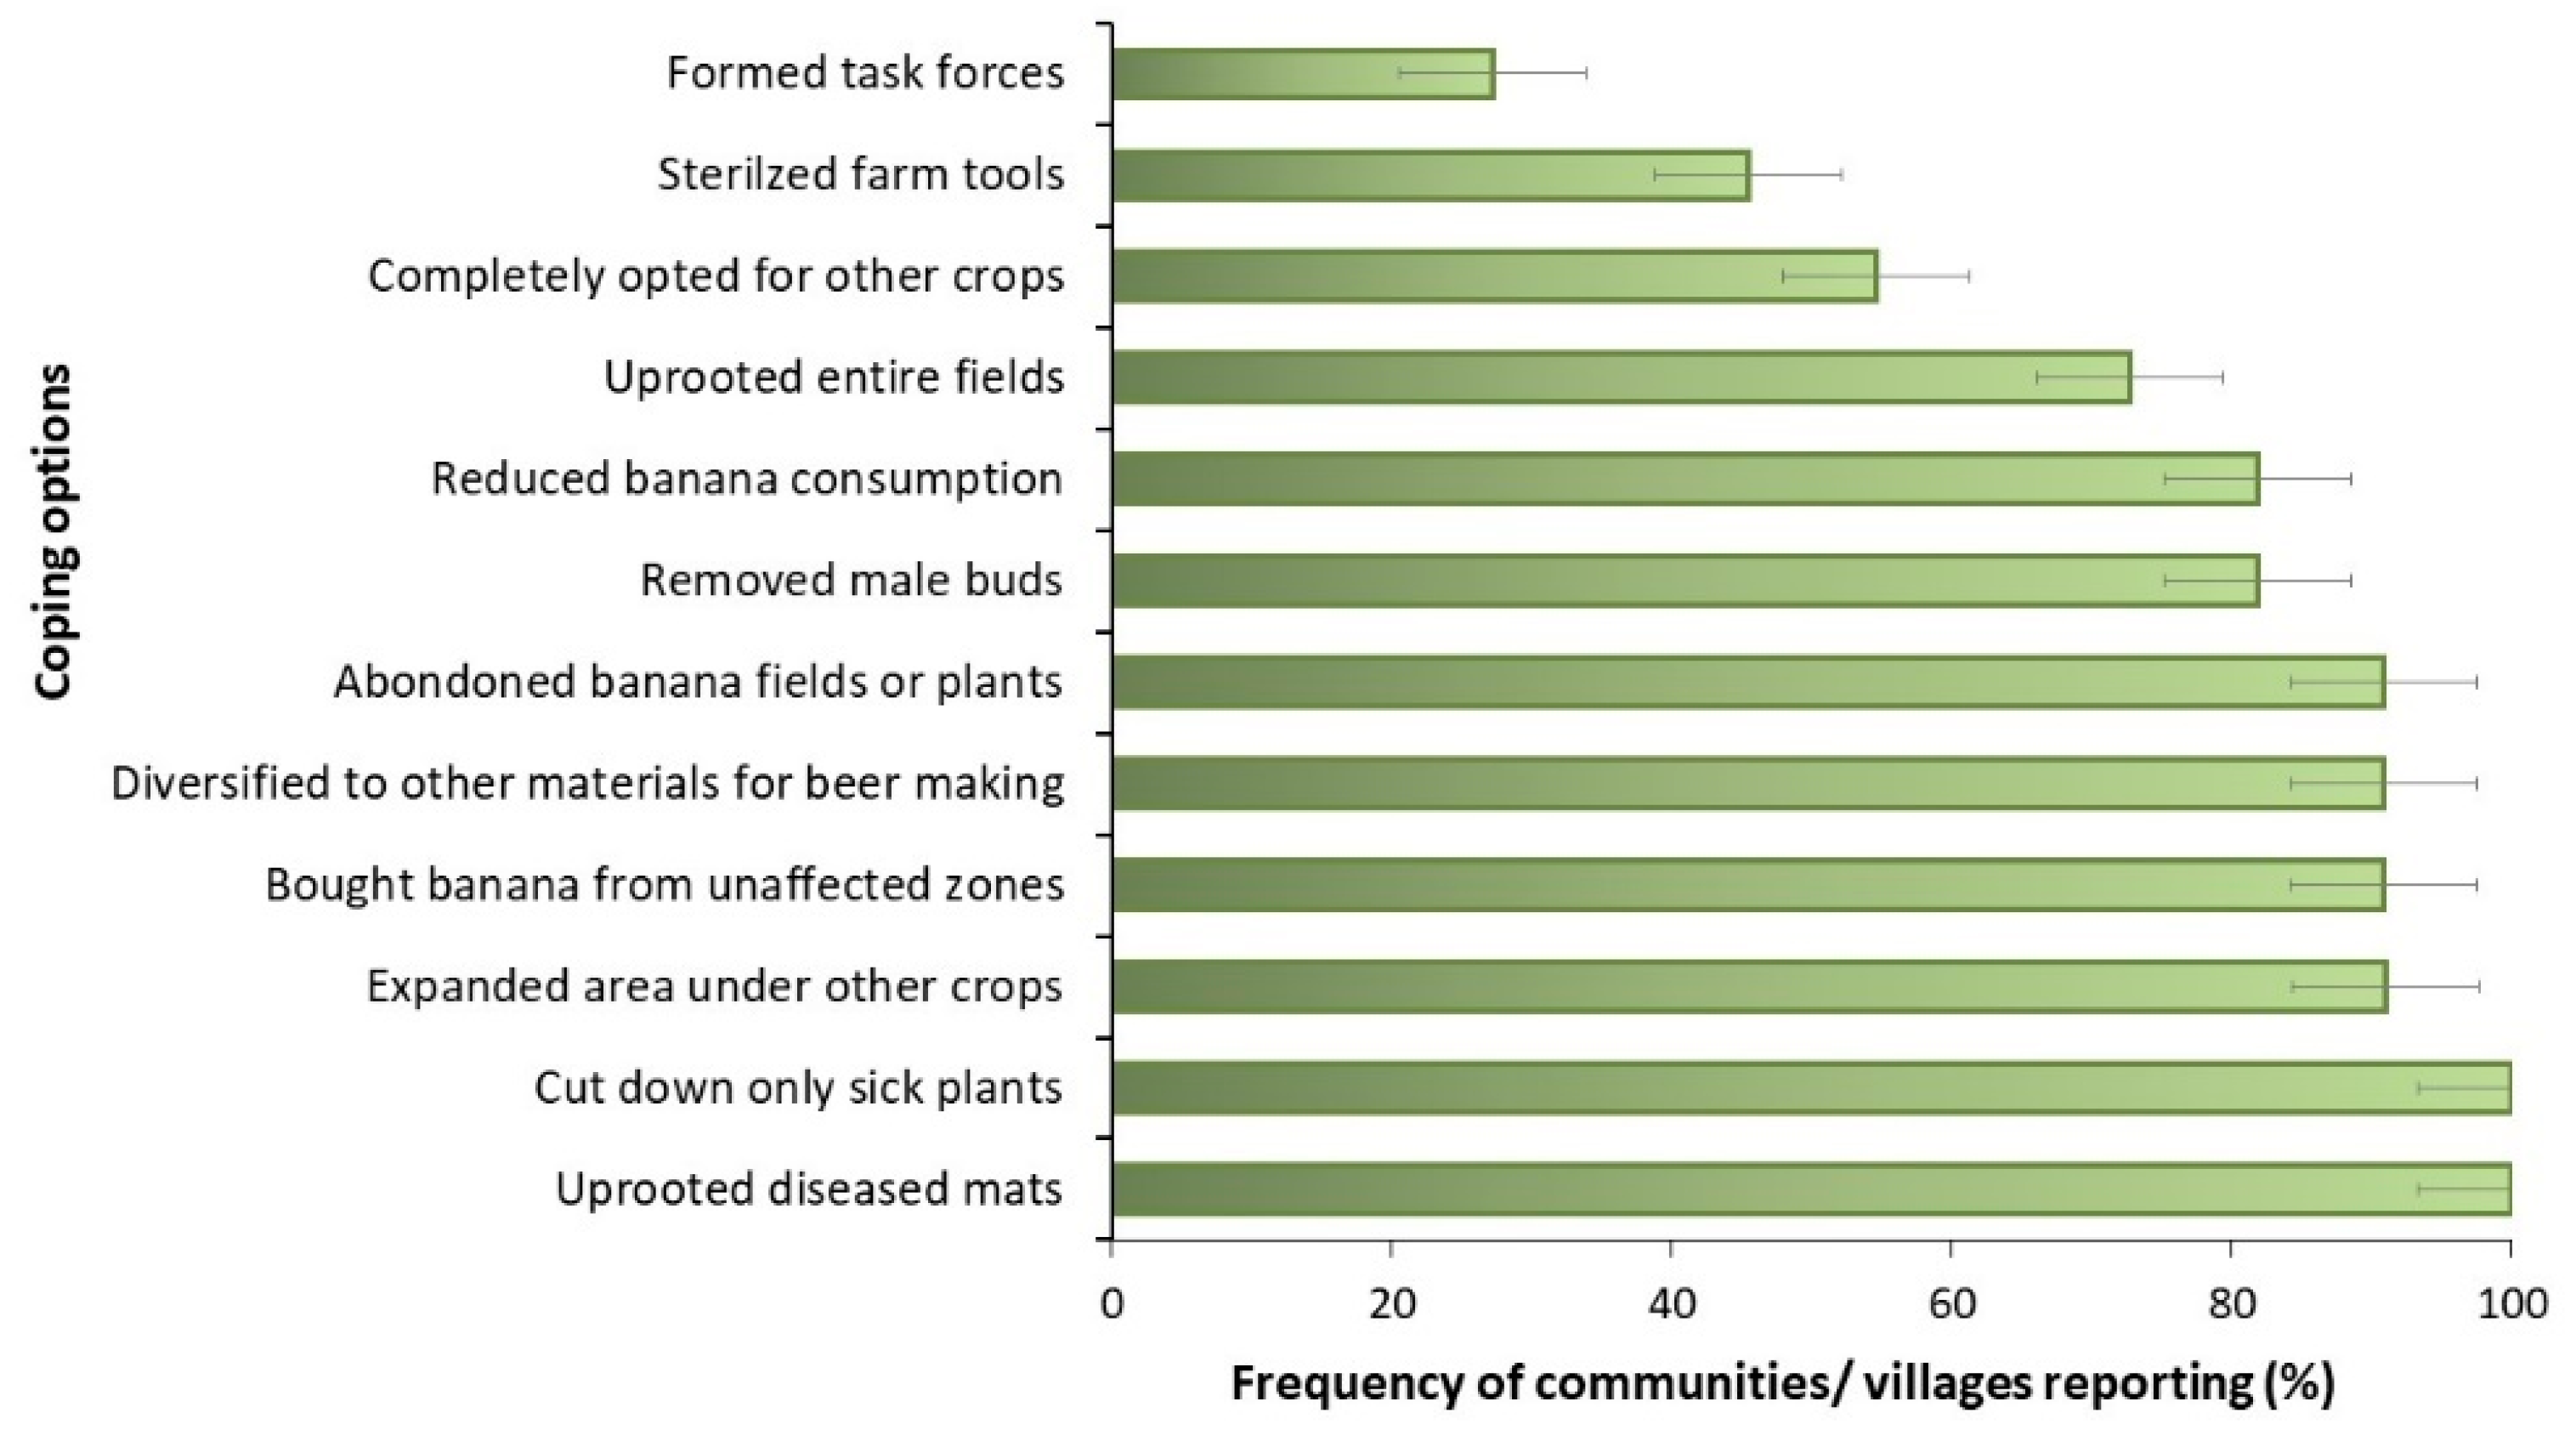
3.1. On-Farm Coping Strategies Against Xanthomonas Wilt Disease

Communities affected by XW disease stated several coping strategies (Figure 3). The most prevalent practices across communities/ landscapes included uprooting of diseased mats, cutting of sick plants and removal of male floral buds to prevent insect-mediated infections (Figure 3). These practices form the basic cultural control practices being promoted for managing XW disease [44]. Other practices being promoted such as farm tool sterilization and formation of community task forces to enforce disease control occurred in only 45% and 27% of the landscapes, respectively. Ochola et al. [45] reported some of these practices as the prevalent agroecological practices in farms affected by XW disease.
Uprooting of entire banana fields was also prevalent across 73% of the communities. In 55% and 91% of the cases, landscapes reported the complete abandoning of the banana crop and expansion of the area under other crops, respectively (Figure 3). This was mainly due to frustration due to severe yield losses and persistence of infections on farms. The consumption of banana also declined across 82% of the landscapes in the Eastern DR Congo, while in 90% of the cases, households had diversified to other crops for beer making. Nkuba et al. [46] reported changes in diets, with an increased consumption of maize and root and tuber crops (36% of households) and a reduction in the number and size of meals (52%) as coping strategies within households affected by XW in Rwanda and Tanzania.

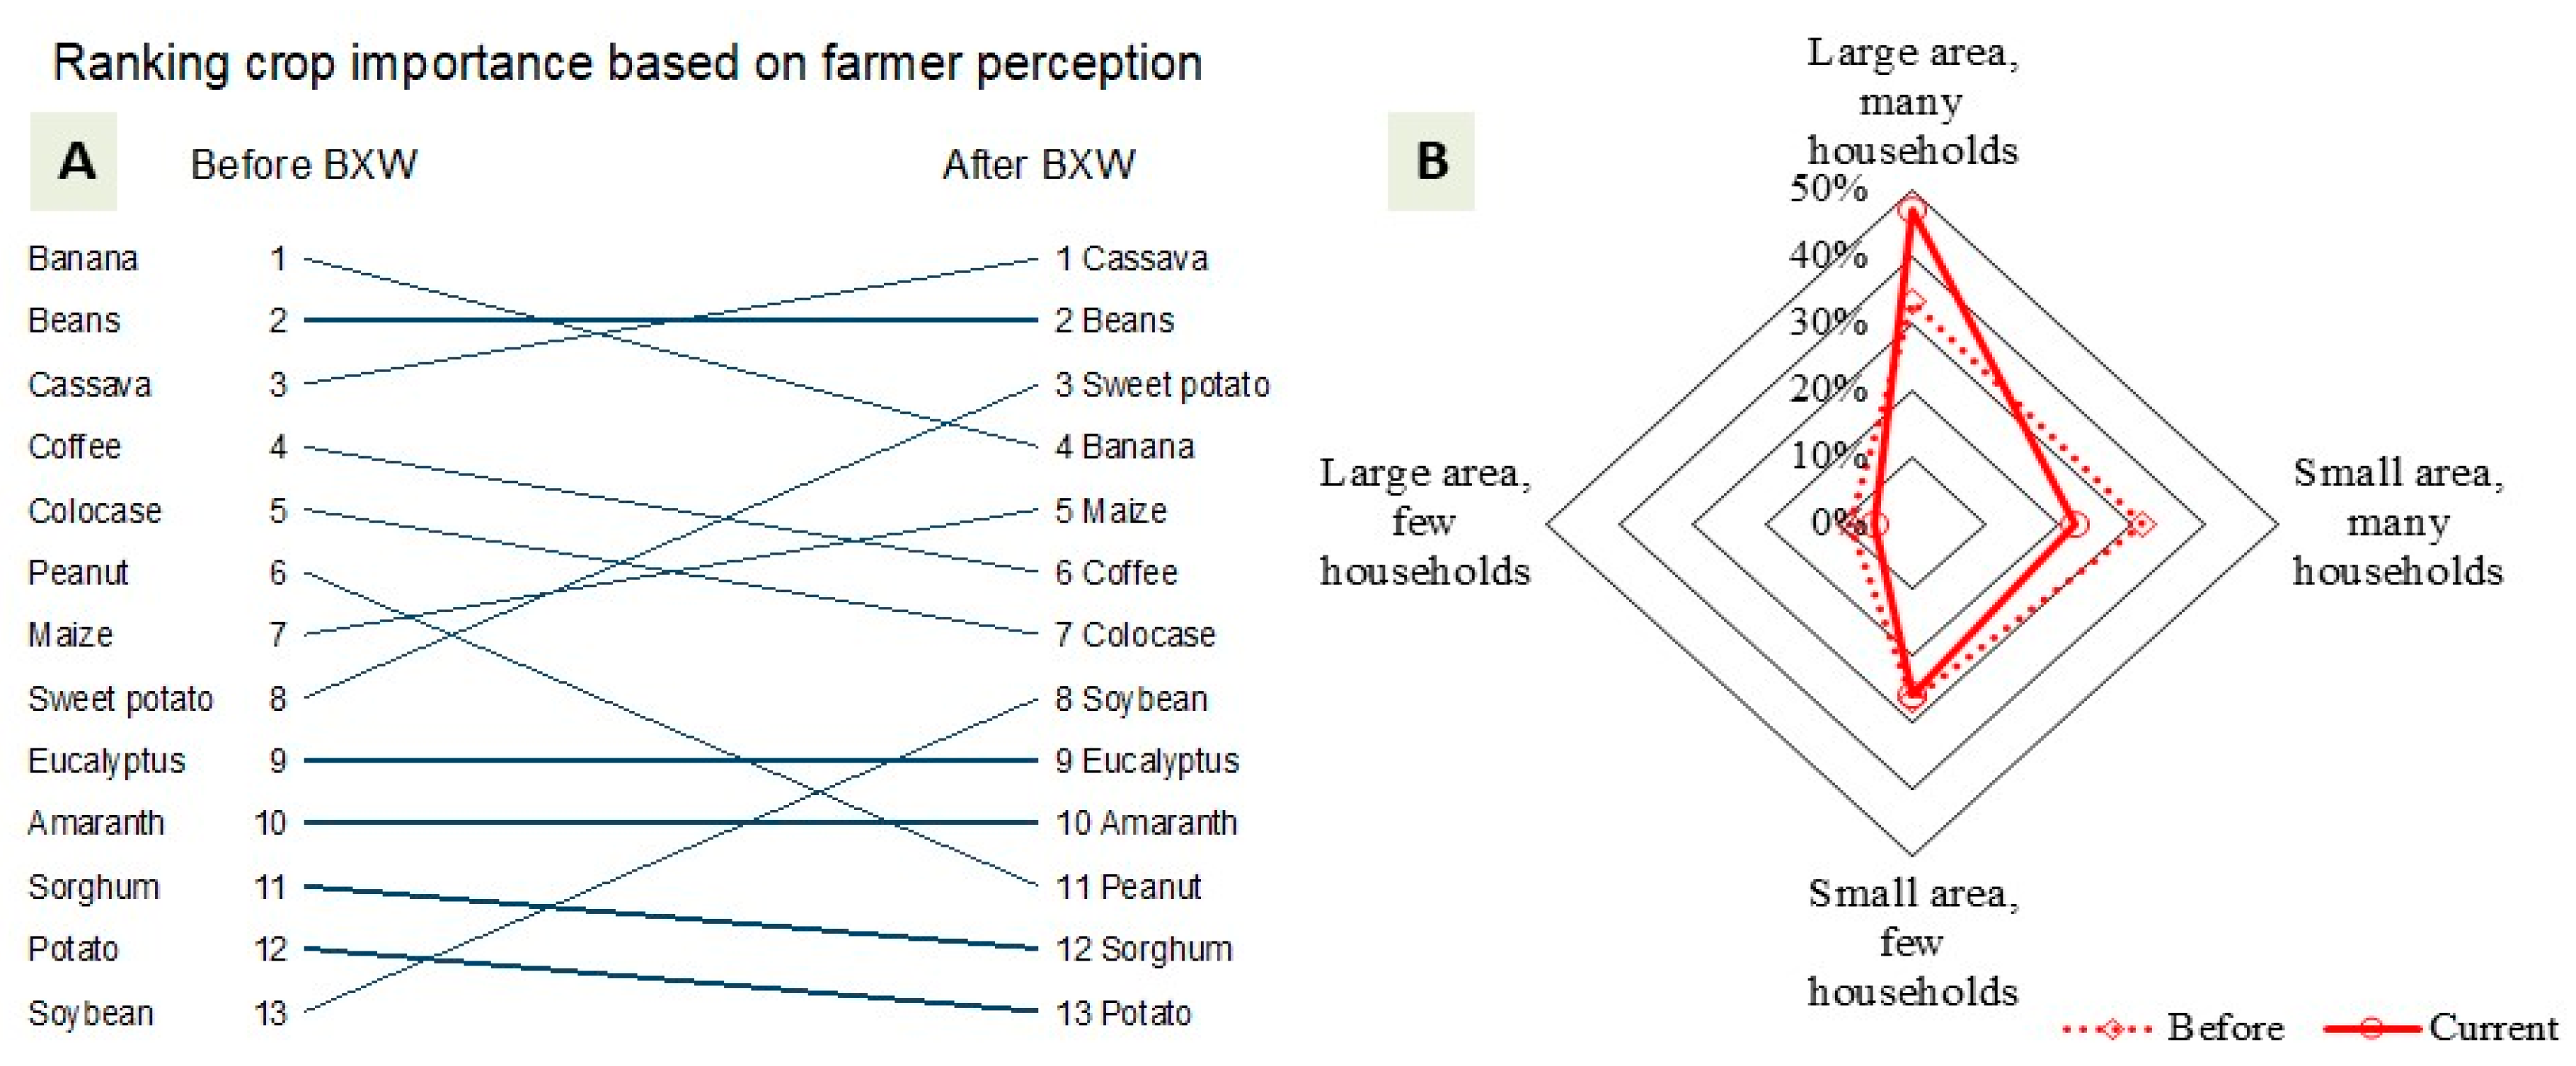
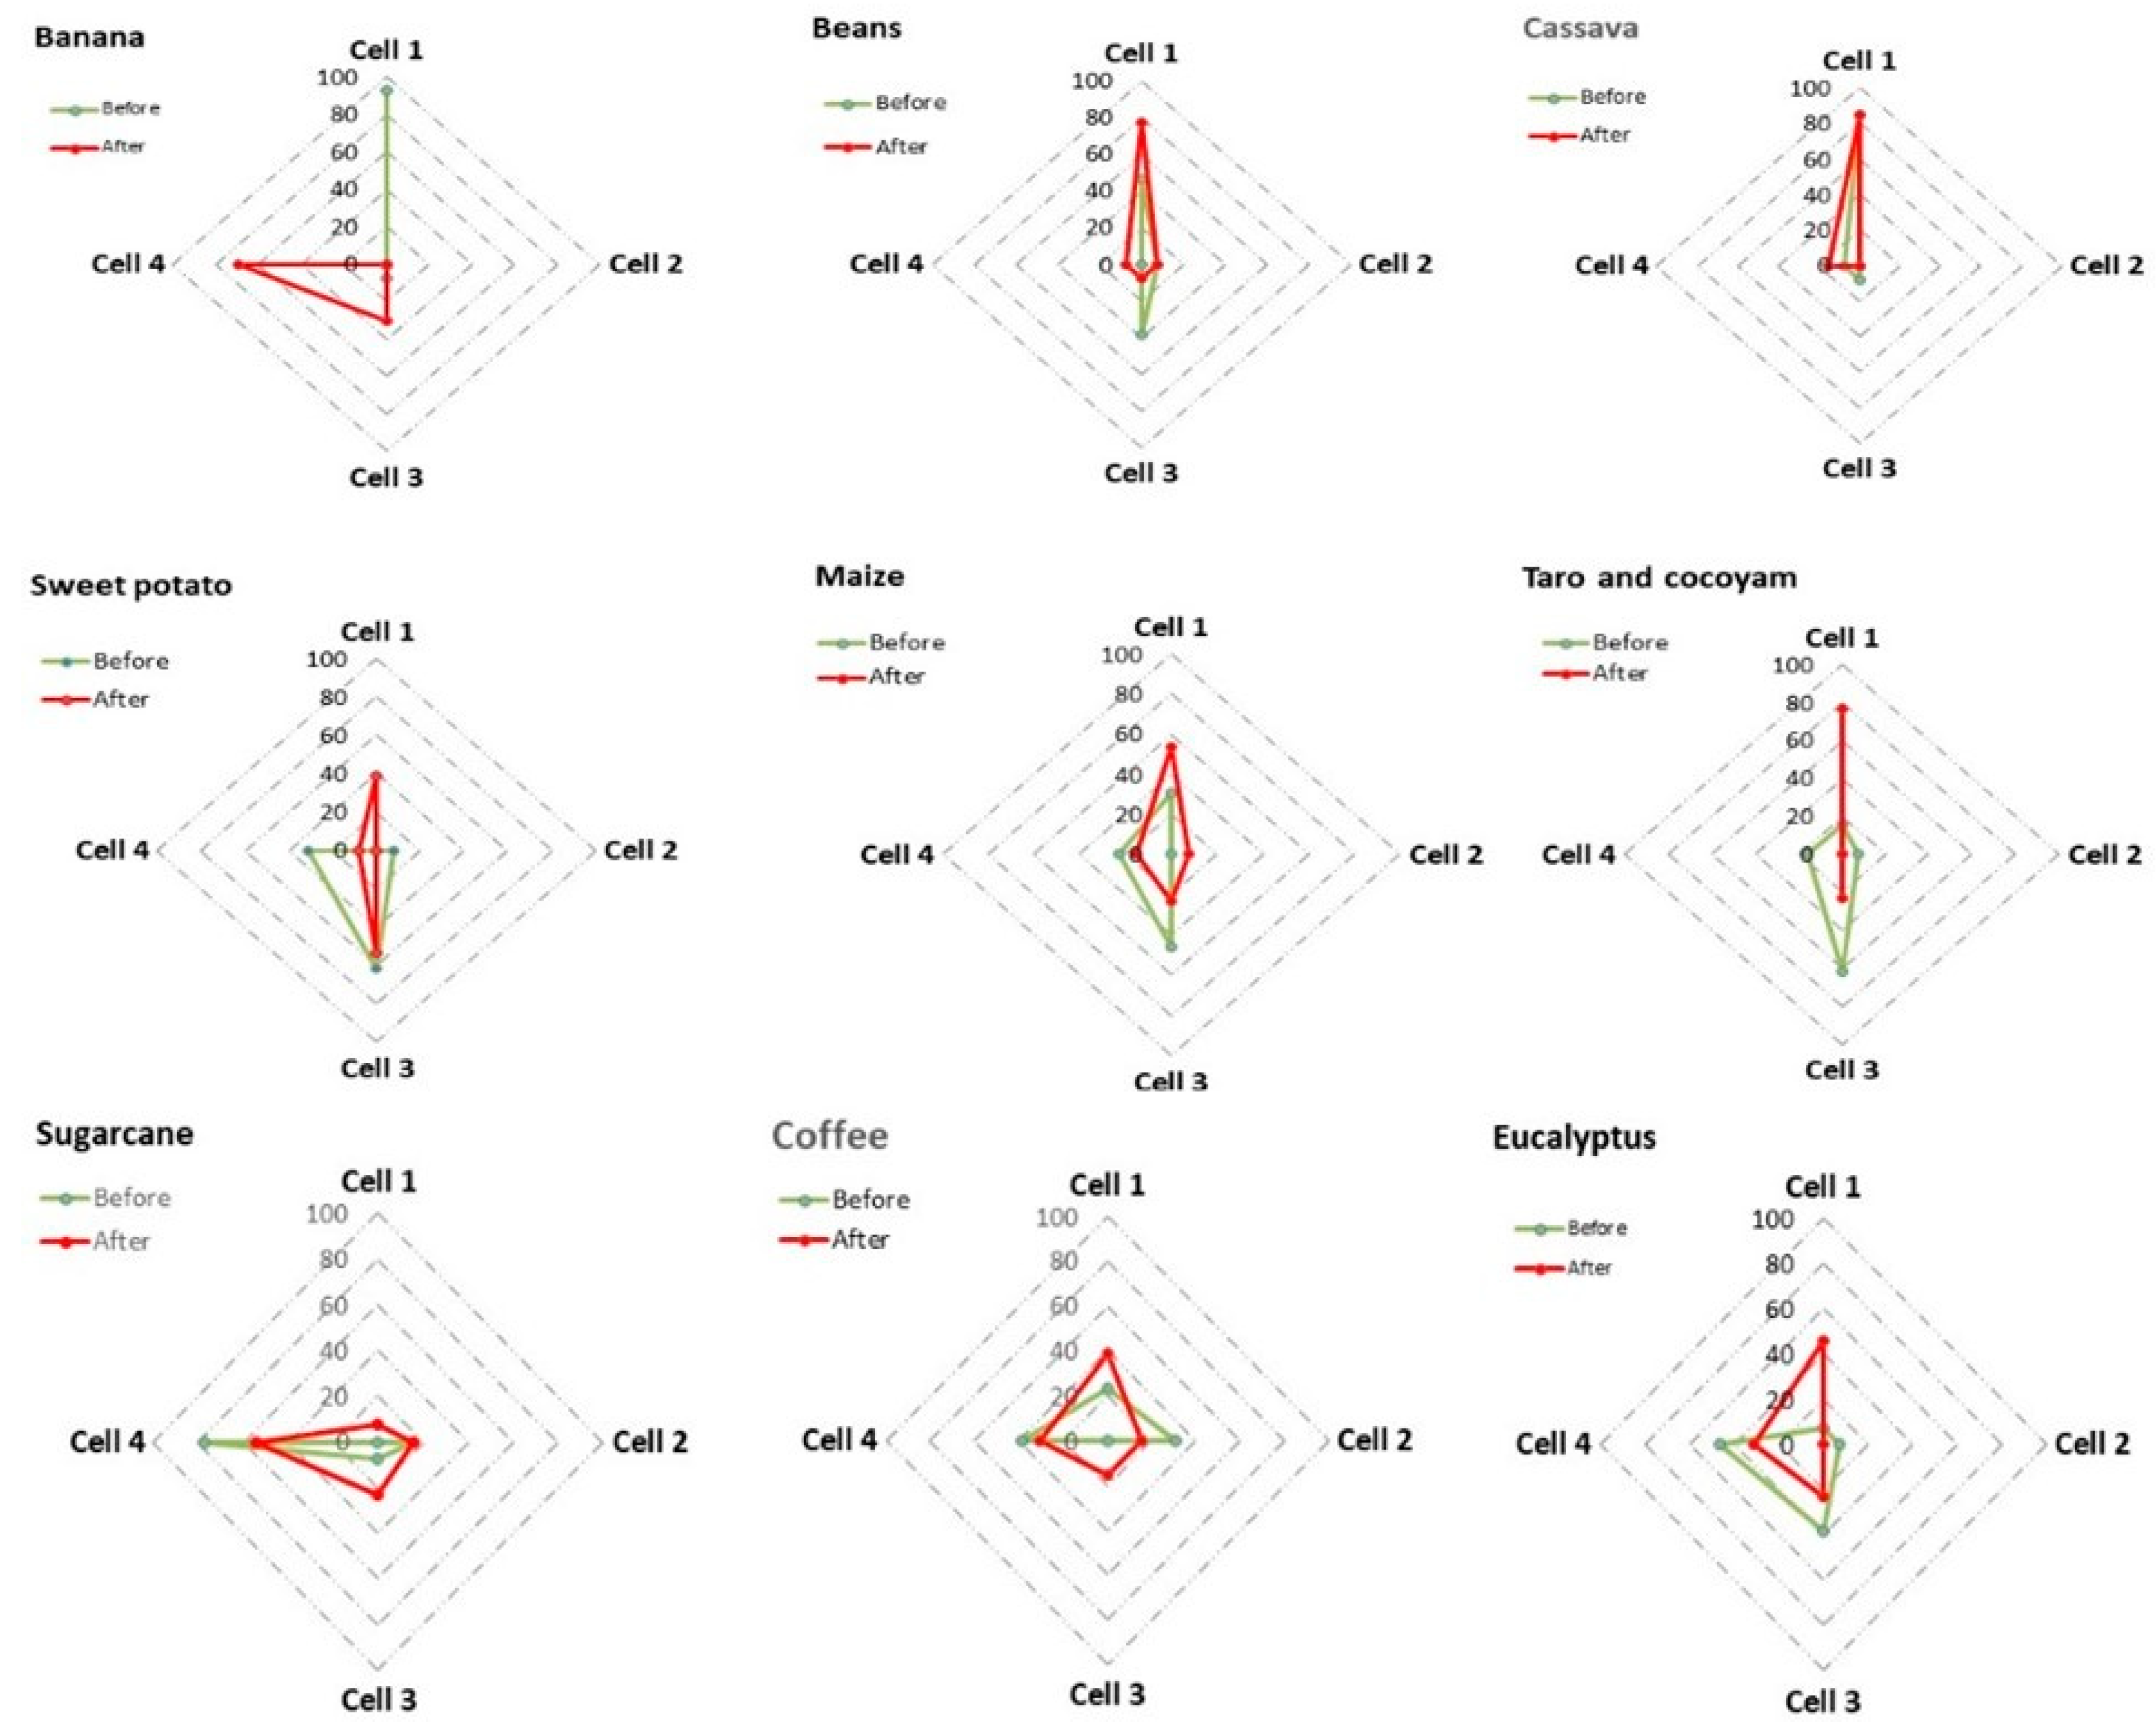
3.2. Crop Diversification Trajectories Due to Xanthomonas Wilt Disease

Prior to the outbreak of XW, farmers ranked banana as the most important crop on farms across the studied landscapes, followed by beans (Phaseolus vulgaris) and cassava (Manihot esculenta). However, following XW outbreak, crop rankings changed, with banana dropping to the fourth in importance, relative to the other crops, across the study landscapes (Figure 4A). Food crops, mainly cassava, maize (Zea mays), sweet potato (Ipomoea batatas) and soybean (Glycine max) gained in importance (Figure 4A). Cassava currently ranks as the most important crop across the XW-affected landscapes in the Eastern DR Congo. A big shift in ranking also occurred for soybean (13th in the year 2000 to the 8th in 2015). The ranking of beans in the food system remained unchanged while coffee and taro dropped in importance.
A shift was observed towards increasing the area under a large number of crop species by many households (i.e., to cell 1), mainly from being grown on small areas by many households (i.e., cell 3) (Figure 4B).
The four-cell chart predominantly grouped the banana crop into cell 1 before the outbreak of XW disease across the 13 XW-affected landscapes (Figure 5). Banana was ranked first in 92% of the villages, produced on large land areas and by many households across the villages. Cassava (85%) and beans (46%) were also more likely to be grouped into cell 1 across the surveyed landscapes before the outbreak of the disease (Figure 5; Chi2 = 92.1, p < 0.0001). At the time of this study (after or at the peak of XW epidemics), only a single village ranked banana first among the crop species. Farmers reported uprooting entire banana mats and/or fields while expanding land under other crop species and/or introducing new crop varieties (Figure 3 and Figure 5). Banana no longer fell into cell 1 of the four-cell chart. In 36% of the villages, banana was produced by many households but on small areas (cell 3), while in 64% of cases it was produced by few households on small areas (cell 4) (Figure 5; Chi2 = 61.1, p < 0.0001). Species richness did not change at landscape level, although 21 crop species were introduced at farm level across the villages. Pronounced changes in importance were mainly observed for 14 food crops and tree species, mainly beans, taro (Colocasia esculenta), sweet potato, cassava, maize, coffee (Coffea spp.), eucalyptus (Eucalyptus spp.) and soybeans in terms of area under production and the number of households producing them (Figure 5 and Figure 6).
Increase in the importance and production of the 14 crops was reported to target the filling of the food security and income gap that arose from the loss of the banana crop to XW disease. Nkuba et al. [46] similarly reported increases in the area under maize, root and tuber crops on XW-affected farms in Tanzania and Rwanda. Replacement of banana with sweet potatoes and cassava after devastation by XW has also been reported in Uganda [47]. The high ranking of cassava can be attributed to its complementary role to banana as a food and income crop in these XW-affected landscapes. The increments in the area and the number of households growing coffee and taro (Figure 5 and Figure 6) is not in tandem with the drop in the rankings of these crops (Figure 4). The slight drop in the rankings for coffee and taro (cf. Figure 4) could be attributed to the urgent need to bridge the food and income gap, with quick-maturing annual crops taking the priority. This is supported by the fact that the number of households and area under coffee, taro and cocoyam relative to the period before XW outbreak had increased (Figure 5). The leap in the rank of soybean was attributed to ongoing promotion of soybean as a biological nitrogen fixation agent and source of income by international projects in the region.
Farmers’ choices of replacement crops for banana in XW-affected landscapes mainly comprised of the urgent need to bridge the income gap, i.e., market value and improve food and nutrition security. The potential environmental benefits or effects on, e.g., soil erosion, nutrient recycling received the least attention from farmers when considering crops to replace banana. This could be due to farmers’ limited knowledge on or perceived less importance of such services, in addition to these services often being intangible [11].

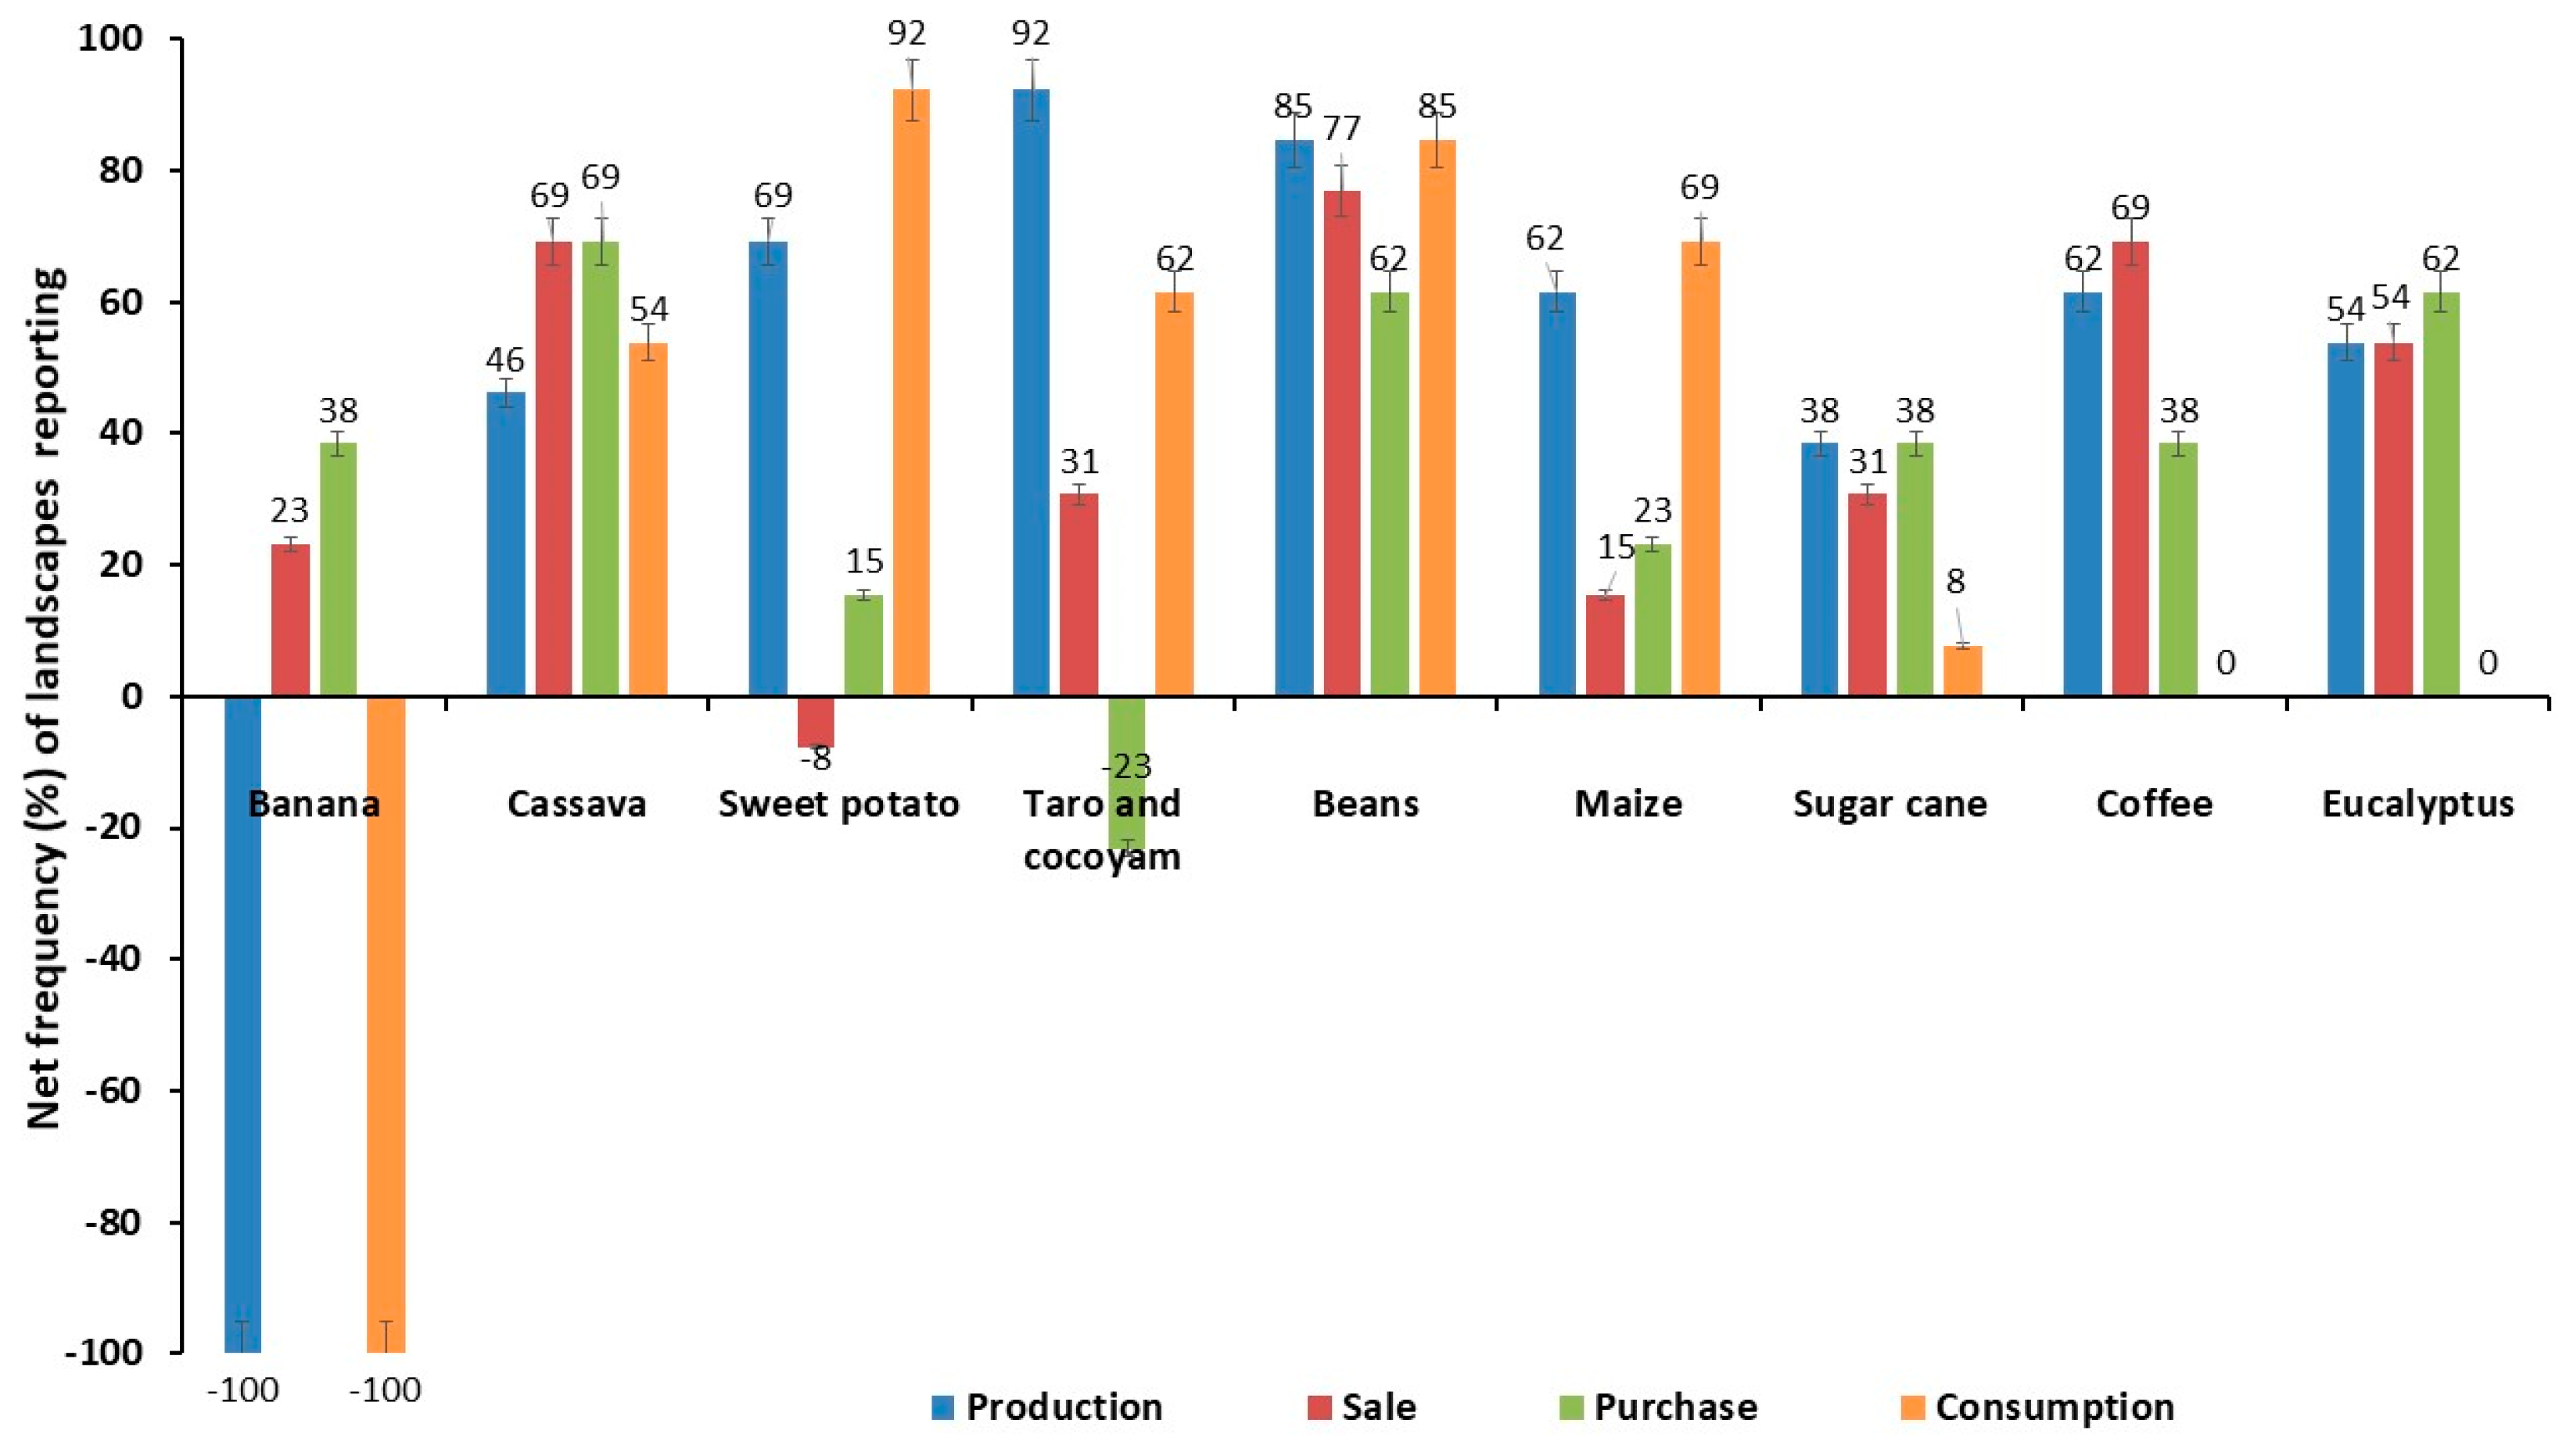
3.3. Perceived Changes in The Food Systems Due to XW Stress

XW disease induced changes in the value chains of major staple crops from production to consumption within the affected areas. Declines in the production and consumption of banana occurred across all (100%) XW-affected landscapes, while the sale by households and purchase by households from other markets of banana only increased in 23% and 38% of the affected landscapes, respectively, relative to the time before the outbreak of XW (Figure 7). The decline in banana production and consumption within households was predominantly attributed to XW disease. Delayed management of XW disease is reported to result in up to 100% yield losses. Increases in household sales of banana in some of the landscapes despite the decline in production and consumption can be attributed to the attractive higher market prices resulting from a low supply of bunches in the market. Nkuba et al. [46] also reported a 35% decline in banana sales by farmers and a doubling of banana bunch prices in Tanzania and Rwanda due to XW disease. The slight increment in household expenditure on banana bunches, is because some households were able to buy bunches from the local or urban markets to meet the household demand for banana-based food and banana beer beverage that also had an attractive price in the market. Increases in production were observed for all the major food and tree crops in most of the XW-affected landscapes (Figure 7). These increases were due to increased land allocation (cf. Figure 5) to meet the food and income needs of the households. For example, increases in consumption were reported for sweet potato, beans, taro, maize and cassava, while relative sales of beans, coffee, cassava and eucalyptus increased. The increased production of beans was also attributed to an increased productivity of the crop in abandoned or destroyed banana fields that had a higher soil fertility. An increase in coffee purchase was also reported, possibly due to farmers and middlemen buying locally, and bulking for future sales or for transportation to outside markets (e.g., in neighbouring Rwanda) with higher prices. Pronounced increases in production and trade sugarcane were also observed (Figure 7).

3.4. Farmers’ Perceptions on The Future Role of Banana and The Sustainability of The Key Land-Use Trajectories in XW-Affected Landscapes

Despite banana being severely affected by XW, it still occupies a unique position in the farming system, due to its multi-functional benefits and roles in the production system. The most important benefits reported by farmers included, its regular and all-year-round production (100% of landscapes), household preference to consume banana fruits (100%), its high profitability (92%) and its ranking as the major contributor to household income (92%) (Figure 8). Farmers described the crop to be their ‘local bank’, stemming from the ease of its conversion into cash. This is in line with the findings of Vandamme [48], who reported the banana crop to play an important economic role as a farmers’ ‘bank account’ for unexpected or major expenses and thus its importance in the agriculture sector in the Eastern DR Congo. Banana was also important for beer making, a use that was reported to enhance social cohesion (70%). Study groups reported the loss of banana to have exposed youth to more potent alcoholic beverages, increasing health and social problems within their landscapes, thus the need to restore banana production and the local banana beer industry. The crop is also an important source for livestock feed, materials for construction of temporary shelters. Farmers were, therefore, still eager to manage the disease or re-introduce the crop to their farms. Approximately half (54%) of the landscapes visited in the study area were either still producing or had resumed banana cultivation despite the presence of the XW, while the other percentage had not. No association (R2 = 0.01) was observed between the time of exposure to the disease, and the continuation and resumption of a landscape to produce banana. The continuation or resumption of a landscape to produce banana was also influenced by farmers’ access to clean planting materials, the differential importance of banana for food and income, and the variability in incidence and severity of the infection of XW across the landscape. For example, clean planting materials were not accessible in the study region, while in one out of the 13 sites, banana was not highly ranked and grown on a large scale, as such, XW disease was not a major concern. The key replacement crops were also reported to have failed to bridge the food security and income gap left by the banana crop. Due to the perennial nature of the banana crop, farmers reported a lower cost of production, e.g., in labour and inputs, whereas the other crops demanded major cultivation annually and investments in inputs annually.
Not surprisingly, only farmers in about 10% of the landscapes recognized the role of banana in reducing soil erosion in the landscape. This was because it is less tangible and lacked immediately visible benefits to most farmers.

3.5. Soil Quality

The soil chemical properties significantly differed (p < 0.05) between the land-use options and sites, whereas no significant interactions (p > 0.05) were observed between the land-use options and sites (Table 2). No use of chemical fertilizers was reported by farmers across the study sites for the analysed land-use options. Soil organic matter (SOM) and nitrogen (N), potassium (K) and phosphorus (P) were consistently higher in fields planted with trees and banana (Table 2). The banana crop also scored high for exchangeable bases calcium (Ca) and magnesium (Mg). Banana extracts large amounts of soil N and P [49] and as such, a higher depletion of these nutrients in soils with banana would have been expected.
The observed higher availability of these and other nutrients in banana fields could be linked to the location of most banana plots close to homesteads, which allows for easy application of household wastes. The banana crop, due to its large size and wide spacing, and in contrast to other crops, is more compatible with the deposition of most household wastes in between plants. It was also common to see banana plots with some mulch and/or heavy crop litter. The permanent nature of banana fields, high recycling of banana wastes, the application of external mulch and kitchen wastes under banana fields have been reported to improve nutrient availability and recycling in banana fields [11]. Bekunda and Woomer [50] also reported farmers to preferentially apply available organic resources on plots close to the homestead. Mulch and crop residues also intercept, slow and reduce runoff through retaining a fraction of rainfall/runoff, increasing hydraulic roughness, ponding and infiltration, obstructing and diverting runoff [51], potentially reducing nutrient loss through erosion. In contrast, fields under cassava and other annual crops generally received no external inputs. Stems of cassava and some annual crops, e.g., maize and sorghum were often exported out of fields and used as fuel wood while some annual crop residues were burnt on farm, practices that lead to nutrient depletion.
Fields under grass where generally low in soil P, K and Ca content, possibly due to constant extraction of nutrients through livestock grazing (Table 2). Such fields also predominantly consisted of fields previously found to be less productive for food crops.

3.6. Soil Erosion Control

The mean values of the variables for estimating soil erosion levels or its variables with exception of slope length were significantly different across the land-use options (p < 0.001) and the three study sites (p < 0.05) (Table 3). Significant interactions between land cover options and sites occurred for soil erodibility (K), the crop management factor (C), and the support practice (P).
The crop cover factors that influence the crop management factor, C, were highest for land cropped with cassava (0.41–0.47) and annual crops (0.47–0.54), while least for fields covered by grass (0.01–0.02) (Table 3). Of the food crops, the banana crop (0.09–0.12) had the least crop cover factor. The cover factors in this study (Table 3) for the various crop/plant categories are comparable to those reported in the literature (e.g., [37,38,52,53,54,55]). The tillage factor values for fields under grass and trees were low due to no tillage. Tillage practice values under coffee and banana (often minimum or zero tillage) were lower and more supportive in controlling soil erosion than those under cassava and annual crops (Table 3). Fields planted with annual crops and cassava were subjected to routine cultivation, exposing the soil to run-offs. In line with the low crop cover type factors and tillage method factors, fields under grass, trees and banana had lower C values (0.002–0.06) compared with 0.21–0.33 for cassava and 0.27–0.43 for the annual crop fields across the sites (Table 3).
In general, most farmers did not adhere to support practices (P) that help minimize soil erosion. For example, most farmers cultivate down the slope (instead of along contour bands), a practice that encourages soil erosion. Cassava and annual crops ranked worst with regards to these practices, while coffee and banana fields were moderate due to minimum/zero tillage being practiced on some farms (Table 3).
The mean slope factor (LS) was mainly influenced by the slope gradient. LS and slope, respectively, varied from 0.45–16.3 and 4–39% and were, in general, highest for fields planted with trees and least for fields planted with the annual crops. The ground surface of fields planted with trees were often covered by grass and/or thick layers of leaf litter. Growing trees with deep root systems on steep slopes and annual crops on relatively flatter areas could be a farmer strategy for minimizing soil loss and/or put such lands to fruitful use. Banana crops (% slope of 4–16%) relative to cassava (4–20%) were cultivated on relatively flat areas (Table 3), probably due to most banana farms being located close to homesteads, which were more often located on flatter portions of the available land. The farms at Katana were on more gentle slopes (4–5%) compared to Idjwi (10–28%) and Mushinga (6–39%).
Soil erodibility factor, K, varied between 0.0053 and 0.0268 Mg h MJ−1mm−1 and was lower in Katana compared with Idjwi and Mushinga. These K values are comparable to 0.009–0.021 Mg h MJ−1mm−1 reported for the Tangata catchment in Rwanda [56], 0.016 Mg h MJ−1mm−1 for the Kainjuki highlands in Kenya [53] and 0–0.24 Mg h MJ−1mm−1 for the whole of Rwanda [57].
The mean soil erosion levels (A) computed using the RUSLE equation were, in general, lower for the fields under grass (0.4 Mg ha−1 year−1 of soil loss per annum), trees (0.5–5.9) and banana (0.3–10.7) compared with 29.5% Mg ha−1 year−1 for coffee, 1.4–28.3 for the annual crops and 1.7–148.9 Mg ha−1 year−1 for cassava fields (Table 3). The high erosion levels for cassava fields can be attributed to allocation of cassava to the less fertile steep slopes and the less protective tillage and support practices under cassava (Table 3). The soil erosion levels were generally lower in Katana (0.3–1.7 Mg ha−1 year−1), which had less soil erodibility and more gentle slopes compared with 0.4–98.8 Mg ha−1 year−1 at Mushinga and 0.4–148.9 Mg ha−1 year−1 at Idjwi. Several farms at the Mushinga and Idjwi site were on steep slopes, coupled to their higher soil erodibility rates (Table 3). The trend in erosion levels for landscapes under banana, coffee and annual crops as reported by [14] for the Lake Victoria basin catchment are similar, although higher compared with those of the land uses in this study. Lufafa et al. [14] reported soil loss levels of 32–47 Mg ha−1 year−1 for banana and coffee systems and 93 Mg ha−1 year−1 for the annual crops. In the Kianjuki catchment area in Central Kenya, Angima et al. [53] reported higher soil losses between 30–666 Mg ha−1 year−1 for annual rotations, banana and coffee-based systems. However, despite a comparable LS factor (1–29), the Kianjuki site had twice higher rainfall erosivity of 8527 MJ mm ha−1 h−1 year−1 compared with 3750 MJ mm ha−1 h−1 year−1 in the current study sites. Apart from land-use under grasses, trees and banana, and the Katana site, erosion levels for cassava, coffee and annual crops were above the tolerable soil loss rates of 2.2–10 Mg ha−1 year−1 reported for the Kainjuki catchment in Kenya [53] and 15 Mg ha−1 year−1 used for the Tangata catchment in Rwanda [56].
Given the current trajectory of farmers in these XW-affected landscapes to shift to cassava, beans and other annual crops, the unsuitable location of several farms on steep slopes (6–28%) coupled with the poor tillage and support practices under the alternative land uses, erosion levels are likely to rise on XW affected farms and landscapes. Strategies for supporting farmers alternative land uses to mimic a banana production system and land uses such as land under trees and grasses needs to be explored and promoted. Potential practices could include the integration of contour hedges, grass bands, mulching and the use of cover crops to reduce runoff in erosion-prone land-use options.

4. Conclusions

Xanthomonas wilt disease of banana leads to death of affected plants and decay of infected bunches. All the study sites reported XW to have severely reduced the productivity of their banana farms. Uprooting of entire banana fields, expanding area under other crop species and totally abandoning banana for other crops was common across the landscapes. No changes in crop species richness at landscape level were observed though changes were eminent at farm level, with some farms introducing individual crop species. The overall trend across the sites was to increase the production of crops such as cassava, sweet potato, maize, sugarcane and eucalyptus with the objective of filling the short-term food security and income gaps arising from the loss or low productivity of bananas due to XW disease. Cassava and coffee especially, have already been important food and/or income crops in the region, with better developed market value chains, offering a better option in the short and long term to bridge the food and income gaps left by the banana crop. However, the observed trends in crop diversification in XW affected landscapes needs to be supported through deliberate efforts to improve extension services, seed systems, post-harvest handling and market value chains. Banana is still perceived as the preferred crop due to its multi-functionality in providing food, fodder, fiber, incomes and other ecosystem services in the landscape. The current trajectory in land-use will potentially increase soil loss and negatively affect the productivity and resilience of the soils. Strategies to manage XW and rapidly restore banana production in affected landscapes are necessary. In parallel, efforts are needed to support other land uses, especially land under cassava so as to mimic the natural ecosystems in the supply of services such as erosion control and nutrient recycling e.g., through planting hedges and grass bands along contours. This study stresses the importance of a holistic approach focused on the entire banana-based agroecosystem in addressing the XW problem and is a good basis/ entry point for interventions to sustainably improve production systems, incomes and food security in XW-affected landscapes.

Author Contributions

Conceptualization G.B. and W.O.; methodology, W.O. and G.B.; formal analysis, W.O and S.A.; data curation, W.O.; writing—original draft preparation, W.O., S.A., J.N. and G.B.; writing—review and editing, W.O., G.B., J.J.C.G., P.T. and G.T.; visualization, W.O. and S.A.; supervision, G.B., J.J.C.G., P.T. and G.T.; funding acquisition, G.B. All authors have read and agreed to the published version of the manuscript.

Funding

This research was funded by the Belgian Directorate General for Development Cooperation and Humanitarian Aid (DGD) through the Consortium for Improving Agriculture-based Livelihoods in Central Africa (CIALCA) and the CGIAR Fund Donors (http://www.cgiar.org/about-us/our-funders/) through the RTB programme of the CGIAR.

Acknowledgments

We would like to thank the Directorate General for Development, Belgium for funding this research through the Consortium for Improving Agriculture-based Livelihoods in Central Africa (CIALCA). We would also like to acknowledge the financial contribution of the CGIAR Research Program on Roots, Tubers and Bananas and the CGIAR Fund Donors. We are also grateful to the farmers who contributed to this study.

Conflicts of Interest

The authors declare no conflict of interest.

References

  1. Robinson, J.C.; Saúco, V.G. Bananas and Plantains; CAB International (Cabi): Cambridge, MA, USA, 2010; Volume 19. [Google Scholar]
  2. FAO. Online Statistical Database. Food and Agriculture Organization of the United Nations. Available online: http://www.fao.org/faostat/en/#data/QC (accessed on 10 September 2018).
  3. Abele, S.; Twine, E.; Legg, C. Food Security in Eastern Africa and the great lakes. In Crop Crisis Control Project Final Report; International Institute of Tropical Agriculture: Ibadan, Nigeria, 2007. [Google Scholar]
  4. Karamura, E.B.; Turyagyenda, F.L.; Tinzaara, W.; Blomme, G.; Molina, A.; Markham, R. Xanthomonas wilt (Xanthomonas campestris pv. musacearum) of Bananas in East and Central Africa. In Diagnostic and Management Guide; Fountain Publishers: Kampala, Uganda, 2008. [Google Scholar]
  5. Okech, H.O.; Gold, C.S.; Abele, S.; Nankinga, C.M.; Wetala, P.M.; van Asten, P.; Nambuye, A.; Ragama, P. Agro nomic, pests and economic factors influencing sustainability of banana-coffee systems of Western Uganda and potentials for improve ment. Uganda J. Agr. Sci. 2004, 9, 432–444. [Google Scholar]
  6. Edmeades, S.; Smale, M.; Kikulwe, E.M.; Nkuba, J.; Byabachwezi, M.S.R. Characteristics of banana-growing households and banana cultivars in Uganda and Tanzania. In An Economic Assessment of Banana Genetic Improvement and Innovation in the Lake Victoria Region of Uganda and Tanzania; IFPRI Research Report 155; Smale, M., Tushemereirwe, W.K., Eds.; IFPRI: Washington, DC, USA, 2007; pp. 49–74. [Google Scholar]
  7. Simmonds, N.W. Bananas, 2nd ed.; Longmans: London, UK, 1966. [Google Scholar]
  8. Simmonds, N.W.; Shepherd, K. The taxonomy and origins of the cultivated bananas. Bot. J. Linn. Soc. 1955, 55, 302–312. [Google Scholar] [CrossRef]
  9. Bekunda, M. Farmers’ responses to soil fertility decline in banana-based cropping systems of Uganda. Managing Africa’s Soils. 1999. No. 4. Available online: http://pubs.iied.org/pdfs/7397IIED.pdf (accessed on 24 November 2017).
  10. Gold, C.S.; Karamura, E.B.; Kiggundu, A.; Bagamba, F.; Abera, A.M.K. Geographic shifts in highland cooking banana (Musa spp., group AAA-EA) production in Uganda. Int. J. Sust. Dev. World Ecol. 1999, 6, 45–59. [Google Scholar] [CrossRef]
  11. Ocimati, W.; Groot, J.C.J.; Tittonell, P.; Taulya, G.; Blomme, G. Effects of Xanthomonas wilt and other banana diseases on ecosystem services in banana-based agroecosystems. Acta Hort. 2018, 1196, 19–32. [Google Scholar] [CrossRef]
  12. Baragengana, R. Banana production and research in Burundi. In Banana Production and Research in Eastern and Central Africa, Proceedings of the a Regional Workshop held in Bujumbura, Burundi, 14–17 December 1983; IDRC-MR114e; Kirkby, R.A., Ngendayo, D., Eds.; IDRC: Ottawa, Canada, 1985; pp. 23–27. [Google Scholar]
  13. Rishirumuhirwa, T.; Roose, E. The Contribution of Banana Farming Systems to Sustainable Land Use in Burundi. Adv. GeoEcol. 1998, 31, 1197–1204. [Google Scholar]
  14. Lufafa, A.; Tenywa, M.M.; Isabirye, M.; Majaliwa, M.J.G.; Woomer, P.L. Prediction of soil erosion in a Lake Victoria basin catchment using a GIS-based Universal Soil Loss Model. Agric. Syst. 2003, 76, 883–894. [Google Scholar] [CrossRef]
  15. Dayton, P.K. Toward an understanding of community resilience and the potential effects of enrichments to the benthos at McMurdo Sound, Antarctica. In Proceedings of the Colloquium on Conservation Problems in Antarctica; Allen Press: Lawrence, KS, USA, 1972. [Google Scholar]
  16. Castellani, E. Su un marciume dell’ Ensete. L’Agricoltura Coloniale. Firenze 1939, 33, 297–300. [Google Scholar]
  17. Tushemereirwe, W.; Kangire, A.; Ssekiwoko, F.; Offord, L.C.; Crozier, J.; Boa, E.; Rutherford, M.; Smith, J.J. First report of Xanthomonas campestris pv. musacearum on banana in Uganda. Plant Pathol. 2004, 53, 802. [Google Scholar] [CrossRef]
  18. Ndungo, V.; Bakelana, K.; Eden-Green, S.; Blomme, G. An outbreak of banana Xanthomonas wilt (Xanthomonas campestris pv. musacearum) in the Democratic Republic of Congo. InfoMusa 2004, 13, 43–44. [Google Scholar]
  19. FAO. Banana Production Systems at Risk: Effectively Responding to Banana Wilt Disease in the Great Lakes Region, FAO Banana Factsheet. 2012. Available online: http://www.fao.org/fileadmin/user_upload/emergencies/docs/FAO%20BANANA%20factsheet%20ENGLISH.pdf (accessed on 22 November 2017).
  20. Desire, R.M.; Bahananga, J.B.M.; Romain, L.; Barhahakana, C.; Amato, S. Analyse de l’impact socioéconomique du flétrissement bactérien du bananier et réponses paysannes dans la région du Bushi Kivu à l’Est de la République Démocratique du Congo. Int. J. Innov. Appl. Stud. 2016, 18, 66. [Google Scholar]
  21. UNDP. Profil Resume Pauvrete Et Conditions De Vie Des Menages Programme des Nations Unies pour le développement Unité de lutte contre la pauvreté: Province du Sud-Kivu. Bukavu, Democtatic Republic of Congo. 2009. Available online: https://www.cd.undp.org/content/rdc/fr/home/library/poverty/pauvrete-et-condition-de-vie-des-menages11111111.html (accessed on 22 November 2017).
  22. Farrow, A.; Busingye, L.; Bagenze, P. Characterization of Mandate Areas for the Consortium for Improved Agricultural Livelihoods in Central Africa (CIALCA); CIALCA: Bukavu, Democratic Republic of Congo, 2006; p. 132. [Google Scholar]
  23. CIALCA. CIALCA Progress Reports 05, Final Report Phase I - CIALCA January 2006–December 2008. 2009. Available online: https://test.cialca.org/wp-content/uploads/2018/06/TechnicalReport6.pdf (accessed on 15 March 2017).
  24. FEWS NET. DRC Plant Disease Report; FEWS NET: Washington, DC, USA, 2017; Available online: https://fews.net/sites/default/files/documents/reports/FEWS_NET_DRC_Plant_Disease_Study_20170516.pdf (accessed on 20 November 2017).
  25. de Bie, C.A.J.M. Comparative Performance Analysis of Agro-Ecosystems. Doctoral Thesis, Wageningen University, Wageningen, The Netherlands, 2000. Available online: http://library.wur.nl/WebQuery/wurpubs/fulltext/121245 (accessed on 22 November 2017).
  26. Cohen, D.; Crabtree, B. Qualitative Research Guidelines Project. 2006. Available online: http://www.qualres.org/HomeSamp-3702.html (accessed on 20 November 2017).
  27. Bellon, M.R.; Raneri, J. Agricultural Biodiversity Assessment: Four Cell Focus Group Methodology. Bioversity Int. 2014. Available online: https://data.ilri.org/tools/lt/dataset/biogroup (accessed on 20 November 2017).
  28. Raneri, J.; Turmel, M.; Van Zonneveld, M.; Dzomeku, B.; Termote, C.; Bellon, M.R.; Chandrabalan, D.; Zheng, S.; Ocimati, W.; Attwood, S.; et al. Agrobiodiversity 4-Cell Method: A Rapid System Diagnosis Tool. 2016. Available online: https://cgspace.cgiar.org/bitstream/handle/10568/79396/ABD_%204Cell_Poster%202016%20(2).pdf?sequence=1 (accessed on 15 February 2016).
  29. Sthapit, B.R.; Rana, R.B.; Subedi, A.; Gyawali, S.; Bajracharya, J.; Chaudhary, P.; Joshi, B.K.; Sthapit, S.; Joshi, K.D.; Upadhyay, M.P. Participatory four cell analysis (FCA) for local crop diversity. In Good Practices: On-farm Management of Agricultural Biodiversity in Nepal; NARC/LI-BIRD/Bioversity International: Kathmandu, Nepal, 2006; p. 260. [Google Scholar]
  30. VSN International. Genstat for Windows, 16th ed.; VSN International: Hemel Hempstead, UK, 2013; Web page: Genstat.co.uk. [Google Scholar]
  31. Bommarco, R.; Kleijn, D.; Potts, S.G. Ecological Intensification: Harnessing Ecosystem Services for Food Security. Trends Ecol. Evol. 2013, 28, 230–238. [Google Scholar] [CrossRef] [PubMed]
  32. Wood, S.; Sebastian, K.; Scherr, S.J. Agroecosystems. International Food Policy Research Institute. Available online: https://www.researchgate.net/profile/Kate_Sebastian2/publication/237596137_Agroecosystems/links/53fb51dd0cf27c365cf09c9c.pdf (accessed on 15 March 2016).
  33. Gliessman, S.R. Field and Laboratory Investigations in Agroecology, 3rd ed.; CRC Press, Taylor and Francis Group: Boca Raton, FL, USA, 2015. [Google Scholar]
  34. Mehlich, A. Mehlich-3 soil test extractant: A modification of Mehlich-2 extractant. Commun. Soil Sci. Plant Anal. 1984, 15, 1409–1416. [Google Scholar] [CrossRef]
  35. Bouyoucos, G.J. Hydrometer method improved for making particle size analysis of soils. Agron. J. 1962, 54, 464–465. [Google Scholar] [CrossRef]
  36. Renard, K.G.; Foster, G.R.; Weesies, G.A.; McCool, D.K.; Yoder, D.C. Predicting Soil Erosion by Water: A Guide to Conservation Planning with the Revised Universal Soil Loss Equation (RUSLE); United States Department of Agriculture: Washington, DC, USA, 1997; Volume 703. [Google Scholar]
  37. Wall, G.J.; Coote, D.R.; Pringle, E.A.; Shelton, I.J. RUSLEFAC—Revised Universal Soil Loss Equation for Application in Canada: A Handbook for Estimating Soil Loss from Water Erosion in Canada; Research Branch, Agriculture and Agri-Food Canada: Ottawa, ON, Canada, 2002; p. 117. [Google Scholar]
  38. Stone, R.P.; Hilborn, D.P. Universal Soil Loss Equation (USLE). OMAFRA Factsheet. 2015; Order No. 12-051, Queen’s Printer for Ontario. Available online: http://www.omafra.gov.on.ca/english/engineer/facts/12-051.htm (accessed on 29 February 2016).
  39. Vrieling, A.; Sterk, G.; de Jong, S.M. Satellite-based estimation of rainfall erosivity for Africa. J. Hydrol. 2010, 395, 235–241. [Google Scholar] [CrossRef]
  40. Kassam, A.H.; Van Velthuizen, H.T.; Mitchell, A.J.B.; Fischer, G.W.; Shah, M.M. Agro-ecological Land Resources Assessment for Agricultural Development Planning: A Case Study of Kenya Resources Data Base and Land Productivity, Technical Annex 2. Soil Erosion and Productivity; FAO/IIASA: Rome, Italy, 1992; p. 59. [Google Scholar]
  41. Beernaert, F.R. Development of a Soil and Terrain Map/Database-Democratic Republic of Congo. 1999. Available online: https://library.wur.nl/isric/fulltext/isricu_t4caadfec_001.pdf (accessed on 10 March 2018).
  42. Van Engelen, V.; Verdoodt, A.; Dijkshoorn, K.; Van Ranst, E. Soil and Terrain Database of Central Africa - DR Congo, Burundi and Rwanda. SOTERCAF, Version 1.0; ISRIC-UGent-FAO: Burundi and Rwanda, Democratic Republic of Congo, 2006; Available online: https://www.wur.nl/en/Publication-details.htm?publicationId=publication-way-333536303038 (accessed on 10 March 2018).
  43. Wischmeier, W.H.; Smith, D.D. Predicting Rainfall Erosion Losses. A Guide to Conservation Planning; United States Department of Agriculture, Agricultural Research Service (USDA-ARS) Handbook No. 537; United States Government Printing Office: Washington, DC, USA, 1978.
  44. Blomme, G.; Jacobsen, K.; Ocimati, W.; Beed, F.; Ntamwira, J.; Sivirihauma, C.; Ssekiwoko, F. Fine-tuning banana Xanthomonas wilt control options over the past decade in East and Central Africa. Eur. J. Plant Pathol. 2014, 139, 271–287. [Google Scholar] [CrossRef]
  45. Ochola, D.; Jogo, W.; Ocimati, W.; Rietveld, A.; Tinzaara, W.; Karamura, D.A.; Karamura, E.B. Farmers’ awareness and perceived benefits of agro-ecological intensification practices in banana systems in Uganda. Afr. J. Biotechnol. 2013, 12, 4603–4613. [Google Scholar]
  46. Nkuba, J.; Tinzaara, W.; Night, G.; Niko, N.; Jogo, W.; Ndyetabula, I.; Mukandala, L.; Ndayihazamaso, P.; Niyongere, C.; Gaidashova, S.; et al. Adverse impact of banana Xanthomonas wilt on farmers’ livelihoods in Eastern and Central Africa. Afr. J. Plant Sci. 2015, 9, 279–286. [Google Scholar]
  47. Kalyebara, M.R.; Ragama, P.E.; Kikulwe, E.; Bagamba, F.; Nankinga, K.C.; Tushemereirwe, W.K. Economic importance of the banana bacterial wilt in Uganda. Afr. Crop Sci. J. 2006, 14, 93–103. [Google Scholar] [CrossRef]
  48. Vandamme, E. Nutrient deficiencies in soils of Walungu, South Kivu, Democratic Republic of Congo. MSc. Thesis, Katholieke Universiteit Leuven, Leuven, Belgium, 2008. [Google Scholar]
  49. Nyombi, K.; van Asten, P.J.A.; Corbeels, M.; Taulya, G.; Leffelaar, P.A.; Giller, K.E. Mineral fertilizer response and nutrient use efficiencies of East African highland banana (Musa spp., AAA-EAHB, cv Kisansa). Field Crops Res. 2010, 117, 38–50. [Google Scholar] [CrossRef]
  50. Bekunda, M.; Woomer, P.L. Organic resource management in banana based cropping systems of the Lake Victoria basin, Uganda. Agri. Ecosyst. Environ. 1996, 59, 171–180. [Google Scholar] [CrossRef]
  51. Mohamoud, Y.M.; Ewing, L.K. Rainfall interception by corn and soybean residue. Trans. ASAE 1990, 33, 507–0511. [Google Scholar] [CrossRef]
  52. Howeler, R.H.; Oates, C.G.; Allem, A.C.; Chuzel, G.; Henry, G.; Hershey, C.H.; Müller-Sämann, K.M.; Okogun, A.; Sanginga, N.; Souza, L.D.; et al. Strategic environmental assessment, an assessment of the impact of cassava production and processing on the environment and biodiversity. Proc. Valid. Forum Glob. Cassava Dev. Strategy 2001, 5, 1–137. [Google Scholar]
  53. Angima, S.D.; Stott, D.E.; O’neill, M.K.; Ong, C.K.; Weesies, G.A. Soil erosion prediction using RUSLE for central Kenyan highland conditions. Agri. Ecosys. Environ. 2003, 97, 295–308. [Google Scholar] [CrossRef]
  54. Borrelli, P.; Robinson, D.A.; Fleischer, L.R.; Lugato, E.; Ballabio, C.; Alewell, C.; Meusburger, K.; Modugno, S.; Schütt, B.; Ferro, V.; et al. An assessment of the global impact of 21st century land use change on soil erosion. Nat. Commun. 2017, 8, 2013. [Google Scholar] [CrossRef] [PubMed] [Green Version]
  55. Panagos, P.; Borrelli, P.; Meusburger, K.; Alewell, C.; Lugato, E.; Montanarella, L. Estimating the soil erosion cover-management factor at the European scale. Land Use Policy 2015, 48, 38–50. [Google Scholar] [CrossRef]
  56. De Taeye, S. Soil Erosion Risk Mapping using RUSLE in Rwanda. Msc. Thesis, 2016. Available online: https://lib.ugent.be/fulltxt/RUG01/002/305/181/RUG01-002305181_2016_0001_AC.pdf/ (accessed on 29 February 2017).
  57. Karamage, F.; Zhang, C.; Ndayisaba, F.; Shao, H.; Kayiranga, A.; Fang, X.; Nahayo, L.; Nyesheja, E.M.; Tian, G. Extent of cropland and related soil erosion risk in Rwanda. Sustainability 2016, 8, 609. [Google Scholar] [CrossRef] [Green Version]
Figure 1. Map showing the locations of the communities/landscapes that participated in the Focus Group Discussions conducted in North and South Kivu provinces in the Eastern DR Congo.
Sustainability 12 03178 g001
Figure 2. A four-cell chart (A) and an example of farmers posting of different crop species on a four-cell chart within a landscape and a point in time (B). The four-cell analyses were conducted across 13 landscapes in South/North Kivu provinces, the Eastern DR Congo.
Sustainability 12 03178 g002
Figure 3. Responses and/ or coping strategies in reaction to Xanthomonas wilt (XW) across 13 different banana growing communities/landscapes in the Eastern DR Congo. Error bars represent standard errors.
Sustainability 12 03178 g003
Figure 4. Farmers’ perceptions of the rankings in importance of different crop species (A) and trends in crop species richness (%) along the quadrants of a 4-cell chart (B) following the outbreak of XW in 13 landscapes in the Eastern Democratic Republic of Congo. Cells 1, 2, 3 and 4, respectively stand for a species being grown on (i) a large acreage and by many households; (ii) large acreage but by few households; (iii) small acreage but by many households and (iv) small acreage and by few households. Data were captured in the period 2015/16.
Sustainability 12 03178 g004
Figure 5. Spider plots showing the shifts in diversity (abundance) of selected key crop species before and after the outbreak of Xanthomonas wilt disease of banana across 13 landscapes in the Eastern Democratic Republic of Congo. Cells 1, 2, 3 and 4, respectively, stand for a species being grown on (i) a large acreage and by many households; (ii) large acreage but by few households; (iii) small acreage but by many households and (iv) small acreage and by few households.
Sustainability 12 03178 g005
Figure 6. The frequency of mentioning different crop species as replacements for uprooted banana fields across 13 landscapes affected by Xanthomonas wilt disease of banana in the Eastern DR Congo. Error bars represent standard errors.
Sustainability 12 03178 g006
Figure 7. Net frequency (%) of landscapes reporting changes production, sale, purchase and consumption of key food and tree crops across 13 landscapes affected by Xanthomonas wilt disease of banana in the Eastern Democratic Republic of Congo.
Sustainability 12 03178 g007
Figure 8. Farmers perceived comparative benefits offered by the banana crop across 13 landscapes in the Eastern Democratic Republic of Congo. Numbers denote percentage of villages reporting.
Sustainability 12 03178 g008
Table 1. The positioning of the sampled villages and focus group discussions along the 230 km study axis.
ProvinceTerritoryVillageYear of XW OutbreakLongitudeLatitudeAltitudeDistance from Masisi
North-KivuMasisiKahanga-Kabingu2004---0
Muhanga2001S01.24778E029.05931170120
Burungu2004---40
Makombo2008S01.47358E029.04045201060
South-KivuKaleheBulenga2005S01.71581E29.01702152580
Ruhunde2005S01.81677E029.009511520100
Kabulu2005S01.94952E028.933011757120
Bushushu2009S01.97875E28.909921486140
Muhongoza2004S02.07115E28.895341585160
KabareKahanga2009S01.18282E028.86171488180
Kashusha2012S02.32044E28.802401713210
IdjwiChondo2002S01.94219E029.094711550-
Ntalangwa2008S02.22220E029.016021492-
Table 2. Variation of soil chemical properties for six major land-use options (i.e., banana, cassava, coffee grass, annual crops and trees) in XW-affected across three landscapes (Idjwi (I), Katana (K) and Mushinga (M)) in the Eastern Democratic Republic of Congo.
Soil Chemical PropertySiteMain Plant CoverLSDp Valuesp Value (Sites)Cv %
BananaCassavaGrassAnnual CropsTrees
Soil Organic MatterI3.96bcd3.58def3.84cde4.16bc5.03a0.430.200.0121
K3.49ef3.52ef*3.48efg3.36fg
M4.37bf3.68cdef3.98bcd3.048g4.22b
Mean4.04v3.61w*3.54w4.33v0.300.02
Nitrogen (%)I0.30bcd0.27de0.28cde0.30bcd0.36a0.030.270.0218
K0.26e0.27de*0.26e0.26e
M0.32b0.28cde0.30bcd0.22f0.31bc
Mean0.30v0.27w*0.26w0.32v0.020.03
Phosphorus (ppm)I36.19abc14.81d3.81d20.78bcd48.26a21.340.990.08194
K23.93bcd8.85d*21.27bcd16.07d
M13.11d3.37d4.45d12.73d17.06d
Mean24.58v9.08w*17.81v29.03v14.40.10
Potassium (cmol(+)/kg soil)I0.21e0.19f0.14f0.13f0.19f0.100.07<0.00165
K0.46ab0.31cde*0.36bc0.50a
M0.44ab0.15f0.16f0.15f0.23def
Mean0.36v0.20wx*0.19x0.27w0.07<0.001
Calcium (cmol(+)/kg soil)I9.02c7.22cd4.51e8.67c5.04de2.490.32<0.00149.8
K15.85b15.97b*16.15b21.46a
M9.18c4.73de4.17e8.94c3.50e
Mean10.52v8.00w*10.35v7.83w1.710.02
Magnesium (cmol(+)/kg soil)I4.68de4.48de2.69g5.12d2.74g1.250.08<0.00143
K8.80a6.99bc*8.67a7.98ab
M6.57c2.97fg3.74efg4.03def3.51efg
Mean6.35v4.38x*5.42w4.17x0.86<0.001
Means followed by the same letter ‘a’ to ‘g’ and ‘v’ to ‘x’ within rows and a row for a given soil chemical property, respectively are not significantly different. ‘*’ = missing data.
Table 3. The scores for the RUSLE covariates for different crop/plant covers on farms across landscapes affected by Xanthomonas wilt disease in the Eastern DR Congo.
SiteMain Plant CoverSoil Erodibility Factor (K)Crop CoverTillage Method FactorC FactorSlope Length (L)% Slope (S)LSPAmount of Eroded Soil (A)A for Standardised Mean Slope
IdjwiBanana0.026840.120.430.04861.115.64.610.4310.712.74
Cassava0.026420.470.610.28448.019.55.940.87148.9141.87
Grass0.023710.010.250.00247.520.85.800.630.40.36
Annual crops0.025020.470.570.27142.39.51.520.8328.355.35
Trees0.027000.040.310.01330.527.58.760.475.93.99
KatanaBanana0.005270.090.510.04743.04.00.460.700.30.33
Cassava0.005270.410.530.21347.43.90.450.921.71.93
Grass**********
Annual crops0.005270.470.550.26534.84.60.520.631.41.35
Trees0.005270.040.500.01844.65.20.691.000.30.26
MushingaBanana0.014490.120.500.05848.010.72.120.775.08.07
Cassava0.014790.470.690.32955.017.05.290.9898.8100.31
Grass0.014490.020.250.00557.914.03.470.250.40.49
Annual crops0.014490.540.800.43469.75.80.971.0022.867.85
Trees0.005270.020.290.00636.838.816.310.280.40.18
LSD0.002100.030.060.02615.963.240.1546.5-
F pr (Main plant spp.)<0.001<0.001<0.001<0.0010.396<0.001<0.001<0.001<0.001-
F pr (Site)<0.0010.0050.004<0.0010.345<0.0010.010.0260.026-
Fpr (interaction)0.0090.530.009<0.0010.710.1970.2020.0030.21-
Cv%23192130577313537198-
A = estimated average soil loss (Mg ha−1 year−1); K = soil erodibility factor (Mg h MJ−1mm−1); C factor= cover-management factor; and P = support practice factor and LS = proportion of soil loss under a given condition to that of a site with a standard slope steepness of 9% and length 22.13 m. #A= estimated soil loss per land-use for the same slope (%), standardised using mean slope for each site. ‘-‘ = not computed. Fpr values of > 0.05, <0.05, <0.01 and <0.001, respectively, denote no significant, significant; very and highly significant difference between mean values for the main factors and the interactions. Rainfall-runoff erosivity (R) = 3,750 MJ mm ha-1 h-1 year−1 [39].

