Article

Sustainable Water Use Considering Three Hungarian Dairy Farms

1
Faculty of Agriculture, University of Szeged, 6720 Szeged, Hungary
2
Faculty of Engineering, University of Szeged, 6720 Szeged, Hungary
*
Author to whom correspondence should be addressed.
Sustainability 2020, 12(8), 3145; https://doi.org/10.3390/su12083145
Submission received: 14 February 2020 / Revised: 17 March 2020 / Accepted: 10 April 2020 / Published: 14 April 2020
(This article belongs to the Special Issue Sustainable Natural Resource Management)

Abstract

:
Sustainable water management is one of the biggest challenges in the 21st century as availability of fresh water resources is under depletion. Growing population, extreme weather conditions (drought, fire, flood), and increasing global food demand all result in higher water consumption by humans. Assessing qualitative and quantitative deterioration of fresh water supplies is crucial in water scarcity areas. By identifying blue, green and grey water components, water use can be assessed in a more comprehensive way. Water use assessment on a dairy farm is influenced by several factors such as chosen breed, herd size, keeping, feeding and milking technology. Productivity level of milking cows, amount of daily milking and type of litter (straw or liquid manure) have impact on water use by technology and cattle. If these factors are assessed and their proportion within the total water use is identified or calculated, dairy farmers are able to analyze water management precisely and shift to more sustainable solutions. The aim of this research is to analyze and to compare the impact of different keeping systems, i.e., traditional and modern, and milking technologies, i.e., robotic milking system, parallel and polygon parlors, on the water use of dairy farms to give a guide to dairy experts and to find opportunities where water recycling/reuse might be applicable.

1. Introduction

Sustainability is a balance between economy, environment and society and we can approach one segment; e.g.; agriculture considering all of its pillars, or analyze that sector based on each pillar (economic, environmental or social) separately. Two of the sustainable development goals defined by the UN (United Nations) were related to water, namely the sixth: clean water and sanitation; and the fourteenth: life below water [1]. However, these will be influenced by global trends in agriculture such as climate change. For increasing production capacity of crop production and animal husbandry, reasonable water use is crucial, especially if it is considered that fresh water resource availability is under depletion. Higher average temperature, lower amount of precipitation, extreme weather conditions such as drought or flood, all influence water availability and decrease the water supply of natural ecosystems for humanity. As agriculture is one of the biggest water consumers, people working in animal husbandry should be mindful regarding their daily water management, so the aim of this study is to give a guide to dairy experts on how to map their water use and consumption and show them the most important correlation between milking technology, management and water use. Thus, they are able to find more water efficient solutions. Considering different production systems, the highest Water Use/ kg Energy Corrected Milk was experienced in the case of low yielding small-scale farms. Energy Corrected Milk identifies the amount of milk produced adjusted to 3.5% butterfat and 3.2% protein. The second highest was grazing and intensive production systems. However, the long-term impact of this system for environment, society and economy has to be taken into account in advance. Early studies assessing water management of dairy farms identified volumetric water footprints, e.g., 1000 l/l of milk. However, this indicator was not comprehensive enough. The type of water and local water scarcity characteristics have to be taken into account in order to assess environmental impacts of water consumption [2]. Farms with high water use efficiency need less water and less land to produce the same amount of milk than less water use efficient farms. Armstrong and his colleagues measured water use efficiency on irrigated pasture based dairy farms [3]. They revealed that farming management has a much more important role than the type of system itself. Environmental economic efficiency was also considered in order to reduce input costs. Average daily temperature can be decreased by 20C with humidifier, which uses 16.7 liter cow−1 day−1 [4]. Reducing heat stress on dairy farming has been the focus of research for a long time. “Resulting investments to boost water productivity and to improve water use efficiency in milk production are two pathways to adapt to climate change effects” [5]. Therefore, assessing climate change effects on water management of dairy farms needs to be performed in order to develop water saving scenarios to mitigate heat stress. Body temperature can be reduced by 0.20C applying cow showers [6]. As a result, cows spend half as much time close to water bowls. Le Riche et al. built water conservation scenarios by using air temperature reduction, complete recycling of milk-cooling water and modified cow preparation protocol in Eastern Ontario, Canada [7]. Combined application of these strategies could result in 19% reduction of the annual water use meaning 6229 m3 saved water. The Sustainable Agriculture Initiative Platform highlighted an interesting question on how sustainable blue water is while being used. In case of lakes, rivers and aquifers, water is naturally recharged after a while sustainably [8]. However, other blue water drawn from catchments or aquifers or from overexploited catchments lacks natural recharge. By assessing this aspect, long-term influence of unsuitable water use can be predicted. De Boer et al. in 2013 assessed the environmental impact of freshwater consumption by LCA (life cycle assessment) in irrigated Dutch milk production. From total consumed water 76% was irrigation water, 15% was required for producing concentrates, and 8% was needed for drinking and cleaning [9]. However, if freshwater scarcity is in focus, water volume accounting is just the first step. The impact of freshwater consumption on human health, ecosystem quality and resource depletion needs to be considered as well. Palhares and Pezzopane revealed similarly that it is not reasonable to compare water footprint results of different locations because lower water footprint can be more damaging for the environment depending on water availability [10]. Every dairy farm has its specific water resource availability, local weather conditions and management that all form its water footprint. Dairy intensification has to happen in a local context.
“Not doing so often underlies the general failure of programs or policies aimed at enhancing farmers’ resilience through intensification of production and can lead to otherwise avoidable and unintended negative environmental consequences. In many cases, intensification initially increases production but decreases it in the long run” [11].
The hypothesis of this research is that water use analysis of milking technologies and milk production ratios is assessed: i) there is provable difference between milking technologies and water use efficiency; and ii) opportunities can be found for water recycling and recovery during water use assessment.
Determining the ratio of drinking water consumption, technological water uses and water used by employees is crucial.

2. Materials and Methods
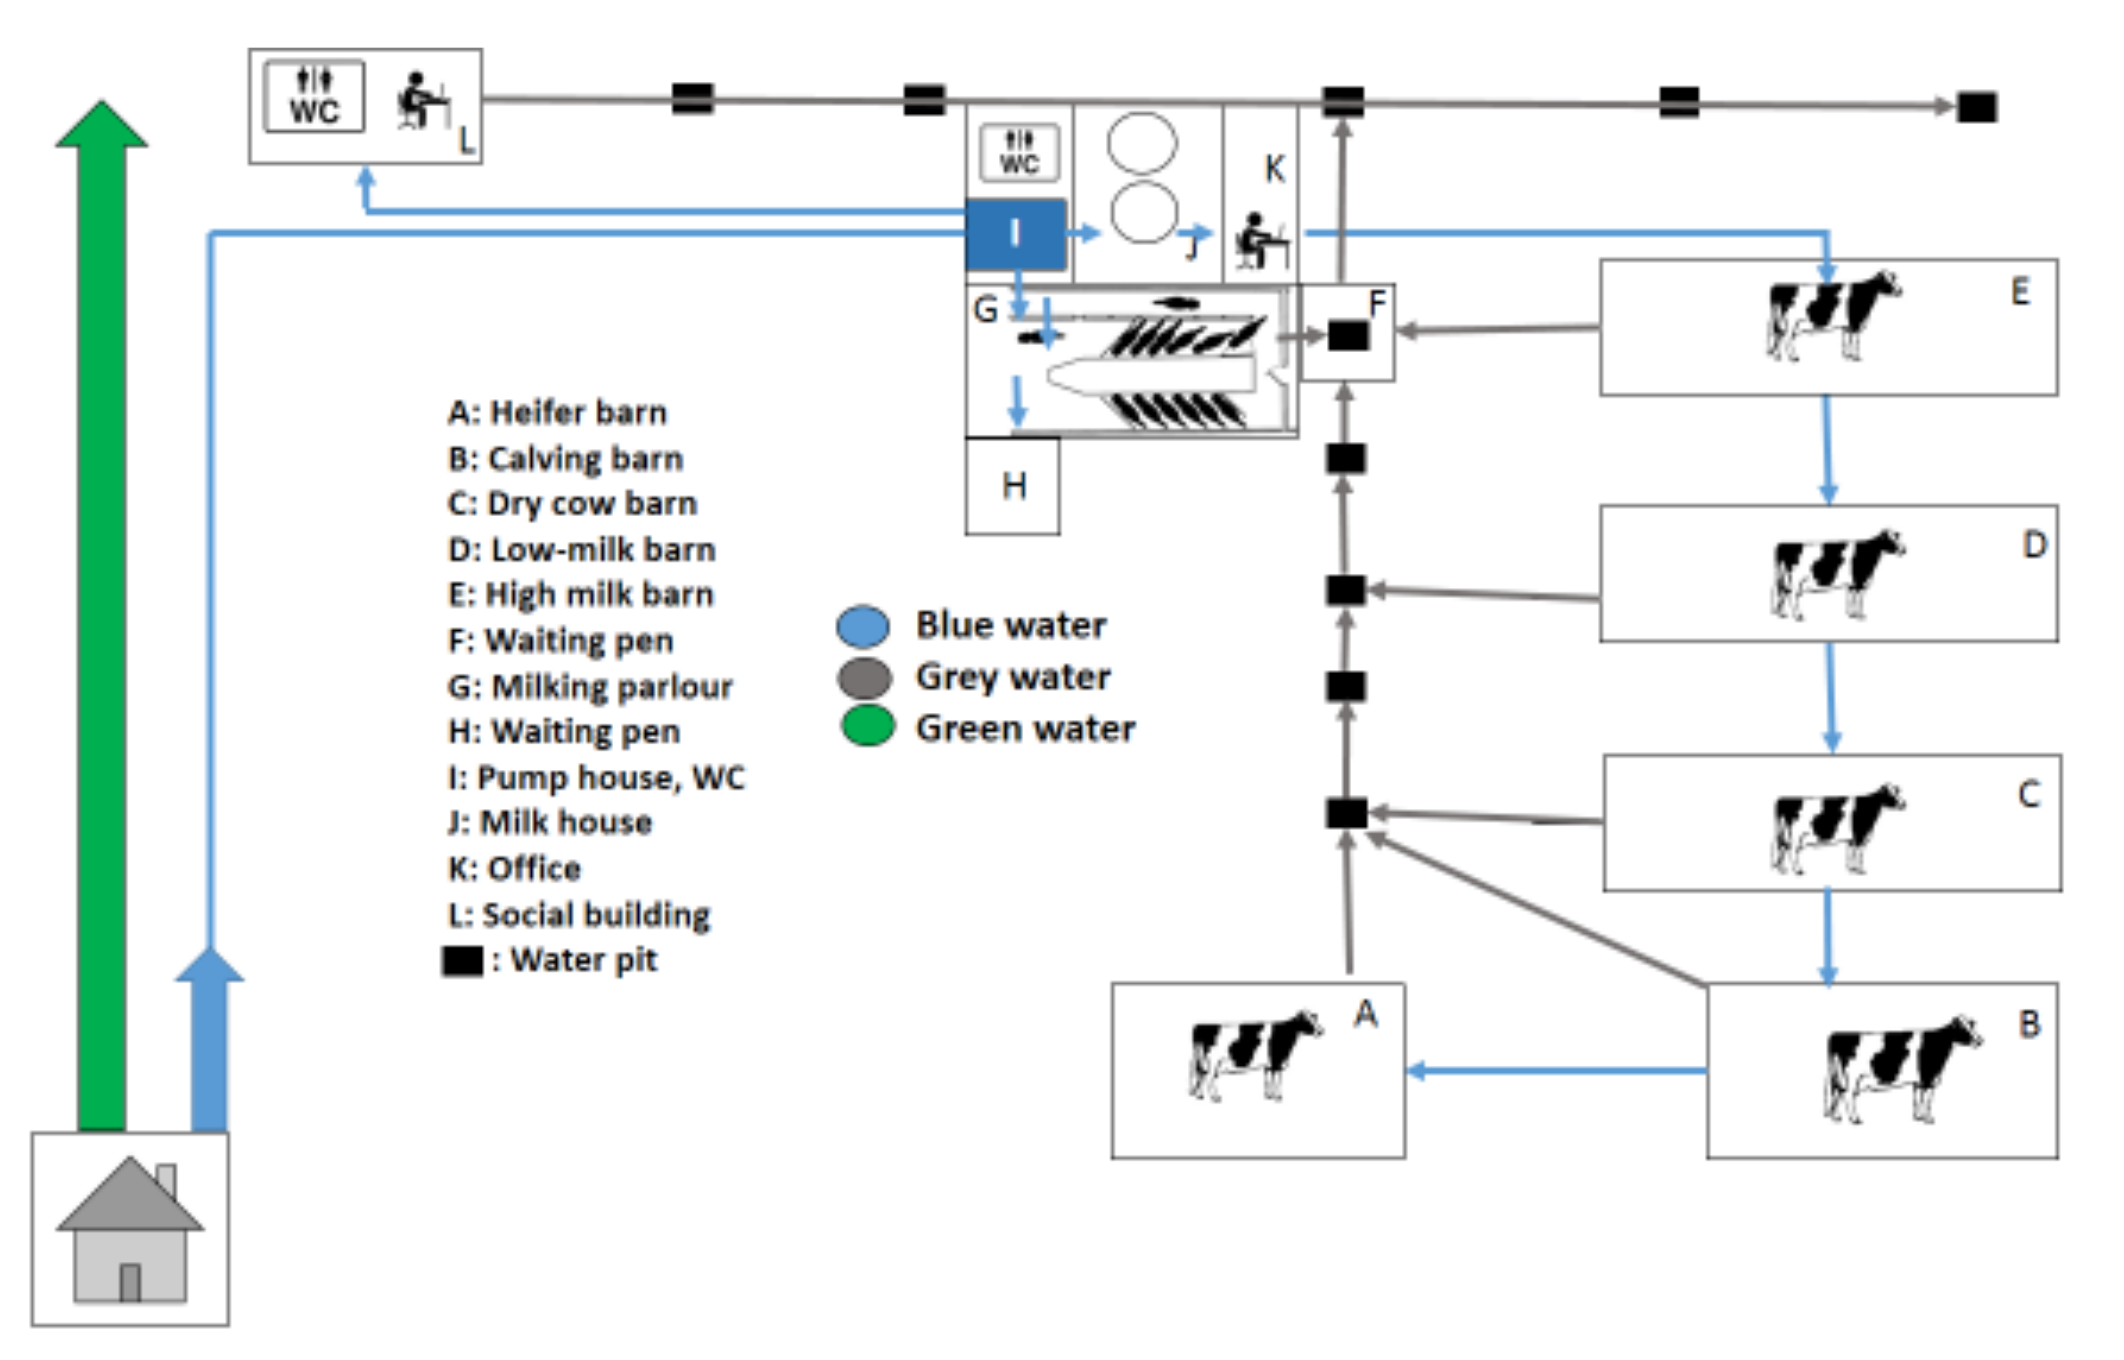
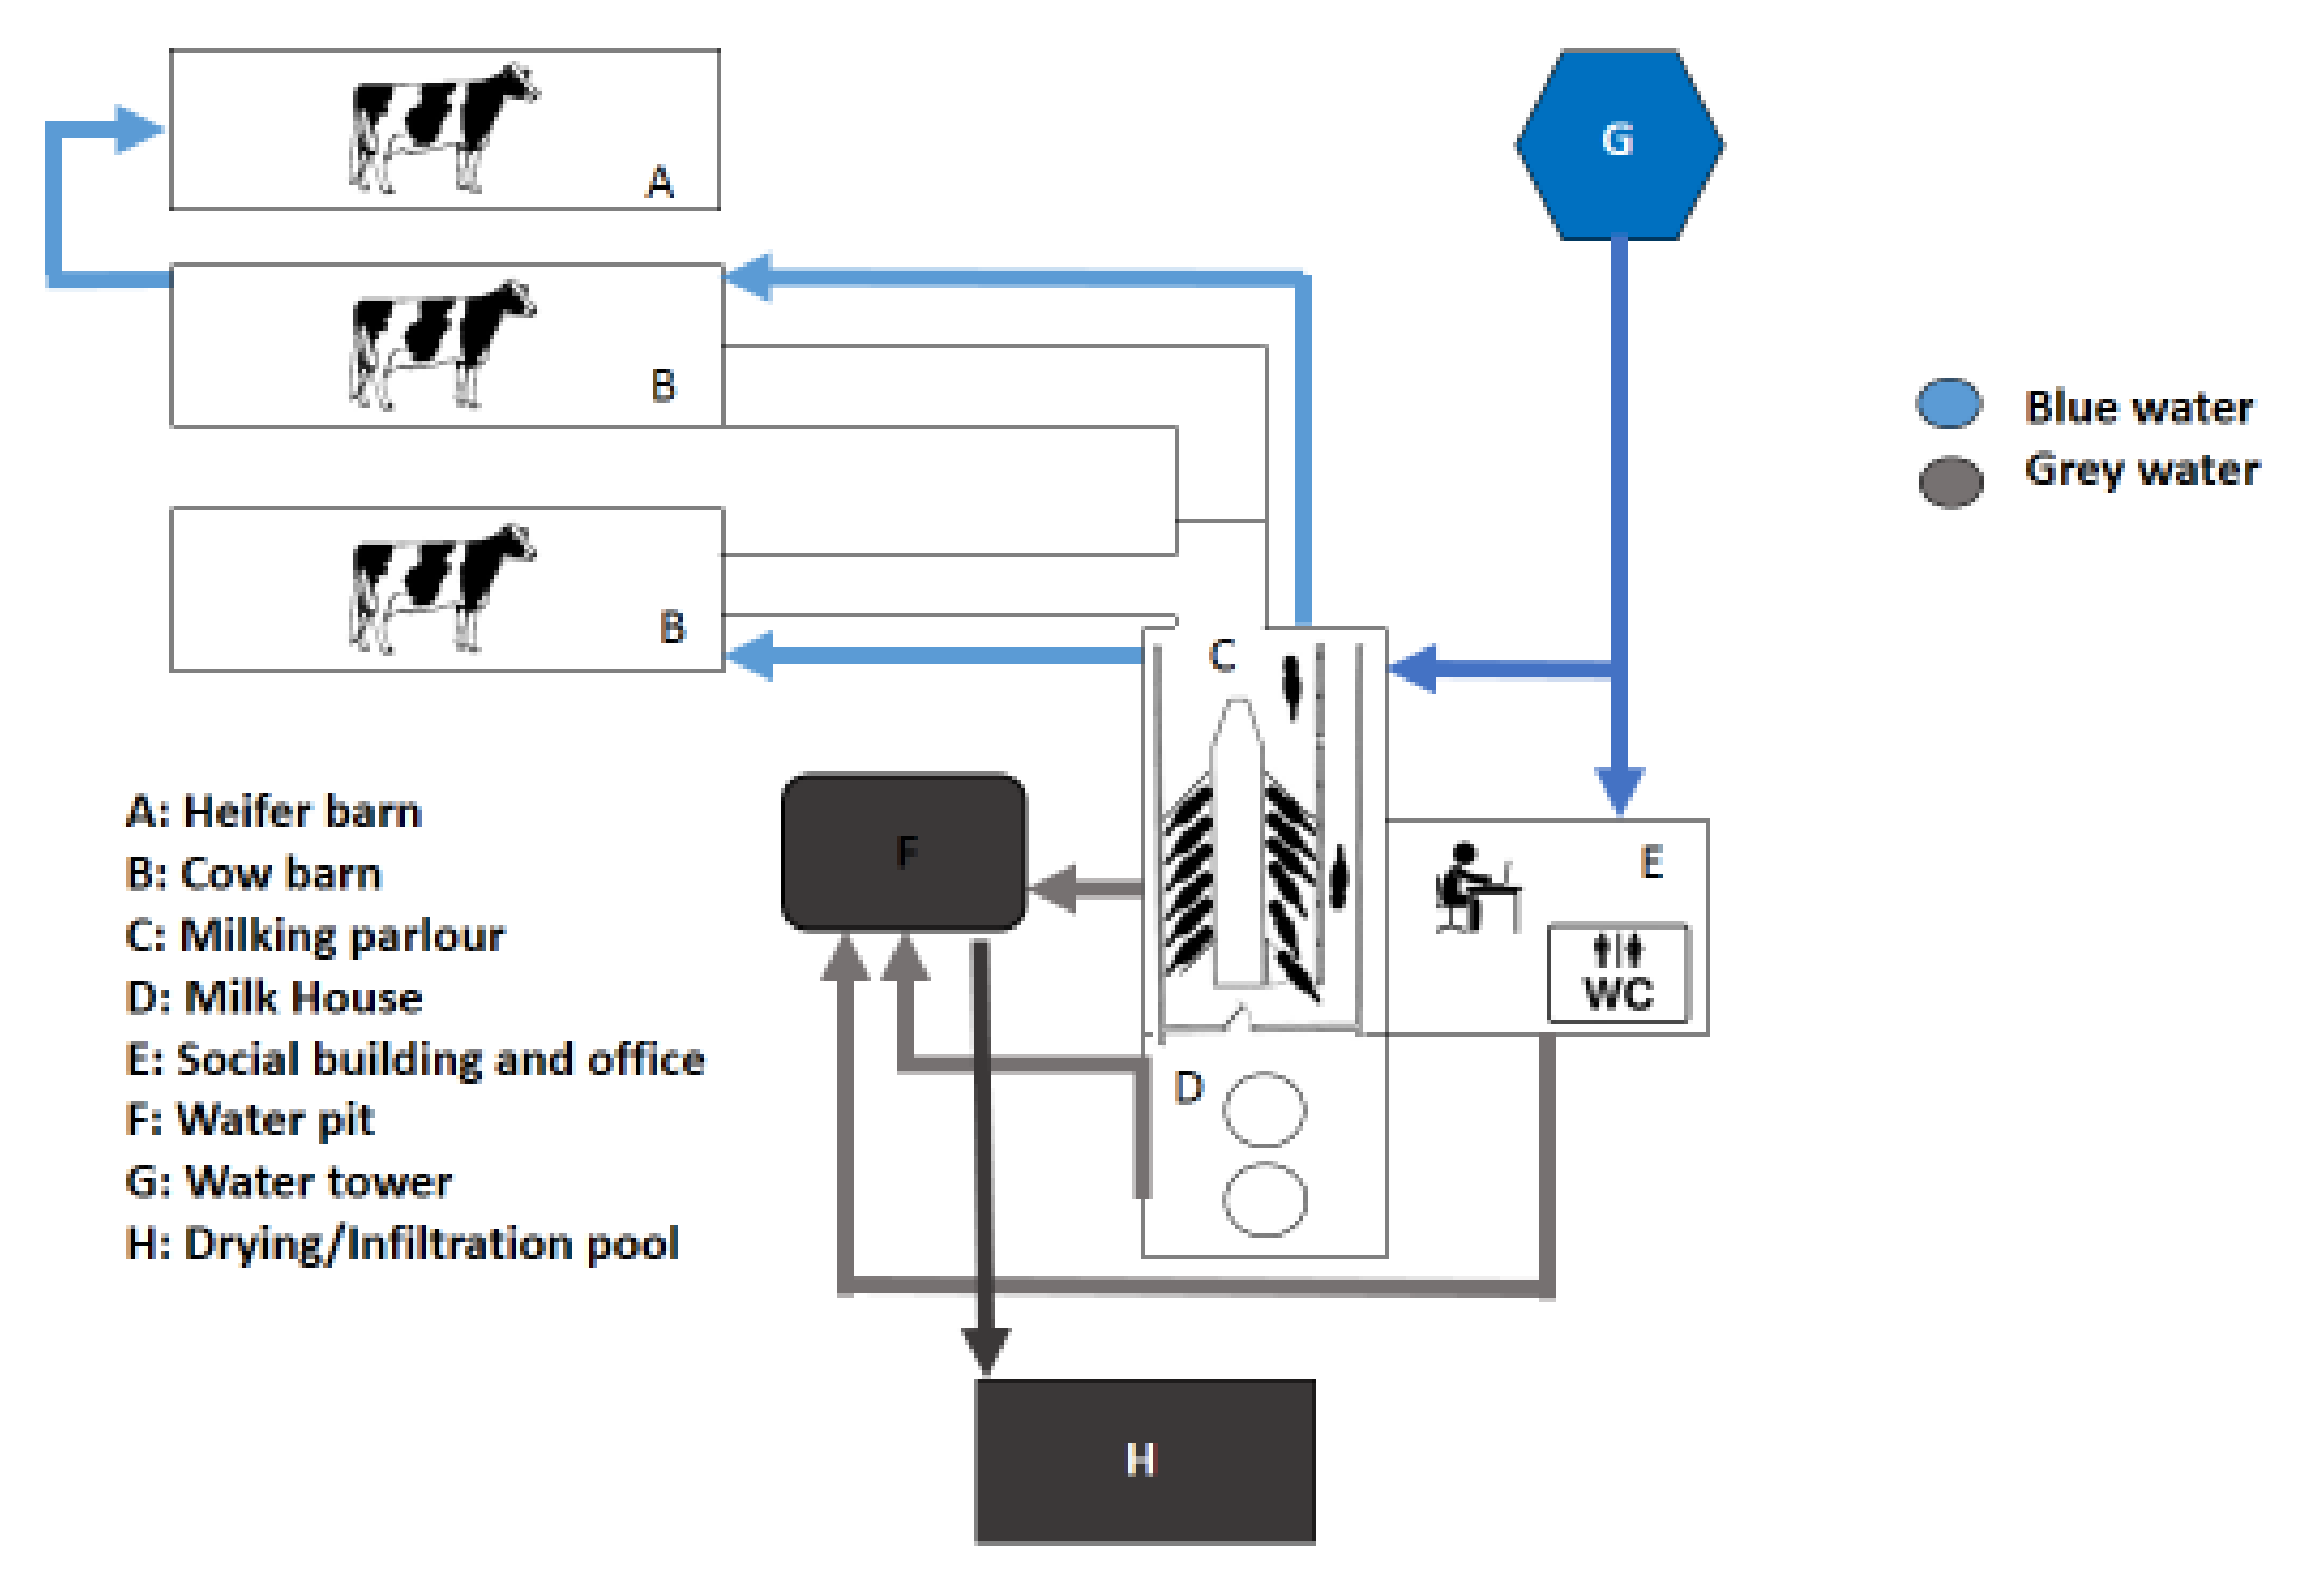
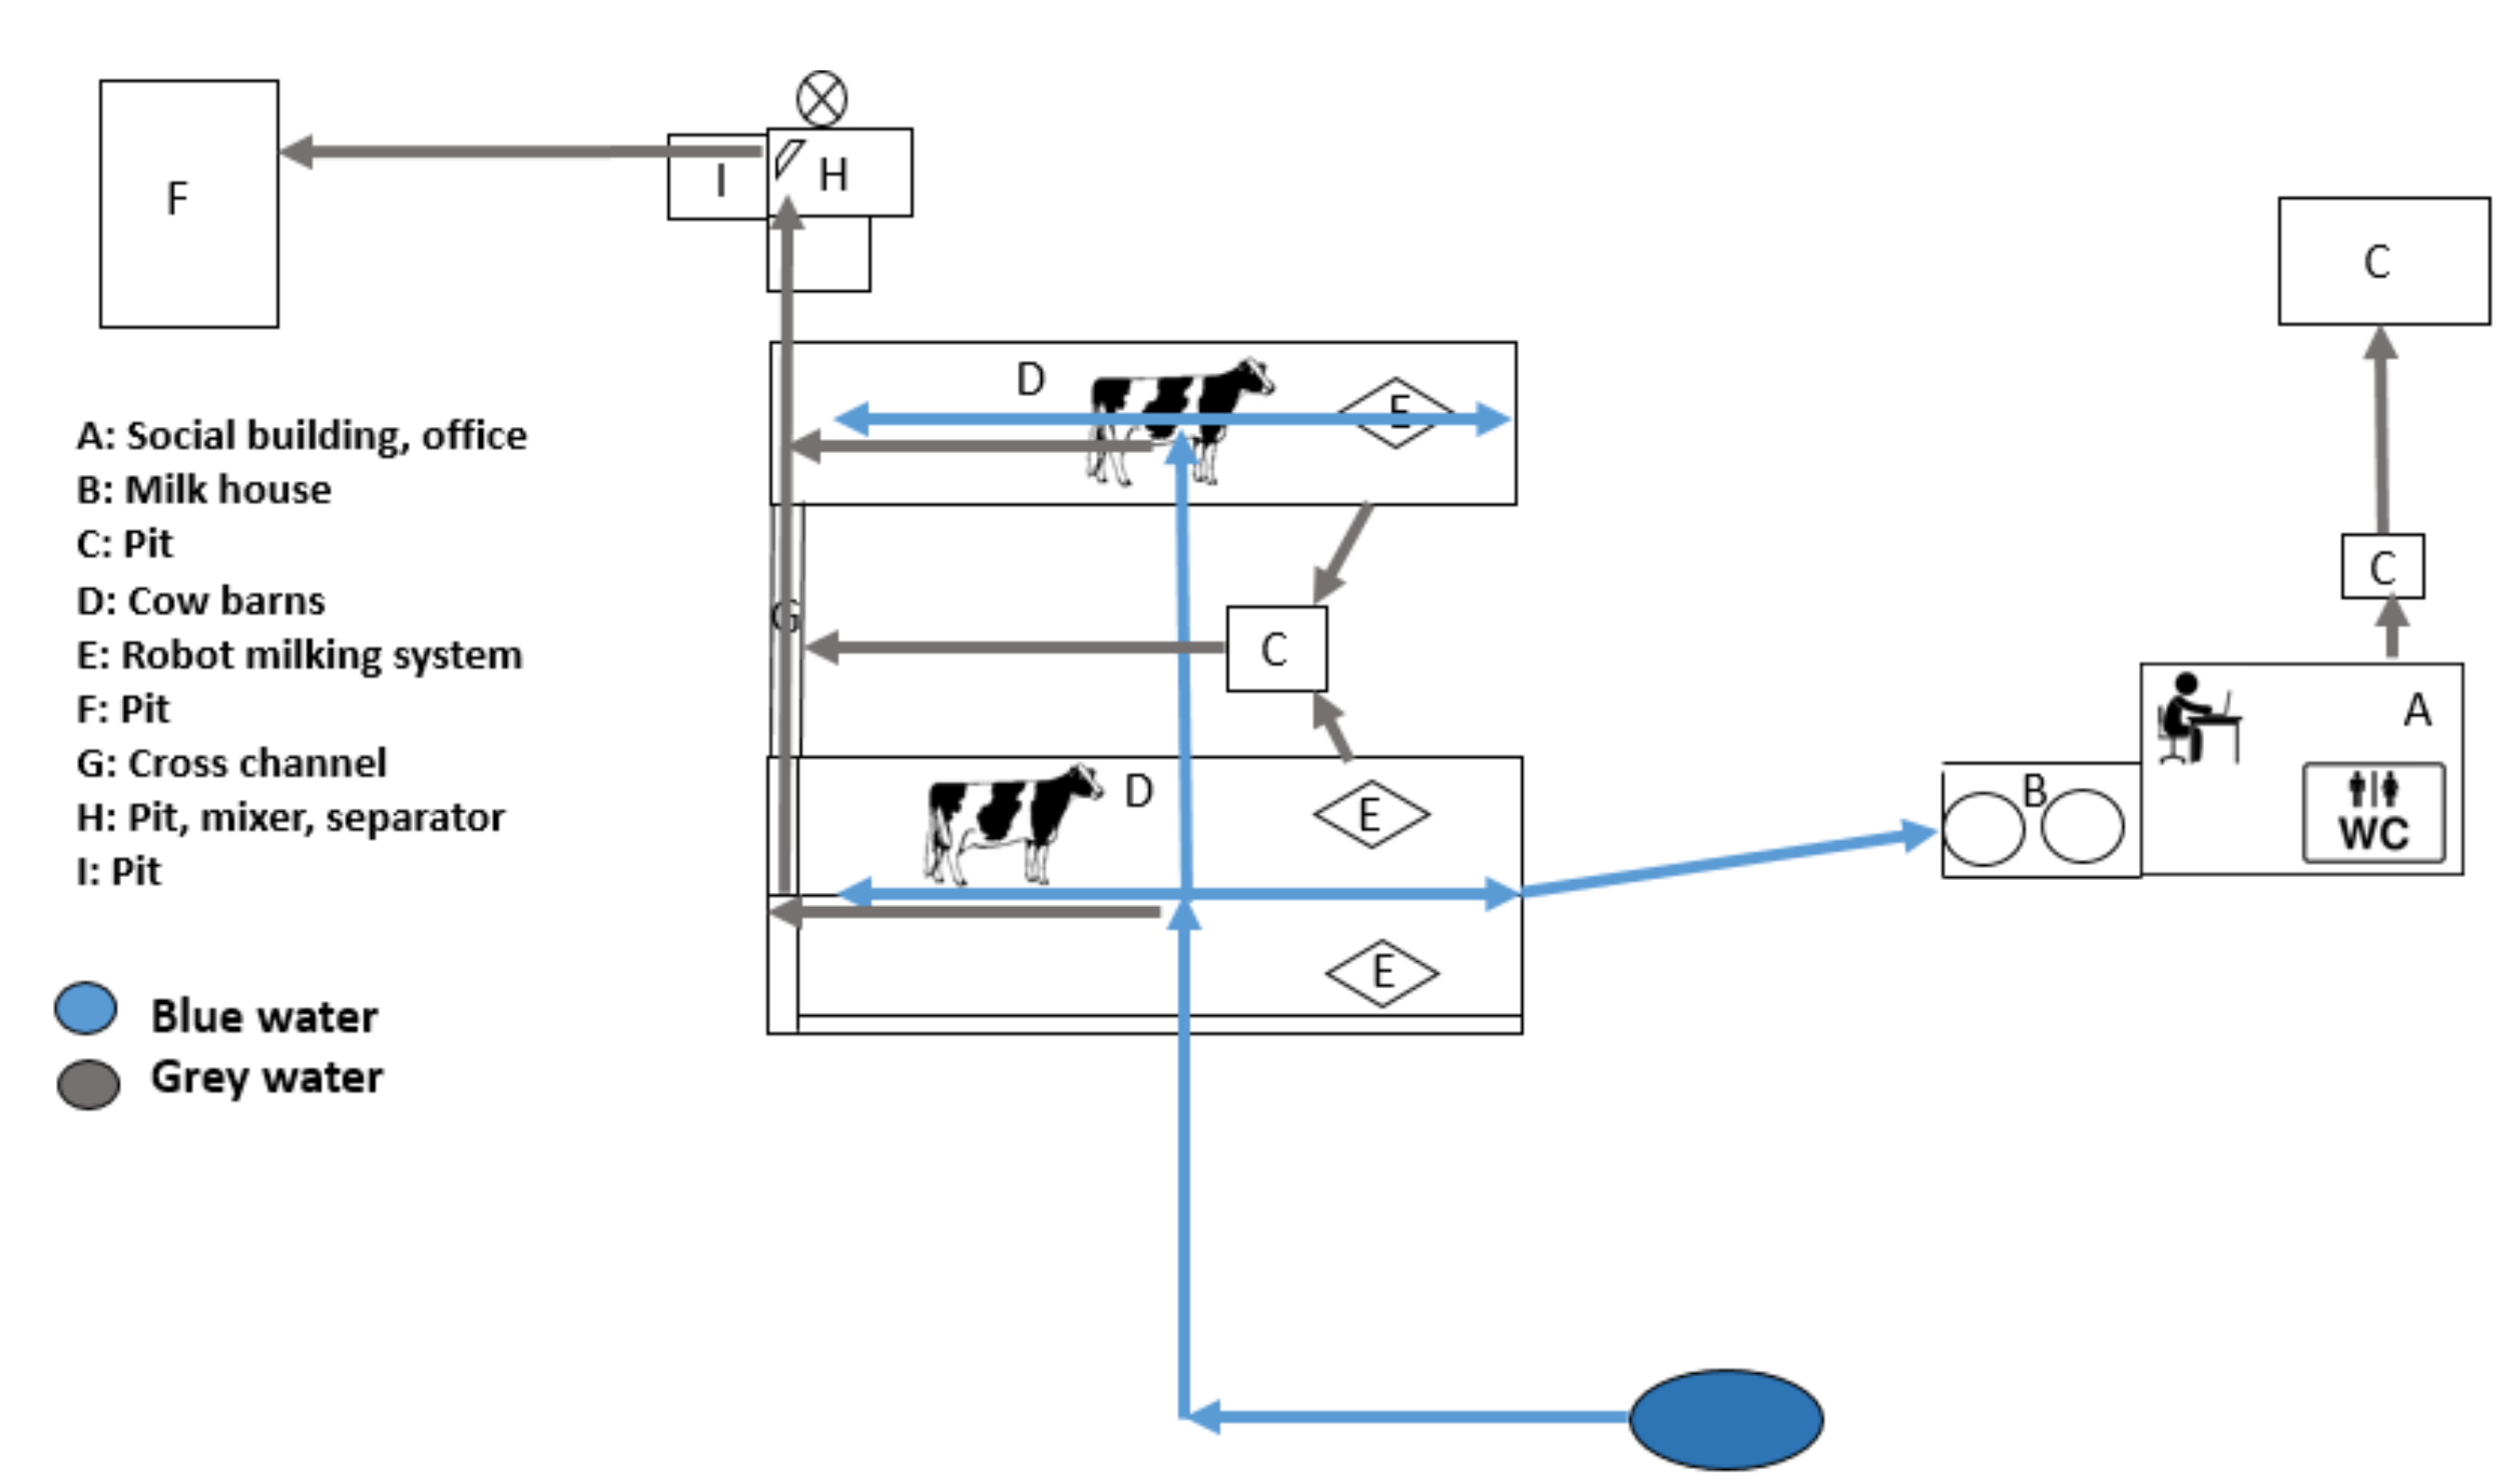
Farms were selected based on individual characteristics. All selected farms were large scale. However, milking technology was different: 12 × 2 parallel in farm A, 10 × 2 polygon in farm B and robotic in farm C. Number of daily milking was 2 in farm A, 3 in farm B and 2.8 in farm C (based on how many times cows visited the robotic system).
Monitoring period included data collection from September 2018 till September 2019. Herd information was collected from farm records provided by farm manager and employees. Main data about herds can be seen in Table 1. Holstein Friesian cattle were on all investigated dairy farms. All farms were located in the southeast part of Hungary, which is one of the warmest s of the country, where annual average temperature is 9–100C and annual average precipitation is 500 mm.

2.1. Animal Housing

In farm A, cows (high-yield, low-yield, dry) and heifers were each housed in separate barns on the farm in a free-stall system which can be seen in A, C, D, E barns in Figure 1.
Getting closer to calving, cows were placed into a tied stall (B barn, Figure 1). Calves were housed in calf pens after calving. After weaning calves were placed into big groups in an open sided, single slope roof shed. All barns were equipped with passive ventilation from open sides and ends of the buildings. Milk house holding area (J, Figure 1) and milking parlor (12 × 2 parallel, G) were connected to the waiting pen which was further connected to barns for milking cows (D, E, Figure 1). The waiting pen (H, Figure 1) is equipped with humidifiers during summer. This was done twice a day, first in the early morning at 4 am and then in the evening at 5 pm. Bulk tanks (9000 L capacity) were emptied every day by milk pick-up. Average daily milk production of the high milk cow group was 29 liters (29.87 kg) based on monthly farm records for the monitoring period, with fat content of 4% and protein content of 3.7%. FPCM was calculated using the following equation:
F P C M = M r a w 0.337 + 0.116 M f a t + 0.06 M p r
where FPCM is fat-and-protein-corrected milk, in kg, and Mraw is the average daily milk production, in kg. Mfat and Mpr are the respective average fat and protein contents of the milk, expressed as a percentage [12]. Corrected to 4.0% fat and 3.3% protein, the milk production averaged 29.84 kg cow1 day1 FPCM.
In farm B, cows and heifers were both housed in separate barns on the farm in a free-stall system which can be seen in A and B barns in Figure 2.
After calving, calves were housed in calf pens till the age of 3 months approximately 1 km away from the farm center, which is not demonstrated on the figure. After weaning calves were grouped into bigger pens in small groups (6–8 animals in each). “A” barn relied on passive ventilation from open sides and ends of the buildings. In B barns for milking cows, there was an active ventilation system. Each of these also had a humidifier. (Milk house holding area (D, Figure 1) and milking parlor (10 × 2 polygon, C, Figure 1)). Milking was carried out three times a day, firstly in the early morning at 5 am, then at 1pm and finally in the evening at 10 pm. Milk was delivered from tanks (25,000 L capacity) every day by milk pick-up. Average daily milk production of a single cow was 32 liters during hot months and 38–40 liters in cold months (36 kg average) based on monthly farm records for the monitoring period, with fat content of 3.2 % and protein content of 3.3, i.e., FPCM value is: 35.96 kg cow1 day1. (Milk house holding area (D) and milking parlor (10 × 2 polygon, C)).
In case of farm C, cows were housed in modern barns on the farm in free-stall system (D barns in Figure 3.) These were equipped with robotic milking systems. Dry cows, heifers and cows before calving were separately housed in old barns, which are not illustrated in Figure 3. 1300 heifers were bought from another farm.
After weaning, calves were housed in calf pens. Older barns had passive ventilation from open sides and ends of the buildings, which are not demonstrated in Figure C. In modern houses, there was a piped humidifier. There was an additional sprayer in each and a micro-spreader in the other barn. All in all, 6 (3 boxes with 6 standings) robotic milking systems (E in Figure 3) were located in modern barns. Average daily milking number was 2.8 depending on how many times cows went to the machine during a day within the investigated period. Bulk tanks (2 × 14,000 L capacity) were emptied once every day by milk pick-up. Average daily milk production of high milk cow category was 34 L (35 kg) based on monthly farm records for the monitoring, with fat content of 3.7 % and protein content of 3.4%. Fat and protein corrected milk was calculated here as well: 34.97 kg cow1 day1 FPCM. 3 × 2 robotic milking systems (E in Figure 3) were located in modern barns.

2.2. Water Use of Dairy Farms

Main water uses of farm management included drinking water for each group of cattle, water used in milking parlor (washing udder, washing platform and milking equipment), milk tank washing, cooling, and water that had been used in the social block for human use and consumption. All on-farm water was gained from the piped water source of a village nearby. Water flow diagram of the farm can be seen in Figure 1. Water that was pumped in one building flowed through the whole farm. There were water pits located near every building, which collected wastewater. Litter was straw on this farm too, thus no wastewater was created in barns, as straw sucked liquid manure. The reason for the high number of water pits was to collect and drive rainfall and other water that had got into its system, but not to collect liquid manure. There were 12 teat wash spray guns in the milking parlor to wash teats and milking equipment. There were hoses to wash platforms after each milking. Wastewater flowed to a pit from the milking parlor after going through straw infiltration.
During summer, there was a periodic humidifier in the waiting pen (H) after milking. In A, B, C, D and E barns water is used as drinking water for the animals. Cows are grouped into low-yield (D barn) and high-yield (E barn) categories.
Drinking water of animals, water used in milking parlor (washing platform and milking equipment), milk tank washing, cooling, and water that was used in the social block for human use and consumption were determining elements of farm B. It is important to highlight that there was no udder washing before milking (as in farm A) as they used pre-milking teat disinfection. All on-farm water was gained from water tower (G). Water flow diagram of the farm can be seen in Figure 2. The whole water use of the farm was based on a 70 m3 capacity water tower (G), which gained water from 365 m depth by pumping. This was the water supply for social buildings, milking parlor and animals. Washing water used in milking parlor and milk house, wastewater from social buildings and all other used water flowed into a water pit (F), then flowed through straw bales, which infiltrated solid fractions. There was a 10-teat wash spray gun in the milking parlor to wash milking equipment and platform three times a day before and after each milking. The water meter in the water tower provided data for water consumption of the farm. In milking parlor (C) water was used for washing platform and milking equipment. From there, water flowed through a settling pit. The liquid fraction flowed further to drying or infiltration pool (H). During summer there was a periodic humidifier, i.e. to humidify for 10 seconds every 3 minutes. A dripping system was applied through ventilation. However, they only used it in each cow barn (B). Litter was just straw. Therefore, no wastewater was created in barns as there was no liquid manure. There was no driving system for precipitation (green water). Water quality measurement was continuous on the farm. Grey water was continuously treated with bacteria in order to accelerate decomposition of organic matter. In A, B and barns that were located 1 km away from the center, water was used as drinking water for the animals.
Main water uses of farm management included drinking water for each group of cattle, water used in robotic milking systems, milk tank washing, cooling, and water that was used in the social block for human use and consumption. All on-farm water was gained from a driven well with 300 m depth. Water flow diagram of the farm can be seen in Figure 3. Water that was pumped from the well flowed through the whole farm. There was a water pit located near the social building, which collected the wastewater of the milk house. There was no bedding material under the animals on this farm. There was a mattress at the resting places of the cows filled with 35 L water and antifreeze liquid. Used water from robotic milking systems flowed to a pit between the two barns. Liquid manure was driven by a manure scraper system at the middle of the barns, which drove it into G cross channel and then to H pit and separator. After that, the liquid manure was separated into solid and liquid phases. Solid fracture was collected under separator then taken to the field. Liquid phase was driven to another F pit, which was also pumped and taken to fields seasonally. In D barns water is used as drinking water for the animals and seasonally for humidifiers to reduce heat stress.

3. Results

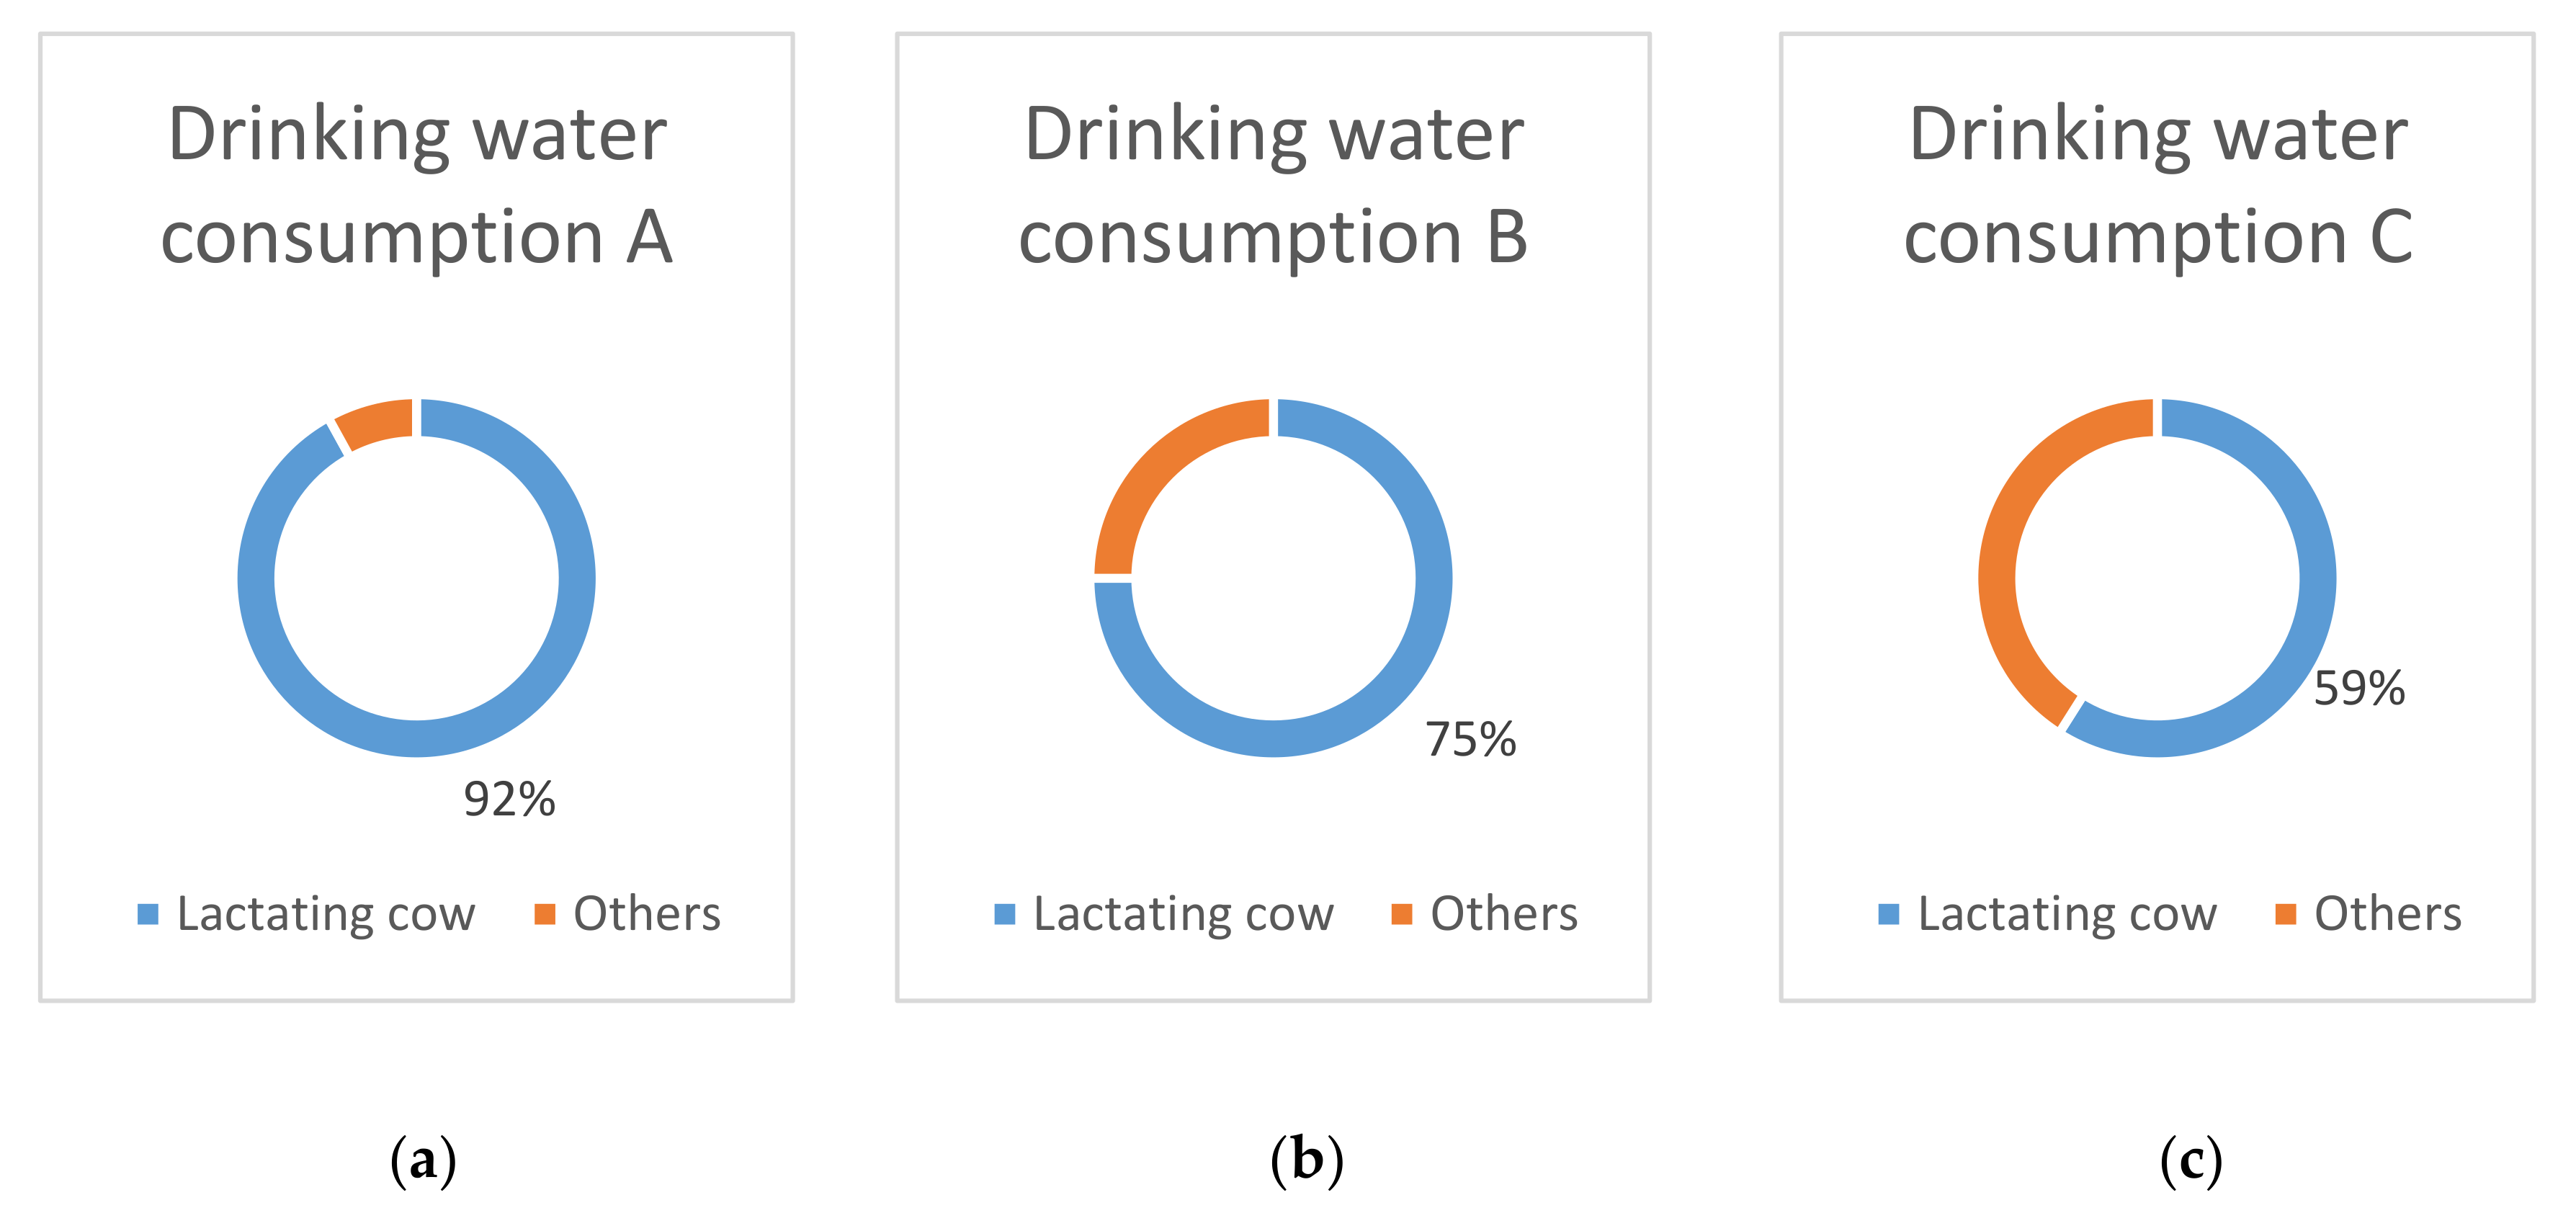
3.1. Drinking Water Consumption of the Farms

Drinking water consumption of animals in different categories was identified based on FAO (Food and Agriculture Organization) data 2018 [13]. Average daily water consumptions of animals on farms A, B and C were calculated based on the following data: 114 L for milking cows, 42 L for dry cows, 25 L for heifers, 7 L for calves and 45 L for cows before calving. These were multiplied by the number of animals in each category in order to get daily drinking water consumption of each. In total, daily drinking water consumption of animals on farm A was 29 m3, farm B was 94 m3, and farm C was 99 m3 (Table 2). However, it is important to highlight that there are several factors, such as body weight, physiological state (stage of pregnancy, lactation, etc.), diet, temperature frequency of water provision, type of housing and environmental stress, which can vary these results.
Based on the daily drinking water consumption of lactating cows and other categories, farm A, B and C expressed by % can be seen in Figure 4. Lactating cows required 92 % in farm A, 75% in farm B and 59% in farm C of total drinking water consumption of the herd. Other categories ranged from 8 to 41% including dry cows, heifers, calves and cows before calving.

3.2. Technological Water Use

In farm A, there were two milk tanks in the milking house (one 4000 L, the other 5000 L storage capacity). 500 L water was needed to wash them once a day after the milk had been taken from the farm. There was milking two times a day. Before milking, udder washing used summa 100 liters water/day. For washing platform and milking equipment, 300 liters water is used every day. In farm B, daily milk tank washing used 1200 liters. There was milking three times a day. For washing milking equipment, 3 × 500 L = 1500 liters water was used every day. For platform washing 5000 liters was used every day. There were two milk tanks in the milking house (each 14,000 L storage capacity) in farm C. 2 × 185 liters water was needed to wash them once a day after the milk had been taken from the farm. Automatic washing cleaned the 6 robotic milking systems 3 times a day with 60 L water. Thus, 1080 liters was the daily water requirement of robotic systems including the water needed for washing udders. The sum of the farms’ technological water use can be seen in Table 3.

3.3. Total Water Use of the Farms

Based on the experience of farm leaders, one year of dairy production can be divided into two big phases from the aspect of water management. There are cold (October–April) and hot months (May–September). Average monthly water use of each farm considering cold and hot periods was given by farm leaders and can be seen in Table 4.
Average monthly water use and consumption for cold period was 925 m3 in 2019 in farm A, i.e., cc. 4.02 m3 month−1 milking cow−1. This means 30.3 m3/day. From this 29 m3 water represents drinking water consumption and 0.9 m3 is technological water use. Workers in social buildings use 0.4 m3 water. However, for ’hot’ months from May to September water consumption and use of the farm increases to 1025 m3 (i.e., cc. 4.45 m3 month−1 milking cow−1) due to higher water consumption of animals and people and cooling practices against heat stress.
Average monthly water use and consumption of farm B for cold months was 2 925 m3, i.e., cc. 5.22 m3 month−1 milking cow−1. Average daily water use was 108.6 m3 and daily drinking water was 104 m3. Daily technological water demand was 2.9 m3 and daily water use of social block was 0.8 m3. Same data considering summer period can be seen in Table 5. 0.2 m3 water was used by humidifiers in the hot period in farm B.
Total daily water use of cold months in farm C was 3024 m3, i.e., cc. 5.21 m3 month−1 milking cow−1. 100.8 m3 was the total daily water use of farm C in this cold period including 99 m3 daily drinking water, 1.4 m3 daily technological water use and 0.4 m3 daily water use of social block. 0.3 m3 was the daily water use of humidifiers in the summer period.

3.4. WU Considering Milking System

Considering milking technology of investigated dairy farms, the inner washing system of milking equipment use a fixed water quantity per washing. However, different milking preparation techniques and platform washing practices result in altering water use. Surface area of milking parlor and robotic milking system also influences water use quantity, as more water is needed to wash the bigger surface area of milking parlors compared to robotic milking systems. Farm A applies udder washing before milking. Therefore, 100 L extra is added to technological water use compared with B and C farms. Based on the technical water consumption data, the number of milking cows and the FPCM milk yield, the amount of process water needed to produce one liter of FPCM milk per cow per day can be calculated. (Table 5). As a result, farm C has the lowest blue water demand at 2.5 L due to the washing robotic milking system. Farm A’s technological water requirement is higher at 3.91 liters and Farm B’s is the highest water demand (13.75 L) due to washing milking parlors. Humans are an important factor in the case of farm A and B, as using spray gun sometimes creates unnecessary water use due to unreasonable spraying (too long, high pressure).
Technological water use of each cow to produce 1 kg milk was identified, which was 0.13 L in farm A, 0.38 L in farm B and 0.071 L in farm C.

4. Discussion

This study revealed water use and the water consumption of three Hungarian dairy farms. We investigated the water use of milking cows with different herd size, using different milking technologies in order to assess relationship between technological water use and milking technology. Thus, valuable information was provided to the owners of dairy farms from the aspect of water management.
Evidently, drinking water consumption of animals increases with herd size as was proven by investigated farm results. Distribution of different cattle categories within a herd also influenced water consumption. Herd size of A farm was 270 and its daily drinking water consumption was 29 m3. Herd size of B farm was 1400 animals, which consumed 93 m3 in farm B. In case of farm C, 2210 animals’ daily drinking water consumption was close to 99 m3. All three farms had free-stall system. Ventilation of farm A was passive so did not affect water use. Both active and passive ventilation were applied in case of B farm, which contributed to a small amount of water use. On C farm, there were passive and active ventilation in the form of humidifier and sprayer which meant 240 L extra daily water use during hot period. Bedding material was straw in A and B farms, so no wastewater was created from the barns. There was no bedding material in C farm, so more grey water was created in modern barns. There was 12 × 2 parallel milking equipment in A farm, 10 × 2 polygon milking equipment in B farm and robotic milking system on farm C. However, amount of daily milking could influence water use, as after each milking there was a washing of equipment. Amount of daily milking was 2 in farm A, 3 in farm B and 2.8 in farm C. Technological daily water use of milking was the highest on farm B at 7700 L, then on farm C at 1450 L and the lowest on farm A at 900 L (Table 5). This was influenced by the type of milking technology as washing milking equipment in A and B farms requires more water than the robotic milking system of farm C, which uses less water in a closed system for washing. Employees who worked on farm A and B might use more water for platform washing compared to the robot.
Differences between average milk productions of dairy farms could also affect water footprint by altering drinking water demands. Holstein Friesian cattle are very sensitive to heat stress, therefore in summer period using ventilation humidifier is extremely important to reduce this.
The hypothesis of this research is that if water use analysis of milking technologies and milk production ratios is assessed: i) there is provable difference between milking technologies and water use efficiency; and ii) opportunities can be found for water recycling and recovery during water use assessment. Technological water use of milking technology considering 1 cow and 1 day was 3.91 L in farm A, 13.75 L in farm B and 2.5 L in farm C. Milking technology clearly influenced blue water use, as the robotic milking system of farm C used the lowest amount of technological water compared to milking parlors of farm A and farm B. As the robotic system is a closed system and human water use differences could not alter its use of washing water, a more efficient technological water use could be achieved. This means that the most efficient technological water use was achieved on farm C. The reason for this is that specific water use of the system was more efficient than the washing system of parallel or polygon milking technologies.

5. Conclusions

Supporting the statements of K. Usva et al. (2014), based on our calculations we can say that milking technology plays a role in water consumption [14].
The milking technology used on Farm-A was 12 × 2 parallel milking, on Farm-B was 10 × 2 polygon milking equipment, on Farm-C was robotic milking system, and the quantity of water used for milking, respectively, 0.13,.0.38, 0.071 liter per cow per 1 kg milk.
However, technological/service water use by washing platform and milking equipment could be more consciously managed by better management of employees or by choosing appropriate water saving milking technology. A robotic milking system is more water efficient than milking parlors, as an automatic washing system uses a precise amount of water each time. Thus technological water could be reduced. As farmers cannot save on drinking water or compensation of heat stress during summer months, they should focus on better water management of washing platform and milking equipment. Based on total daily water use results, farm A had the highest, farm B had lower and farm C had the lowest water demand for producing 1 kg milk during the investigated period
Assessment of water flow and water use of dairy farms let us identify crucial points of water use, where more efficient solutions should be found. Identifying areas for blue water conservation and providing estimates of potential savings is the next phase of this research.
An important point could be, e.g., the choice of milking method, which has been proven in our study, and following this it would be advisable to investigate the effect of the littering method on water use, especially with regard to water recyclability and gray water usability.

Author Contributions

Conceptualization, E.M. and C.H.; formal analysis, E.M. and C.H.; investigation, V.N.; methodology, V.N.; resources, E.M. and C.H.; supervision, E.M. and C.H.; validation, C.H.; writing–original draft, V.N.; writing–review & editing, V.N. All authors have read and agreed to the published version of the manuscript.

Funding

This research received no external funding.

Acknowledgments

The described article was carried out as part of the “RING 2017”, EFOP-3.6.2-16-2017-00010 project in the framework of the Széchenyi 2020 program. The realization of these projects is supported by the European Union, co-financed by the European Social Fund.

Conflicts of Interest

The authors declare no conflict of interest.

References

  1. UNIS. Sustainable Development Goals. 2019. Available online: http://www.unis.unvienna.org/unis/hu/topics/sustainable_development_goals.html (accessed on 13 January 2020).
  2. Ridoutt, B.; Williams, S.; Baud, S.; Fraval, S.; Marks, N. Short communication: The water footprint of dairy products: Case study involving skim milk powder. J. Dairy Sci. 2010, 93, 5114–5117. [Google Scholar] [CrossRef] [PubMed] [Green Version]
  3. Armstrong, D.P.; Knee, J.E.; Doyle, P.T.; Pritchard, K.E.; Gyles, O.A. Water-use efficiency on irrigated dairy farms in northern Victoria and southern NSW. Anim. Prod. Sci. 2000, 40, 643–653. [Google Scholar] [CrossRef]
  4. Lin, J.C.; Moss, B.R.; Koon, J.L.; Flood, C.A.; Smith, R.C., III; Cummins, K.A.; Coleman, D.A. Comparison of various fan, sprinkler, and mister systems in reducing heat stress in dairy cows. Appl. Eng. Agric. 1998, 14, 177–182. [Google Scholar] [CrossRef]
  5. Drastig, K.; Prochnow, A.; Kraatz, S.; Klauss, H.; Plochl, M. Water footprint analysis for the assessment of milk production in Brandenburg–Germany. Adv. Geosci. 2010. Available online: http://www.adv-geosci.net/27/65/2010/adgeo-27-65-2010.html (accessed on 14 February 2020).
  6. Legrand, A.; Schültz, K.E.; Tucker, C.B. Using water to cool cattle: Behavioral and physiological changes associated with voluntary use of cow showers. J. Dairy Sci. 2011, 94, 3376–3386. [Google Scholar] [CrossRef] [PubMed]
  7. Le Riche, E.L.; Vanderzaag, A.C.; Burtt, S.; Lapen, D.; Gordon, R.J. Water Use and Conservation on a Free-Stall Dairy Farm. Water 2017, 9, 977. [Google Scholar] [CrossRef] [Green Version]
  8. SAI. Water Stewardship in Sustainable Agriculture beyond the Farm Towards a Catchment. 2013. Available online: https://saiplatform.org/uploads/SAI%20Platform%20Water%20Stewardship%20report.pdf (accessed on 14 February 2020).
  9. De Boer, I.J.M.; Hoving, I.E.; Vellinga, T.; Van De Ven, G.W.J.; Leffelaar, P.A.; Gerber, P.J. Assessing Environmental Impacts Associated with Freshwater Consumption along the Life Cycle of Animal Products: The Case of Dutch Milk Production In Noord-brabant. Int. J. Life Cycle Assess. 2013, 18, 193–203. [Google Scholar] [CrossRef] [Green Version]
  10. Palhares, J.C.P.; Pezzopane, J.R.M. Water footprint accounting and scarcity indicators of conventional and organic dairy production systems. J. Clean. Prod. 2015, 93, 299–307. [Google Scholar] [CrossRef]
  11. Bosire, C.K.; Rao, J.; Muchenje, V.; Van Wijk, M.; Ogutu, J.O.; Mekonnen, M.M.; Hammond, J. Agriculture, ecosystems and environment adaptation opportunities for smallholder dairy farmers facing resource scarcity: Integrated livestock, water and land management. Agric. Ecosyst. Environ. 2019, 284, 106592. [Google Scholar] [CrossRef]
  12. Gerber, P.; Velligna, T.; Opio, C.; Henderson, B.; Steinfeld, H. Greenhouse Gas Emissions from theDairy SectorA Life Cycle Assessment. 2010. Available online: http://www.fao.org/3/k7930e/k7930e00.pdf (accessed on 10 March 2020).
  13. FAO. Water Use of Livestock Production Systems and Supply Chains. 2018. Available online: http://www.fao.org/3/I9692EN/i9692en.pdf (accessed on 7 March 2019).
  14. Usva, K.; Virtanen, E.; Hyvärinen, H.; Nousiainen, J.; Sinkko, T.; Kurppa, S. Water in an LCA framework–applying the methodology to milk production in Finland. In Proceedings of the 9th International Conference on Life Cycle Assessment in the Agri-Food Sector (LCA Food 2014), San Francisco, CA, USA, 8–10 October 2014; Schenck, R., Huizenga, D., Eds.; ACLCA: Vashon, WA, USA, 2014. [Google Scholar]
Figure 1. Water flow and infrastructure of investigated medium scale dairy farm A.
Sustainability 12 03145 g001
Figure 2. Water flow and infrastructure of investigated medium scale dairy farm B.
Sustainability 12 03145 g002
Figure 3. Water flow and infrastructure of investigated medium scale dairy farm C.
Sustainability 12 03145 g003
Figure 4. Daily drinking water consumption of the herd in lactating cow and other categories (%) in farms A, B and C.
Sustainability 12 03145 g004
Table 1. Number of animals in different categories in analysed farms A, B, C.
CategoryNumber of Animals in the Category
Farm AFarm BFarm C
High-yield cow160560580
Low-yield cow70
Dry cow2580120
Heifers255001300
Calves30100160
Cow before calving1016050
Total32014002210
Table 2. Daily drinking water consumption of different cattle categories in case of farms A, B and C.
CategoryFarm AFarm BFarm C
Number of AnimalsWater Consumption
[L]
No of AnimalsWater Consumption
[L]
No of AnimalsWater Consumption
[L]
High-yield cow16020 00056070 00058058 000
Low-yield cow707210
Dry cow2510508033601205040
Heifers2562550012 500130032 500
Calves302101007001601120
Cow before calving104501607200502250
Total32029 535140093 760221098 910
Table 3. Technological water use of A, B and C farms.
ABC
Category(L/day)
Milk tank washing5001200370
Washing udder100Dry preparation326
Washing robotic milking system--754
Washing platform and milking equipment3006500-
Total90077001450
Table 4. Water use data of farm A, B and C considering cold and hot periods of the year.
(m3)ABC
Cold PeriodHot PeriodCold PeriodHot PeriodCold PeriodHot Period
Average total WU/month 92510252925324930243390
Average total WU m3 month−1 milking cow−14.024.455.225.805.215.84
Average total WU/day30.334.697.7108.6100.8113
Drinking water/day29339410499109
Technical water/day0.90.92.92.91.41.4
Social water/day0.40.50.81.50.42.3
Humidifier/day-0.15-0.2-0.3
Table 5. Calculation of a cow’s water consumption and technological water use to produce 1 kg of milk on farms A, B and C.
FarmABC
Number of lactating cows (cows day−1)230560580
FPCM (kg cow−1 day−1)29.8435.9634.97
Technological water use of milking (liter day−1)90077001450
Technological water use of milking (kgwater cow−1 day−1)3.9113.752.5
Technological water use for a cow to produce 1 kg milk (kgwater cow−1 kg milk−1)0.130.380.071

