Article

The Customer Orientation Service of Spanish Brokers in the Insurance Industry: The Advisory Service of the Insurance Distribution Channel Bancassurance

by
Miguel Angel Latorre Guillem
Department of Accounting, Finance and Management Control, Universidad Cátolica de Valencia San Vicente Mártir, 46003 Valencia, Spain
Sustainability 2020, 12(7), 2970; https://doi.org/10.3390/su12072970
Submission received: 21 January 2020 / Revised: 1 April 2020 / Accepted: 3 April 2020 / Published: 8 April 2020

Abstract

:
This research focuses on the customer orientation of insurance brokers, whose activity is regulated by the Law on the mediation of private insurances and reinsurances. The goal is to ascertain whether the intermediation inherent in the insurance broker’s activity, which implies a customer-oriented service, entails a positive behaviour that transcends the immediate environment, reaching society. This study presents a comparative analysis between the insurance brokerage society, characterised by a personalised customer service, and banks’ advisory services on insurance. To this end, the study uses a sample of insurance brokerage firms in Spain. The results presented in this study suggest that the customer values the advisory service provided by the broker. However, for a particular business segment in standardized insurance products and products related to banking assets, customers are more likely to resort to the bank’s services. In addition, the results indicate that the commission percentages applied by the entities operating in the banking insurance channel exceed those perceived by the insurance broker. With all this, intermediation in the development of the insurer’s activity can entail social behaviour that involves customer-orientation and, possibly, social service and environmental performance.

1. Introduction

Currently, the insurance market is immersed in a process of deep regulatory changes in different geographic areas. The adaptation of the legislation to the new environment takes into account the incorporation of agents and technological advances that significantly reduce the time and costs involved in the satisfaction of customers’ demands. Thus, the increasing number of online transactions has led to the consideration of the Internet as an ideal distribution channel for the marketing of standard products rather than investment products, which require specialised advice. Therefore, emerging technology-driven innovations in the insurance industry are a recent trend [1].
The current process of change favours, on the one hand, a strong development of banks as channels of distribution of insurance products in different markets and, on the other hand, a new flow of revenue stemming from the commissions from the insurance companies for the distribution of their products. Therefore, these products represent a source of complementary profit for the banking sector that compensates for the lower turnover caused by the continuous fall of the Euribor [2], which is the interest rate of reference in the operations involving banking assets and liabilities. This situation is causing the reduction of the profits from the traditional banking activity: financing services. As a result, one of the most important contributors to banks’ growth is bancassurance.
Regarding the insurance distribution channel, the ranking of various agents in the insurance distribution channel is based on the characteristics of the insurance market. Bancassurance has grown in different places, where it has been shaped differently according to demographic, economic, and legislative factors [3]. Research shows the different characteristics of bancassurance models: distribution agreement, strategic alliance, joint venture and financial services. Furthermore, banking and insurance industries have developed rapidly in economic terms around the world [4]. This situation owes to the merger of global financial markets, the development of new technologies and the universalisation of the banking industry. In addition, the expansion of non-banking activities has allowed the emergence of new channels of distribution in the insurance industry.
The development of the banking distribution channel may have a more pronounced growth in the Eurozone as a model of traditional banking–productive investment–than in other commercial areas such as the USA, characterised by greater regulation in the insurance sector and by a model of banking speculation. In this context, brokers are the predominant distribution channel in countries such as the UK or Germany (75% and 50%, respectively), while in Asia, for instance, banking-insurance is reaching great penetration levels in the insurance market [5]. This is particularly true in countries like China, India and Japan, where legal restrictions have been attenuated. In fact, this distribution channel allows the banking sector to obtain additional income from the sale of insurance products, while insurance companies can expand their customer base without having to increase their sales force or hire commission agents or insurance brokers. Thus, bancassurance has become an insurance distribution channel with a strong growth in the Turkish insurance market [6].
With all this, extending the analysis to insurance brokers, we find that they stand out because of their high autonomy in the development of their activity within the distribution channel. Brokers’ primary role is to provide insurance coverage on behalf of their clients. Additionally, brokers may be engaged, among other activities, in consulting, wholesale or reinsurance activities, alternative risk financing, risk analysis and human resource consulting activities [7].
Regarding previous evidence on studies of operational performance in the insurance industry [8,9,10,11,12,13,14,15], studies have been conducted primarily on perceived value and customer satisfaction in countries with deregulation such as Italy, France, Portugal and Spain (Europe), Latin America, Ghana and Nigeria (Africa), Jordan (near East) and Japan, Pakistan, Taiwan and Vietnam (Asia). On the other hand, countries with high regulation include Anglo-Saxon countries such as the United States and the United Kingdom. However, there are fewer studies on the advisory services provided by insurance brokers, especially regarding non-life insurance services. In addition, most of the studies conducted are focused on advisory services, while fewer studies focus on the development of the insurer’s activity, which can entail social behaviour based on customer-orientation and, possibly, social service and environmental performance.
To fill the gap in the literature, this study investigates the customer-oriented service of Spanish brokerage in the insurance industry, focusing directly on aspects like operating performance and the quality of objective and subjective advice. To this end, we analyse a common practice, which consists in deferring the premiums charged to clients in order to invest them in short-term financial products and extend our analysis to the advisory service of the distribution channel Bancassurance, explaining the process. In addition, we test the percentage of commissions and fees perceived by insurance brokers and bancassurance. Finally, we investigate whether the observation of the social service and the environmental performance depends on a customer-oriented service behaviour of the insurance distribution channel.
Our study extends previous evidence in the Spanish insurance market and delves more deeply into several factors to examine whether bancassurance and the insurance broker’s customer-oriented services entail a positive behaviour that permeates into society [16,17,18]. We study the quality of the broker’s advisory service and compare its objective or non-objective advisory nature to that of the bancassurance operators. Additionally, this study observed that commissions are directly linked to sales agents’ social behaviour.
The paper is structured as follows. First, the literature review presents previous research on the relevance of insurance brokers and the bancassurance distribution channel, with a presence that varies according to the distinctive features of each insurance market. Second, the method section describes the methodology used to analyse the sample based on information from the databases and the sector’s annual reports consulted. The initial sample consists of 500 insurance brokerage firms in Spain included in the Iberian Balance Analysis System [SABI] database between 2013 and 2017. In this study, 500 large-size insurance broker firms configure the sample.
The documents consulted include the sector’s annual reports on the activity developed by the bancassurance operators, informed by their respective statistical-accounting documents issued by the Directorate General for Insurance and Pension Funds, and the sector’s annual reports on insurance brokers’ activity. In both cases, information refers to the non-life business. Third, research results are explained. Finally, conclusions are presented.

2. Literature Review

In this section, we present an overview of two important distribution channels in the insurance industry: the insurance broker and bancassurance.

2.1. Insurance Broker

Mediation in the insurance industry is subject to regulation in different countries in a context of free competition. Typically, a broker has contracts with a number of insurers and is compensated by way of commissions paid by the insurers who offer the coverage. As a general rule, when a broker agrees to sell a policy to a client and obtains a commission in return, the broker has a duty towards the client to act with reasonable care, skill and diligence.
In particular, in the German insurance market, insurance brokers may provide advisory service of higher quality and better suited to the needs of the clients than that of insurance agents. Thus, advisory services are influenced to some degree by the firm’s size and the employment structure of insurance brokers, as well as by the degree of specialization on private clients [19,20]. They can reach economies of scale and perform fixed cost investments in human capital and technology to easily gather information about product prices, performance and terms [21,22].
In the US insurance market, the brokerage segment of the industry is highly concentrated. The main differences between independent agents and brokers are size and the range and depth of services provided [23]. In general, brokers tend to service larger and more complicated business insurance needs. In this context, brokers’ traditional role has been to find insurance for corporate clients, to negotiate the price and scope of coverage, and to advise clients on the design of their risk-management plan. In the USA, as in the UK and other European countries, brokers dominate the distribution of commercial insurance because these relatively deregulated and competitive environments allow them to influence insurers’ choice and terms [24]. In Taiwan, some insurance brokers apparently sell insurance to high-risk customers so that more sales compensations can be earned by the broker [25].
Since 2010, researchers have become interested in investigating how service providers engage in sustainability initiatives to increase profit, enhance customer satisfaction, strengthen the community and protect the environment. There are previous studies on services, especially on perceived value and customer satisfaction in Vietnam [26]. On the other hand, other studies examine the factors that determine the profitability of insurance brokers in a developing economy such as Ghana [27]. Thus, the types of advisory services and the collected premiums paid by the client to the insurance broker, for instance, are two of the issues discussed in this study.
Regarding the Spanish intermediary market, and in accordance with the Spanish financial system, the activity of insurance intermediaries is subject to a single supervisor: the Directorate General for Insurance and Pension Funds. In this manner, Law 26/2006 of July 17 regulates insurance mediation and private reinsurance [28], where the compensation received by the broker from the insurance company will be in the form of commissions that are satisfied, on the one hand, through the payment of premiums to the insurer and, on the other hand, through fees the broker bills directly to the customer.
In this vein, the new Spanish Law on Private Mediation Insurance and Reinsurance states that intermediaries can only charge commissions and fees for insurance policies they have mediated, and forbids any other form of traditional remuneration such as production incentives (volume discount) or compensation for a good claims portfolio, as stated in Law 26/2006 of July 17, insurance mediation and private reinsurance [28]. Specifically, we focus on the possibility of deferring the payment to insurance companies of premiums collected from clients. In this case, the broker collects the premiums payable under the client’s insurance policy but does not immediately send the funds to the insurance company. Instead, the broker waits until the end of the legal period (e.g., 50 days in Australia or 30 days in Spain) and uses this money in the meantime either to make business-related payments or invest in short-term assets in order to obtain an extra return.
In this line, and according to the methodology used in this work, several previous studies have analysed operational profitability and the different relevant factors in the insurance industry. These studies explore the joined and individual effect and power for some ratios on the roles of these factors such as customer needs, image, price, services and sustainability initiatives to increase profit, among others. These studies have focused on the insurance industry of different countries such as Ghana, Jordan, the United States, Nigeria, Pakistan, Taiwan and Vietnam. They are in line with the methodology used in this work, operating performance, which allows us to analyse alternative factors [7,8,9,10,11,12,13,14,15].
The following section presents the main channels of distribution, including bancassurance. This presentation compares bancassurance with the insurance broker.

2.2. Bancassurance Distribution Channel

Following the literature review in this section, we present some aspects treated by different authors on the importance of the bancassurance channel of distribution in various countries. Thus, in countries such as France, Italy, Spain, Portugal and Romania, bank branches have become the main distribution channel for life policies. However, in other countries such as the UK and Germany, insurance agents and brokers manage most of the insurance market [29,30,31]. The French insurance market has a structured pension system that favours bancassurance’s high position in the field of life and, to a lesser extent, in the non-life sector. In the life insurance market, products are very similar to banking products and there are high tax incentives that favour their rapid marketing through the banking channel [30]. In general, marginal costs for banks and the distribution of costs for insurers are lower than those involved in the agents’ network. Finally, the sale of products of the non-life sector requires certain skills that differ from those necessary for the sale of savings products [32].
Therefore, the existence of a lower intermediation in the business of non-life by the bancassurance could owe to the presence in these markets of strong alternative channels (agents and brokers) and to customers’ perception that they are receiving personalised and objective advice. This objectivity contrasts with the service of the banking distribution channel, which depends on the companies whose products they have agreed to market. The banking channel presents a strong growth in some countries (e.g., Brazil, France, Italy, Portugal and Spain), while the regulatory situation of other countries such as the USA and Canada does not foster the same growth of the banking distribution channel [32] (p. 11). Conversely, the German insurance market is characterised by a strong presence of agents, in both towns and cities, and a strong resistance to buying insurance products through banks. In the UK, this situation is the result of a strong tendency towards buying insurance products via the Internet and telephone sales. In this way, saving costs is not an incentive for bancassurance growth, especially in non-life insurance. In the Turkish insurance market, the significant growth of bancassurance responds to the high personal and financial information available to its customers. Thus, by having the opportunity to contact their customers at different times of their business relationship, the bank is able to provide insurance products according to customers’ personal and professional needs. In addition, the bank provides insurance companies with a channel for the distribution of their insurance products, a situation that favours bancassurance’s strong growth [6,29,30,31,32]. In Taiwan, the impact of bancassurance on service quality, corporate reputation and profitability increases with market maturity. Thus, service quality has a sustained effect on corporate reputation and therefore on profitability [26,33].
Regarding the remuneration system of the bancassurance distribution channel, the agreement is based on a commercial contract between the financial institution and the insurance company; it is considered an agency contract [34] (p. 26). Thus, among other aspects, the contract regulates the payment of commissions, as the main model is that of pure distributor. In this sense, the bank acts as an intermediary by offering products from the insurance company. The application of this model is part of the bank’s real need to offer insurance products to its customers within its traditional activity. In general, this service is valued positively by customers who value the independence of the advisor [31] (p. 409). However, it is a potential disadvantage for insurers, who will have little control over these customers, because there will be a closer relationship between the client and the banking entity. Thus, even though customers consider bancassurance a trusted advisor, measures should be established to limit banks’ fees [34,35,36,37,38,39,40,41,42] (p. 25). In this way, a commission level of 20% on the premium could be established, but if the bank’s commissions exceed this level, a protection mechanism should ensure that the client is informed about the commissions perceived by the bank [43,44,45]. Additionally, in India, there are several factors that explain the need and subsequent development of bancassurance. The size of the country, a diverse population and the problems of connectivity in rural areas hinder insurance sales in this country. Therefore, bancassurance, through the local bank branch allows for an improved insurance offer for common people. Thus, bancassurance in India is necessary given the need for a well-resourced financial structure that allows the country to grow economically [3,4]. With all this, bancassurance in the Spanish Insurance Market can act exclusively for a single insurance entity or for several insurance companies [16] (pp. 43–45).

3. Hypotheses to be Tested and Research Design

This study was conducted in three stages: First, a review of literature on advisory service of the bancassurance distribution channel; objective and subjective advice and customer-oriented service was carried out in order to identify the relationship between these dimensions, the positive behaviour of the sustainable insurance brokerage and their effects on society. Second, a primary qualitative method was employed to build the sample based on the objectives of this study. Finally, a quantitative method was employed to analyse the data of the sample in order to test the hypotheses using statistical techniques.
Based on literature [24,25,35,37,46,47], an analytical framework is presented to examine the relationship between the advisory service of the distribution channel bancassurance and objective and subjective advice on the one hand, and customer-oriented service on the other hand, and the way positive behaviour of the sustainable insurance brokerage would reach society (Figure 1). Drawing on cited literature, the author examines the image of the advisory service of the distribution channel including insurance broker and bancassurance, objective and subjective advice, customer-oriented service and the sustainable insurance brokerage, which may lead to positive behaviour that could potentially reach society.
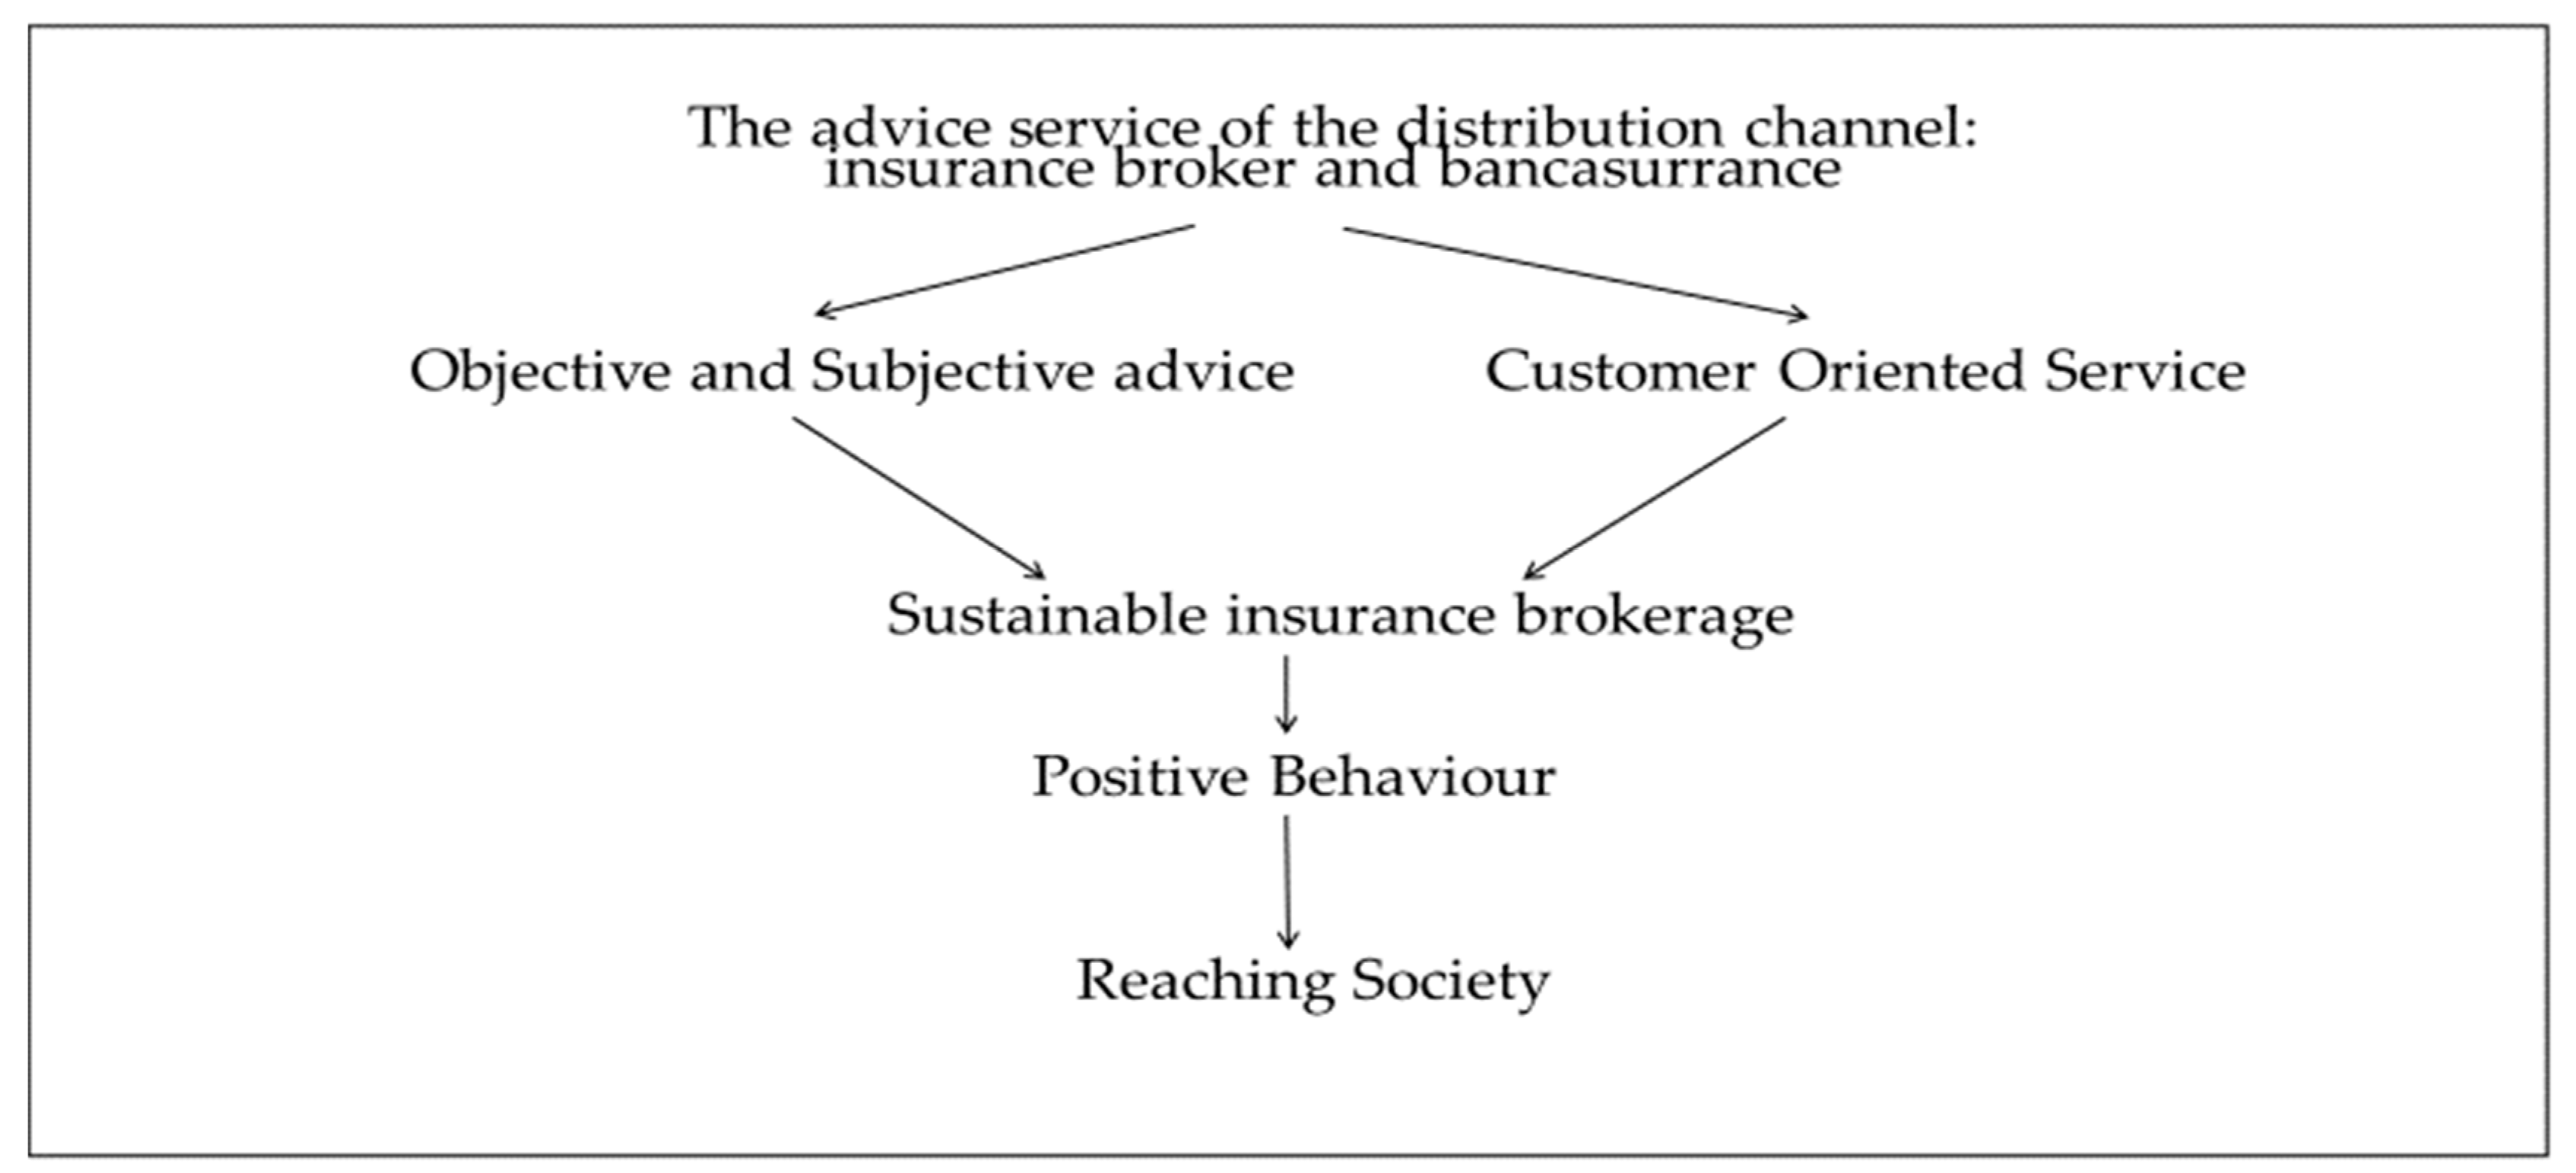
  • The advisory service of the distribution channel: insurance broker and bancassurance evaluates customer perception of the advisory service provided by the broker and banks’ services.
  • Objective and subjective advice: describes the form of the selection of risks and the information provided by the intermediary.
  • Customer-oriented Service: evaluates the extent of customers’ positive perception of the benefits of insurance coverage and the value of insurance services.
  • Sustainable insurance brokerage: measures sustainable services that satisfy customers’ needs.
  • Positive behaviour: evaluates the client’s perception of the payment of insurance premiums within the established deadlines to the insurance companies.
  • Reaching society associates: a positive behaviour towards the customer with its benefits for society.
Considering previous theoretical arguments and empirical evidence from the “Insurance distribution channels” section, we present the following hypotheses:
The first hypothesis is related to the linkage between the customer-oriented service and positive behaviour that reaches society. As found in the cited empirical literature, perceived customer-oriented service is strongly correlated with sustainable insurance brokerage [48,49,50,51,52,53,54,55,56]. We expect the existence of social and sustainable behaviours and operations producing goods and services that satisfy customer needs and significantly improve social and environmental performance [37].
In order to test H1, we take into account the customer-oriented behaviour of Spanish broker firms in the insurance industry. Previous literature (Directive 2002/92/EC, paragraph 4.a) shows that a determinant of this activity is the quick transferral of the collected premiums–paid by the client to the broker–to the insurance company lest there is an incident that has to be managed by the insurance company [43,44,45]. Thus, this relevant issue that affects the insurance broker is the management of intermediate premiums collection. The activity of an insurance broker is characterised by a high autonomy, which could imply higher administrative costs than those borne by another type of agent in the insurance mediation market. Therefore, the insurance broker that manages the collection of the premiums of the clients could compensate these administrative costs by looking for a financial return [17,18,43,44,45].
Hypothesis 1 (H1).
The broker has a customer orientation in the management of the policies of his or her clients, which has a positive effect on society. Therefore, sustainable insurance brokerage would be encouraged.
The second hypothesis focuses on the analysis of structural variables. In this way, the influence of structural variables such as size on the quality of advisory services is tested, showing that advisory services are influenced to some degree by insurance brokers’ firm size. Size works as an indicator of their degree of specialization on private clients and depth of the quality of the services provided. As a result, large companies broker the most complex and highest risks, while small companies deal with lower risks [20,21,25]. Service quality has been recognized as an important factor that leads to the differentiation of services and products and the achievement of competitive advantages; in particular, it is closely related to firm profitability and performance in the service sector [11,46,47]. The quality of the service should be emphasised in order to sustainably develop that which has a positive effect on society [26].
Hypothesis 2 (H2).
The structural variable size positively influences the quality of the service provided by the insurance broker to his or her clients.
Regarding the third hypothesis, we analyse how the quality of the non-objective advisory service favours the sustainability of the banking industry. To be sustainable, service providers must satisfy consumers´ needs lest they become redundant and economically irrelevant [35]. Empirical literature studies indicate that quality and price significantly influence customer satisfaction in service sectors including financial services [29,55,56,57,58,59,60,61,62]. Customer satisfaction plays an important role in business strategy and acts as a key factor in the sustainable development of the companies [26,37].
Hypothesis 3 (H3).
The sustainability experienced by the banking industry is motivated by the quality of the advisory service of bancassurance towards its clients.

4. Sample and Methodology

4.1. Data and Sample Selection

This section explains the sample used in this study. In Spain, the market for insurance intermediaries has been traditionally characterised by the presence of small enterprises. Nowadays, and as a consequence of globalisation, large insurance-mediation companies have appeared in the Spanish market. As a result, large companies broker the most complex and highest risks, while small companies deal with lower risks. The sample is made up of large insurance brokers. This choice increases the reliability of the statistical inferences that can be obtained, given that it includes more data that can be optimally measured regarding the quality of the advisory service as well as its suitability to customers’ needs.
Table 1 presents a comparison of the mediation sector during the following years, from 2013 to 2017. The data presented have been obtained from the statistical accounting documentation of the Directorate General for Insurance under the Ministry of Economy and Finance of Spain. Thus, with respect to linked bancassurance operators, the data indicates a reduction of the number of operators from 53 in 2013 to 49 in 2017. This negative result implies an 8.16% decrease. However, the evolution of the other mediators yields the following data regarding the number of mediators: Insurance Brokers obtain a positive increase of 7.70% and insurance agents present a negative trend of −11.62%.
With all this, the determinants of this situation could be the change of productive cycle produced by the economic crisis, the competition of other mediators and the reorganisation of the Spanish banking sector immersed in processes of merger that affected the different bancassurance operators. In addition, the situation caused banks to sell their insurance business to insurance companies in order to obtain capital gains that might compensate their negative bank balances.
Our initial sample comprised 500 insurance broker firms in Spain included in the SABI database from 2013 to 2017. Thus, our temporary horizon covers one crisis year and four post-crisis years. We consider a crisis year any year when Spain had a negative gross domestic product (GDP).
For a broker firm to remain in the final sample, it needs to meet the criteria shown in Table 2, so the customer-oriented responsibility ratio can be computed for that year. The necessary economic and financial information for this research comes from the SABI database. SABI dataset is released by Bureau van Dijk Electronic Publishing.

4.2. Descriptive Characteristics of the Sample

Table 3 shows some characteristics of the firms in the sample according to the valuation periods. As explained in the Section 4.1., if a broker firm systematically defers the premiums charged to its clients in order to invest in short-term financial assets, that firm is expected to have a high financial income. We proxy the (non) customer-oriented behaviour of insurance brokers through a customer-oriented responsibility ratio, computed as financial income divided by sales. At the end of each natural year all the firms in the sample were ranked on their customer-oriented responsibility ratio. The sample was then divided into three customer-oriented responsibility ratio groups based on the breakpoints for the bottom 30% (Low), middle 40% (Medium), and top 30% (High). Therefore, for a natural year, the Low group comprises the 30% of the insurance brokers with the best customer-oriented service behaviour, whereas the High group comprises the 30% of the insurance brokers with the worst customer-oriented service behaviour. Table 3 exhibits the summary statistics for the full sample (Panel A), Low (Panel B) and High (Panel C) customer-oriented responsibility ratio groups of insurance brokers. In order to avoid any bias caused by extreme values, we show the median values for all the variables except for the sample size, which is defined as the number of insurance brokers in the group.
The comparison between Low (best customer-oriented responsibility) and High (worst customer-oriented responsibility) customer-oriented responsibility ratio group samples (Panel B and C, respectively) shows some interesting features. For example, firms in Panel C are bigger than firms in Panel B. As a consequence, sales and financial income of firms in Panel C are also greater than sales and financial income of firms in Panel B. If a broker’s business operations are similar regardless of firm size, then a similar ratio of financial income divided by sales would be expected for both groups. However, this ratio is larger for firms in Panel C than for firms in Panel B, except in the year 2013, when the ratio is higher in the Panel B. From our point of view, this evidence is consistent with the fact that large broker firms have enough resources to deal with the risk of holding onto premiums collected from clients for the maximum period allowed. Therefore, large broker firms have more incentives to delay forwarding the payment of the premiums to the insurance company than small broker firms, which could suffer financial distress in the event of an incident. Consistent with this evidence, several authors find that brokers’ advisory services are influenced to some degree by firm size and quality service [21,26,27].
To test hypothesis 3, we used the annual reports of the sector, which collect the activity developed by the bancassurance operators based on these operators’ statistical-accounting documents, issued by the Directorate General for Insurance and Pension Funds. In addition, we have consulted the financial and accounting database of insurance brokerage companies, in accordance with the definition given by the Law 26/2006 of 17 July on mediation of private insurance and reinsurance [28]. The sample includes companies whose accounts are in the mercantile register, according to information obtained from the database consultation Iberian Balance Analysis System (IBAS). Finally, in order to present more precise results with regard to the activity of the insurance intermediaries, we analyse a sample with the branches that have the greatest turnover in the non-life business. In 2012, the volume of non-life business brokered by the linked bancassurance operator in the Spanish insurance market was 13% [17]. In addition, we study the median values of premium variables and commissions for both the total production and the new production of the linked bancassurance operator and the insurance brokerage company.
Next, in Section 4.3 and Section 4.4, we present the methodology for the study of the univariate model and the multivariate model, respectively.

4.3. Estimation of Accounting Ratios to Measure Operating Performance of the Insurance Brokers

Given the size of our sample, we employ nonparametric tests in order test the significance of conventional operating performance in order to compute the Customer-oriented responsibility by the insurance brokers in the insurance industry. Specifically, as the nonparametric test, we employ Wilcoxon signed-rank test. As found in the cited empirical literature, Table 4 summarises the empirical proxies we used in order to measure operating performance [14,18,49,50]. Some comments should be made regarding the computation of the empirical proxies.
A common way to measure profitability is the use of return on sales (ROS), return on assets (ROA), and return on equity (ROE), which refer to earnings before interest and tax (EBIT) by sales, assets and equity, respectively. In computing sales efficiency (SALEFF) and income efficiency (INEFF), we deflate the sales revenue and income data, respectively, using the appropriate Gross Domestic Product (GDP) deflator.
As a consequence of the well-known asymmetry of accounting ratios, and as is common in the literature, we calculate the median of each variable for the full sample and groups formed as stated above. We test whether the median difference in variable values between the High and Low customer-oriented responsibility ratio groups is zero. In order to measure the statistical significance of the change in the variables we run the Wilcoxon signed-rank test. The Wilcoxon signed ranges test is a non-parametric test used to compare the average range of two related samples and determine the existence of differences between them. It is used as an alternative to Student’s t-test when the normality of these samples cannot be assumed. It is a non-parametric comparison test of two related samples and therefore does not need a specific distribution. Rather, we use the ordinal level of the dependent variable, which is used to compare two related measurements and to determine whether the difference between them owes to the statistical significance of the difference [14,51].

4.4. Panel Data Regression Analysis Estimates of the Customer-Oriented Responsibility Ratio for the Full Sample

Based on the hypotheses developed in Section 3, we panel data regression analysis methodology in order to analyse the relationship between firm operating performance and customer-oriented responsibility [52,53,54,55,56,57,58,59,60,61,62,63,64,65,66,67,68,69,70]. We proxy operating performance through Return on Sales (ROS), Return on Assets (ROA) and Return on Equity (ROE) measures. In addition, we employ Leverage, Liquidity, Total Assets and Sales as control variables following the majority of the studies measuring the effect of firm size on profitability since the seminal work by Simon [52], which shows a positive relationship between firm size and profitability [63,64,65,66,67,68,69,70,71,72,73].
Therefore, we run the regression model in Equations (1) and (2):
Rit = αi + β1 CUSit +β2 LEVit +β3 LIQit +β4 SIZEit + εit,
Rit = αi + β1 CUSit +β2 LEVit +β3 LIQit +β4 SALESit + εit,
where Rit stands for the operating performance proxies (ROA, ROE, ROS) of firm i in the year t, CUSit is the customer-oriented responsibility of the insurance broker firm i in year t, LEVit is the Leverage of the insurance broker firm i in year t, LIQit is the Liquidity as Current assets/current liabilities (of the insurance broker firm i in year t, SIZEit is the log of Total Assets of firm i in year t, and SALESit is the log of the sales of firm i in year t. Heteroskedasticity has been corrected using the Prais–Winsten methodology [71,72,73].
All the variables were organized in a balanced panel database, which was analysed by applying models with fixed effects and with random effects. Panel data comprises data sets consisting of multiple observations for each sampling unit. By using panel data, we can get better estimations, and we can test more sophisticated behavioural models, with less restrictive assumptions. Working with panel data allows the use of various techniques to estimate models with specific effects. The cross-sectional or cross-temporal specific effects can be identified and analysed by using techniques for fixed effects and random effects [71,72,73].

5. Results

5.1. Univariant Analysis Results

In this section, we present the results obtained from the testing of hypotheses 1, 2 and 3. Table 5 presents the results obtained from the validation of hypotheses 1 and 2. Thus, Table 5 exhibits the median values for Low customer-oriented responsibility ratio broker firms (best customer-oriented behaviour) in Panel A, High customer-oriented responsibility ratio broker firms (worst customer-oriented behaviour) in Panel B and median differences for each variable we employed to proxy operating performance from 2013 to 2017 (Panel C).
We observe the presence of slightly significant evidence when using ROA and ROE. However, we find that ROS median values are significantly higher for High customer-oriented responsibility ratio firms than for Low customer-oriented responsibility ratio firms in three of the five years of our horizon of study (see Panel C). We also find that High customer-oriented responsibility ratio firms (firms with the worst customer-oriented behaviour) are statistically more efficient (see INEFF variables) and not as efficient (SALEFF and EMPL variables), have a lower leverage (TDTA) and a better liquidity position than Low customer-oriented responsibility ratio firms. These results are consistent throughout the period studied. The observed results are similar to those obtained by previous research [19,20,23]; our evidence suggests that firms belonging to the High customer-oriented responsibility ratio group are able to reap economies of scale in the intermediation process [19,20]. Thus, structural variables such as size and number of employees could influence the quality of advisory services [10,11,62,63,64,65,66,67,68,69,70,74,75,76,77,78,79,80,81]. The structural variable size is the main distinction between brokers and other agents but also the range and depth of services provided; generally, brokers tend to service larger and more complex business insurance needs [23,24,25,27].
On the other hand, the results obtained are in line with other studies [17,18,19,20,44] that suggest that insurance brokers pursue a financial return by enduring a higher administrative cost in premium collection management of the different policies. This behaviour would be more common in large companies. In many cases, transferring the collection of receipts to the insurance company would expedite the processing in the event of the loss and could save brokers administrative resources. However, in the management of big risks implied by the collection of large premiums, the transfer of confidential data such as bank details to the insurance company would be a cost to the broker that is difficult to quantify. This situation is reversed for small companies that could be interested in transferring the management of premium collection to the insurance company in order not to have to assume costs of management such as personnel and facilities that would add to responsibilities such as the coverage of the claim if payment of the premium is not made effective.
Therefore, we observe that, for Low customer-oriented responsibility ratio firms, brokers have a positive customer-oriented behaviour in the management of their clients’ policies, which has a positive effect on society [82,83,84,85]. This issue is very relevant, because not deferring the payment of premiums leads to insurance companies paying claims to the client more quickly, which would favour a better economic coverage of the risk and would have a positive effect that would reach society. As a result, this positive behaviour could be perceived as a customer-oriented service strongly correlated with sustainable insurance brokerage [26,82,83,84]. On the other hand, the large size and high number of employees of brokers with High customer-oriented responsibility could positively influence the quality of advisory services [19,20,23,24,25].
In this way, the service quality has been recognized as an important factor that leads to the differentiation of services and products and the achievement of competitive advantages [26,36,37,46]; in particular, it is closely related to firm profitability and performance in the service sector [7,10,53,54].
Finally, the broker must consolidate the relationship with the client by monitoring production, billing, collection and claim. The global nature of the management process allows for a better service to the clients, thus generating an important added value for the broker that turns into customer-oriented service and society-oriented behaviour [26,50,55,56,84,85].
Table 6 and Table 7 display the results obtained from the validation of hypothesis 3. Table 6 shows the median intermediate premiums, commissions and fees corresponding to the total production of the intermediaries under analysis. The results obtained indicate that the intermediate business is greater in accident and multi-risk home insurances in the bancassurance distribution channel. In the case of insurance brokers, they manage a higher volume of intermediate premiums in car, multi-risk industrial and general liability insurance. These results indicate that bancassurance intermediates a greater volume of premiums related to the traditional banking business such as mortgage loans for small and medium enterprises and self-employed workers [61,77,78,79,80].
When we consider remuneration, the bancassurance distribution channel obtains greater profitability in commissions in health, accident, transport, multi-risk industrial and general liability insurances. Only in car insurance, travel, multi-risk home and industrial insurance do brokers perceive a significantly greater remuneration from commissions and fees than the bancassurance.
In the insurance industry, when a financial professional has to sell two different products to the customer, he or she tends to sell the one that provides him or her with the highest commission. In particular, commissions can promote no positive behaviour, which it is morally unacceptable [56,57,58,59,60,61]. In this way, the results obtained from the analysis of the influence of non-objective advisory service quality on the sustainability of the banking industry suggests that bancassurance does not provide neutral advice to its clients; rather, it favours the insurance that is linked to its traditional business. In addition, it passes on a higher percentage of commissions compared to those applied by insurance brokers. Therefore, this behaviour is not related to sustainability objectives. In order to be sustainable, service providers must satisfy consumers´ needs lest they become redundant and economically irrelevant [82,83,84]. Furthermore, empirical studies indicate that quality and price significantly influence customer satisfaction in service sectors, including financial services. Customer satisfaction plays an important role in business strategy and acts as a key factor in the sustainable development of the companies [26,38,84,85].
Finally, the results obtained for this selected portfolio of insurance of the branch of non-life show that, although bancassurance manages greater numbers of intermediate premiums of total turnover, its situation is similar to that of brokers regarding the business of new production. At global level, brokers’ perceived commissions exceed those perceived by bancassurance. Thus, compared to the insurance broker, bancassurance perceives more commissions in the new production business, reaching 36.69% (see Table 7), than for the total turnover, where they reach 28.78% (see Table 6). The broker could work as a referee by mediating new home insurance when the mortgage is contracted, advising that the insurance should not be linked to the funding received for the purchase of the house.
These results would be in line with those presented other scholars [17,18,30,32], for all the branches of non-life. On the other hand, from the insurance broker’s perspective, these results do not suggest that commission-dependent sales agents will recommend more complicated but potentially unsuitable products to customers who are not wary of risks [57,58,59,60]. The results obtained are in line with the previous evidence found where the advisory transactions are associated with greater profits than trades executed independently of the same client. The bank’s structured products are more profitable for the bank and profits increase with the size of the operation. Advisors recommend exactly those transactions. In addition, advised clients achieve significantly worse net return than independent clients [57,60,61]. Bankers are generally risk averse; they seek to develop a long-term relationship with the client; they are rewarded on the basis of seniority and qualifications (though performance related payments are gradually being brought in—often as part of the bancassurance change process). Insurance sellers are concerned to maximize their commission-based earnings; turnover amongst this group is very high, and there is therefore traditionally very little loyalty to the company (and little expectation of "career progression") or expectation of a long-term relationship with the client [29,33].
The results obtained for the analysis of the behaviour of the insurance broker in finance suggest that it could be necessary to ensure that the private sector´s own incentives do not compromise the quality of financial decisions that private individuals make [47,56,57,58].
The insurance broker works in the world of finance, which is regulated by a legal framework, and does not necessarily show a positive behaviour. Therefore, the lack of positive behaviour evinced by these actions has a negative impact on society [42]. These issues should be considered and faced by consumers of finance products. Thus, this study suggests that insurance brokers could show this customer orientation, which has a positive influence on society when they provide an intermediation service and objective advice to their clients in many cases in a more careful, skilful and diligent way than other suppliers. Insurance brokers may provide better objective advisory service of higher quality and better suited to the needs of their clients [19,20,23,24,25,85]. Overall, the best way of building client loyalty is by being able to offer a continuum of financial products and services covering all phases in the client’s life [30], specifically, in developed markets such as the Spanish insurance market. Great competition among agents might improve advice [24,25,37,57,76].
In summary, the results fail to support Hypothesis 1 for brokers in the High customer-oriented responsibility ratio (worst customer-oriented behaviour). They have a worse behaviour in the management of the premium collections of their clients than companies in the Low customer-oriented responsibility ratio (best customer-oriented behaviour). By contrast, larger brokers can provide better and more objective advice than financial institutions. This would improve sustainable intermediation in the management of policy risk of larger brokers. Therefore, hypothesis 2 is accepted, but no support is found for hypothesis 3, which goes against the results obtained by other scholars [4,38]. The evidence obtained suggests that larger brokers can provide greater risk coverage and better advisory service but have a worse behaviour in the management of the policies. Thus, this behaviour negatively affects the risk covered. On the other hand, smaller brokers show a positive behaviour towards the client with a limited service in risk coverage and advice. However, they present a positive behaviour that favours the hedged risk and benefits society by not delaying the payment of the premiums to the insurance company. Therefore, their behaviour would favour sustainable insurance advice to its clients. In this line, we could suggest that socially responsible investing can indeed benefit investors financially. This situation allows an investor to choose investments based on social and personal criteria [82,83,84,85].

5.2. Multivariant Analysis Results

Complementary to the univariate analysis performed in Section 5.1., in this section a multivariate analysis is performed. With this finality, this part of the study highlights the results achieved by applying the specific analysis techniques of panel data. Thus, Table 8 provides the descriptive statistics of the variables. The number of firm-year observations range from 1894 observations of the CUS and SALES variables to 1962 for ROE. Regarding performance proxies, ROS shows the highest variability with a standard deviation of 18.98% and ROA the lowest variability with a standard deviation of 2.57%. The LEV variable indicates that, on average, firms show a low-level leverage of about 38%. On the other hand, the LIQ and CUS variable presents a high standard deviation.
Prior to design panel data models, it is necessary to verify the problem of multicollinearity between independent variables. Table 9 presents the correlations between the variables. In this respect, the matrix of Pearson correlation coefficients is computed. A value of the Pearson coefficient higher than 0.8 indicates a strong correlation, which can be identified between leverage, liquidity, size, sales and customer ratio. Therefore, correlations greater than 0.8 can cause multicollinearity between the variables [81]. As the issue of multicollinearity may affect the results of the models, the liquidity variable is discarded.
Table 10 shows the results of the fixed effects model. These results exhibit the existence of a negative and non-significant relationship between the operating performance measures employed and the variable representing the customer-oriented responsibility regardless the operating performance proxy employed. Results for size and sales are mixed, as we find that the statistical significance depends on the proxy employed. Consistent with previous literature, the relationship between operating performance and firm size is positive when it is significant. It is worthy to note that this relationship seems to be more evident when operating performance is measured through ROA and ROS.
When we employ sales as the control variable (see models 2, 4 and 6), the results are more robust than before. Moreover, we find the relationship between operating performance and the customer-oriented responsibility it is not significant. For the variable leverage show significant coefficients and positive in the model 4 and 6. As in the case of controlling with Size, we find a positive and significant relationship between ROA and Sales in the model 2. The situation reverts, in the model 6, for ROS.
Table 11 illustrates the results of the random effects model. These results exhibit the existence of a negative and no significant relationship between the operating performance measures employed and the variable representing the customer-oriented responsibility regardless the operating performance proxy employed. Results for size and sales are mixed, as we find that the statistical significance depends on the proxy employed. Consistent with previous literature, the relationship between operating performance and firm size is positive when it is significant. It is worthy to note that this relationship seems to be more evident when operating performance is measured through the ROA and ROS.
When we employ sales as the control variable (see models 2, 4 y 6), the results are not more robust than before. On the one hand, we find that the relationship between operating performance and the customer-oriented responsibility is not significant. The variable leverage shows significant coefficients either negatives or positives (see model 2, 3 and 4). As in the case of controlling with size, we find a positive (models 2 and 4) and negative (model 6) significant relationship between ROA, ROE and ROS and Sales. With all this, results for ROE and ROS are mixed.
Despite the fact that the results of the fixed effects model are better than those of the random effects model, since both models are valid, the Hausman test will be performed. Thus, after being sure that there are no multicollinearity problems, the Hausman test should be performed, to know if the panel should be of Fixed or Random effects. We have performed the Hausman test, and we find that fixed effects must be used. Given that there are autocorrelation problems and heteroscedasticity re-run the fixed effect regressions through methodology of Prais–Winsten. In this way, a more robust estimation is obtained.
The Prais–Winsten regressions can be used in models where the number of groups is greater than the period of time considered, regardless of whether the panels are strongly balanced. Thus, it allows solving the problem of heteroscedasticity and autocorrelation, at the same time. Table 12 shows the Prais–Winsten regression Fixed effects model. Table 12 exhibits the existence of a negative and significant relationship between the operating performance measures employed and the variable representing the customer-oriented responsibility regardless the operating performance proxy employed for the model 1. Results for models employed in the study are different, as we find that the statistical significance depends on the proxy employed. Consistent with previous literature, the relationship between operating performance and firm size is positive when it is significant. It is worthy to note that this relationship seems to be more evident when operating performance is measured through the ROA.
When we employ sales as the control variable (see models 2, 4 and 6) the results are not as robust as before. On the one hand, we find the relationship between operating performance and the customer-oriented responsibility is not significant in the three models analysed. In any case, these discrepancies appear when we study the leverage variable between the models 2 and 4. As in the case of controlling with size, we find a positive and significant relationship between ROA, ROE and Sales for model objected of the study. Moreover, results for ROE and ROS are mixed except for the models 4 and 5.
The results obtained applying the specific analysis techniques of the panel data are consistent with the previous empirical evidence that relationship between operating performance and firm size is positive when it is significant and more evident when operating performance is measured through the ROA [62,63,64,65,66,67,68,69,70].

6. Discussion, Implications and Limitations

This paper examines how society is affected by the relationship between the customer-oriented behaviour of brokers in the insurance industry and the quality of service, in the Spanish market. In this context, we propose to study proxy the (non) customer-oriented behaviour of insurance brokers through a customer-oriented responsibility ratio computed as financial income divided by sales. In this way, a high value for the customer-oriented responsibility ratio means that the insurance broker delays payment of the collected premiums to the insurance company. This practice leads to the broker assuming some risk derived from the possibility of an incident taking place before the premium has been forwarded to the insurance company, since the brokerage firm would suffer financial distress.
In this paper, we observe that large companies have the worst customer-oriented behaviour. Therefore, our evidence supports the notion that this negative customer-oriented behaviour could be due to the need to compensate for the management costs of the collection of insurance premiums. Specifically, we tested the hypothesis that the broker has a customer orientation in the management of the policies of his or her clients that has a positive effect on society. An important implication of our results is that smaller insurance brokers present a better behaviour towards society in the management of policies. However, this positive behaviour that affects society has a lower impact on sustainability because small brokers perform a management of policies with lower risk and, therefore, lower profitability. On the other hand, we observe that the structural variable size positively influences the quality of the service provided by the insurance broker to his or her clients. Besides, our study reveals the importance of the quality of the service should be emphasised in order to sustainably develop that which has an impact on society [26,46,47,55,66,75,77,86]. Therefore, larger companies could better serve society. As a consequence, these results suggest that these brokers could exhibit better sustainable behaviour while serving businesses that assume greater risk coverage. One interpretation of this result is that they would promote a better risk-prevention performance of the business insured. In this case, there may be a sustainable insurance brokerage [26,79,82,84].
This research complements these results with the analysis of the sustainability experienced by the banking industry, which is motivated by the quality of the advisory service of bancassurance towards its clients. Therefore, our evidence does not support objective advice of bancassurance in the Spanish market. This evidence reveals that the sale of products of the non-life sector requires certain skills that differ from those necessary for the sale of savings products [29,32,33,78,79]. In addition, when we analysed how the quality of the non-objective advisory service favours the sustainability of the banking industry, we found that bancassurance does not satisfy consumers´ needs so that they will become redundant and economically irrelevant [32,33,35]. In this way, the non-objective nature of the advisory service significantly affects its quality and price. Thus, this situation represents a non-positive behaviour towards clients and their needs. The poor advice reflects both the commission incentives and agents’ limited product knowledge [57]. These findings suggest that financial advisors tend to put their employer’s interest rather than their clients’ interest first [61]. In this case, customer need satisfaction does not play an important role in business strategy nor in the sustainable development of the companies [36,37].
Finally, our results support that there is a statistically significant relationship between operating performance and some firm characteristics (such as size) and the brokerage firm’s customer-oriented behaviour. Additionally, the results suggest that objective advice is more likely to be provided by the broker than by bancassurance in the Spanish market. These results coincide in that the customer orientation service of Spanish insurance brokers is developed in a sustainable way and has a positive impact on society [26,37,84,85,86].
The limitations of this study refer to the data available in the database used: the Iberian Balance Analysis System (SABI). Future research could focus on extending the horizon of study of the sample, quality of the service advice of others insurance agents and the sustainable behaviour of the insurance distribution channel according to the degree of risk coverage.

Author Contributions

Conceptualization, M.A.L.G.; investigation, M.A.L.G.; literature review, M.A.L.G.; data curation, M.A.L.G.; methodology, M.A.L.G.; writing—original draft preparation, M.A.L.G.; writing—review and editing, M.A.L.G.; supervision, M.A.L.G., project administration M.A.L.G. All authors have read and agreed to the published version of the manuscript.

Funding

This work was supported by the Universidad Católica de Valencia San Vicente Mártir under Grant [number 2019-808-001].

Acknowledgments

The author thanks José E. Farinós (University of Valencia) for his helpful comments. In addition, the author wants to express his appreciation to Professor Andrea Burgos (Catholic University of Valencia) for the review of this work carried out.

Conflicts of Interest

The authors declare no conflict of interest.

Abbreviations

Euribor:European Interbank Offered Rate
SABI:Iberian Balance Analysis System
EC:European Parliament and of the Council
H:Hypotheses
GDP:Gross Domestic Product
ROA:Return on assets
ROE:Return on equity
ROS:Return on sales
SALEFF:Sales efficiency
INEFF:Income efficiency
EMPL:Total employment
TDTA:Total debt to total assets
CACL:Current assets to current liabilities
EBIT:Earnings Before Interest and Taxes
GDP:Gross Domestic Product

References

  1. Marano, P. Navigating InsurTech: The digital intermediaries of insurance products and customer protection in the EU. Maastricht J. Eur. Comp. Law 2019, 26, 294–315. [Google Scholar] [CrossRef]
  2. Euribor-Rates. EU. Available online: http://es.euribor-rates.eu/tipos-de-interes-Euribor-por-ano.asp (accessed on 25 March 2019).
  3. Pani, L.K.; Swain, S. Bancassurance and Indian banks. Int. J. Res. Dev. A Manag. Rev. 2013, 2, 11–19. [Google Scholar]
  4. Alavudeen, R.; KD, S.R. Growing Role of Bancassurance in Banking Sector. Bonfring Int. J. Ind. Eng. Manag. Sci. 2015, 5, 10–16. [Google Scholar] [CrossRef] [Green Version]
  5. Jan, A.; Baber, H. Bancassurance-Growth Guaranteed In India. Econ. Financ. Lett. 2014, 1, 104–113. [Google Scholar] [CrossRef] [Green Version]
  6. Yıldırım, İ. Insurance Distribution Channels in Turkey: Effectiveness of Bancassurance. Int. J. Trends Econ. Manag. Technol. 2014, 3, 7–10. [Google Scholar]
  7. Boadi, E.K.; Antwi, S.; Lartey, V.C. Determinants of profitability of insurance firms in Ghana. Int. J. Bus. Soc. Res. 2013, 3, 43–50. [Google Scholar]
  8. Kabajeh, M.A.M.; Al Nuaimat, S.M.A.; Dahmash, F.N. The relationship between the ROA, ROE and ROI ratios with Jordanian insurance public companies market share prices. Int. J. Hum. Soc. Sci. 2012, 2, 115–120. [Google Scholar]
  9. Anuonye, N.B. Effect of intellectual capital on return on assets of insurance firms in Nigeria. Glob. J. Manag. Bus. Res. 2016, 16, 2249–4588. [Google Scholar]
  10. Greene, W.H.; Segal, D. Profitability and efficiency in the US life insurance industry. J. Product. Anal. 2004, 21, 229–247. [Google Scholar] [CrossRef]
  11. Malik, H. Determinants of insurance companies’ profitability: An analysis of insurance sector of Pakistan. Acad. Res. Int. 2011, 1, 315. [Google Scholar]
  12. Chen, M.S.; Chang, P.L. Distribution channel strategy and efficiency performance of the life insurance industry in Taiwan. J. Financ. Serv. Mark. 2010, 15, 62–75. [Google Scholar] [CrossRef]
  13. Pointer, L.V.; Khoi, P.D. Predictors of Return on Assets and Return on Equity for Banking and Insurance Companies on Vietnam Stock Exchange. Entrep. Bus. Econ. Rev. 2019, 7, 185–198. [Google Scholar] [CrossRef]
  14. Barber, B.M.; Lyon, J.D. Detecting abnormal operating performance: The empirical power and specification of test statistics. J. Financ. Econ. 1996, 41, 359–399. [Google Scholar] [CrossRef]
  15. Boubakri, N.; Cosset, J.C. The financial and operating performance of newly privatized firms: Evidence from developing countries. J. Financ. 1998, 53, 1081–1110. [Google Scholar] [CrossRef]
  16. Alonso, R. La nueva Regulación de los mediadores de seguros. ICADE Rev. Cuatrimest. Fac. Derecho Cienc. Económicas Empresariales 2007, 71, 35–57. [Google Scholar]
  17. Latorre, M.A. Shedding the light on insurance brokers’ remuneration: The role of the fees. Opción 2015, 31, 654–676. [Google Scholar]
  18. Latorre, M.A.; Farinos, J.E. Ethical behaviour and operating performance of insurance broker firms. J. Int. Bus. Econ. 2015, 3, 44–51. [Google Scholar] [CrossRef]
  19. Eckardt, M. Agent and broker intermediaries in insurance markets-An empirical analysis of market outcomes. Thünen Ser. Appl. Econ. Theory 2002, 4, 1–32. [Google Scholar] [CrossRef] [Green Version]
  20. Eckardt, M. Insurance Intermediation: An Economic Analysis of the Information Services Market; Springer: Heilderber, Germany, 2007. [Google Scholar]
  21. Kim, Y.; Mo, J. Pricing of Digital Video Supply Chain: Free versus Paid Service on the Direct Distribution Channel. Sustainability 2019, 11, 46. [Google Scholar] [CrossRef] [Green Version]
  22. Traub, W. Markfunktion und Dienstleistung des Versicherungsmaklers. In Zeitschriftfür die Gesamte Versicherungswirtschaft; Springer-Verlag GmbH: Berlin, Germany, 1994; pp. 369–397. [Google Scholar]
  23. Rose, F. The economics, concept, and design of information intermediaries. Inf. Age Econ. 1999, 163–207. [Google Scholar]
  24. Cummins, J.; Doherty, N. The economics of insurance intermediaries. J. Risk Insur. 2006, 73, 359–396. [Google Scholar] [CrossRef]
  25. Doman, A.; Duchen, T.; Martin, M. Brokers vs. insurers. Mckinsey Q. 1999, 3, 26–35. [Google Scholar]
  26. Tseng, L.M.; Kang, Y.M. The influences of sales compensations, management stringency and ethical evaluations on product recommendations made by insurance brokers. J. Financ. Regul. Compliance 2014, 22, 26–42. [Google Scholar] [CrossRef]
  27. Nguyen, H.T.; Nguyen, H.; Nguyen, N.D.; Phan, A.C. Determinants of customer satisfaction and loyalty in Vietnamese life-insurance setting. Sustainability 2018, 10, 1151. [Google Scholar] [CrossRef] [Green Version]
  28. Owusu-Sekyere, F.; Kotey, R.A. Profitability of insurance brokerage firms in Ghana. Acad. J. Econ. Stud. 2019, 5, 179–192. [Google Scholar]
  29. Law 26/2006 of July 17, Insurance Mediation and Private Reinsurance. Available online: www.dgsfp.mineco.es (accessed on 14 March 2020).
  30. Morgan, G.; Sturdy, A.; Daniel, J.P.; Knights, D. Bancassurance in Britain and France: Innovating strategies in the financial services. Geneva Pap. Risk Insur. Issues Pract. 1994, 19, 178–195. [Google Scholar] [CrossRef] [Green Version]
  31. Benoist, G. Banc assurance: The new challenges. Geneva Pap. Risk Insur. Issues Pract. 2002, 27, 295–303. [Google Scholar] [CrossRef]
  32. Teunissen, M. Bancassurance: Tapping into the banking strength. Geneva Pap. Risk Insur. Issues Pract. 2008, 33, 408–417. [Google Scholar] [CrossRef] [Green Version]
  33. Gonulal, S.O.; Goulder, N.; Lester, R.R. Bancassurance—A Valuable Tool for Developing Insurance in Emerging Markets; Working Paper: 6196; World Bank Policy Research; The World Bank: Washington, DC, USA, 2012. [Google Scholar]
  34. Chen, T.J. Marketing channel, corporate reputation, and profitability of life insurers: Evidence of bancassurance in Taiwan. Geneva Pap. Risk Insur. Issues Pract. 2019, 44, 679–701. [Google Scholar] [CrossRef]
  35. Arguedas, S.B. Banca-seguros: Nueva alternativa de intermediación en la región centroamericana con sus implicaciones legales. Rev. Ibero-Latinoam. Seguros 2008, 17, 23–41. [Google Scholar]
  36. Belz, F.M.; Peattie, K. Sustainability Marketing: A Global Perspective, 2nd ed.; Wiley & Sons Ltd.: Chichester, UK, 2012. [Google Scholar]
  37. Brady, M.; Knight, G.; Cronin, J.; Tomas, G.; Hult, G.; Keillor, B. Removing the contextual lens: A multinational, multi-setting comparison of service evaluation models. J. Retail. 2005, 81, 215–230. [Google Scholar] [CrossRef]
  38. Park, E.; Lee, S.; Kwon, S.J.; delPobil, A.P. Determinants of Behavioral Intentions to use South Korean Airline Services: Effects of Service Quality and Corporate Social Responsibility. Sustainability 2015, 7, 12106–12121. [Google Scholar] [CrossRef] [Green Version]
  39. Game, A.M.; Gregoriou, A. Do brokers act in the best interests of their clients? New evidence from electronic trading systems. Bus. Ethics Eur. Rev. 2016, 25, 185–197. [Google Scholar] [CrossRef] [Green Version]
  40. Ronald, D. The Etichs of Reward Sytems in the Financial Services Industry. Bus. Soc. Rev. 2002, 104, 34–41. [Google Scholar]
  41. Kurland, N.B. Sales agents and clients: Ethics, incentives, and a modified theory of planned behavior. Hum. Rel. 1996, 49, 51–74. [Google Scholar] [CrossRef]
  42. Kaptein, M. The appearance standard: Criteria and remedies for when a mere appearance of unethical behaviour is morally unacceptable. Bus. Ethics Eur. Rev. 2019, 28, 99–111. [Google Scholar] [CrossRef] [Green Version]
  43. Boatright, J.R. Ethics in Finance; John Wiley & Sons: West Sussex, UK, 2013. [Google Scholar]
  44. European Parliament and the Council. Directive 2002/92/EC on Insurance Mediation. Brussels (Belgium). 2002. Available online: www.ec.europa.eu (accessed on 14 March 2020).
  45. Latorre, M.A. La problemática de la gestión de cobro en una correduría de seguros. In Ebook Contenidos Innovadores Dentro de las Ciencias Naturales; Aplicadas y de la Salud. Libro digital; McGraw-Hill Interamericana de España S.: Madrid, España, 2015; Chapter 6; pp. 75–86. [Google Scholar]
  46. Ennew, C.T.; Reed, G.V.; Binks, M.R. Importance-performance analysis and the measurement of service quality. Eur. J. Mark. 1993, 27, 59–70. [Google Scholar] [CrossRef]
  47. Zeithaml, V.A.; Berry, L.L.; Parasuraman, A. The behavioral consequences of service quality. J. Mark. 1996, 60, 31–46. [Google Scholar] [CrossRef]
  48. Heskett, J.L.; Jones, T.O.; Loveman, G.W.; Sasser, W.E.; Schlesinger, L.A. Putting the service profit chain to work. Harv. Bus. Rev. 1994, 72, 105–111. [Google Scholar]
  49. Zikmund, W.G.; Babin, B.J.; Carr, J.C.; Griffin, M. Business Research Methods, 8th ed.; South Western Cengage Learning: Mason, OI, USA, 2010. [Google Scholar]
  50. Asogwa, J.O.; Onyekwelu, U.L. Relationship between Fundamental Accounting Ratios and Firms’market Valuation in Brewery Firms in Nigeria. Adv. J. Manag. Account. Financ. 2019, 4, 7. [Google Scholar]
  51. David, A. Freedman. In Statistical Models: Theory and Practice; Cambridge University Press: Cambridge, UK, 2005. [Google Scholar]
  52. Simon, L.J. Size, Strength and Profit. In Proceedings of the Casualty Actuarial Society Casualty Actuarial Society, Arlington, Texas, 22–23 May 1962; pp. 41–48. [Google Scholar]
  53. Lee, H.H.; Lee, C.Y. An analysis of reinsurance and firm performance: Evidence from the Taiwan property-liability insurance industry. Geneva Pap. Risk Insur. Issues Pract. 2012, 37, 467–484. [Google Scholar] [CrossRef]
  54. Liebenberg, A.P.; Sommer, D.W. Effects of corporate diversification: Evidence from the property–liability insurance industry. J. Risk Insur. 2008, 75, 893–919. [Google Scholar] [CrossRef]
  55. Sandhu, H.S.; Neetu, B. Customers’ Perception towards Service Quality of Life Insurance Corporation of India: A Factor Analytics Approach. Int. J. Bus. Soc. Sci. 2011, 2, 219–231. [Google Scholar]
  56. Gera, R. Modelling the service antecedents of favourable and unfavourable behaviour intentions in life insurance services in the India: An SEM study. Int. J. Qual. Serv. Sci. 2011, 3, 225–242. [Google Scholar] [CrossRef]
  57. Anagol, S.; Cole, S.; Sarkar, S. Understanding the advice of commissions-motivated agents: Evidence from the Indian life insurance market. Rev. Econ. Stat. 2017, 99, 1–15. [Google Scholar] [CrossRef] [Green Version]
  58. Inderst, R.; Ottaviani, M. Competition through commissions and kickbacks. Am. Econ. Rev. 2012, 102, 780–809. [Google Scholar] [CrossRef]
  59. Gabaix, X.; Laibson, D. Shrouded attributes, consumer myopia, and information suppression in competitive markets. Q. J. Econ. 2006, 121, 505–540. [Google Scholar] [CrossRef]
  60. Bolton, P.; Freixas, X.; Shapiro, J. Conflicts of interest, information provision, and competition in the financial services industry. J. Financ. Econ. 2007, 85, 297–330. [Google Scholar] [CrossRef] [Green Version]
  61. Hoechle, D.; Ruenzi, S.; Schaub, N.; Schmid, M. Financial advice and bank profits. Rev. Financ. Stud. 2018, 31, 4447–4492. [Google Scholar] [CrossRef]
  62. Ahmad, G.N.; Prasetyo, R.P. Profitability Analysis of Non-life Insurance: Case in Indonesia Stock Exchange. KnE Soc. Sci. 2018, 2018, 335–350. [Google Scholar] [CrossRef]
  63. Egbunike, C.F.; Okerekeoti, C.U. Macroeconomic factors, firm characteristics and financial performance. Asian J. Account. Res. 2018, 3, 142–168. [Google Scholar] [CrossRef] [Green Version]
  64. Burca, A.M.; Batrinca, G. The determinants of financial performance in the Romanian insurance market. Int. J. Acad. Res. Account. Financ. Manag. Sci. 2014, 4, 299–308. [Google Scholar] [CrossRef] [Green Version]
  65. Baltagi, B. Econometric Analysis of Panel Data, 3rd ed.; John Wiley & Sons: West Sussex, UK, 2008. [Google Scholar]
  66. Alipour, M.; Ghanbari, M.; Jamshidinavid, B.; Taherabadi, A. Does board independence moderate the relationship between environmental disclosure quality and performance? Evidence from static and dynamic panel data. Corp. Gov. Int. J. Bus. Soc. 2019, 19, 580–610. [Google Scholar] [CrossRef]
  67. Charumathi, B. On the determinants of profitability of Indian life insurers—An empirical study. In Proceedings of the World Congress on Engineering, London, UK, 4–6 July 2012; Volume 1, pp. 4–6. [Google Scholar]
  68. Mehari, D.; Aemiro, T. Firm Specific Factors that Determine Insurance Companies’ Performance in Ethiopia. Eur. Sci. J. 2013, 9. [Google Scholar] [CrossRef]
  69. Tukur, G.; Balkisu, A.A. Corporate board diversity and financial performance of insurance companies in Nigeria: An application of panel data approach. Asian Econ. Financ. Rewiew 2014, 4, 257–277. [Google Scholar]
  70. Batool, A.; Sahi, C.A. Determinants of Financial Performance of Insurance Companies of USA and UK during Global Financial Crisis (2007–2016). Int. J. Account. Res. 2019, 7, 194. [Google Scholar] [CrossRef] [Green Version]
  71. Kobayashi, M. Comparison of efficiencies of several estimators for linear regressions with autocorrelated errors. J. Am. Stat. Assoc. 1985, 80, 951–953. [Google Scholar] [CrossRef]
  72. King, M.L.; Giles, D.E. (Eds.) Specification Analysis in the Linear Model, 1st ed.; Routledge: London, UK, 2018. [Google Scholar]
  73. Gujarati, D. Basic Econometrics; McGraw-Hill: New York, NY, USA, 1995. [Google Scholar]
  74. Dumm, R.E.; Hoyt, R.E. Insurance distribution channels: Markets in transition. J. Insur. Regul. 2003, 22, 27–48. [Google Scholar]
  75. Beloucif, A.; Donaldson, B.; Kazanci, U. Insurance broker–client relationships: An assessment of quality and duration. J. Financ. Serv. Mark. 2004, 8, 327–342. [Google Scholar] [CrossRef]
  76. Trigo-Gamarra, L. Reasons for the coexistence of different distribution channels: An empirical test for the German insurance market. Geneva Pap. Risk Insur. Issues Pract. 2008, 33, 389–407. [Google Scholar] [CrossRef]
  77. Lymperopoulos, C.; Chaniotakis, I.E.; Soureli, M. The importance of service quality in bank selection for mortgage loans. Manag. Serv. Qual. 2006, 16, 365–379. [Google Scholar] [CrossRef]
  78. Hoschka, T.C. Bancassurance in Europe; Springer: London, UK, 2016. [Google Scholar]
  79. Das, S.K. Social and innovative banking strategies for sustainable banking in India. Int. J. Econ. Financ. Manag. 2013, 2, 91183817. [Google Scholar]
  80. Kamath, K.V.; Kohli, S.S.; Shenoy, P.S.; Kumar, R.; Nayak, R.M.; Kuppuswamy, P.T.; Ravichandran, N. Indian banking sector: Challenges and opportunities. Vikalpa 2003, 28, 83–100. [Google Scholar] [CrossRef] [Green Version]
  81. Fayed, A.M.; Dubey, S. An empirical study of impact of EVA momentum on the shareholders’ value creation as compared to traditional financial performance measures-with special reference to the UAE. Int. J. Econ. Financ. 2016, 8, 23–38. [Google Scholar] [CrossRef] [Green Version]
  82. Anderson, D.R.; Anderson, K.E. Sustainability risk management. Risk Manag. Insur. Rev. 2009, 12, 25. [Google Scholar] [CrossRef]
  83. King, G.; Smallman, C.; Van Weegen, M. Management strategy in UK insurance broking. Manag. Decis. 1997, 35, 58–67. [Google Scholar] [CrossRef]
  84. Froestad, J.; Gjuvsland, K.; Herbstein, T.; Shearing, C. Insurance as a regulatory mechanism towards sustainable companies. In Proceedings of the Towards Sustainable Companies Conference UiO, Oslo, Norway, 29–30 August 2011. [Google Scholar]
  85. Nebo, G.N.; Okolo, V.O. Effects of the strategies for customer satisfaction on the performance of insurance firms in Enugu Metropolis. J. Bus. Manag. 2016, 18, 78–90. [Google Scholar]
  86. Fernández, E.; Iglesias-Antelo, S.; López-López, V.; Rodríguez-Rey, M.; Fernandez-Jardon, C.M. Firm and industry effects on small, medium-sized and large firms’ performance. BRQ Bus. Res. Q. 2019, 22, 25–35. [Google Scholar] [CrossRef]
Figure 1. The customer-oriented process of intermediation: author proposal based on the literature review.
Sustainability 12 02970 g001
Table 1. Comparison of insurance mediators in the Spanish market from 2013 to 2017.
Insurance Mediators Spanish Markets20132017Difference%
Insurance Brokers303832722347.70%
Insurance Agents86,04276,044−9998−11.62%
Bancassurance operators5349−4−8.16%
Total Insurance Mediators89,13379,365−9768−12.08%
Source: own elaboration.
Table 2. Sample selection process.
Observations
Initial Sample500
Companies whose information on financial income and sales is not available in the Sabi database (103)
Final Sample397
Source: own elaboration.
Table 3. Summary statistics for the full sample of insurance brokers and classified by Low and High customer-oriented responsibility ratio.
Year20132014201520162017
Panel A: Full Sample
Sample size397397397397397
No. of employees20.3420.9621.323.0125.27
Total assets (thousand €)1704.891801.751872.172024.312091.39
Sales (thousand €)1372.421552.491703.071885.492035.51
Financial income (thousand €)30.5427.0620.3420.3145.67
Customer-oriented responsibility ratio (%)2.231.741.191.082.24
Panel B: Low customer-oriented responsibility ratio
Sample size119119119119119
No. of employees9.3311.8312.8213.3415.47
Total assets (thousand €)300.80348.43409.78457.10520.26
Sales (thousand €)210.27307.49412.37462.61506.80
Financial income (thousand €)10.315.440.460.2300.00
Customer-oriented responsibility ratio (%)4.901.770.110.050.00
Panel C: High customer-oriented responsibility ratio
Sample size119119119119119
No. of employees20.5720.7521.2521.5522.14
Total assets (thousand €)700.25713.18694.95764.36844.60
Sales (thousand €)415.13372.13363.65372.13415.13
Financial income (thousand €)14.6017.8216.0917.8944.18
Customer-oriented responsibility ratio (%)3.944.814.425.1210.64
Notes: (i) The Customer-oriented responsibility ratio is computed as financial income divided by sales. (ii) Low customer-oriented responsibility ratio group comprises 30% of the firms in the sample with the lowest customer-oriented responsibility ratio. (iii) High customer-oriented responsibility ratio group comprises 30% of the firms in the sample with the highest customer-oriented responsibility ratio. Source: own elaboration.
Table 4. Summary Economic characteristics, measurement and proxies examined for insurance brokers.
ProxiesMeasurementCharacteristics
Return on assets (ROA)= EBIT/Average total assetsProfitability
Return on equity (ROE)= EBIT /Average total equityProfitability
Return on sales (ROS)= EBIT/SalesProfitability
Sales efficiency (SALEFF)= Real sales/Total employmentOperating efficiency
Size (SIZE)= Total AssetsSize
Income efficiency (INEFF)= EBIT/ Total employmentEmployment
Total employment (EMPL)= Total number of employeesEmployment
Total debt to total assets (TDTA)= Total debt/Total assetsLeverage
Current assets to current liabilities (CACL)= Current assets/current liabilitiesLiquidity
Source: own elaboration.
Table 5. Median values and differences in medians for proxy variables of operating performance of Low and High customer-oriented responsibility ratio groups.
20132014201520162017
Panel A:Low customer-oriented responsibility ratio group
ROA0.010.010.010.010.00
ROE0.010.030.040.040.04
ROS0.110.110.120.120.15
SALEFF79.6580.3995.2490.92102.60
INEFF9.919.2310.9613.6814.51
EMPL4.005.006.005.006.00
TDTA0.040.540.600.440.57
CACL1.251.281.481.501.59
Panel B:High customer-oriented responsibility ratio group
ROA0.020.020.020.020.02
ROE0.030.030.030.030.03
ROS0.180.170.170.220.19
SALEFF 100.97101.13110.13111.49108.53
INEFF16.9617.9016.7218.1419.18
EMPL7.006.507.006.007.00
TDTA0.020.270.250.210.21
CACL2.462.573.133.303.61
Panel C:(High–Low) customer-oriented responsibility ratio groups
ROAa 0.01b 0.010.010.010.02
ROEb 0.020.00−0.01−0.01c −0.01
ROSb 0.07a 0.060.05b 0.100.04
SALEFFc 21.32b 20.7414.8920.575.93
INEFFc 7.05a 8.67b 5.764.46c 4.67
EMPLa 3.00c 1.501.001.001.00
TDTAb −0.02a −0.27a −0.35a −0.23a −0.36
CACLa 1.21a 1.29a 1.65a 1.80a 2.02
Notes: (i) See Table 2 for proxy variables definition. (ii) a, b, c Significantly different from zero at the 1%, 5% and 10% level, respectively. Source: own elaboration.
Table 6. Total production data for bancassurance and insurance brokers.
Insurance
%
Bancassurance
Premium
Broker
Premium
Bancassurance
Commissions
Broker
Commissions
Broker
Fees
Broker
Com.+ Fees
Difference
Commissions
Health 1.073.0728.958.970.039.00−19.95
Car 18.6527.3610.8111.932.0614.003.19 b
Accident5.134.0925.3117.211.0718.28−7.03
Transport0,114.4416.4612.060.3612.42−4.04
Travel0.181.1816.8221.710.0421.754.93 b
Multi-risk Home41.865.2321.1924.160.1524.323.13 b
Multi-risk Shops2.872.2122.8818.304.8923.190.31
Multi-risk Industrial2.556.6019.4113.810.7814.59−4.82 b
General Liability2.3211.9518.4013.430.4613.90−4.50
a, b, c Significantly different from zero at the 1%, 5% and 10% levels, respectively. Source: own elaboration.
Table 7. New production data bancassurance and insurance brokers.
Insurance
%
Bancassurance
Premium
Broker
Premium
Bancassurance
Commissions
Broker
Commissions
Broker
Fees
Broker
Com.+ Fees
Difference
Commissions
Health 1.531.5136.6915.350.0415.39−21.30
Car 16.0631.7612.6112.091.5113.600.99 b
Accident5.163.6725.9117.660.1917.85−8.06
Transport0.156.0613.7112.230.1812.41−1.30
Travel0.381.9319.9224.570.0324.604.68 b
Multi-risk Home18.063.6121.3525.970.1726.144.79 b
Multi-risk Shops3.031.8324.9518.330.1218.46−6.49
Multi-risk ndustrial2.545.3519.0313.130.3813.51−5.52 b
General Liability2.6110.4318.8613.960.6214.58−4.28
a, b, c Significantly different from zero at the 1%, 5% and 10% level, respectively. Source: own elaboration.
Table 8. Descriptive statistics of variables.
VariablesFirm-year Obs.MeanStd. Dev.Min.Max.
ROA19560.02567690.0898855−3.1484310.5112977
ROE19620.0750231 0.3713187−5.3355398.688471
ROS18990.18982021.941489−34.1934364.20772
LEV19270.38392740.35149904.508143
LIQ19332.0161683.447185014.859.5
SIZE19247.5998251.1220570.092770612.21656
SALES18946.8725021.5568640.617485712.03256
CUS18940.540629110.61705041.46062
Source: own estimation with Stata 12.1.
Table 9. The matrix of Pearson correlation coefficients.
VariableLevLiqSize SalesCus
Lev1
Liq−0.05661
Size0.10690.05431
Sales0.2149−0.09390.66761
Cus−0.04720.89260.0872−0.13041
Source: own estimations with Stata 12.1.
Table 10. Fixed effects model.
ROA ROE ROS
Independent VariablesModel 1Model 2Model 3Model 4Model 5Model 6
Size0.0092 a −0.0069 0.3393 b
Sales 0.0165 a 0.0260 −0.2671 a
Leverage0.0006−0.00010.12870.1207 a0.26100.4157 b
Customer−0.00000.0000−0.00000.00000.00560.0054
Constant−0.0422 b−0.0853 a0.0806−0.1483−2.4989 b1.8632 a
Adjusted R-squared2.139.990.011.780.020.01
a, b, c Significantly different from zero at the 1%, 5% and 10% level, respectively, using the t–test. Source: authors’ calculation using STATA software version 12.1.
Table 11. Random effects model.
ROA ROE ROS
Independent VariablesModel 1Model 2Model 3Model 4Model 5Model 6
Size0.0083 a 0.0042 0.1158 b
Sales 0.0131a 0.0219 c −0.0677 c
Leverage−0.0042−0.0077 c0.1171 a0.1057 a0.15050.2373
Customer−0.00000.0000−0.00010.0001−0.0043−0.0043
Constant−0.0330 c−0.0582 a0.0010−0.1131b−0.7476 c0.5648 b
Adjusted R-squared2.8911.311.031.770.010.03
a, b, c Significantly different from zero at the 1%, 5% and 10% level, respectively, using the t–test. Source: authors’ calculation using STATA software version 12.1.
Table 12. Prais–Winsten regression fixed effects model.
ROA ROE ROS
Independent VariablesModel 1Model 2Model 3Model 4Model 5Model 6
Size0.0094 a 0.0084 0.1428
Sales 0.0131 a 0.0252 a −0.0366
Leverage−0.0116 a−0.0169 a0.0948 c0.0848 c 0.3739 c0.4243
Customer−0.0001 b0.0000−0.00010.0001−0.00200.0018
Constant−0.0386 b−0.0551 a−0.0206−0.1263 b−1.03530.2848
Adjusted R-squared4.1711.420.771.350.360.24
a, b, c Significantly different from zero at the 1%, 5% and 10% level, respectively, using the t–test. Source: authors’ calculation using STATA software version 12.1.

