Quality of Life Regional Differences: Case of Self-Governing Regions of Slovakia


Abstract
1. Introduction
2. Materials and Methods
- (a)
- GDP per resident is the most used indicator of economic performance in the region;
- (b)
- Registered unemployment rate is the main indicator of the labor market situation in the region. Unemployed people have lower incomes, and therein a lower quality of life;
- (c)
- Average purchase price of a flat is an indicator reflecting the development of real estate prices in a particular region.
- (a)
- Number of divorces per 1000 marriages is an indicator which indicates the social coherence of the population in the region. It reflects satisfaction and good relationships in marriage, which is also related to the quality of life;
- (b)
- Average old-age pension is related to the average gross monthly wage. The higher an income brings the possibility for higher consumption, therein increasing the quality of life;
- (c)
- Number of deaths per 1000 inhabitants. In regions with a higher quality of life, this indicator is lower than in regions with a higher value of this indicator.
- (a)
- Number of crimes per 1000 inhabitants is an indicator that is directly linked to civil security, and therein the quality of life;
- (b)
- Number of fires per 1000 inhabitants. Regions with lower relative fires can be considered as a region with a safer environment and better quality of life;
- (c)
- Length of highways and first-class motorways and roads. This indicator indicates the region’s infrastructure and its condition.
3. Results
3.1. Index I.
3.2. Index II.
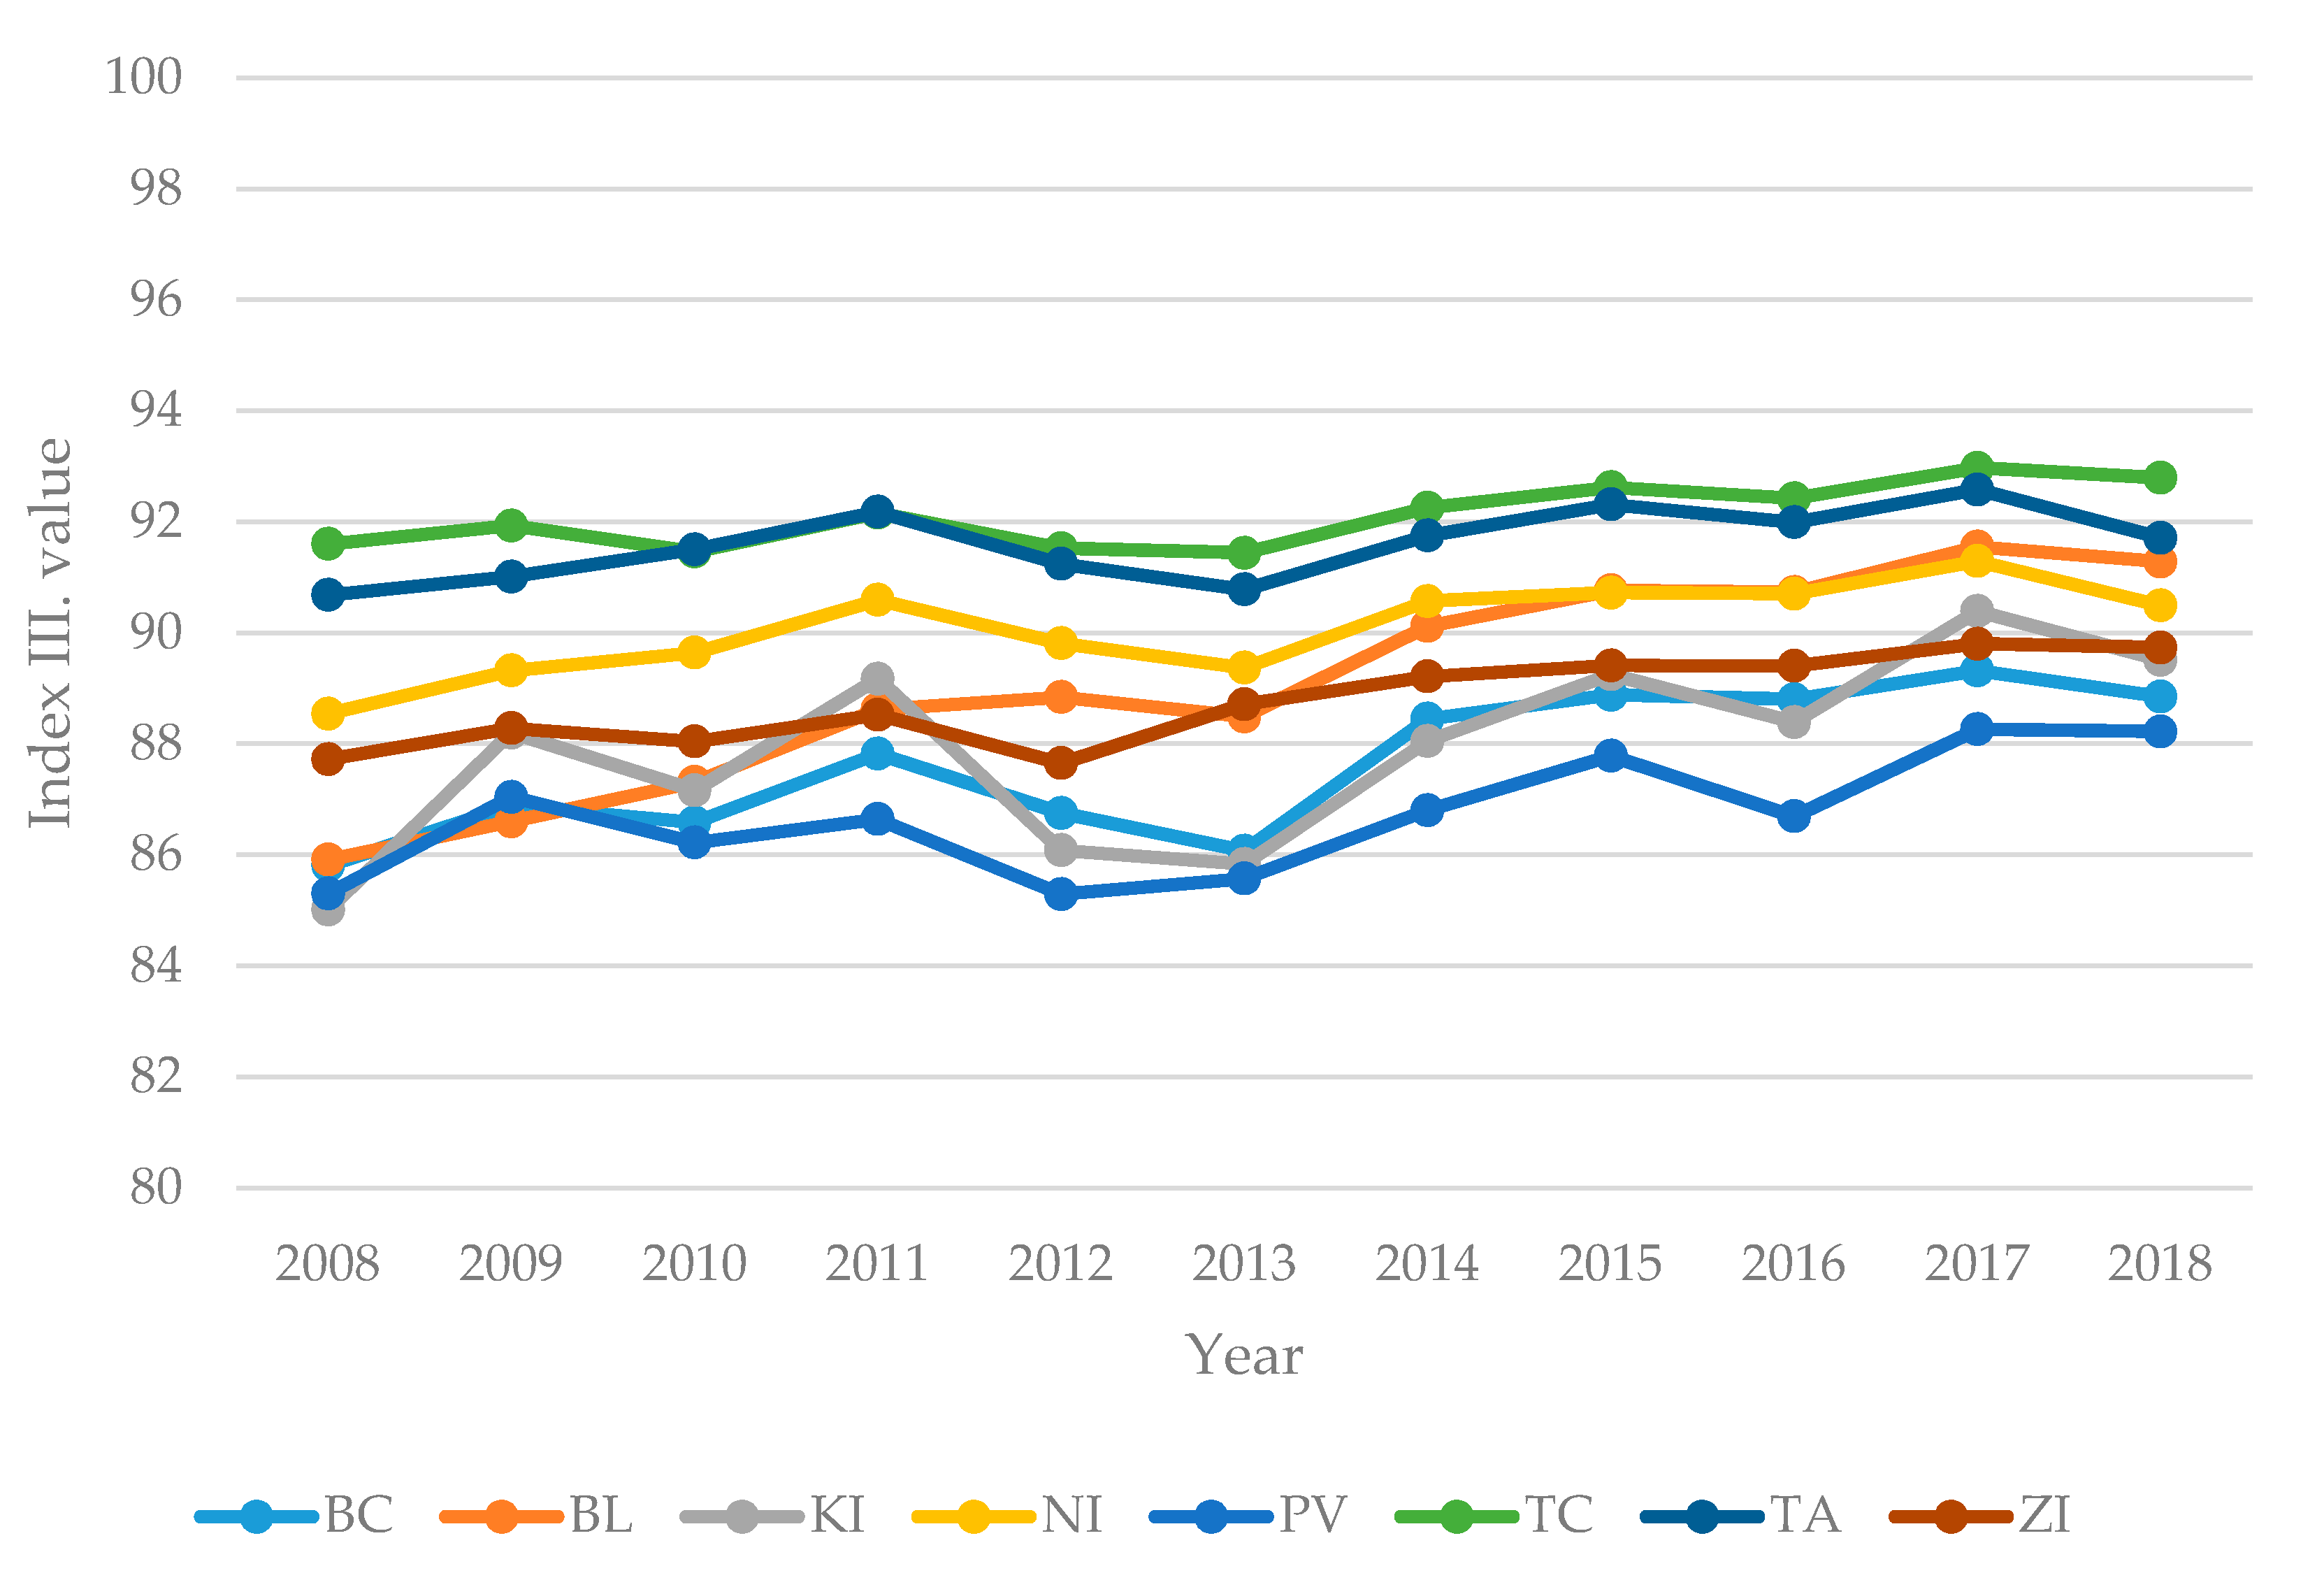
3.3. Index III.
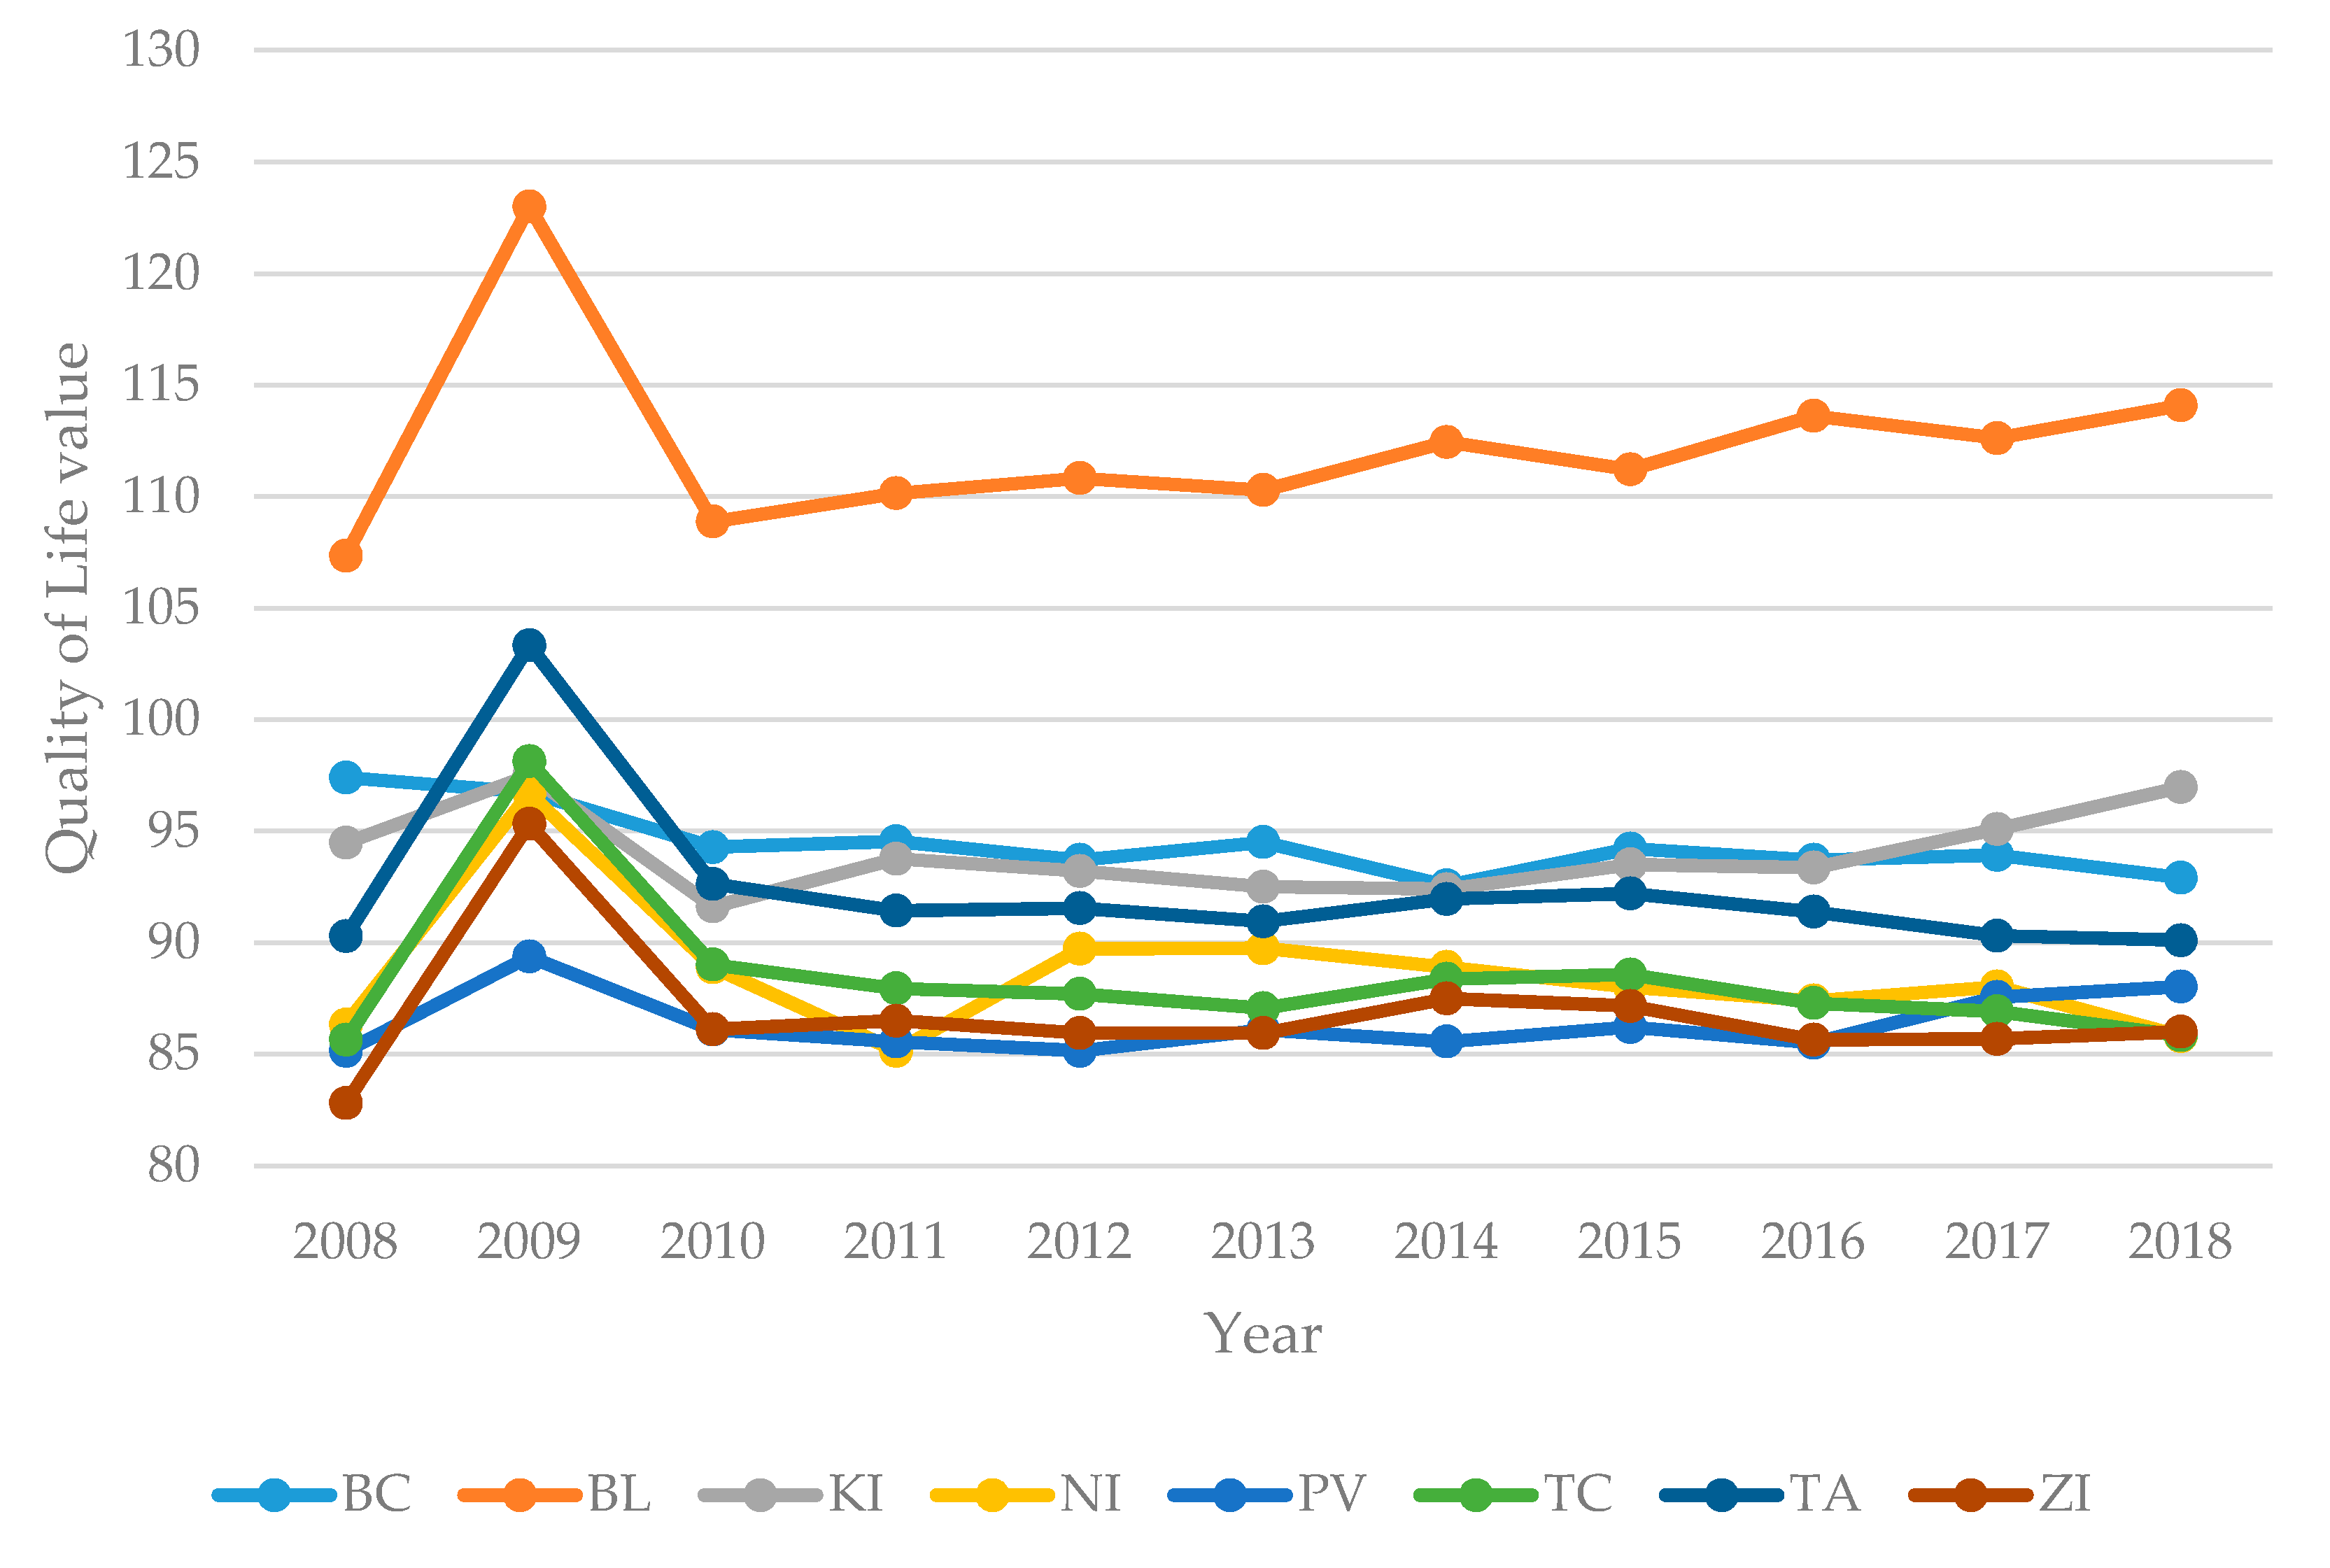
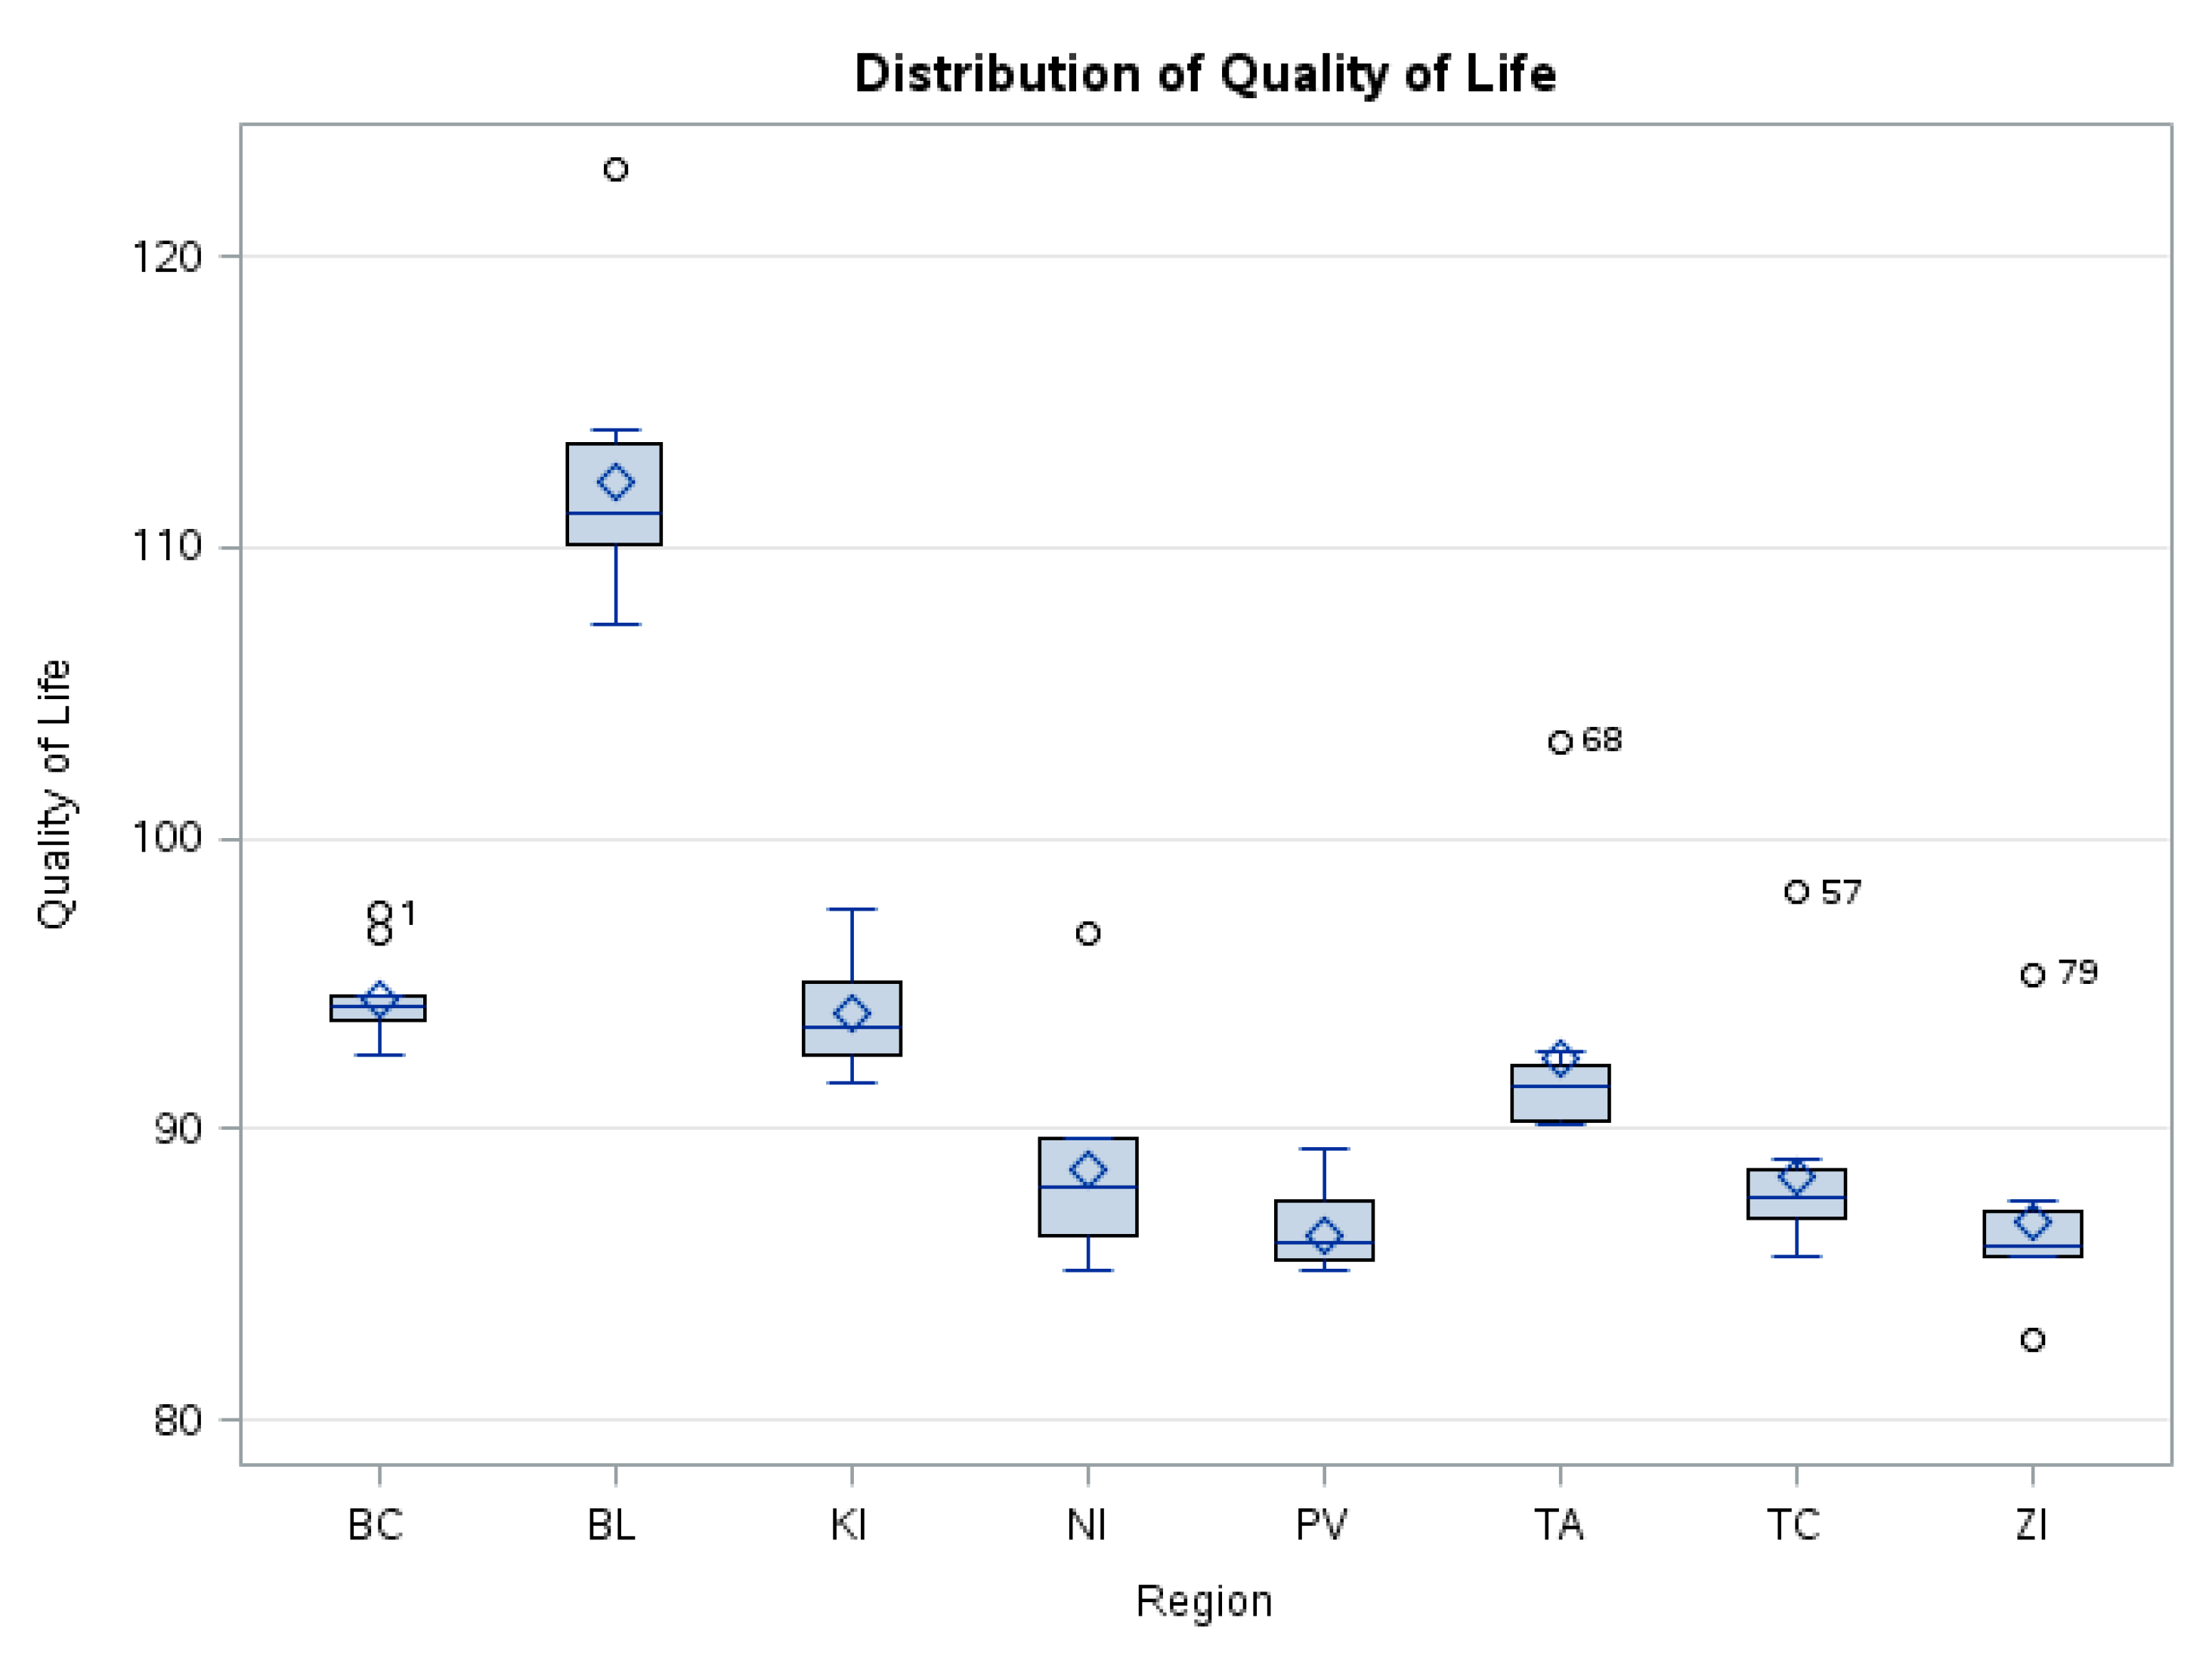
3.4. Quality of Life Index
4. Discussion
5. Conclusions
- Low competitiveness of the production and services in the region;
- Insufficient quality of human resources in the region;
- Insufficient quality of public infrastructure and its accessibility.
- Development of human potential and effective use of labor in the region;
- Use of innovation, information technologies and processes to better exploit and develop production potential and increase the regional innovation capacity;
- The improvement of infrastructure will improve the accessibility of the regions, the quality of the environment and public services, thus exploiting the natural potential in the regions of Central and Eastern Slovakia, in particular, to improve the use of tourism;
- Improving the position of marginalized groups in the labor market, providing work directly in these regions as these groups, the long-term unemployed, do not want to move to work anymore.
Author Contributions
Funding
Conflicts of Interest
References
- Brock, D. Measuring quality of life: Economic, social, and subjective indicators. In The Quality of Life; Clarendon Press: Oxford, UK, 1993; pp. 95–132. ISBN 978-0-19-828797-1. [Google Scholar]
- Diener, E.; Suh, E. Measuring quality of life: Economic, Social, and Subjective indicators. Soc. Indic. Res. 1997, 40, 189–216. [Google Scholar] [CrossRef]
- Fiorino, D.J. Explaining national environmental performance: Approaches, evidence, and implications. Policy Sci. 2011, 44, 367–389. [Google Scholar] [CrossRef]
- Rahman, A.A.; Hasshim, S.A.; Rozali, R. Residents’ Preference on Conservation of the Malay Traditional Village in Kampong Morten, Malacca. Procedia-Soc. Behav. Sci. 2015, 202, 417–423. [Google Scholar] [CrossRef]
- Pienaar, E.F.; Lew, D.K.; Wallmo, K. The importance of survey content: Testing for the context dependency of the New Ecological Paradigm Scale. Soc. Sci. Res. 2015, 51, 338–349. [Google Scholar] [CrossRef]
- Datta, D.; Chattopadhyay, R.N.; Guha, P. Community based mangrove management: A review on status and sustainability. J. Environ. Manag. 2012, 107, 84–95. [Google Scholar] [CrossRef]
- Hassan, S.; Olsen, S.B.; Mohammad Afandi, S.H.; Thorsen, B.J. Measuring the Rural and Urban Attitudes towards Wetlands Using the New Ecological Paradigm: Setiu Wetlands, Malaysia. E-BPJ 2016, 1, 132. [Google Scholar] [CrossRef][Green Version]
- Stiglitz, J.E.; Sen, A.; Fitoussi, J.-P. Report by the Commission on the Measurement of Economic Performance and Social Progress; Commission on the Measurement of Economic Performance and Social Progress: Paris, France, 2009. [Google Scholar]
- Dinda, S. A theoretical basis for the environmental Kuznets curve. Ecological Economics 2005, 53, 403–413. [Google Scholar] [CrossRef]
- Bravo, G. The Human Sustainable Development Index: New calculations and a first critical analysis. Ecol. Indic. 2014, 37, 145–150. [Google Scholar] [CrossRef]
- Hsu, A.; Lloyd, A.; Emerson, J.W. What progress have we made since Rio? Results from the 2012 Environmental Performance Index (EPI) and Pilot Trend EPI. Environ. Sci. Policy 2013, 33, 171–185. [Google Scholar] [CrossRef]
- Mohmmed, A.; Li, Z.; Olushola Arowolo, A.; Su, H.; Deng, X.; Najmuddin, O.; Zhang, Y. Driving factors of CO2 emissions and nexus with economic growth, development and human health in the Top Ten emitting countries. Resour. Conserv. Recycl. 2019, 148, 157–169. [Google Scholar] [CrossRef]
- Wolsink, M. Contested environmental policy infrastructure: Socio-political acceptance of renewable energy, water, and waste facilities. Environ. Impact Assess. Rev. 2010, 30, 302–311. [Google Scholar] [CrossRef]
- Herrera, L.; Buitrago, R.E.; Lorenzo, O.; Badea, M. Socio-Emotional Intelligence in Colombian Children of Primary Education. An Analysis in Rural and Urban Settings. Procedia-Soc. Behav. Sci. 2015, 203, 4–10. [Google Scholar] [CrossRef]
- Gössling, S. Global environmental consequences of tourism. Glob. Environ. Chang. 2002, 12, 283–302. [Google Scholar] [CrossRef]
- Gladstone, W.; Curley, B.; Shokri, M.R. Environmental impacts of tourism in the Gulf and the Red Sea. Mar. Pollut. Bull. 2013, 72, 375–388. [Google Scholar] [CrossRef] [PubMed]
- Wiedmann, T.; Lenzen, M.; Turner, K.; Barrett, J. Examining the global environmental impact of regional consumption activities—Part 2: Review of input–output models for the assessment of environmental impacts embodied in trade. Ecol. Econ. 2007, 61, 15–26. [Google Scholar] [CrossRef]
- Cracolici, M.F.; Cuffaro, M.; Nijkamp, P. The Measurement of Economic, Social and Environmental Performance of Countries: A Novel Approach. Soc. Indic. Res. 2010, 95, 339–356. [Google Scholar] [CrossRef]
- Kasparian, J.; Rolland, A. OECD’s ‘Better Life Index’: Can any country be well ranked? J. Appl. Stat. 2012, 39, 2223–2230. [Google Scholar] [CrossRef]
- Badrulhisham, N.; Othman, N. Knowledge in Tree Pruning for Sustainable Practices in Urban Setting: Improving Our Quality of Life. Procedi -Soc. Behav. Sci. 2016, 234, 210–217. [Google Scholar] [CrossRef]
- Moser, G. Quality of life and sustainability: Toward person–environment congruity. J. Environ. Psychol. 2009, 29, 351–357. [Google Scholar] [CrossRef]
- Byravan, S.; Ali, M.S.; Ananthakumar, M.R.; Goyal, N.; Kanudia, A.; Ramamurthi, P.V.; Srinivasan, S.; Paladugula, A.L. Quality of life for all: A sustainable development framework for India’s climate policy reduces greenhouse gas emissions. Energy Sustain. Dev. 2017, 39, 48–58. [Google Scholar] [CrossRef]
- Tapia-Fonllem, C.; Corral-Verdugo, V.; Fraijo-Sing, B. Sustainable Behavior and Quality of Life. In Handbook of Environmental Psychology and Quality of Life Research; Fleury-Bahi, G., Pol, E., Navarro, O., Eds.; International Handbooks of Quality-of-Life; Springer International Publishing: Cham, Switzerland, 2017; pp. 173–184. ISBN 978-3-319-31414-3. [Google Scholar]
- Murakami, F.; Sulzbach, A.; Pereira, G.M.; Borchardt, M.; Sellitto, M.A. How the Brazilian government can use public policies to induce recycling and still save money? J. Clean. Prod. 2015, 96, 94–101. [Google Scholar] [CrossRef]
- Rozenberg, A.G. Factors of Quality of Life of the Population: Research and Discussion. In Proceedings of the International Scientific Conference “Global Challenges and Prospects of the Modern Economic Development”, Samara State University of Economics, Samara, Russia, 7–8 November 2019; 2019; pp. 1498–1504. [Google Scholar]
- Šoltés, V.; Nováková, B. Measurement of Objective life Quality in the Context of Economically Developed Countries’ Quantification. Procedia Econ. Financ. 2015, 32, 146–153. [Google Scholar] [CrossRef]
- Nowak, P. Regional variety in quality of life in Poland. OC 2018, 9, 381–401. [Google Scholar] [CrossRef]
- Yonk, R.M.; Smith, J.T.; Wardle, A.R. Building a Quality of Life Index. In Quality of Life and Quality of Working Life; Boas, A.A.V., Ed.; IntechOpen: London, UK, 2017; ISBN 978-953-51-3445-9. [Google Scholar]
- Yonk, R.M.; Smith, J.T. Exploring the Components of Our Quality of Life Index. In Politics and Quality of Life; SpringerBriefs in Political Science; Springer International Publishing: Cham, Switzerland, 2018; pp. 17–34. ISBN 978-3-319-72570-3. [Google Scholar]
- Mederly, P.; Topercer, J.; Nováček, P. Indikátory Kvality Života A Udržitelného Rozvoje: Kvantitativní, Vícerozměrný a Variantní Přístup, 1st ed.; UK FSV CESES: Praha, Czech Republic, 2004; ISBN 80-239-4389-8. [Google Scholar]
- Mederly, P.; Novacek, P.; Topercer, J. Sustainable development assessment: Quality and sustainability of life indicators at global, national and regional level. Foresight 2003, 5, 42–49. [Google Scholar] [CrossRef]
- Abdul Mohit, M. Analysis of Malaysian Regional Quality-of-Life and its Policy Implications. AjQoL 2018, 3, 11. [Google Scholar] [CrossRef]
- Petrova, E. Regional Life Quality Management: Methodological Approaches to its Forecasting using Neural Networks. In Proceedings of the International Scientific Conference “Competitive, Sustainable and Secure Development of the Regional Economy: Response to Global Challenges” (CSSDRE 2018), Limassol, Cyprus, 18–20 April 2018; Atlantis Press: Volograd, Russia, 2018. [Google Scholar]
- Štatistický úrad SR STATdat. Public database. Available online: http://statdat.statistics.sk/cognosext/cgi-bin/cognos.cgi?b_action=xts.run&m=portal/cc.xts&gohome= (accessed on 20 September 2019).
- Macháček, J.; Toth, P.; Wokoun, R. Regionální a Municipální Ekonomie; Oeconomica: Praha, Czech Republic, 2011; ISBN 978-80-245-1836-7. [Google Scholar]
- European Union. Final Report of the Expert Group on Quality of Life Indicators; Publications Office of the European Union: Luxembourg, 2017; ISBN 978-92-79-66085-6. [Google Scholar]
- Liu, B.; Matsushima, J. Annual changes in energy quality and quality of life: A cross-national study of 29 OECD and 37 non-OECD countries. Energy Rep. 2019, 5, 1354–1364. [Google Scholar] [CrossRef]
- Almeida, T.A.; Das, N.; García-Sánchez, I.-M. Sociopolitical and economic elements to explain the environmental performance of countries. Environ. Sci. Pollut. Res. 2017, 24, 3006–3026. [Google Scholar] [CrossRef] [PubMed]
- Lambert, J.G.; Hall, C.A.S.; Balogh, S.; Gupta, A.; Arnold, M. Energy, EROI and quality of life. Energy Policy 2014, 64, 153–167. [Google Scholar] [CrossRef]
- Nadimi, R.; Tokimatsu, K. Modeling of quality of life in terms of energy and electricity consumption. Appl. Energy 2018, 212, 1282–1294. [Google Scholar] [CrossRef]


| Positive Response | Negative Response |
|---|---|
| GDP/resident | Registered unemployment rate |
| Average old-age pension | Average purchase price of a flat |
| Length of highways and first class motorways and roads | Number of divorces per 1000 marriages |
| Number of deaths per 1000 inhabitants | |
| Number of crimes per 1000 inhabitants | |
| Number of fires per 1000 inhabitants |
| Alpha | 0.05 | |||
| Error Degrees of Freedom | 80 | |||
| Error Mean Square | 8.56608 | |||
| Critical Value of t | 3.23205 | |||
| Minimum Significant Difference | 4.0336 | |||
| Means with the same letter are not significantly different. | ||||
| Bon Grouping | Mean | N | Region | |
| A | 112.225 | 11 | BL | |
| B | 94.408 | 11 | BC | |
| B | 94.038 | 11 | KI | |
| C | B | 92.375 | 11 | TA |
| C | D | 88.604 | 11 | NI |
| C | D | 88.409 | 11 | TC |
| D | 86.781 | 11 | ZI | |
| D | 86.389 | 11 | PV | |
© 2020 by the authors. Licensee MDPI, Basel, Switzerland. This article is an open access article distributed under the terms and conditions of the Creative Commons Attribution (CC BY) license (http://creativecommons.org/licenses/by/4.0/).
Share and Cite
Oláh, J.; Hajduová, Z.; Lacko, R.; Andrejovský, P. Quality of Life Regional Differences: Case of Self-Governing Regions of Slovakia. Sustainability 2020, 12, 2924. https://doi.org/10.3390/su12072924
Oláh J, Hajduová Z, Lacko R, Andrejovský P. Quality of Life Regional Differences: Case of Self-Governing Regions of Slovakia. Sustainability. 2020; 12(7):2924. https://doi.org/10.3390/su12072924
Chicago/Turabian StyleOláh, Judit, Zuzana Hajduová, Roman Lacko, and Pavol Andrejovský. 2020. "Quality of Life Regional Differences: Case of Self-Governing Regions of Slovakia" Sustainability 12, no. 7: 2924. https://doi.org/10.3390/su12072924
APA StyleOláh, J., Hajduová, Z., Lacko, R., & Andrejovský, P. (2020). Quality of Life Regional Differences: Case of Self-Governing Regions of Slovakia. Sustainability, 12(7), 2924. https://doi.org/10.3390/su12072924