Abstract
A systematic review was conducted following the Preferred Reporting Items for Systematic Reviews and Meta-Analyses (PRISMA), to generate a document that supports the development of future research, compiling the various studies focused on the analysis of the pedestrian-vehicle interaction at unsignalized crosswalks. Firstly, 381 studies were identified by applying the search protocol in the database sources; however, only nine studies were included in this review because most of the studies are not focused on this type of crosswalks or have not considered the micro-simulation perspective. For each study, an analysis of the used methodology for data collection was carried out, in addition to what type of model it was applied, including the variables that represent the PVI (Pedestrian-Vehicle Interaction). The outcomes obtained by this systematic review show that although the video camera observation technique is the most used, it is possible to complement them with other tools to add specific field information. Additionally, variables such as the adjacent yields, speed variables vehicles, pedestrian attitude, and the number of pedestrians waiting at the crossing were those most used in the cellular automata model or micro-simulation, which are the commonly developed models to simulate this interaction.
1. Introduction
1.1. Rationale
According to the global status report on road safety for the year 2018 conducted by the World Health Organization (WHO), the problem of traffic fatalities is getting worse as they increased to 1.35 million in 2016. In other words, almost 3700 people die every day on the roads of the world [1]. Likewise, the same report highlighted that it is the eighth cause of death overcoming diseases such as HIV/AIDS, tuberculosis, and diarrheal diseases. Vulnerable road users such as the pedestrian, cyclist, and motorcyclist represent 54% of the deaths in 2016 (specifically the pedestrian represents 23%). The vulnerability presented by these users is due to the disadvantages they present in terms of protection, speed, and weight, with respect to the vehicle. This vulnerability of the human body should be a determining factor in the design of transit systems and the control of speed [2]. People who died, are injured, or end up disabled because of a collision, whether as a vulnerable road user or not, have a global social cost. According to Peden et al. [3], the economic cost of crashes and injuries caused by traffic amounts is estimated to be 1% of the gross national product (GNP) in low-income countries, 1.5% in revenues medium, and 2% in high income.
The moment in which the desired movements of a pedestrian and a vehicle intercept (conflict), the so-called pedestrian-vehicle interaction (PVI) occurs, which is dynamic as it happens to depend on various factors and situations [4]. This interaction originates in pedestrian crossings with and without light signals, as in the case of intersections and mid-block crossings. Pedestrian crossings outside these crossings (also known as jaywalking) also generate this type of interaction. The type of interaction may vary depending on the geometry of the road where it occurs, legal restrictions, and the criteria of the driver and pedestrian [2]. It is important to mention that the interaction between the pedestrian and the vehicle is dominated by a non-verbal language. It can cause situations in which the pedestrian makes a decision considering the driver’s approval, but the latter makes an unexpected decision, bringing as a consequence a conflict or even an accident. According to Fu et al. [5], the disposition of the driver to yield and the assertiveness of the pedestrian are one of the many factors that can influence this interaction.
At pedestrian crossings that are not controlled by light signals (unsignalized crosswalk) the priority of the pedestrian is not clear, even with legislation supporting pedestrian priority, and this results in higher levels of accident and death of pedestrians compared to those controlled by pedestrian traffic lights [6,7,8,9,10]. Not yield to pedestrians and high speeds at the time of interaction in this type of crossings are part of the elements that influence this consequence. The compliance rate of drivers at zebra crossings is likely to vary across locations [11]. It is relevant to mention that the PVI not only impacts the pedestrian safety but also induces traffic congestion of vehicles and decreases the capacity of the roads, as demonstrated by Golakiya et al. [12], showing that for volumes higher than 1550 pph, the capacity was reduced to 32% in an urban arterial.
In this context, PVI has been generating interest among researchers, government and local entities, and other organizations, whose purpose is to analyze, determine, and develop policies and safety measures that help combat and mitigate the accidents, inside and outside of the pedestrian crossings. However, Feliciani et al. [13] state that such research has been limited by a variety of factors, such as difficulty in obtaining empirical data through observations in the field, safety, and ethical concerns related to experiments with individuals in the real-world and the limited scope of the developed simulation models. In addition, it is worth noting that the investigation has had as one of the most relevant premises that yielding to a pedestrian is a critical component of the accessibility and safety of pedestrians. Therefore, a better understanding of the behavior of the driver at the moment of yielding to a pedestrian can be of great value for conducting a more optimal PVI analysis [14]. In fact, the PVI is separated into two main processes, the pedestrian walking behavior and the driver yielding behavior. The behavior of the pedestrian has been analyzed mainly based on the probability that a pedestrian has to accept a time gap [15,16,17]. On the other hand, driver behavior has been analyzed focusing on the identification of the factors that have a greater influence in yielding to pedestrians. Indeed, the action of yielding to a pedestrian is influenced by various factors, such as dynamics of the vehicle, characteristics of the driver, traffic volume, attributes of pedestrians, and concurrent events in the pedestrian crossing [14,17,18,19]. The analysis of the driver yielding behavior assumes more relevance to ensure road safety since the driver tends to assume the risk because he/she feels protected inside the vehicle in contrast to the pedestrian who will accept time gaps that not compromise her/his physical integrity at least in normal conditions (i.e., visibility, weather, cognitive functions, etc.).
Besides these two behavior perspectives, PVI has been analyzed separately by type of road crossing. Crossings controlled by light signals are characterized by establishing clearly the priorities, thus allowing to have a PVI in a more controlled environment. Manxia Liu et al. [20] developed a microscopic model at signalized intersections taking into account three important aspects of pedestrian behavior when crossing, such as the evasion behavior with counter-flow pedestrians, the following behavior with leader pedestrians, and the collision avoidance behavior with vehicles. Wonho Suh et al. [15] replicated the pedestrian behavior in a crosswalk using the Vissim software to analyze the waiting time of pedestrians and their behavior regarding compliance with the red sign. Another type of pedestrian crossing is the so-called jaywalker representing a pedestrian cross on a road without using the zebra. In these cases, the PVI has also been focused on studies such as Wang et al. [21], who proposed a micro-simulation model of pedestrian jaywalking in the mid-block street crossing. This model was calibrated and validated using the data collected in the field, concluding by the result that this kind of tool can be used to supplement current guidelines for pedestrian-related problems. Finally, the pedestrian crossing through the zebra is associated with a high number of accidents, based on the statistical data of accidents and deaths of pedestrians at junctions without signaling, in addition to the fact that in this type of crossing pedestrians are more likely to be exposed to the risk of being run over by vehicles due to lack of control of the signal and the unclear right of way [4]. The need to have a clearer knowledge of the attempts of analysis and modeling of the interaction that occurs when a pedestrian is interested in crossing the zebra and the approaching vehicle has been highlighted.
It should be noted that PVI may assume distinct characteristics depending on the context (type of road, type of crosswalk, weather, and so on) but also on each agent, i.e., pedestrian and driver (age, gender, distraction, etc.) Therefore, the research focused on this subject has been mainly based on a microscopic level approach. In particular, micro-simulation has been applied and developed, considering that each unit (or agent) is represented by a record that contains a unique identifier and a set of associated attributes. A set of rules is applied to these units that leads to simulated changes in state and behavior.
Due to the relevance of this kind of study, some authors already conducted literature reviews in this field. Papadimitriou et al. [22] in 2009 conducted a critical review and evaluation of the existing research on the behavior of pedestrians in urban areas focusing on two separate aspects, the choice of route and the behavior when crossing. Based on this review, the authors found the lack of a general and detailed consideration of pedestrian behavior along an entire trip in urban areas. Considering the literature review performed by Papadimitriou et al., it is possible to observe three studies that carried out a model of the crossing behavior of pedestrians taking into account the interaction with the vehicle. Although the review mentions the place where these interactions were observed in the studies, the characteristics of each of the models and the variables that were used for the analysis of the PVI by the authors were not described.
In addition, Mamidipalli et al. [16] in 2015 performed a review of the analysis methods and approach for data collection and performance estimation for pedestrian crossing modeling and pedestrian-vehicle interaction. The authors concluded that there had been a broad interest in describing driver attitudes and pedestrian crossing behaviors. To obtain the data in these investigations, three different data collection techniques have been adopted, namely observational, instrumented vehicle, and driving/pedestrian simulator approaches. Regarding the PVI models, the authors mention several studies that have analyzed the pedestrian addressing its approach to the crosswalk, the crossing behavior, and the choice of the route.
Those previous reviews provided an overview of some models and methods that have been used to model the PVI until 2015. Nevertheless, gaps can be pointed out regarding some issues that were not clearly identified, such as the type of PVI, the used data collection methodology, the type of site where the study was conducted, the type of model used, and the variables or influential parameters in the PVI.
Overall, there is a lack of scientific material that allows having a specific and detailed feedback of the different studies that have tried to model and analyse the PVI that occurs specifically at unsignalized crossings. In this context, the present work intends to cover this gap using a thorough methodology to conduct a systematic review to provide a compilation of the studies that have analyzed the PVI, allowing a comparison between the data collection methodologies, the applied models, the used variables and influential parameters. The outcomes of this review can provide a line of route for future analysis of the PVI in microscopic environments, which is a relevant tool to support policy decisions that may improve safety for pedestrians in this type of crossings. In this sense, Section 2 describes the methodology used to conduct the systematic review, including the criteria for inclusion and exclusion of studies, and the protocol for the search of studies. Section 3 presents the selected studies, their characteristics, and their most relevant results. Section 4 presents the discussion of the systematic review based on the selected studies, and finally, in Section 5, the conclusions of the study of the PVI at unsignalized crosswalks are shown.
1.2. Objetive
Taking into account the number of accidents occurring at unsignalized pedestrian crossings and the lack of attention paid to PVI generated in those crossings, the objective of this study was to carry out a systematic review to identify and examine the studies that have attempted to propose a simulation model in a microscopic environment for the analysis of PVI. In this sense, this document compiles the investigations carried out in the last years, describing the different approaches used for the analysis of the PVI, to be used as a source of base information, guiding the development of future research for the optimization and standardization of the analysis and modeling of the PVI at unsignalized crossings. Additionally, studies that have analyzed the factors that influence the behavior of the pedestrian and driver and their interaction were selected. The latter was assumed because the decision-making processes of the driver to yield to the pedestrian and/or the pedestrian to cross or not cross are issues relevant to the simulation model.
2. Methods
2.1. Protocol
This systematic review (SR) was performed under the standards, recommendations, and parameters suggested by PRISMA [23,24], which provide a detailed and explained guide of each section and item (element) that they consider essential for a transparent presentation of a systematic review. One of the main elements of a SR is the protocol, which aims to provide the justification for the review and the methodological and analytical approach. The protocol, which supports this systematic review, can be obtained through the email of the main author.
2.2. Elegibility Criteria
2.2.1. Inclusion Criteria
The selective criteria that must be matched by the studies to be included in this review are the following:
- Studies published in the English language;
- Publications time from 2012 to 2019;
- Studies that have as primary or secondary objective, the analysis of the interaction between pedestrians and vehicles in intersections, roundabouts or mid-block crossings;
- Studies that analyze pedestrian-vehicle interaction in a microscopic environment.
It is important to take into account what is the concept of interaction between pedestrians and vehicles that was used for the inclusion and exclusion criteria in the systematic review. The general definition of interaction is denoted as the situation where the road users of interest are close enough in time and space, such that they may interact with each other [25]. Therefore, for the analysis of the studies, it was considered pedestrian-vehicle interaction, at which time a vehicle approaches the pedestrian crossing, and a pedestrian demonstrates intention to cross, whether in the area of wait (area on or before the zebra) or in movement in the direction of crossing [5,18].
2.2.2. Exclusion Criteria
The studies were excluded according to the following criteria:
- Studies that carry out the analysis of the PVI at the zebra-crossing with traffic lights or outside the pedestrian crossings;
- Studies that analyze the PVI focusing specifically in groups of pedestrian crossing;
- Studies focused on modelling gap acceptance and/or other variables used to modelling the pedestrian behavior;
- Studies that analyze PVI as a traffic conflict;
- Studies that analyze the interaction pedestrian-pedestrian and pedestrian-other user (e.g., cyclists, and two-wheeled personal mobility vehicles).
These criteria were assumed to ensure consistency of the approach of the selected studies and thus allow the comparison between studies and its discussion.
2.3. Information Sources and Search
A search protocol was applied to determine the studies on the subject in the electronic databases Scopus and Web of Science. It should be borne in mind that the providers of these databases are Elsevier and Clarivate, respectively, and that they are peer-reviewed databases. At the same time, this protocol was applied to search on the platforms of Science Direct (supplier Elsevier) and Taylor & Francis (supplier Routledge and Taylor & Francis), assuming that these platforms have characteristics similar to the previous ones with the advantage that allows access to the text of the entire study and not only to its summary. Only studies published in journals were selected to ensure high and consistent quality of selected studies considering that there are a high number of distinct conferences covering the subject.
The time considered for the implementation of the search protocol was from January 2012 to December 2019. This period was assumed to select the most recent works, considering that usually the studies focused on PVI are based on technological resources (e.g., micro-simulation, modeling and/or video analyzing software) and thus, leading to fast developments and improvements. The publication time selected for this systematic review was based on a preliminary search analysis considering the abovementioned electronic databases. Through an analysis of the tendency of the number of publications per year under de searched subject, we observed that an exponential increase occurred since 2012. Moreover, a previous review manuscript exists by Papadimitriou et al. [22] in 2009, in which studies published up to that date, focusing on PVI, were described
Complementary to the search protocol, we contacted some researchers and professors with knowledge of this topic to identify possible studies and/or projects that are considered relevant or that have not been published yet. It is important to mention that, in these later studies, the inclusion criteria regarding the time will not be applied, since they can be relevant publications for the systematic review that are outside the range of analysis. Therefore, other types of studies besides published articles were included if recommended by experts.
The terms that make up the search equation were discussed and accepted by each of the authors that designed this systematic review. The equation was made up of: ‘pedestria*’, ‘pedestria* simulatio*’, ‘microsimulation’, ‘microscopi* traffi* simulatio*’, ‘traffi* simulatio*’, ‘micro-simulation’, ‘microscopi* simulatio*’, ‘pedestrian-vehicle interactio*’, ‘vehicle-pedestrian interactio*’, ‘pedestria* vehicl* interactio*’. It was of great importance to take into account the synonyms of some terms in order to cover a larger number of studies and reduce the bias due to the use of different terms. These synonyms were grouped by the Boolean operator “OR”, and it was necessary to use the Boolean operator “AND” to group these groups and thus have structured the search equation.
2.4. Study Selection
The results of the search protocol were exported to Excel and analyzed there to determine the number of duplicates and their subsequent elimination. One reviewer (HA) independently selected the studies assigning a relevance value that ranged from 1 to 3, where 1 was considered relevant and 3 irrelevant. The studies in relevance category 2 were analyzed by two reviewers (SF, PT) together to reach a consensus and define a category of relevance 1 or 3. The procedure described above was carried out by applying the inclusion/exclusion criteria in the titles, summaries, and conclusions for each study determined by the search protocol. After this preliminary selection, the full text of the studies with category 1 (relevant) was analyzed together with those recommended by the consulted researchers and academics. This analysis was carried out by three reviewers (SF, HA, PT), who applied the eligibility criteria (inclusion/exclusion) individually, to later debate each of the studies and through a consensus to achieve the final choice of the articles that will be object of the present study.
2.5. Data Collection Process and Data Items
To determine the method for extracting the information (data, variables, among others) of the studies, a type of data extraction sheet was made among three reviewers (HA, SF, PT) to obtain the most important information that met the objectives set in the review. The information that was obtained from the analyzed studies is objective of the study, publication date, country of the study, the methodology for the collection of field data, type of applied model, type of analyzed pedestrian crossing, road geometric dimensions, maximum allowed and modeled speed, type of road hierarchy, variables that influence the PVI, model results, and conclusions. The full-text review of each study to obtaining the aforementioned information was done by a reviewer (HA); said data extraction was inspected by two reviewers (SR, PT); doubts or disagreements were resolved in consensus.
2.6. Risk of Bias in Individual Studies
The quality of the studies was independently assessed by two reviewers (HA, SF). Any dispute presented in the evaluation process was resolved through a third reviewer (PT).
In order to assess the quality of the studies, it was necessary to develop an evaluation tool that is composed of 15 criteria (see Table 1), and for each criterion a rating of Yes, No, NR (Not Report) or NA (Not Applicate) was applied. Then, for each study, the qualification of the 15 criteria as a set will be analyzed to assign a final classification between Strong, Moderate, or Weak. The classification is based on the ranges of scores presented in Table 2, which in time is computed for each study by applying the equation 1, which is a function of the possible response options for each criterion [26]:
where Y is “yes”, and NA is “not applicate”.

Table 1.
Quality assessment criteria.
Table 2.
Classification of studies based on their scores.
This quality assessment tool was developed based on [27,28] and assumed in this SR as we believe that it is relevant to guide future developments to avoid errors and biases in the elaboration. The selected criteria aimed at assessing the validity of each study and determining whether it has selection bias, information bias, or failing specification errors, transfer errors, and measurement errors. Finally, the site of the National Heart, Lung and Blood Institute [29] was consulted to have an example of how the criteria rating methodology and its global classification could be applied.
3. Results
3.1. Study Selection
By applying the search protocol, 381 articles were identified, complemented by 3 doctoral theses and 1 project as recommended by the consulted experts. A total of 118 items were removed because they were duplicates. For the remaining 263 unique articles, 3 PhD theses, and one project, the inclusion and exclusion criteria (specified in Section 2.2), the titles, and the summaries of each study were applied. This analysis was separated into three categories to make a more detailed selection without omitting possible relevant studies. The categories were divided into relevant (1), consensus (2), and irrelevant (3). It was determined that 31 studies were relevant. In addition, 20 studies had to be evaluated, and a consensus of reviewers concluded that 2 of the 20 studies had a relevance for the systematic review. Finally, it was determined that 212 studies were irrelevant to the objectives of this work. The selection of titles and abstracts identified 33 articles, 3 PhD theses, and a project for the revision of full text. Based on this review, 23 articles and 2 theses were excluded for the following reasons: 12 studies analyzed the pedestrian-vehicle interaction in pedestrian crossings controlled by traffic lights, 11 studies analyzed pedestrian-vehicle interaction outside the pedestrian crossing. Moreover, the 3 doctoral theses were excluded because scientific articles were published based on those theses that had already been rejected or taken into account in previous procedures. Altogether, 11 articles and one project met the inclusion criteria and were evaluated in the present work. The process described above is presented in a summarized manner in the flow diagram recommended by PRISMA in Figure 1.
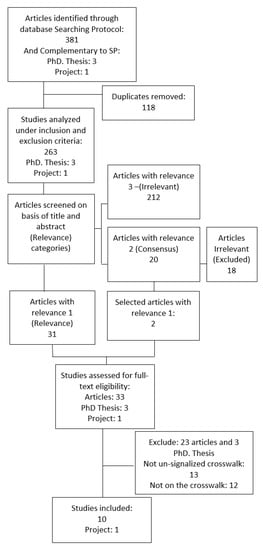
Figure 1.
Preferred Reporting Items for Systematic Reviews and Meta-Analyses (PRISMA) guidance flow diagram.
3.2. Characteristics of Studies
From the 11 studies selected for evaluation, 7 belong to proposals for micro-simulation models and 4 focus on the analysis of driver yielding behavior.
3.2.1. Data Collection for PVI
All the studies used the observation technique for the data collection that allows obtaining static attributes (geometric characteristics, vehicle characteristics, pedestrian characteristics, etc.) and dynamic attributes (pedestrians speed, vehicle speed, etc.) of the behavior in the field. These data are obtained through camera recording, count sheets, etc. Sun et al. [17] made the data collection through video recordings of 2 periods of the day (am and pm peak-hour) during 5 days. In the meantime, Ottomanelli et al. [30] performed the information gathering in a time interval between 10:00 and 11:00 am where the flow of both pedestrians and vehicles is not high to model a system in regular conditions. This information was obtained through videos. Chen et al. [31] mentioned that in addition to using camera recording, counts were used to obtain the study data. In this case, the observation was made in evening peak hours (17:15–18:15) in three working days. Lu (appointment) collected the data during peak hours of morning and night (7:30–9:30 a.m., 16:30–18:30) for 5 days, through the use of camera recording. Feliciani et al. [13] made the data collection through camera recording for 1 hour and 15 minutes. In addition to using video recording, Schroeder et al. [2] performed field measurements with laser speed gun (LIDAR) and annotations to determine when a PVI was generated. These data were obtained during the peak hour of the evening. Mamidipalli et al. [16] affirmed, based on the literature review, that many investigations have used this type of information collection method since it allows to study the attributes of pedestrians, vehicles, and PVI for a variety of users in different types of crossings.
3.2.2. Pedestrian Model in PVI
Several analysis methodologies have been considered to study specific pedestrian behavior. Sun et al. [17] analysed the pedestrian behavior focusing on the variable pedestrian gap acceptance (PGA) and applying a binary logit model. This analysis consisted of predicting the pedestrian decision-making process at the time of the PVI through the probability of acceptance of the gap. Ottomanelli et al. [30], through the discrete simulation of events, analysed the behavior of pedestrians based on the criterion of PGA, assigning for each event an acceptance value according to the distribution obtained from field observations. Chen et al. [31] separated the pedestrian analysis in two phases, movement and decision. The movement phase was modelled using a bidirectional model developed by Blue and Adler [32], while for the decision phase a logit binary model was used to determine the probability associated to the decision of pedestrian crossing the zebra. Lu et al. [4] analysed the process of generating pedestrian in the simulation, in addition to the movement and the decision in the interaction. The authors defined the attributes (gender, speed, type, etc.) through statistical distributions, which were determined with field data, to model the movement of pedestrians using the Social Force Cellular Automaton (SFCA). This model was developed by Ren et al. in 2013 [33], and it is based on the principle of social forces to model the interactions among pedestrians. For the decision stage, the probability that the pedestrian crosses determined through the gap acceptance model was used. Feliciani et al. [13] simulated the movement of pedestrians using the cellular automata model, highlighting that this model allows simulating the dynamics of pedestrians in low-density conditions. Pedestrian attributes, such as speed and gap acceptance, were assigned depending on the distribution of the data observed in the field. Schroeder et al. [2] used the gap acceptance to model the decision of the pedestrian in the interaction. For that model, it was considered the size of the gap (in seconds), and a binary variable was used to distinguish between gaps and lag events. A similar model was used by Wu et al. [34] for pedestrian behavior. The authors assumed that pedestrian arrivals follow a homogenous Poisson process. In addition, the movement at the crosswalk was divided into two directions of movement, upward and downward.
3.2.3. Vehicular Model in PVI
The behavior of the driver when interacting with a pedestrian in a zebra is commonly analysed as the probability of yielding to the pedestrian. This probability is based on environmental factors, characteristics of both the pedestrian and the driver, or adjacent events. Sun et al. [17] used the binary logit model to predict the motorist yield considering five important attributes (age, gender, vehicle type, the number of pedestrian waiting, opposite direction traffic condition). In the meantime, Ottomanelli et al. [30], using the discrete event model, generated a creation module considering that the vehicles only took one direction and a single row, and the parameters such as speed and arrivals were determined through the statistical distributions of the field data. Chen et al. [31] used the cellular automata model to represent the movement of the vehicle, and considering that time, space, and speed are discrete variables, the vehicular traffic model consists of a vehicle-following submodel and a lane changing submodel. For the decision making of the vehicle, a logit binary model was used to determine the probability of yielding to pedestrians. Lu et al. [4] used the well-known model of Nagel-Schreckenberg to imitate the driving manoeuvres and the actions of the vehicles. For vehicle decision making in the interaction, the binary logit model was used to determine the probability for vehicle yielding to pedestrian. Feliciani et al. [13] used a car following model based on Gipps equations in which driver’s reaction time is considered, and for the decision of the vehicle at the moment of the interaction, a probability distribution of the yield rate was developed using the observed data and assigned to each created vehicle.
The analysis of the behavior of the driver at the time of yielding to the pedestrian has been the subject of several investigations using various approaches both for the collection of information in the field and for its prediction [35,36]. Based on the inclusion and exclusion criteria determined for the presented systematic review, only those studies that focused on the driver yielding behavior in unsignalized crossings were included, leading to three studies.
3.2.4. Driver Yielding Behavior Model
The study of Schroeder et al. [18] explores the factors that affect the driver yielding behavior at unsignalized pedestrian crossings, taking into account the effect of the variables that describe the attributes of the vehicles (deceleration rate), the characteristics of the pedestrians (assertive, pedestrian group, pedestrian position in the zebra, etc.), and the concurrent conditions (presence of an adjacent yield, type of vehicle, vehicle in a platoon, etc.). In addition, a threshold for the vehicle’s dynamic variables was defined for the potential of the driver to yield. The main hypothesis considered by the authors is that drivers have the option of whether or not to yield to a pedestrian. That choice is a function of observable and quantifiable parameters, including vehicle dynamics, driver and pedestrian attributes, and simultaneous attributes events at or near the crosswalk. The driver yielding behavior was measured with a binary variable with two values, 1 = yields and 0 = does not yield. The authors state this intuitive approach to analyse the yield response variable based on a binary logistic regression, allowing an easy interpretation and, more importantly, the implementation of the results in a micro-simulation environment. Meanwhile, Salamati et al. [14] aimed to analyse the factors that influenced the yielding of the driver to pedestrians in the approach to two-lane roundabouts. The driver’s behavior observations were controlled by the authors, and the data collection methodology (a ground-level video camera was pointed at the crosswalk and approach to capture the pedestrian and oncoming vehicles) was designed to include different waiting positions for the pedestrian to follow the four conditions defined by the study: a blind pedestrian standing at the curb, a blind pedestrian standing with one foot in the crosswalk, a sighted pedestrian standing at the curb, sighted pedestrian standing with one foot in the crosswalk. Data on these conditions were collected in six multilane roundabouts in four states: Maryland, North Carolina, Indiana, and Tennessee. One two-lane entry and one two-lane exit approach of each of the six roundabouts were studied. According to the study, all the roundabouts were located in relatively urban areas. The model included specific variables for each study location, such as vehicle speed, position of the vehicle with respect to the pedestrian, approach of the vehicle in platoon, type of vehicle, among others.
In 2018, Scheneider et al. [19] conducted a study of driver behavior. To identify the explanatory variables that may be associated with the choice to yield or not yield to pedestrians, the authors developed a series of binary logistic regression models. In this study, the behavior of 20 unsignalized crossings was analysed (10 of them without reported accidents in a period of 5 years and with similar characteristics to the other 10 which have reported accidents) in Milwaukee, Wisconsin. The maximum speed on the roads selected for the study varied between 25 or 30 miles per hour, and the data collection was carried out in the two peak hours of the afternoon (5:00 p.m. to 7:00 p.m.). The authors took into account the Van Houten method [37], which describes the minimum distance at which drivers can safely stop. Vehicles that were within the minimum distance were not considered in the study since they do not have a distance suitable to give way. Data collection in the study field took into account the assertiveness of the pedestrian, the size of the pedestrian group that approaches the crosswalk, and the estimation of the demographic characteristics of pedestrians and drivers. The variables used by the authors were determined, considering the hypothesis that these may affect the pedestrian’s behavior based on previous research [38]. Meanwhile, a recent study by Fricker and Zhang [39] defines, based on the observations of the PVI, that the likelihood that a driver would decelerate is a key factor and could be considered over their likelihood of yielding. To determine the factors that influence the likelihood of driver decelerating, a logistic regression was used, using the data collected from recordings made at two un-signalized crosswalks at a T-type intersection. In this study, two road typologies (one versus two directions) were compared.
3.2.5. Summary of the Characteristics of Studies
Next, Table 3 resumes the characteristics of the studies that will be analysed in the present systematic review.
Table 3.
Summary of the main characteristics of included studies.
3.3. Risk of Bias within Studies
Only two studies were classified as “moderate” and nine were classified as “strong” using the methodology mentioned in Section 2.6, which is based on criteria that help determine the quality of the studies under this review. Several sources were found that could be considered as main generators of biases. For instance, the use of variables and/or parameters that describe the behavior of the pedestrian and the vehicle, which were obtained in certain contexts, in another case study, implies caution, since not maintaining the similarity in the conditions with which they were originally determined could produce inappropriate results for the model. For example, the aggressiveness factor (AF) associated to the analysis of gap acceptance depends on the individual characteristics of the pedestrian, which in time depends on the crossing location.
Another source of bias that was common to some studies is associated to the heterogeneity of the characteristics of pedestrians and vehicles that is not usually considered when developing and applying the models. That was the case of the studies carried out by Feliciani et al. [13] and Ottomanelli et al. [30], in which some relevant characteristics such as gender and age of pedestrians, which lead to distinct walking speeds and the type of vehicle with which the interaction occurs (light or heavy) were not taken into account. The study developed by Lu et al. [4] assumed a classification of pedestrians by gender and age but mentioned that one of the shortcomings of the study is that the walking speeds of all kinds of pedestrians (old male, old female, young male, and young female) were assumed as the same. In the same line, the model developed by Feliciani et al. [13] considered an unique value for the following factors that describe pedestrian and driver behavior: driver reaction time, walking speed (in this case a distinction between elderly and non-elderly was made), pedestrian acceleration, gap acceptance, etc. In fact, the author determined these values based on the scientific literature and assumed that although these parameters were not specifically considered for the study, the variations that could present from one case study to another would not be abrupt.
3.4. Main Outputs from Studies
3.4.1. Results of Pedestrian-Vehicle Interaction
The main objective of analysing PVI in unsignalized pedestrian crossings is to evaluate and optimize pedestrian safety. Based on this objective, several studies have been carried out [2,13,17,20,30,31] to establish a reliable simulation model that represents the vehicle yielding and pedestrian crossing behaviors in a most realistic way.
The pedestrian gap acceptance (PGA) and the driver yield (DY) have been investigated as these variables represent a behavior eventually associated to conflicts between vehicles and pedestrians. One of the pioneering studies in the analysis of the overall behavior of the PGA and the DY was carried out by Sun et al. [17], whose main objective was to develop a model for the prediction of PGA behavior and the DY at unsignalized midblock crosswalks. The authors studied two different issues related to PVI. The first was to determine the attributes that influence the decision of the pedestrian to accept a certain gap, and the second was to determine the attributes that are taken into account when assigning the driver yield to pedestrian. Binary logit models were used to analyze both issues aiming to generate predictions closer to reality. In order to study the PGA and the DY, the authors collected data that were divided into two groups regarding pedestrian behavior versus driver behavior. The authors showed that in the case of PGA model, the variables with the greatest influence on the decision to cross or not cross were the gap size, the number of pedestrians waiting, and the age of pedestrians. Similarly, the DY binary logit model showed that the variables with a higher impact on the decision to yield or not yield the pedestrian were opposite direction traffic, number of pedestrians waiting, and the type of vehicle.
Lu et al. [4] used the basic concept for the microscopic model and integrated a simulation algorithm describing the pedestrian and vehicle behavior. This integrated algorithm, representing two sub-models (one for each agent), was divided into 5 phases, which ranged from the generation of pedestrians and vehicles with their respective attributes, until the moment when the pedestrian and the vehicle cross the crosswalk. The results presented by the authors showed that the variables that have the greatest influence in drivers’ yielding behavior and pedestrian crossing behavior for the analysed sites were pedestrian attitude, presence of pedestrian group, time headway between vehicles, and vehicle speed. The authors compared the results of the PVI events of the simulation with those observed in the field for the validation of the model, obtaining a difference for the yielding rate of 10.67% for site A and 3.77% for site B. Similarly, they analysed the differences between the observed and simulated numbers of pedestrian-vehicle interaction events for site A and site B, which were 13.2% and 9.43%, respectively.
In the same way, Ottomanelli et al. [30] developed a simplified model that simulated the interactions between pedestrians and vehicles at crosswalks. In this model, parameters were selected to represent the PVI according to the easy-to-collection criterion assigned by the authors. The main objective of the study was to develop a simulation tool that is able to predict the response of a particular design solution and compare them with design alternatives, assuming to do that a set of easy and cheap collection data. The results obtained by the discrete event system model were simulated for an hour, the same duration of the observations obtained in the field. The first analysis conducted to evaluate the model performance was the comparison between the number of agents (pedestrians and vehicles) that were generated by the model and observed in the field, showing a difference of 1.6% for pedestrians and 0.8% for vehicles. The first simulation test was performed with gap acceptance hold modules characterized by a walking speed and an aggressive factor (AF) value as indicated in the literature: 1.37 (m/s) for the walking speed and AF of 2.5 s. After 100 simulation runs, the percentage of error obtained when compared with the observed values for the AVWT and the APWT at the entrance and exit of the campus was 138.83% on average. Considering this percentage of error, the authors concluded that the value usually suggested in the literature for AF cannot be applied for the study, stating that this may be because this factor depends on the individual pedestrian characteristics. The authors showed that when the AF is 0 (i.e., pedestrians are very aggressive), the results of the model presented an acceptable error (16.83% mean error). With respect to the walking speed of pedestrians, a more accurate representation of the real system can be obtained, assuming that the walking speed is generally variable among pedestrians.
Chen et al. [31] modelled the PVI from a microdynamic point of view to provide a more detailed analysis of individual behavior. They developed a model to simulate PVI by joining the decision model (crossing/yielding decision-making) and the movement model (pedestrian submodel and vehicle following/lane changing). To replicate the PVI in a more realistic way, the authors chose four types of parameters to be calibrated, among which are the vehicle characteristics, pedestrian characteristics, the coefficients obtained by the binary logistic regression model (which was used to determine the probability that the driver yield to the pedestrian), and the noise parameter in the limitation rule (parameter that measures stochastic uncertainty for irrational choices). The calibrated model showed that the accuracies of predicting the driver behavior and pedestrian crossing behavior are 92.6% and 96.3%, respectively. In addition, the study concluded that the delays for vehicles increase moderately with an increase in the pedestrian arrival rate. According to the authors, this is due to the fact that increasing the volume of pedestrians, the vehicle traffic flow is interrupted because crossing takes longer. Similarly, it is highlighted that the delays for pedestrians decrease with an increasing flow of pedestrians for the following two reasons: the herd mentality effect and lateral discomfort.
For the analysis of PVI, empirical models have also been developed. Feliciani et al., 2017 [13], considered a model that was based on empirical evidence gained during an observation of a non-signalized crosswalk. The objective of the authors was to develop a tool that could be used by decision-makers to assess the need to introduce a new crosswalk and/or change a traffic light and estimate the potential benefits of such a measure in terms of service level. The authors used small time steps to model the different speeds of pedestrians, including those with reduced mobility, to reproduce the PVI. For structuring the algorithm that combines driver and pedestrian behavior, the authors defined two possible methods to describe the PVI. Method 1 used the vehicle speed to set, for a specific distance, if it was safe or not to start the crossing. On the other hand, in the method 2, each pedestrian is generated with an individual speed and with a specific gap acceptance assigned according to the assumed statistical distribution. The authors used four main parameters for the validation of the model, which were vehicle delay, pedestrian delay, vehicle flow, and pedestrian flow. They concluded that the method that provides the most significant and realistic results was method 1.
In 2014, a project called “Empirically based performance assessment and simulation of pedestrian behavior at unsignalized crossings” was developed by Schroeder et al. [2] in USA. The main objective of this project was to develop a new and improved algorithm to describe pedestrian and vehicle interaction at unsignalized midblock pedestrian crossings and to implement them in a traffic simulation environment. This project was focused on identifying and modeling mixed-priority (refers to crosswalk operations in which drivers at times yield to create crossing opportunities, but pedestrians may need to rely on their judgment of gaps in traffic to cross the street) crossing events at unsignalized midblock locations. The authors based the simulation on the time of passage, and once the simulation began, all the movements and decisions of the vehicle were taken before the movements and decisions of the pedestrians, at each time step. The average delay of the vehicles due to the midblock crosswalk was the variable used to compare the simulation with reality. The average delay for the simulation was 0.383 seconds, while in the field site was 0.257 seconds. The authors concluded that using the global default pedestrian parameters results in similar rates of no delay, but the average delay depends much more on site-specific flow rate. They added that although the simulation recreates reasonable delay values for a set of site-specific flow rates, it is necessary to develop the simulation to replicate the largest observed delays.
3.4.2. Results of Driver Yielding Models
Another perspective study carried out by Schroeder et al. [18] showed that drivers have a higher probability of yield to pedestrians who exhibit assertive behavior (referred to as those pedestrians who walk quickly in their approach to the crosswalk), since the probability of driver yielding increases from 13.7% to 65.5% on the presence of this pedestrian behavior. Therefore, the authors concluded that there is a strong correlation between pedestrian behavior and driver yielding. On the other hand, the authors determined three factors that influenced the reduction of the probability of driver yielding to pedestrian, which are high speeds, deceleration rates, and vehicles traveling in a platoon. This study demonstrated the importance of taking into account the dynamic restrictions of the vehicle in the evaluation of unmarked crosswalks since the variable that describes the dynamics of the vehicle (deceleration rate required to stop) in an increase of 0.305 (m/s2) decreased the probability of driver yielding by 0.68.
In the same line, the main objective analyzed by Salamati et al. [14] was to determine the factors that affect the probability of driver yielding to pedestrians at un-signalized crosswalks, in this case, located at two-lane roundabouts. Factors such as the location of the zebra (entry or exit of the roundabout), appearance of the pedestrian (blind and carried a white cane or sighted), speed of the first vehicle, lane in which the first vehicle was driving, and the number of pedestrians waiting to cross (multiple pedestrians or any pedestrians) were statistically significant for determining the probability of yielding to pedestrian. The authors demonstrated that the drivers tended to yield more often to a pedestrian who was carrying a white cane compared with a sighted pedestrian. Similarly, the results lead to the expected conclusion that drivers located in the far lane relative to the pedestrian location had a lower likelihood of yielding to a pedestrian standing at the curb than drivers located in the near lane. The study highlights that as the speed of the vehicle entering or exiting the roundabout increased, the likelihood of driver yielding decreased. Finally, the study showed that drivers exiting the roundabout had a lower likelihood of yielding to a pedestrian than drivers entering the roundabout.
Additionally, the results of the binary logistic model developed by Schneider et al. [38] to study the driver decision to yield suggested that drivers were more likely to yield to pedestrians who were white than pedestrians of other racial and ethnic backgrounds. However, the authors highlighted that the data could not determine whether specific drivers are less likely to yield because a pedestrian is a person of color. It is also important to highlight that in the final model, the age and sex of pedestrians and the driver’s demographic variables (age, sex, and race/ethnicity) were not statistically significant. Regarding the behavior of the pedestrian, it was shown that pedestrians waiting on the street to cross are more likely to give up, giving way to the vehicle than those pedestrians waiting on the sidewalk. In addition, pedestrians who indicated their intent to cross the street assertively were more likely to have drivers yield. Finally, the authors concluded that when high traffic volumes and high speeds are present near the pedestrian crossing, the probability of driver yield to pedestrian is low. The study conducted by Fricker and Zang [39] allowed to analyze and compare the PVI when a change occurred on the observed road, i.e., from one way to two ways. The authors concluded, based on more than 3400 interactions recorded in the field, that driver and pedestrian behavior change significantly when a change in the traffic direction occurred.
3.4.3. Summary of Results of Studies
Table 4 presents a summary of the most influential variables determined by each study and the main conclusion that the authors obtained.
Table 4.
Summary of results of studies (variables and main conclusions).
4. Discussion
This systematic review selected 9 articles that analysed the PVI at crosswalks not controlled by traffic lights. Of these studies, 6 developed a model for the analysis of the PVI, and 3 analysed this same interaction but focusing on what factors/variables influenced the driver yielding behavior.
Distinct methodologies were applied in the selected studies for the data collection to describe the PVI that was observed either in unsignalized crosswalks located in the mid-block or roundabouts entrances and exits. These methodologies are based on the observation technique, which is considered by Mamidipalli et al. [16] as the most used by studies that analyze the behavior of pedestrians and drivers. This technique allows capturing the fixed attributes (the type of vehicle, pedestrian characteristics, etc.) and some dynamic characteristics (vehicle and pedestrian speed, driving distance, etc.).
The studies selected in the SR applied various methodologies for the collection of information on the behavior of pedestrians and vehicles. Each of these methodologies focuses on obtaining the relevant data that allows the fulfillment of the objectives set for each study. By carrying out a detailed analysis of each of the proposed methodologies, it was possible to understand the need for a reference framework that establishes fundamental points for the collection of information in the field of pedestrian-vehicle interaction. In the absence of this frame of reference, it cannot be concluded with complete veracity which technique could best fit each context. Based on this methodological gap in the collection of PVI data at unsignalized crosswalks, the authors of this SR have developed a list of fundamental items that should be applied and reported in a methodology that seeks to obtain data on pedestrian behavior and vehicles in this type of crossings. This list of items presented in Table 5 was prepared to take into account the experience of the authors in this subject and the methodologies of the studies selected in this work. It is expected that, with the application of this list, the methodologies applied to the PVI can be compared and thus be able to define for which context the application of certain techniques would obtain better results in data collection.
Table 5.
Items for the application and reports of methodologies.
To determine which are the parameters or variables that best represent the PVI in the unsignalized pedestrian crossings, the analysed studies applied various approaches either from the perspective of the pedestrian or the vehicle. In addition, some studies have found that other events and/or factors related to the environment of the place where the pedestrian crossing is located can affect the PVI.
As shown in Table 4, the influential variables that were investigated in 4 of the 9 studies are vehicle speed, pedestrian attitudes, and number of pedestrians waiting at the crossing. It should be noted that these variables may not represent the most influential factors to the observed PVI since there are other potentially relevant variables that are not usually studied. That is the case, for example, of the existence or not of vehicle platooning.
First, the influence of a variable depends largely on the specific behavior that occurs in the study place, and second, the same set of variables in all studies should be analyzed in order to make a valid point of comparison. This is not to omit variables that may affect the interaction, which was found to influence PVI by Schroeder et al. [18]. Indeed, the authors found that when the vehicle approaches the pedestrian crossing in a platoon, the chances of the vehicle yield the pedestrian decrease.
Based on the aforementioned, the analysis of a PVI should take into account the common variables used in previous studies, allowing comparisons, but not excluding other possible variables that may represent, for instance, the social and cultural context of the places analysed.
Regarding the modeling of the PVI, various techniques have been used to represent this interaction. The cellular automaton (CA) has been highly used [4,31,32,35], which represents the movement of pedestrians and vehicles between cells over time [4]. The CA models are able to characterize complex traffic behaviors with simple and flexible transition rules accurately. Based on the results of the described studies that used this type of models for PVI (see results Section 3.4.1), we may conclude that the CA models have a great potential to simulate reality. Nevertheless, some difficulties were reported by Lu et al. [4] regarding the simulation of the heterogeneity of pedestrian speed, which was overcome by Feliciani et al. [14] when using a different approach of the CA model. Overall, and although the CA model showed to be adequate to represent the PVI, the most significant disadvantage is the complexity in implementation, since it requires specialized personnel in this area, and thus, constraining the use by decision-makers of the urban space. Additionally, difficulties may be encountered regarding the data required by the models since it may not be possible to collect it in the field, as pointed out Schroeder et al. [2].
5. Conclusions
This systematic review shows that despite the relevance of the pedestrian-vehicle interaction to road safety analysis, a lack of recent studies exists at least regarding the PVI at unsignalized crosswalks as can be concluded by the low number of selected manuscripts.
From the analysed studies, it was possible to set a guide for the collection of information needed to investigate the PVI as well as to support the selection of the methodology to be used. Overall, this SR provided the following main conclusions:
- (1)
- Each study used distinct data, variables, and techniques, which difficult the use of a common approach and, thus, a reliable comparison of the results that would allow to identify clearly the risk factors associated to PVI and, therefore, common policies to be implemented.
- (2)
- In general, the heterogeneity of the pedestrians, drivers, vehicles, and road environment is not clearly considered in the modelling process. Age and sex of pedestrians and drivers are the main common variables used to assume distinct behaviors on the PVI.
- (3)
- Although studies exist focusing on driver and pedestrian decision-making process, it is not clear how the findings of these particular studies are considered in the micro-simulation process.
From these main conclusions, the lack of a harmonized approach to guide the PVI analysis covering all tasks (from the data collection until the modelling) is obvious. The recent robust technology that has been developed considering the video recording analysis of field observations may contribute to the use of a common data collection and, thus, the use of common variables obtained by similar processes. Additionally, and although robust mathematical models have been developed and/or used for the analysis of the PVI, a lack of PVI algorithms in commercial traffic simulation software was noticed. The use of commercial simulation software allows the analysis of distinct microscopic environments, providing a tool to optimize the decision-making of engineering practitioners in terms of road infrastructure and pedestrian safety.
Author Contributions
Conceptualization: H.A., E.F., P.R. and J.P.T.; Method application; H.A.; Studies’ reviewers: S.F. and J.P.T; Writing—original draft preparation: H.A. and S.F.; writing—review and editing: H.A., E.F. and P.R. All authors have read and approved the final manuscript.
Funding
This research was funded by “Fundação para a Ciência e a Tecnologia”, through the project AnPeB–Pedestrian behavior analysis based on simulated environments and their incorporation into risk modeling (PTDC/ECMTRA/3568/2014)
Conflicts of Interest
The authors declare no conflict of interest.
References
- World Health Organization. Global Status Report on Road Safety 2018; World Health Organization: Geneva, Switzerland, 2018. [Google Scholar]
- Schroeder, B.; Rouphail, N.; Salamati, K.; Hunter, E.; Phillips, B.; Elefteriadou, L.; Chase, T.; Zheng, Y.; Sisiopiku, V.; Mamidipalli, S. Empirically-based performance assessment and simulation of pedestrian behavior at unsignalized crossings. Southeastern Transportation Research, Innovation, Development and Education Center (STRIDE). 2014. Available online: https://stride.ce.ufl.edu/wp-content/uploads/2017/03/Schroeder-STRIDE-2012-016S-Final-Report.pdf (accessed on 30 March 2020).
- Peden, M.; Scurfield, R.; Sleet, D.; Mohan, D. Informe Mundial Sobre Prevención De Los Traumatismos Causados Por El Tránsito; Organización Mundial de la Salud: Washington, DC, USA, 2004. [Google Scholar]
- Lu, L.; Ren, G.; Wang, W.; Chan, C.; Wang, J. A cellular automaton simulation model for pedestrian and vehicle interaction behaviors at unsignalized mid-block crosswalks. Accid. Anal. Prev. 2016, 95, 425–437. [Google Scholar] [CrossRef] [PubMed]
- Fu, T.; Miranda-Moreno, L.; Saunier, N. A novel framework to evaluate pedestrian safety at non-signalized locations. Accid. Anal. Prev. 2018, 111, 23–33. [Google Scholar] [CrossRef] [PubMed]
- David, N.K. The role of the physical environment in child pedestrian accidents. J. Adv. Transp. 1994, 28, 171–187. [Google Scholar] [CrossRef]
- Lloyd, D.; Wilson, D.; Mais, D.; Deda, W.; Bhagat, A. Reported Road Casualties Great Britain: 2014 Annual Report; Department for Transport: London, UK, 2015.
- I. Nazionale Di Statistica, Road Accidents in Italy. Available online: https://www4.istat.it/en/archive/203775 (accessed on 8 November 2019).
- Zegeer, C.V.; Richard Stewart, J.; Huang, H.; Lagerwey, P. Safety effects of marked versus unmarked crosswalks at uncontrolled locations: Analysis of pedestrian crashes in 30 cities. Transp. Res. Rec. 2001, 1773, 56–68. [Google Scholar] [CrossRef]
- Pfortmueller, C.A.; Marti, M.; Kunz, M.; Lindner, G.; Exadaktylos, A.K. Injury severity and mortality of adult zebra crosswalk and non-zebra crosswalk road crossing accidents: A cross-sectional analysis. PLoS ONE 2014, 9, e90835. [Google Scholar] [CrossRef] [PubMed]
- Fitzpatrick, K.; Turner, S.; Brewer, M.A. Improving pedestrian safety at unsignalized intersections. Inst. Transp. Eng. ITE J. 2007, 77, 34. [Google Scholar]
- Golakiya, H.M.; Patkar, M.; Dhamaniya, A. Impact of Midblock Pedestrian Crossing on Speed Characteristics and Capacity of Urban Arterials. Arab. J. Sci. Eng. 2019, 44, 8675–8689. [Google Scholar]
- Feliciani, C.; Crociani, L.; Gorrini, A.; Vizzari, G.; Bandini, S.; Nishinari, K. A simulation model for non-signalized pedestrian crosswalks based on evidence from on field observation. Intell. Artif. 2017, 11, 117–138. [Google Scholar] [CrossRef]
- Salamati, K.; Schroeder, B.; Geruschat, D.R.; Rouphail, N. Event-based modeling of driver yielding behavior to pedestrians at two-lane roundabout approaches. Transp. Res. Rec. 2013, 2389, 1–11. [Google Scholar] [CrossRef]
- Suh, D.; Ukkusuri, S.; Benekohal, R.; Waller, S. Modeling pedestrian crossing activities in an urban environment using microscopic traffic simulation. Transp. Res. Rec. 2013, 89, 213–224. [Google Scholar] [CrossRef]
- Mamidipalli, S.V.; Sisiopiku, V.P.; Schroeder, B.J.; Elefteriadou, L.; Salamati, K.; Rouphail, N. Probit-based pedestrian gap acceptance model for midblock crossing locations. Transp. Res. Rec. 2015, 2519, 128–136. [Google Scholar] [CrossRef]
- Sun, D.; Ukkusuri, S.; Benekohal, R.; Waller, S. Modeling of Motorist-Pedestrian Interaction at Uncontrolled Mid-Block Crosswalks; Transportation Research Record: Washington, DC, USA, 2003. [Google Scholar]
- Schroeder, B.J.; Rouphail, N.M. Event-based modeling of driver yielding behavior at unsignalized crosswalks. J. Transp. Eng. 2010, 137, 455–465. [Google Scholar] [CrossRef]
- Schneider, R.J.; Sanatizadeh, A.; Shaon, M.; He, Z.; Qin, X. Exploratory analysis of driver yielding at low-speed, uncontrolled crosswalks in Milwaukee, Wisconsin. Transp. Res. Rec. 2018, 2672, 21–32. [Google Scholar] [CrossRef]
- Liu, M.; Zeng, W.; Chen, P.; Wu, X. A microscopic simulation model for pedestrian-pedestrian and pedestrian-vehicle interactions at crosswalks. PLoS ONE 2017, 12, e0180992. [Google Scholar]
- Wang, T.; Wu, J.; McDonald, M. A micro-simulation model of pedestrian-vehicle interaction behavior at unsignalized mid-block locations. In Proceedings of the 15th International IEEE Conference on Intelligent Transportation Systems, Anchorage, AK, USA, 16–19 September 2012; pp. 1827–1833. [Google Scholar]
- Papadimitriou, E.; Yannis, G.; Golias, J. A critical assessment of pedestrian behaviour models. Transp. Res. Part F Traffic Psychol. Behav. 2009, 12, 242–255. [Google Scholar] [CrossRef]
- Moher, D.; Liberati, A.; Tetzlaff, J.; Altman, D.G.; Group, P. Preferred Reporting Items for Systematic Reviews and Meta-Analyses: The PRISMA Statement. Ann. Intern. Med. 2009, 151, 264–269. [Google Scholar] [CrossRef]
- Liberati, A.; Altman, D.; Tetzlaff, J.; Mulrow, C.; Gotzche, P.; Ioannidis, J.; Clarke, M.; Devereaux, P.; Kleijnen, J. The PRISMA statement for reporting systematic reviews and meta-analyses of studies that evaluate health care interventions: Explanation and elaboration. PLoS Med. 2009, 6, e1000100. [Google Scholar] [CrossRef]
- Saunier, N.; Sayed, T.; Ismail, K. Large-scale automated analysis of vehicle interactions and collisions. Transp. Res. Rec. 2010, 2147, 42–50. [Google Scholar] [CrossRef]
- Bobermin, M.P.; Silva, M.M.; Ferreira, S.; Guedes, J.C.; Baptista, J.S. Driving simulator for evaluating the effects of road geometric design on driver behavior. Int. J. Occup. Environ. Saf. 2019, 3, 46–51. [Google Scholar] [CrossRef]
- Nunez, A. Sources of Errors and Biases in Traffic Forecasts for Toll Road Concessions. Ph.D. Thesis, Economics and Finance. Université Lumière-Lyon II, Lyon, France, 2007. [Google Scholar]
- Jang, S.; Rasouli, S.; Timmermans, H.J. Bias and sources of error in discrete choice models: A critical reflection. In Proceedings of the 13th International Conference on Design and Decision Support Systems in Architecture and Urban Planning, DDSS 2016, Eindhoven, The Netherlands, 27–28 June 2016; pp. 1–28. [Google Scholar]
- U.D. of H.&H. Services. National Heart, Lung, and Blood Institute: Study Quality Assessment Tools, 2019. Available online: https://www.nhlbi.nih.gov/health-topics/study-quality-assessment-tools. (accessed on 1 June 2019).
- Ottomanelli, M.; Iannucci, G.; Sassanelli, D. Simplified Model for Pedestrian–Vehicle Interactions at Road Crossings Based on Discrete Events System. Transp. Res. Rec. 2012, 2316, 58–68. [Google Scholar] [CrossRef]
- Chen, P.; Wu, C.; Zhu, S. Interaction between vehicles and pedestrians at uncontrolled mid-block crosswalks. Saf. Sci. 2016, 82, 68–76. [Google Scholar] [CrossRef]
- Blue, V.J.; Adler, J.L. Cellular automata microsimulation for modeling bi-directional pedestrian walkways. Transp. Res. Part B Methodol. 2001, 35, 293–312. [Google Scholar] [CrossRef]
- Ren, G.; Lu, L.; Wang, W.; Gong, X.; Huang, Z. Microscopic simulation model for pedestrian flow at signalized crosswalks. Transp. Res. Rec. 2014, 2434, 113–122. [Google Scholar] [CrossRef]
- Wu, W.; Chen, R.; Jia, H. Game theory modeling for vehicle-pedestrian interactions and simulation based on cellular automata. Int. J. Mod. Phys. 2019, 30, 1–21. [Google Scholar] [CrossRef]
- Xie, D.; Gao, Z.; Zhao, Z.; Wang, D.Z. Cellular automaton modeling of the interaction between vehicles and pedestrians at signalized crosswalk. J. Transp. Eng. 2012, 138, 1442–1452. [Google Scholar] [CrossRef]
- Zheng, Y.; Chase, R.T.; Elefteriadou, L.; Sisiopiku, V.; Schroeder, B. Driver types and their behaviors within a high level of pedestrian activity environment. Transp. Lett. 2017, 9, 1–11. [Google Scholar] [CrossRef]
- Van Houten, R.; Malenfant, J.E.; Blomberg, R.; Huitema, B.; Hochmuth, J. High-Visibility Enforcement on Driver Compliance with Pedestrian Right-of-Way Laws: 4-Year Follow-Up. Transp. Res. Rec. 2017, 2660, 58–65. [Google Scholar] [CrossRef]
- Schneider, R.; Qin, X.; Rahman, M.; Sanatizadeh, A.; He, Z.; Wykhuis, P. Evaluation of Driver Yielding to Pedestrians at Uncontrolled Crosswalks; University of Wisconsin-Madison Traffic Operations and Safety (TOPS) Laboratory: Madison, WI, USA, 2017. [Google Scholar]
- Fricker, J.D.; Zhang, Y. Modeling pedestrian and motorist interaction at semi-controlled crosswalks: The effects of a change from one-way to two-way street operation. Transp. Res. Rec. 2019, 2673, 433–446. [Google Scholar] [CrossRef]
© 2020 by the authors. Licensee MDPI, Basel, Switzerland. This article is an open access article distributed under the terms and conditions of the Creative Commons Attribution (CC BY) license (http://creativecommons.org/licenses/by/4.0/).