Article

Development of Self-Assessment Indicators for Motorcycle Riders in Thailand: Application of the Motorcycle Rider Behavior Questionnaire (MRBQ)

by
Savalee Uttra
1,
Sajjakaj Jomnonkwao
1,*,
Duangdao Watthanaklang
2 and
Vatanavongs Ratanavaraha
1
1
School of Transportation Engineering, Institute of Engineering, Suranaree University of Technology, Nakhon Ratchasima 30000, Thailand
2
Department of Construction Technology, Faculty of Industrial Technology, Nakhon Ratchasima Rajabhat University, Nakhon Ratchasima 30000, Thailand
*
Author to whom correspondence should be addressed.
Sustainability 2020, 12(7), 2785; https://doi.org/10.3390/su12072785
Submission received: 28 February 2020 / Revised: 27 March 2020 / Accepted: 31 March 2020 / Published: 1 April 2020
(This article belongs to the Section Sustainable Transportation)

Abstract

:
The purposes of this research are (1) to create a motorcycle riding behavior measurement model for a Thai population by Motorcycle Rider Behavior Questionnaire (MRBQ) modification with exploratory factor analysis (EFA); (2) to verify the measurement model by second-order confirmatory factor analysis (second-order CFA); and (3) to define the guidelines of the self-assessment report for Thai people in terms of riding motorcycles. Collected data were distributed among four areas: metro-municipalities, municipalities, district municipalities, and non-municipalities from five regions. The sample consisted of 1516 motorcycle riders who were at least 20 years old. Of these riders, 91.4% had motorcycle riding licenses, 84.4% had over five years of experience in motorcycle riding, 75.5% used a motorcycle to go to work/study, and 82.1% used a helmet sometimes. Exploratory factor analysis (EFA) and second-order confirmatory factor analysis (second-order CFA) were used for measurement model creation. The results presented 26 indicators that were confirmed to compose the motorcycle riding behavior of Thai people at a statistical significance level of α = 0.05; these were separated into four factors, namely, traffic error, control error, stunts, and safety equipment. The results of this MRBQ study can inform future study of the motorcycle riding behavior of Thai people.

1. Introduction

Following Africa, the Southeast Asia region has the second-highest death rate from road accidents at a rate of 20.7 people per 100,000. Comparing all vehicles, 43% of accidents involve motorized two- and three-wheelers, and 74% of motorized accidents happened in Thailand. In the study of factors influencing rider behavior, the Motorcycle Rider Behavior Questionnaire (MRBQ) has been widely utilized to analyze motorcycle riding behavior and specify risky behavior that leads to accidents. The purpose of this research is to create a motorcycle riding behavior measurement model for a Thai population by MRBQ modification with exploratory factor analysis (EFA), to verify the measurement model by second-order confirmatory factor analysis (second-order CFA), and to define guidelines for a self-assessment report for a Thai population in terms of riding motorcycles.
Firstly, the background and importance of this research will be reviewed, and the research objectives are stated in Section 1.3. The procedure, materials, and participants are presented in Section 2. The results of the study, including statistical test values (reliability, correlation, and model estimates), are presented in Section 3. We discuss the research in Section 4. Finally, Section 5 concludes the paper, explains the limitations of the research, and proposes future work.
The contributions of this research can be used for the creation of a riding self-assessment report. The assessment process should be organized before the enrolment or renewal process of obtaining a motorcycle riding license. The self-assessment results can indicate the risky riding behavior levels of examinees. The related organization can primarily classify the behavior of riders and assign different intensive courses to let them realize risky behavior perception and improve riding habits.

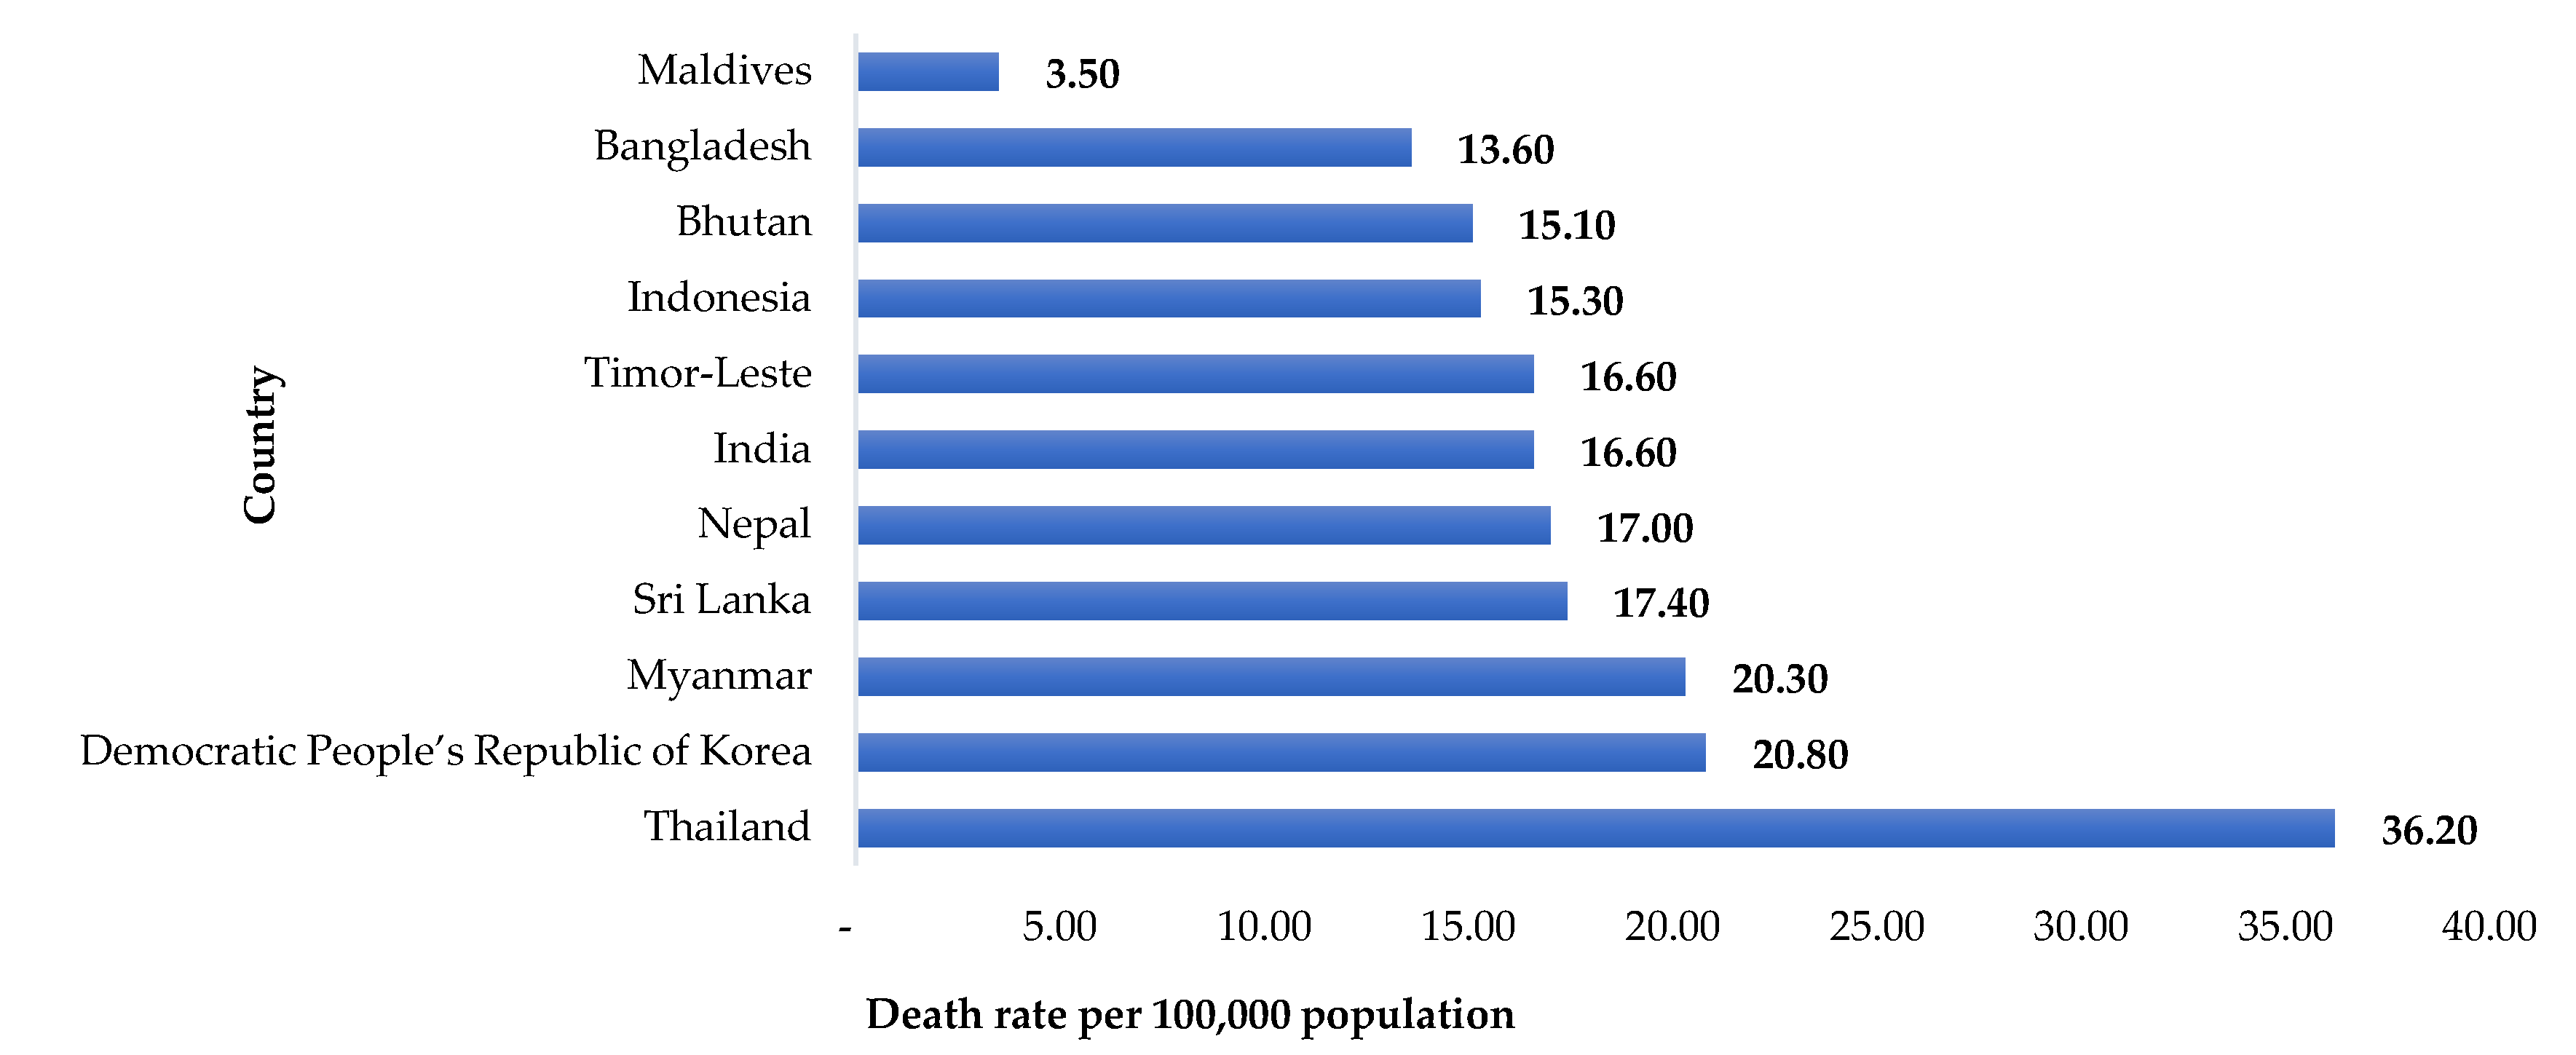
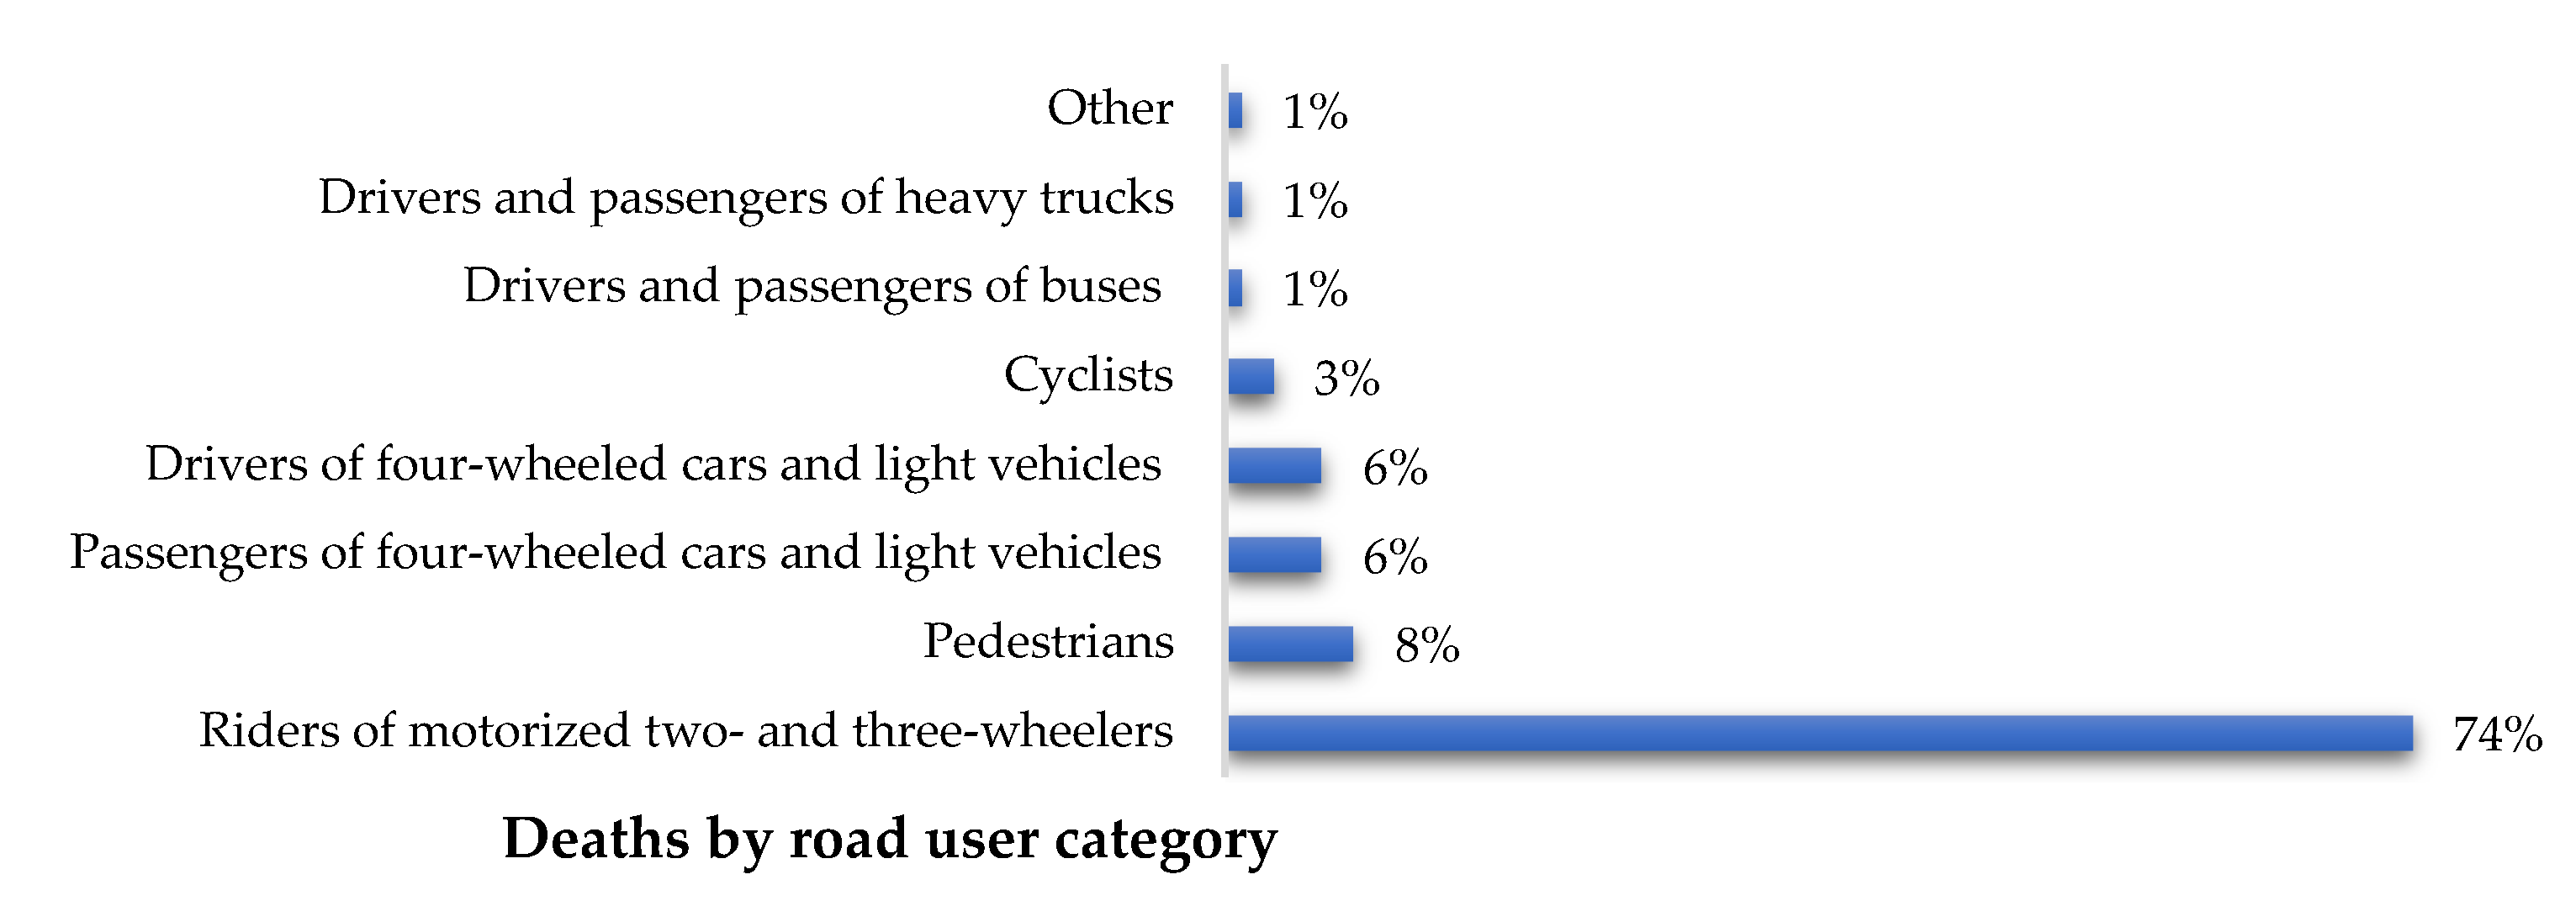
1.1. Motorcycle Accident Situation

The WHO reported that 1.35 million people died from road accidents in 2016, a rate of 18.2 per 100,000 people. The highest death rate was for people aged between 5 and 29 years old. Considering geographical regions, the Southeast Asia region had the second-highest death rate from road accidents at a ratio of 20.7 per 100,000 people, following only Africa at a ratio of 26.6 per 100,000. Of these accidents, 43% involved motorized two- and three-wheelers [1]. Moreover, the WHO stated that Thailand had the highest death rate in the WHO Southeast Asia Region countries at 36.2 per 100,000 people, followed by the Democratic People’s Republic of Korea at 20.80, Myanmar at 20.30, and Sri Lanka at 17.40 (Figure 1).
The WHO [1] also present Thai road accident death rates by road user category (Figure 2). These include Thai citizens who were riders of motorized two- and three-wheelers (74%), pedestrians (8%), passengers of four-wheeled cars and light vehicles (6%), and drivers of four-wheeled cars and light vehicles (6%).
A worldwide status report shows that motorcycle accidents are the most serious accidents in Thailand. In 2019, the Department of Land Transport [3] reported that there were 21,222,053 registered motorcycles, comprising 53.87% of all vehicles, while car driving license holders made up 29.72%. Furthermore, there were 13,449,697 (39.88% of registered motorcycles) motorcycle riding license holders, including 1,144,168 temporary one-year licenses (8.51%), 6,339,641 five-year licenses (47.14%), and 6,339,641 lifelong licenses (44.36%). The Royal Thai Police [4] reported that 32,040, 33,138, and 40,431 motorcycle accidents occurred in the three years 2017, 2018, and 2019, respectively. The accident rate in 2019 increased from those in 2018 (by 22%) and 2017 (by 26%).
The above cumulative registered vehicles and driving license holder statistics show that Thai citizens mainly use motorcycles for traveling, and also show that motorcycles have the highest accident rate compared to other vehicles. Therefore, research into the use of motorcycles by Thai people and the aspects related to motorcycle accidents is a worthwhile area of research.
The causes of road accidents include humans, vehicles, and the environment. The human factor is the major factor in accidents [5,6]. The Royal Thai Police [7] state that the main causes of road accidents are the road user (65%), traffic signs/traffic lights (27%), the environment (2%), and other (6%). As cited in Evans [8], Shinar [6] states that human factors influence up to 95% of accidents, while road environment factors and vehicle factors influence 28% and 8%, respectively, as shown in Figure 3. Therefore, we focus on human factors in this research and aim to study the behaviors of motorcycle riders.

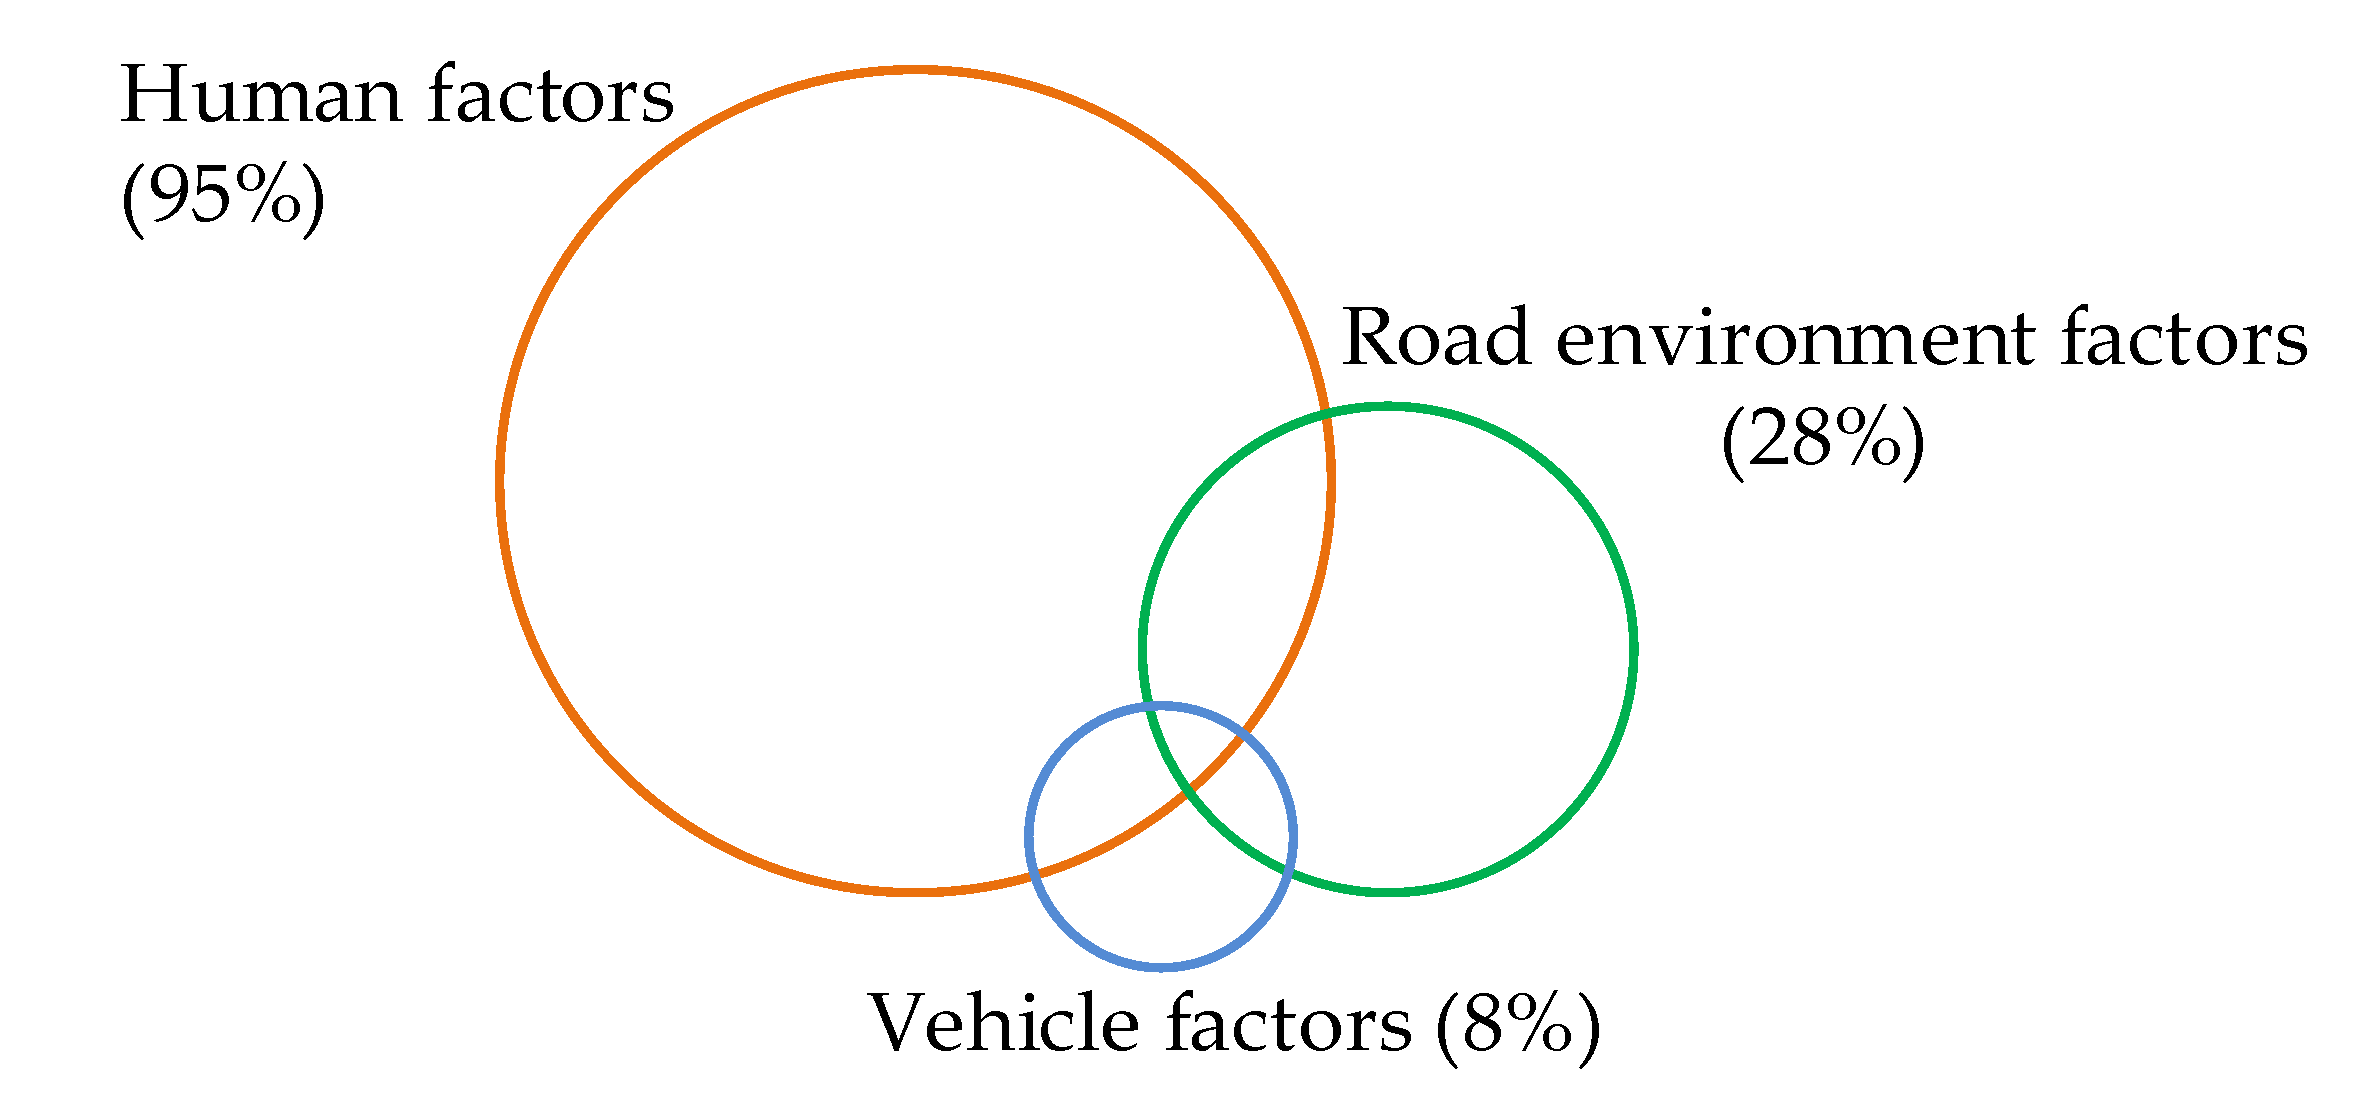
1.2. Studies on Human Factors of Riding Behaviors

There are many factors related to riding behavior and accidents, and the studies concerning them are summarized in Table 1. Elliott et al. [9] were the first to study and develop the Motorcycle Rider Behavior Questionnaire (MRBQ) in order to determine factors influencing rider behavior. They used principal component analysis (PCA) to classify a model of factors that include traffic errors, control errors, speed violations, performance of stunts, and use of safety equipment. In total, there are 43 measurement items. Then, linear modeling was used, considering age, experience, mileage, and time duration of driving. This preliminary study found that traffic errors, control errors, and speed violations are factors that can predict the risk of an accident.
Further studies have also used the MRBQ. For example, Özkan et al. [10] implemented the MRBQ for Turkish citizens considering traffic errors, control errors, speed violations, performance of stunts, and use of safety equipment. The study found that annual mileage was highly correlated with rider accidents in the case of active and passive accidents and offenses, while rider age had a lower correlation. The stunt factor was the main factor in accidents and offenses, while speeding violations were the major factor in traffic violations. Sakashita et al. [11] implemented the MBRQ with a group of new drivers in Australia. To fit the sample group, confirmatory factor analysis (CFA) was used; the factors with factor adjustment became control errors, speeding violations, stunts, and protective gear. Another study by Stephens et al. [12] studied the correlation between MBRQ and accidents in Australia. The study found that drivers used safety equipment and refrained from risky behaviors. Although speeding violations and control errors did not frequently happen, they were correlated with the possibility of accidents. Moreover, behavior related to stunts increased the risk of accident.
There are several studies that evaluate accident risk with methods beyond the MRBQ. Lin and Kraus [13] studied factors including alcohol consumption, lack of riding experience, turning on the front light during daytime, riding license, speed, and risky motorcycle riding behavior and their relationship to injury. A study by Hongsranagon et al. [14] found that 33.8% of respondents had experienced an accident. The major factors were human behavior, e.g., safety law violation (76.8%) or drunk driving (65.0%). Stephan et al. [15] studied a group of young men aged between 15 and 19 years old who had engaged in drunk driving behavior. Vlahogianni et al. [16] concluded that risky behavior includes rider attitude, riding style, rider mistakes, traffic law violations, rider indecision, gender, age, experience, education, fatigue, alcohol, and additional safety equipment. A study by Moskal et al. [17] found that being male, not wearing a helmet, being aged between 14–20 years, alcohol level in the blood, and travel objective (to study/to work) are factors that increase a rider’s risk of accidents. Sukor et al. [18] considered the influence of speeding violations and non-helmet-wearing on accidents involving motorcycle riders in Malaysia; psychological factors were found to effect risky behaviors, speeding, and helmet wearing behaviors.
Keall and Newstead [19] studied New Zealanders, among whom the use of motorcycles is increasingly popular, to address concerns about the increase in road accidents. The study found that motorcycle riders who are over 20 years old and live in urban areas have a risk of injury eight times higher than that for car drivers. Chung and Wong [20] studied a group of youths (18–28 years old) to examine and approximate the factors influencing risky behavior. The study found that expressions of anger affect risky riding behavior more in men than in women.
Finally, Kankrong Piyaprai [21] studied Thai teenagers and found that driving behavior in terms of breaking traffic laws, speeding violations, and chaotic riding put riders at the highest risk of accidents. De Rome et al. [22] studied the diversity of risk factors of motorcycle rider accidents relating to general information, namely, age, gender, types of riding license, occupation, education level, traveling behavior, number of riding hours per week, riding experience, traffic law violations in the past three years, near misses in the past one year and three years, and the use of additional safety equipment. The study results showed that this basic information on motorcycle riders can be utilized as a development and improvement guideline for different age groups of motorcycle riders. These studies are summarized in Table 1.

1.3. Research Objectives and Contributions

The above discussion has highlighted the need for research into motorcycle use in Thailand. Previous research has appropriately applied the MBRQ in the context of various geographical areas and study samples. However, there has so far been no research focused on a self-assessment prototype based on variables, indicators, or factors including a case study in Thailand, which has the world’s top motorcycle accident rate, or measurement model analysis with second-ordered CFA.
The objectives of this research were (1) to create a motorcycle riding behavior measurement model for a Thai population by modifying the MRBQ with exploratory factor analysis (EFA); (2) to verify the measurement model via second-order confirmatory factor analysis (second-order CFA); and (3) to define the guidelines for a self-assessment report for Thai people in terms of riding motorcycles. Thus, our research questions are as follows: (1) Which indicators can be measured by MRBQ? (2) Which question items have a high loading factor and can be utilized in a prototype self-assessment report for motorcycle riders in Thailand? Lastly, we have defined a hypothesis, H1, for this research. H1 states that MRBQ can be appropriately utilized to study the motorcycle riding behavior of Thai people.

2. Materials and Methods
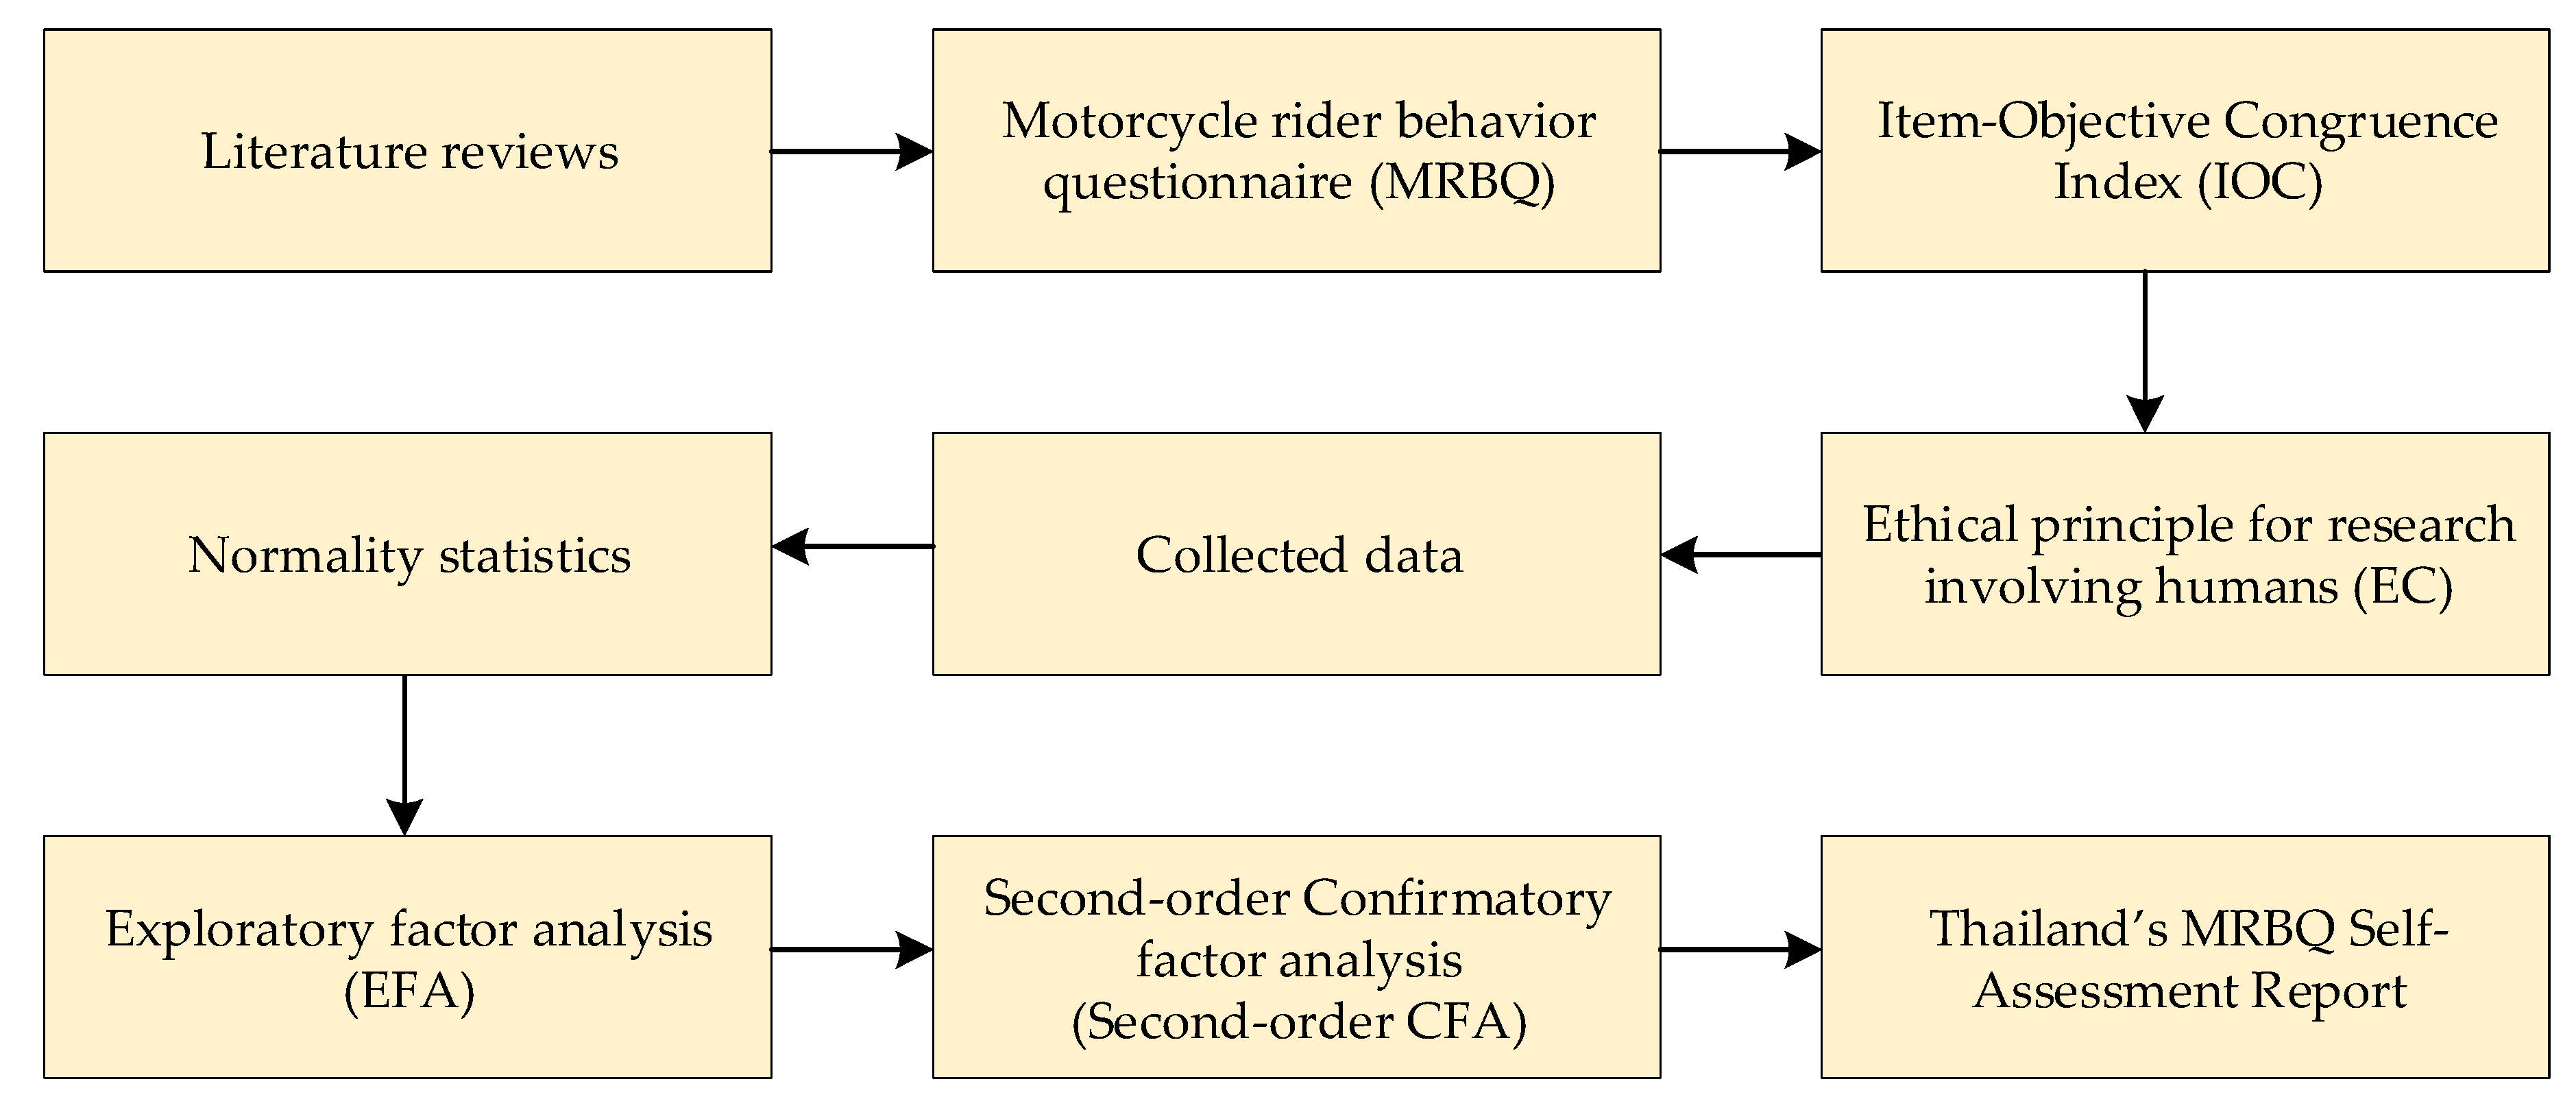
2.1. Procedure

The procedure of the research involved studying previous research related to motorcycle riding behaviors. The MBRQ was utilized as a tool to study and collect the data. The item–objective congruence index (IOC) was studied via questionnaire by experts who were specialists in screening research tools. Human research ethics application documents were submitted, and the ethics evaluation result was that the study was of low risk. Data were collected from across the country. The collected data were verified as following a normal distribution. We utilized exploratory factor analysis (EFA) to filter observed variables of the same group and eliminate some factors to fit with the model. Second-order confirmatory factor analysis (second-order CFA) was utilized to create a model confirming motorcycle riding behavior measurement in order to select variables and factors that could be used in a self-assessment report, as shown in Figure 4.

2.2. Materials and Participants

2.2.1. The Motorcycle Rider Behavior Questionnaire (MRBQ)

The Motorcycle Rider Behavior Questionnaire (MRBQ) was studied and created as a frequency evaluation report of motorcycle riding by Elliott et al. [9]. They developed the MRBQ based on the Driver Behavior Questionnaire (DBQ) by Reason et al. [23]. Elliott et al. [9] developed 43 MRBQ indicators, each with a 6-point scale (1 = never, 2 = sometimes, 3 = often, 4 = always, 5 = nearly all the time, 6 = all the time), and let questionnaire respondents select one answer per question item. Rider behaviors were measured in terms of five measurement factors, namely, traffic errors, speed violations, stunts, safety equipment, and control errors.
Traffic errors were the main factor in mistakes or wrong decisions made during motorcycle riding, with 13 indicators. Behaviors of riding over the speed limit were “speed violations”, with 12 indicators. Moreover, thrill-seeking riding behaviors were defined by the factor of “stunts”, with 7 indicators. The use of safety equipment to increase safety while riding formed the variable “safety equipment”, with 8 indicators. Finally, “control errors” represented errors in vehicle control and slipping, with 7 indicators [9].
Furthermore, personal information was requested in the questionnaire, including gender, age, motorcycle riding license holding, type of motorcycle riding license, motorcycle riding experience, helmet wearing behavior, and purpose and frequency of riding.

2.2.2. Participants

The appropriate number of samples needed to analyze a model was presented by Golob [24] and is n = 15 times the number of observed indicators [25]. The MBRQ was used for collecting and surveying data with 38 observed indicators after the IOC process. Therefore, the number of samples had to be higher than 570 to be sufficient.
The samples in this research numbered 1516, collected from all parts of Thailand; this is enough for analysis according to the recommendation. The samples were distributed between four areas, which were metro-municipality, municipality, district municipality, and non-municipality areas, providing 268, 442, 587, and 219 samples, respectively. These were also from five regions, namely, the Bangkok metropolitan region, central region, northeastern region, north region, and south region, as shown in Table 2. Respondents were those above 20 years old with motorcycle riding ability and experience who did or did not have a riding license.

2.2.3. Sample Characteristics

The general data of the respondents are shown in Table 3. The respondents were males (59.6%) and females (40.4%) older than 20 years old. Most of them (39.2%) were 25–34 years old. Of the respondents, 91.4% had a motorcycle riding license while 8.6% did not. For the motorcycle riding license group, 70.3% had a five-year temporary license, 26.3% had 6–10 years of riding experience, and 24.7% had over 20 years of riding experience. For frequency of riding, 36.5% reported 4–6 days a week, while 35% reported riding every day. In terms of helmet wearing behavior, 61.3% responded with “often”, while 20.8% responded “sometimes”. The purpose of riding a motorcycle was to attend study/work for 75.5% of the respondents.

2.2.4. Hypothesis Testing

Regarding the hypothesis, H1, of this research, the MRBQ was appropriately utilized to study the motorcycle riding behavior of Thai people from the 43 MRBQ indicators developed by Elliott et al. [9].
The hypothesis was tested using the following criteria of goodness-of-fit statistics: value of chi-square/df of <5 (Hu and Bentler [26]), root mean square error (RMSEA) of <0.08 [27,28], standardized root mean square residual (SRMR) of <0.08 [26], comparative fit index (CFI) of ≥0.90 [26], and Tucker–Lewis index (TLI) of ≥0.80 [29,30].

3. Results

3.1. Normality and Correlation

After the IOC process, 38 MBRQ indicators remained to collect data. EFA data analysis was utilized in factor analysis of the 38 observed indicators for the indicator grouping process. We considered only factors with a loading factor of ≥0.3 [31]. There were 26 such indicators for the measurement model analysis process. The Kaiser–Meyer–Olkin (KMO) statistic was 0.886, which was appropriate for factor analysis [32]. Indicators were grouped and separated into four groups: traffic errors (X1–X11), control errors (X12–X20), stunts (X21–X23), and safety equipment (X24–X26). These are shown in Table 4.
The results of statistical testing of the indicators show that the mean was 1.12–2.59, the standard deviation (SD) was between 0.343 and 1.095, skewness was between 0.000 and 2.774, and kurtosis was between −1.237 and 7.107. The skewness and kurtosis were lower than 3 and 10, respectively [33], as shown in Table 4.
The correlation of variables, after correlation testing at a p-value of <0.01, was between 0.297 and 0.624. The correlation values between traffic errors and control errors, stunts, and safety equipment were 0.624, 0.364, and 0.297, respectively. The correlation values of control errors with stunts and safety equipment were 0.386 and 0.290, respectively. Furthermore, the correlation value between stunts and safety equipment was 0.474, as shown in Table 5.

3.2. Reliability

We tested the accuracy of indicators using Cronbach’s alpha, which must be greater than or equal to 0.7 to indicate reliability [34]. The analysis results showed that traffic errors, control errors, stunts, and safety equipment had Cronbach’s alpha values of 0.925, 0.887, 0.747, and 0.831, respectively, which met the criterion defined by Nunnally [34], as shown in Table 6.
The composite reliability index (CRI), as a measure of the internal consistency construct, and average variance extracted (AVE) values were analyzed for each factor with criteria of CRI ≥ 0.7 and AVE ≥ 0.5 [35]. The analysis results showed that the CRI values from traffic errors, control errors, stunts, and safety equipment were 0.922, 0.897, 0.731, and 0.706, respectively. The AVE values from traffic errors, control errors, stunts, and safety equipment were 0.716, 0.666, 0.733, and 0.662, respectively. All CRI and AVE values met the analysis criteria, as shown in Table 6.

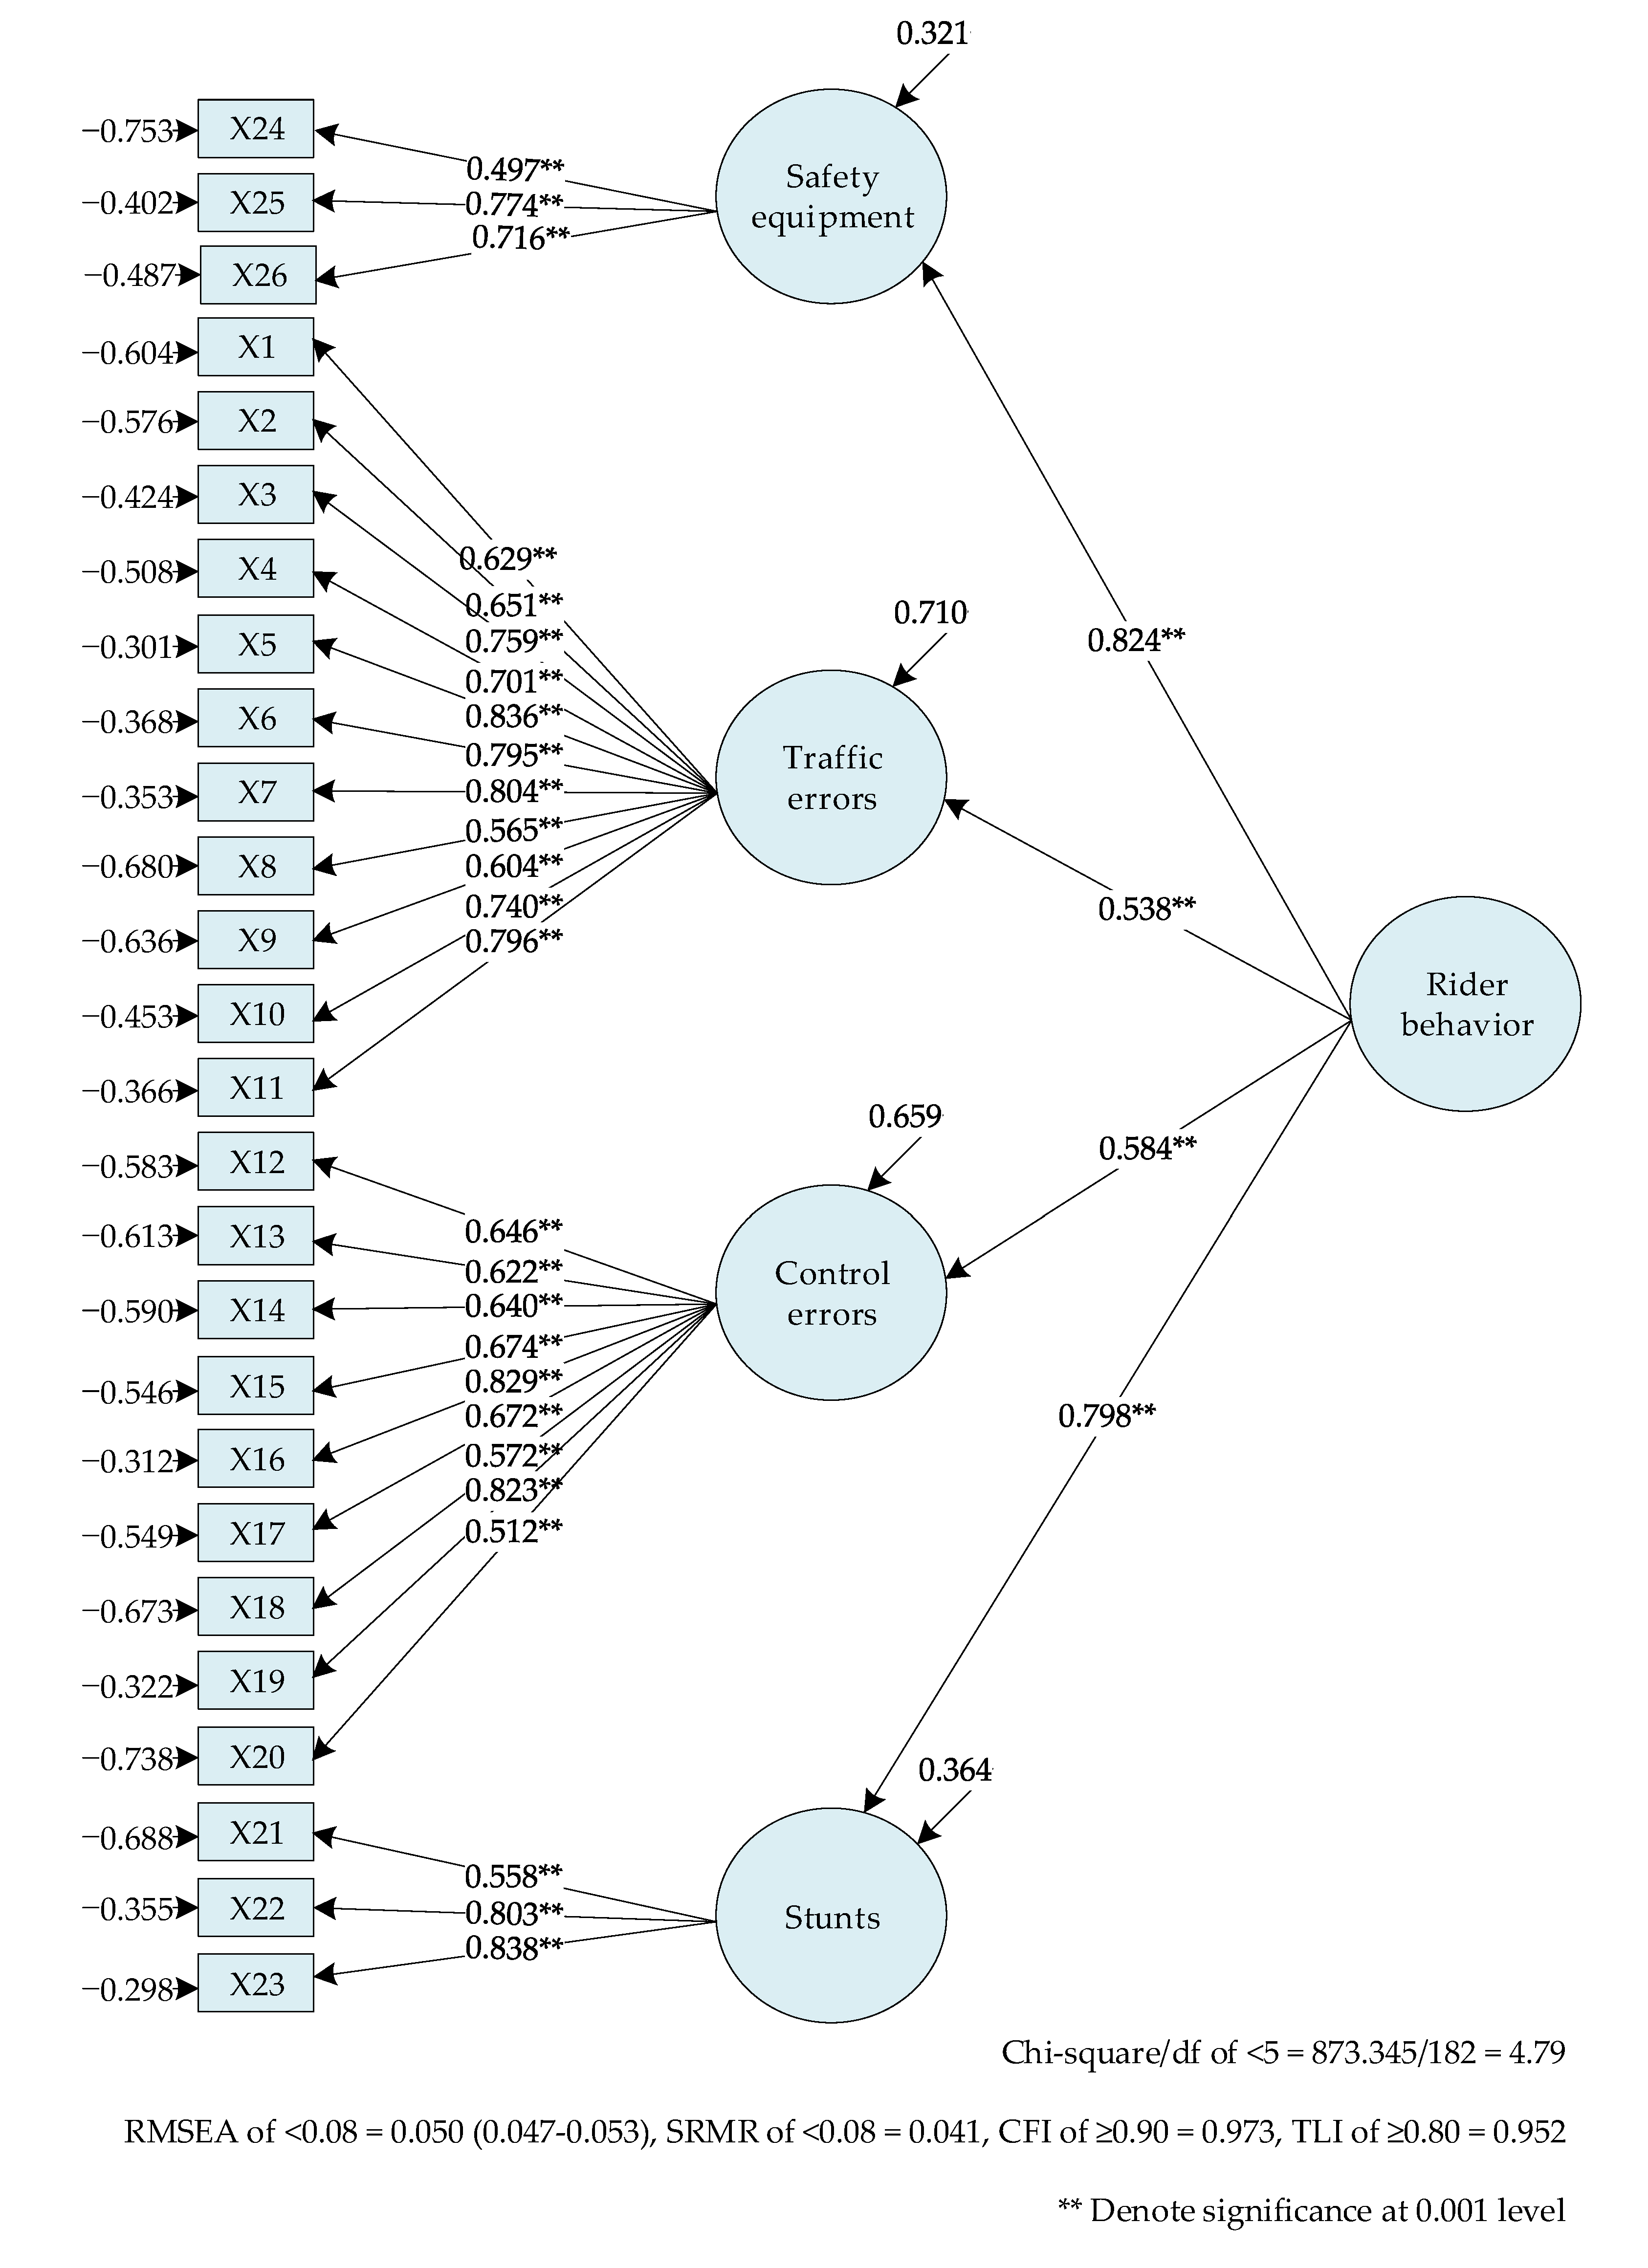
3.3. Model Parameter Estimation

Confirmatory factor analysis (CFA) was used for the measurement of model creation. After the EFA analysis process, there were four factors (traffic errors, control errors, stunts, and safety equipment) for measuring motorcycle riding behavior with 26 indicators. Every indicator had a significance level of 0.01.
From the analysis results of H2, the MRBQ can measure the motorcycle riding behavior of Thai people by second-order CFA. The top five indicators with the highest loading factors in terms of traffic errors were X5 “Ignoring the “GIVE WAY” sign when driving on narrow roads and not letting a driver from the other lane proceed”, X7 “If no other cars are on the road, you continue to go straight without considering red traffic lights”, X11 “Violating red traffic lights”, X6 “Overtaking without giving a signal in advance”, and X3 “Not stopping the motorcycle at zebra crossings to let pedestrians cross the road”, with loading factors of 0.836, 0.804, 0.796, 0.795, and 0.759, respectively.
For control error factors, it was found that X16 and X19, “Failing to control the motorcycle when using high speed” and “Parking the motorcycle in prohibited area”, had loading factors of 0.829 and 0.823, respectively. In terms of stunts, X23 “Cutting other vehicles off/overtaking at close range” and X22 “Purposely doing a wheel spin” had the highest loading factors at 0.838 and 0.803, respectively. Among safety equipment factors, X25 “Wearing a protective riding suit for body, elbow, and shoulder protection” and X26 “Wearing motorcycle gloves” had the highest loading factors at 0.774 and 0.716, respectively, as shown in Table 6.
When creating measurement modes as second-order CFA to measure motorcycle riding behavior, the second-order CFA was created with the highest loading factors of 0.824 for safety equipment, 0.798 for stunts, 0.584 for control errors, and 0.538 for traffic errors. The R2 values were 0.290, 0.341, 0.639, and 0.679, respectively.
The results of model measurement were chi-square = 873.345 and df = 182. Therefore, the goodness-of-fit statistics had values of chi-square/df = 4.79, which was lower than 5 (Hu and Bentler [26]). Furthermore, RMSEA = 0.050 (0.047–0.053) < 0.08 [27,28], SRMR = 0.041 < 0.08 [26], CFI = 0.973 ≥ 0.90 [26], and TLI = 0.952 ≥ 0.80 [29,30], which met the criteria, as shown in Figure 5.
The analysis of the model parameter estimation results show that, via the testing of hypothesis H1, the MRBQ can be appropriately utilized to study the motorcycle riding behavior of a Thai population. The EFA analysis for variable grouping showed that the behaviors of Thai people can be grouped into four factors: traffic errors, control errors, stunts, and safety equipment. Speed violations were grouped with traffic errors. The goodness-of-fit model values of second-order CFA met all the criteria for hypothesis testing.

4. Discussion

In this study, we aimed to create a motorcycle riding behavior measurement model for a Thai population via modification of the MRBQ with exploratory factor analysis. We also aimed to verify the measurement model by second-order confirmatory factor analysis, which was used to verify measurement models in previous research by Elliott et al. [9], Özkan et al. [10], Sakashita et al. [11], Stephens et al. [12], and Vlahogianni et al. [11,16]. Furthermore, we aimed to define the guidelines of a self-assessment report for Thai people in terms of their motorcycle riding.
The MRBQ is a tool to study motorcycle riding behavior that was applied to Thai riders using 26 indicators (from the original 43 indicators) [9]. A factor analysis method was then used to analyze and separate the structures into four factors, which were traffic errors, control errors, stunts, and safety equipment; this was done according to Sakashita et al. [11], who studied novice riders. However, in this study, we collected data from experienced motorcycle riders (84.4% of respondents had more than five years of experience). In terms of previous research on factors, Özkan et al. [10] considered five factors: traffic errors, control errors, speed violations, stunts, and safety equipment. In this study, our factor results were similar to those found by Sakashita et al. [11]. However, there were different factors in our research, such as speed violations [11] and traffic errors. The highest-loading-value indicators were X5, X7, X11, X6, and X3 from the traffic error factor, X16 and X19 from the control error factor, X23 and X22 from the stunts factor, and X25 and X26 from the safety equipment factor.
When considering factors, we found that safety equipment had the highest loading factor value; this factor comprised indicators related to additional safety equipment, e.g., gloves and impact protection kit. Helmet wearing was not included in the measurement model because it was eliminated during the EFA analysis process. The personal information regarding helmets indicated that 17.9% of respondents always wear a helmet when riding a motorcycle, which is a very low value (Table 2).
For the stunts factor, we found that Thai respondents reported motorcycle riding behaviors of “cutting other vehicles off/overtaking at close range”, and “purposely doing a wheel spin”. In terms of control error factors, they reported “failing to control the motorcycle when using high speed” and “parking the motorcycle in a prohibited area”, especially in the downtown zone where there are fewer parking areas for motorcycles compared with other vehicles. Riders park their motorcycles carelessly, which causes traffic jam problems.
Finally, among traffic errors combined with speed violations, the behaviors of “ignoring the ‘GIVE WAY’ sign when driving on narrow roads and not letting a driver from the other lane proceed” and “if there are no cars on the road, you continue to go straight without considering red traffic lights” were frequently reported by motorcycle riders. Because of the mobility advantages of motorcycles, riders can overtake other vehicles to reach the front area of an intersection when traffic jams. At the traffic light junction, they usually pause their motorcycles in front of the pausing area and drive through red traffic lights if there are not any vehicles around the junction. Most of the accidents at traffic light junctions happen between motorcycles and other vehicles.

5. Conclusions, Limitations, and Future Work

In this study, we aimed to test and apply tools based on the MRBQ, from its 43 original questions, to measure the motorcycle riding behavior of Thai people. This research showed that the measurement model that was appropriate for Thai riders comprised 26 indicators from four factors. The results of this study were utilized to create a riding self-assessment report, which was the defined objective of the research. The assessment was organized before enrolment or renewal of a motorcycle riding license. The self-assessment report let riders perceive the risk level of their own riding behavior. Furthermore, organizations related to screening riding behaviors can match the different intensity levels of training courses to riders in order to provide risk awareness of their riding behaviors and improve riding behaviors using the MRBQ [9]. The data collection and analysis of this model were based on a 6-point scale. We have not yet defined what scores of the self-assessment report match with risk levels; this is our future objective in order to utilize the research in a real situation.
Future works will evaluate the risk levels of indicators. We will analyze factors and indicators from the measurement model in terms of structural equation modeling (SEM) to find factors affecting motorcycle riding behavior and define a sustainable solution guideline for problems that occur due to human factors.
The limitation of this research was that it did not include those younger than 20 years old. Data were not collected from this group. Thailand allows 15-year-old applicants to enroll for a motorcycle riding license, and there are many motorcycle riders who are younger than 15 years old, especially in rural areas. The obstacle to collecting data from those under 20 years old is the associated human research ethics requirements, as they are a vulnerable population. Respondents have to get permission from their parents before responding to our questionnaire, which makes it difficult to collect data. Thus, we had no data from teenagers. If we could also collect data from teenagers, the analysis results may differ from those presented in this research.

Author Contributions

Conceptualization, S.J.; data curation, S.U.; formal analysis, S.J. and S.U.; funding acquisition, S.J.; methodology, S.J. and D.W.; supervision, V.R. All authors have read and agreed to the published version of the manuscript.

Funding

This research was funded by the Suranaree University of Technology Research and Development Fund, Grant number IRD7-704-62-12-07, and the APC was funded by Suranaree University of Technology.

Acknowledgments

The authors would like to thank the Suranaree University of Technology Research and Development Fund.

Conflicts of Interest

The authors declare no conflict of interest.

References

  1. WHO. Global Status Report on Road Safety 2018; World Health Organization: 20 Avenue Appia, 1211 Geneva 27, Switzerland, 2018. [Google Scholar]
  2. WHO. World Health Statistics 2017: Monitoring Health for the SDGs, Sustainable Development Goals; World Health Organization: 20 Avenue Appia, 1211 Geneva 27, Switzerland, 2017. [Google Scholar]
  3. Department of Land Transport. Transport Statistics. Available online: http://apps.dlt.go.th/statistics_web/vehicle.html (accessed on 31 January 2020).
  4. Royal Thai Police. Directory Listing of Files/Traffic Accident. Available online: http://pitc.police.go.th/dirlist/dirlist.php?dir=/traffic (accessed on 3 February 2020).
  5. Olson, P.L.; Dewar, R.E. Human Factors in Traffic Safety; Lawyers & Judges Publishing Company, Inc.: Tucson, AZ, USA, 2002. [Google Scholar]
  6. Shinar, D. Traffic Safety and Human Behavior; Emerald Group Publishing Limited: Howard House, Bingley, UK, 2007. [Google Scholar]
  7. Royal Thai Police. Traffic Accident on National Highways in 2018. Available online: https://www.m-society.go.th/ewt_news.php?nid=19593 (accessed on 30 October 2018).
  8. Evans, L. Human Behavior and Traffic Safety; Springer Publishing Company: New York, NY, USA, 2012. [Google Scholar]
  9. Elliott, M.A.; Baughan, C.J.; Sexton, B.F. Errors and violations in relation to motorcyclists’ crash risk. Accid. Anal. Prev. 2007, 39, 491–499. [Google Scholar] [CrossRef] [PubMed]
  10. Özkan, T.; Lajunen, T.; Doğruyol, B.; Yıldırım, Z.; Çoymak, A. Motorcycle accidents, rider behaviour, and psychological models. Accid. Anal. Prev. 2012, 49, 124–132. [Google Scholar] [CrossRef] [PubMed]
  11. Sakashita, C.; Senserrick, T.; Lo, S.; Boufous, S.; Rome, L.D.; Ivers, R. The Motorcycle Rider Behavior Questionnaire: Psychometric properties and application amongst novice riders in Australia. Transp. Res. Part F Traffic Psychol. Behav. 2014, 22, 126–139. [Google Scholar] [CrossRef]
  12. Stephens, A.N.; Brown, J.; de Rome, L.; Baldock, M.R.J.; Fernandes, R.; Fitzharris, M. The relationship between Motorcycle Rider Behaviour Questionnaire scores and crashes for riders in Australia. Accid. Anal. Prev. 2017, 102, 202–212. [Google Scholar] [CrossRef]
  13. Lin, M.-R.; Kraus, J.F. A review of risk factors and patterns of motorcycle injuries. Accid. Anal. Prev. 2009, 41, 710–722. [Google Scholar] [CrossRef]
  14. Hongsranagon, P.; Khompratya, T.; Hongpukdee, S.; Havanond, P.; Deelertyuenyong, N. Traffic risk behavior and perceptions of Thai motorcyclists: A case study. Iatss Res. 2011, 35, 30–33. [Google Scholar] [CrossRef] [Green Version]
  15. Stephan, K.; Kelly, M.; McClure, R.; Seubsman, S.-A.; Yiengprugsawan, V.; Bain, C.; Sleigh, A. Distribution of transport injury and related risk behaviours in a large national cohort of Thai adults. Accid. Anal. Prev. 2011, 43, 1062–1067. [Google Scholar] [CrossRef]
  16. Vlahogianni, E.I.; Yannis, G.; Golias, J.C. Overview of critical risk factors in Power-Two-Wheeler safety. Accid. Anal. Prev. 2012, 49, 12–22. [Google Scholar] [CrossRef]
  17. Moskal, A.; Martin, J.-L.; Laumon, B. Risk factors for injury accidents among moped and motorcycle riders. Accid. Anal. Prev. 2012, 49, 5–11. [Google Scholar] [CrossRef] [Green Version]
  18. Sukor, N.S.A.; Tarigan, A.K.M.; Fujii, S. Analysis of correlations between psychological factors and self-reported behavior of motorcyclists in Malaysia, depending on self-reported usage of different types of motorcycle facility. Transp. Res. Part F Traffic Psychol. Behav. 2017, 46, 509–523. [Google Scholar] [CrossRef]
  19. Keall, M.D.; Newstead, S. Analysis of factors that increase motorcycle rider risk compared to car driver risk. Accid. Anal. Prev. 2012, 49, 23–29. [Google Scholar] [CrossRef] [PubMed]
  20. Chung, Y.-S.; Wong, J.-T. Beyond general behavioral theories: Structural discrepancy in young motorcyclist’s risky driving behavior and its policy implications. Accid. Anal. Prev. 2012, 49, 165–176. [Google Scholar] [CrossRef] [PubMed]
  21. Kankrong Piyaprai. A Study of Young Driver Behavior that Affect the Risk of Accidents from the Motorcycle; Suranaree University of Technology: Nakhon Ratchasima, Thailand, 2015. [Google Scholar]
  22. de Rome, L.; Fitzharris, M.; Baldock, M.; Fernandes, R.; Ma, A.; Brown, J. The prevalence of crash risk factors in a population-based study of motorcycle riders. Injury 2016, 47, 2025–2033. [Google Scholar] [CrossRef] [PubMed]
  23. Reason, J.; Manstead, A.; Stradling, S.; Baxter, J.; Campbell, K. Errors and violations on the roads: A real distinction? Ergonomics 1990, 33, 1315–1332. [Google Scholar] [CrossRef]
  24. Golob, T.F. Structural equation modeling for travel behavior research. Transp. Res. Part B Methodol. 2003, 37, 1–25. [Google Scholar] [CrossRef] [Green Version]
  25. Stevens, J. Applied Multivariate Statistics for the Social Sciences; Lawrence Erlbaum Associates: Mahwah, NJ, USA, 1996. [Google Scholar]
  26. Hu, L.T.; Bentler, P.M. Cutoff criteria for fit indexes in covariance structure analysis: Conventional criteria versus new alternatives. Struct. Equ. Modeling A Multidiscip. J. 1999, 6, 1–55. [Google Scholar] [CrossRef]
  27. Deb, S.; Ali Ahmed, M. Determining the service quality of the city bus service based on users’ perceptions and expectations. Travel Behav. Soc. 2018, 12, 1–10. [Google Scholar] [CrossRef]
  28. Lai, W.-T.; Chen, C.-F. Behavioral intentions of public transit passengers—The roles of service quality, perceived value, satisfaction and involvement. Transp. Policy 2011, 18, 318–325. [Google Scholar] [CrossRef]
  29. Daire Hooper, J.C.; Mullen, M. Structural Equation Modelling: Guidelines for Determining Model Fit. Electron. J. Bus. Res. Methods 2008, 6, 53–61. [Google Scholar]
  30. Jomnonkwao, S.; Sangphong, O.; Khampirat, B.; Siridhara, S.; Ratanavaraha, V. Public transport promotion policy on campus: Evidence from Suranaree University in Thailand. Public Transp. 2016, 8, 185–203. [Google Scholar] [CrossRef]
  31. Maskey, R.; Fei, J.; Nguyen, H.-O. Use of exploratory factor analysis in maritime research. Asian J. Shipp. Logist. 2018, 34, 91–111. [Google Scholar] [CrossRef]
  32. Cerny, B.A.; Kaiser, H.F. A Study of a Measure of Sampling Adequacy for Factor-Analytic Correlation Matrices. Multivar. Behav. Res. 1977, 12, 43–47. [Google Scholar] [CrossRef] [PubMed]
  33. Kline, R.B. Principles and Practice of Structural Equation Modeling; Guilford Press: New York, NY, USA, 2011. [Google Scholar]
  34. Nunnally, J.C. Psychometric Theory; McGraw-Hill: New York, NY 10019, USA, 1978. [Google Scholar]
  35. Hair, J.F.; Black, W.C.; Babin, B.J. Multivariate Data Analysis: A Global Perspective; Pearson Education Ltd.: Harlow, UK, 2010. [Google Scholar]
Figure 1. Ranking of rates of deaths in road accidents per 100,000 people. Source: WHO [1,2].
Sustainability 12 02785 g001
Figure 2. Road traffic accidents in Thailand. Source: WHO [1].
Sustainability 12 02785 g002
Figure 3. Factors related to road accidents. Source: Evans [8], Shinar [6].
Sustainability 12 02785 g003
Figure 4. Research processing.
Sustainability 12 02785 g004
Figure 5. Second-order CFA.
Sustainability 12 02785 g005
Table 1. Summary of motorcycle driving behavior from related research works.
AuthorMethodSpeeding ViolationsTraffic ErrorsControl ErrorsStuntsSafety EquipmentDemographicsAlcohol
Elliott et al. [9]Principal component analysis (PCA), linear modeling-
Özkan et al. [10]descriptive statistics, regression, PCA, theory of planned behavior (TPB), health belief model (HBM), locus of control (LC)-
Sakashita et al. [11]Exploratory factor analysis (EFA), confirmatory factor analysis (CFA), possion regression
Stephens et al. [12]Descriptive statistics, EFA-
Lin and Kraus [13]Haddon’s matrix----
Hongsranagon et al. [14]Descriptive statistics----
Stephan et al. [15]Descriptive statistics, distribution, frequency -----
Vlahogianni et al. [16]Reviews
Moskal et al. [17]Descriptive statistics-----
Sukor et al. [18]Quantitative analysis, structural equation modeling (SEM)----
Keall and Newstead [19]Descriptive statistics, logistic model------
Chung and Wong [20]Multi-group, path analysis-----
Kankrong Piyaprai [21]Descriptive statistics, TPB--
de Rome et al. [22]Descriptive statistics------
This researchEFA, second-order CFA-
Table 2. The number of samples from each zone.
Address ZoneCity/MunicipalMunicipalityMunicipal DistrictOutside the MunicipalityTotal
Bangkok Metropolis59809963301
Central521746213301
Northeastern186917552314
Northern543212886300
Southern85871235300
Total2684425872191516
Table 3. Sample characteristics; n = 1516.
Personal DataQuantity (Percentage)
Gender
Male903 (59.6)
Female613 (40.4)
Age
20–24 years old201 (13.3)
25–34 years old594 (39.2)
35–44 years old427 (28.2)
45–54 years old254 (16.8)
55–64 years old33 (2.2)
>65 yearsold7 (0.5)
Licensed rider
Yes1385 (91.4)
No131 (8.6)
Type of rider license
Temporary driving license (1 year)94 (6.2)
Driving license (5 years)1065 (70.3)
Permanent driving license227 (15.0)
Riding experience
0–5 years237 (15.6)
6–10 years399 (26.3)
11–15 years302 (19.9)
16–20 years204 (13.5)
>20 years374 (24.7)
Riding frequency
Everyday531 (35.0)
4–6 days/week554 (36.5)
1–3 days/week431 (28.4)
Helmet wearing behavior
Always271 (17.9)
Often929 (61.3)
Sometimes316 (20.8)
Riding objective
School/work1144 (75.5)
Travel159 (10.5)
Shopping213 (14.1)
Table 4. Statistical analysis of normal distribution; n = 1516, KMO = 0.886.
IndicatorsQuestionsMeanSDSkewnessKurtosisExploratory Factor Analysis (EFA)
Factor Score
Traffic ErrorsControl ErrorsStuntsSafety Equipment
Traffic errorsCronbach ’s α = 0.925
X1Turning into a side street from a main road without being wary of any pedestrians.1.910.7420.308−0.6490.742
X2Failing to notice a car from behind a parked vehicle until it is nearly too late.1.880.6760.4120.1240.702
X3Not stopping the motorcycle at zebra crossings to let pedestrians cross the road.1.770.7440.403−1.1070.795
X4Turning left into a main road without reducing speed and not noticing other vehicles.1.990.7360.266−0.4600.584
X5Ignoring the “GIVE WAY” sign when driving on narrow roads and not letting a driver from the other lane proceed.1.920.8450.328−1.0980.828
X6Overtaking without giving a signal in advance.1.850.7240.5910.2090.713
X7If there are no cars on the road, you continue to go straight while ignoring red traffic lights.1.750.7070.477−0.6190.800
X8Getting involved in unofficial “races” starting from traffic light junctions.1.530.6410.8930.1390.714
X9Overtaking in an overtaking-prohibited area.2.110.730−0.023−0.8030.582
X10Driving against the lane direction or the wrong way on a one-way street.1.850.7090.228−0.9980.670
X11Violating red traffic lights.1.890.7570.193−1.2370.704
Control errorsCronbach ’s α = 0.887
X12Riding without caution about any vehicle pulling out in front of you and having difficulty stopping.2.300.7470.067−0.364 0.692
X13When the vehicle ahead slows down or stops, you realize that you should stop your motorcycle immediately.2.250.7320.217−0.164 0.722
X14Riding too close to the car in front. If there is an emergency, it will be difficult to stop.2.210.688−0.031−0.438 0.814
X15Riding too fast into a corner or junction.2.390.744−0.056−0.381 0.642
X16Failing to control the motorcycle when using high speed.2.220.711−0.006−0.457 0.591
X17Braking too quickly on a slippery road.2.250.8040.000−0.694 0.467
X18Having trouble with your visor or goggles fogging up.2.290.663−0.009−0.274 0.721
X19Parking your motorcycle in a prohibited area.2.180.846−0.122−1.178 0.580
X20Breaking speed limits at late night or early morning.2.300.708−0.050−0.386 0.654
StuntsCronbach ’s α = 0.747
X21Pulling away too quickly and your front wheel lifts off the road.1.120.3432.7747.107 0.775
X22Purposely doing a wheel spin.1.290.6491.9942.335 0.841
X23Cutting other vehicles off/overtaking at close range.1.580.9001.5881.971 0.742
Safety equipmentCronbach ’s α = 0.831
X24Wearing motorcycle riding boots/protective trousers or jacket when riding.1.740.9531.5012.572 0.869
X25Wearing a protective riding suit for body, elbow, and shoulder protection.1.620.8751.3311.227 0.695
X26Wearing motorcycle gloves.1.961.0951.1030.748 0.839
Table 5. Factor correlation analysis results in terms of correlation value.
FactorsTraffic ErrorsControl ErrorsStuntsSafety Equipment
Traffic errors1.00
Control errors0.624 **1.00
Stunts0.364 **0.386 **1.00
Safety equipment0.297 **0.290 **0.474 **1.00
** Significant at the 0.01 level (two-tailed).
Table 6. Results of second-order confirmatory factor analysis.
IndicatorsCronbach’s αSecond-Order CFA CRIAVE
Est.Est./S.E.p-ValueR2
Traffic errors 0.53822.200<0.001 **0.290
X10.9250.62938.335<0.001 ** 0.9220.716
X20.65141.143<0.001 **
X30.75962.027<0.001 **
X40.70150.708<0.001 **
X50.83695.812<0.001 **
X60.79576.637<0.001 **
X70.80479.278<0.001 **
X80.56532.211<0.001 **
X90.60435.624<0.001 **
X100.74058.965<0.001 **
X110.79675.395<0.001 **
Control errors 0.58424.032<0.001 **0.341
X120.8870.64638.307<0.001 ** 0.8790.666
X130.62236.391<0.001 **
X140.64040.151<0.001 **
X150.67444.594<0.001 **
X160.82973.353<0.001 **
X170.67245.594<0.001 **
X180.57230.304<0.001 **
X190.82370.397<0.001 **
X200.51224.541<0.001 **
Stunts 0.79831.549<0.001 **0.639
X210.7470.55825.244<0.001 ** 0.7310.733
X220.80349.746<0.001 **
X230.83855.004<0.001 **
Safety equipment 0.82430.796<0.001 **0.679
X240.8310.49716.724<0.001 ** 0.7060.662
X250.77456.816<0.001 **
X260.71657.452<0.001 **
Note: N = 1516. Standardized estimates and all CFA loadings are significant at α = 0.01; CRI, composite reliability index; AVE, average variance extracted; ** significant at 0.001 level.

