Article

Refining the Spatial Scale for Maize Crop Agro-Climatological Suitability Conditions in a Region with Complex Topography towards a Smart and Sustainable Agriculture. Case Study: Central Romania (Cluj County)

by
Adina-Eliza Croitoru
1,
Titus Cristian Man
2,
Sorin Daniel Vâtcă
3,*,
Bela Kobulniczky
4 and
Vlad Stoian
3
1
Department of Physical and Technical Geography, Faculty of Geography, Babeș-Bolyai University, 400006 Cluj-Napoca, Romania
2
Department of Regional Geography and Territorial Planning, Faculty of Geography, Babeș-Bolyai University, 400006 Cluj-Napoca, Romania
3
Faculty of Agriculture, University of Agricultural Sciences and Veterinary Medicine Cluj-Napoca, 400372 Cluj-Napoca, Romania
4
Faculty of Geography, Babeș-Bolyai University, 400372 Cluj-Napoca, Romania
*
Author to whom correspondence should be addressed.
Sustainability 2020, 12(7), 2783; https://doi.org/10.3390/su12072783
Submission received: 5 March 2020 / Revised: 27 March 2020 / Accepted: 29 March 2020 / Published: 1 April 2020

Abstract

:
In the context of global climate change, the agricultural sector is one of the most responsive. This study focused on changes detected in temperature requirements for maize crops based on growing season length and the growing degree day indices in Central Romania (Cluj County). Daily air temperature data over the period 1981–2013 was derived from two databases with different spatial resolutions: Agri4Cast Resources Portal and ROmanian ClimAtic Dataset. Further analysis, performed for the entire period and three 10/13-y sub-periods, focused on calculating and mapping the area of arable land for each suitability zone. The main findings were: there were differences up to 16% in the area of suitability zones when switching from the results obtained based on the coarse spatial resolution to the improved one; the differences were larger for the shorter and more recent sub-periods than for the entire period or for the first decade; and there was considerable improvement of thermal conditions for maize crops in the focus region over the considered period—suitability zone I was not detected for the first sub-period and became dominant for the last one. It can be concluded that using or developing a better spatial resolution database is very important for maximizing the profitability of agriculture.

Graphical Abstract

1. Introduction

In the general context of global climate changes, the agricultural sector seems to be one of the most severely affected. The vast majority of previously developed studies indicated important impacts of climate changes on different crops, especially in developing countries [1,2,3,4]. Under these changing conditions, the geographical position and local factors of an area are expected to have a crucial impact on agriculture, based on the current climatic characteristics, soil properties, resources of the area, existing infrastructure, and direction of change [5,6].
One of the main elements for ensuring sustainable agriculture is agricultural land suitability analysis for various crops’ production. At the international level, some studies specifically focused on land suitability analysis for agriculture and on the impact of climate change on future land suitability [1,2,3,5]. Agricultural land is facing enormous pressure from global environmental changes including climate change [7], land degradation, and rapid urbanization [8], as well as population growth [9,10]. Among the processes of land use planning, land suitability analysis is a crucial factor [11] and is a precondition to achieve optimal land use resource exploitation [12].
Over the last decades, a significant decline in global wheat (−4.9%) and maize (−3.1%) production was attributed to temperature increases in cropping regions and during growing seasons in most countries [13]. The extreme variations of temperatures during the growing season, induced by climate change, have an important impact on the global production of maize, wheat, and barley, placing additional stress on crops [14,15]. Understanding all aspects related to the impact of climate change on land use and identifying suitable agro-ecological zones are factors essential to improving production [16,17,18].
Suitable areas for some important crop cultivation will shift as a direct result of climate change [6,19]. Agro-climatic suitability is a subsection of land suitability analysis that uses various agricultural indicators to assess the most appropriate land use for a specific location. Usually, this approach includes temperature and precipitation as base parameters from which many other indicators can be derived to assess the agro-climatic suitability of a given crop [20].
Depending on the crops considered, the commonly used climatic factors for land suitability analysis are: potential and actual evapotranspiration [21], aridity index [17], diurnal temperatures [22], growing degree days [17,23,24], length of the growing season [25,26,27], length of the different phenological stages [28], relative humidity [29,30], solar radiation [28,31], sunshine hours [31,32], temperature/precipitation [24], and winds [32,33].
Under present and future climate change conditions, at the European level, in the Post-2020 Common Agriculture Policy, three out of the nine policy’s specific objectives concern the environment and climate, and one aims to contribute to climate change mitigation and adaptation [34,35,36]. In addition, the Common Agricultural Policy and EU Adaptation Strategy suggest for each member state to delineate the suitability for crop growth. Investigating this issue, we did not identify any online report made available by the member states. The only service freely available was that developed by the Joint Research Centre: Agri4Cast Resources Portal (https://agri4cast.jrc.ec.europa.eu/DataPortal). The indices calculated have been derived from weather stations’ meteorological parameters interpolated on a daily basis from 1975 to the last calendar year completed.
In Romania, previous studies approached the subject of changes and trends in maize production [37], as well as the impact of climate change on agricultural crops and several cultivar adaptations, using a limited number of factors [38]. A good practices resource book in the climate change context [39] and an official catalog of crop cultivars [40] were also released as a part of the national agriculture development strategy. Simulation models of the climatic factors variations were used for Cluj County [41], in which a good correlation between climate change and maize yields based on point data analysis for Romania was recently detected [42].
A paper focused on the impact of climate change in winter wheat phenology in Romania [43] revealed earlier occurrences of anthesis and maturity for several regions of the country. The effect of temperature changes on winter wheat phenology was determined using a phenology simulation performed with the model from the Decision Support System for Agrotechnology Transfer v. 4.0.2.0 Platform. The study was developed by using climatic observation data recorded in 10 points randomly distributed across Romania. Some other studies focused on extreme temperature and precipitation events, including those with impacts on agriculture, as well as on aridity indices and reference evapotranspiration [44,45,46,47,48,49]. All previous studies were developed based on point observation and most of them revealed important changes in the analyzed indices over the historical period or in the near future. None of them considered gridded data.
The main aim of this paper was to detect changes in temperature requirements based on two agro-climatic indices (growing season length—GSL and growing degree days—GDDgrow), as well as in the area of different agro-climatic suitability conditions for the maize crop in a complex topographic region, based on gridded data, by comparing the results derived from two databases with different spatial resolution. We aimed to redefine the thermal agro-climatic suitability areas for maize, under present climate change conditions, based on a better spatial resolution compared to the existing one at the European level and made freely available by the Joint Research Centre: Agri4Cast Resources Portal (https://agri4cast.jrc.ec.europa.eu/DataPortal). The products provided by the JRC platform were derived from meteorological parameters from weather stations interpolated on a 25 × 25 km grid, which in our opinion can be questionable for regions with complex topography characterized by important changes in temperature conditions due to elevation and exposure over short distances. Under these circumstances, we developed a comparative study between the suitability zones based on the gridded data available at the European level and those available for Romania (ROCADA database) [50], which is about 5 times more sensitive in terms of spatial resolution. This is the first agro-climatic study developed for a European region based on gridded data at a better spatial resolution than 25 km × 25 km.
We chose for this study the maize (Zea mays L.) crop since it is one of the main crops in the considered region and covers 35.52% of the agricultural area of the county [51]. The methodology proposed by our study can be replicated for any other crop and for any region in Europe or worldwide.

2. Materials and Methods
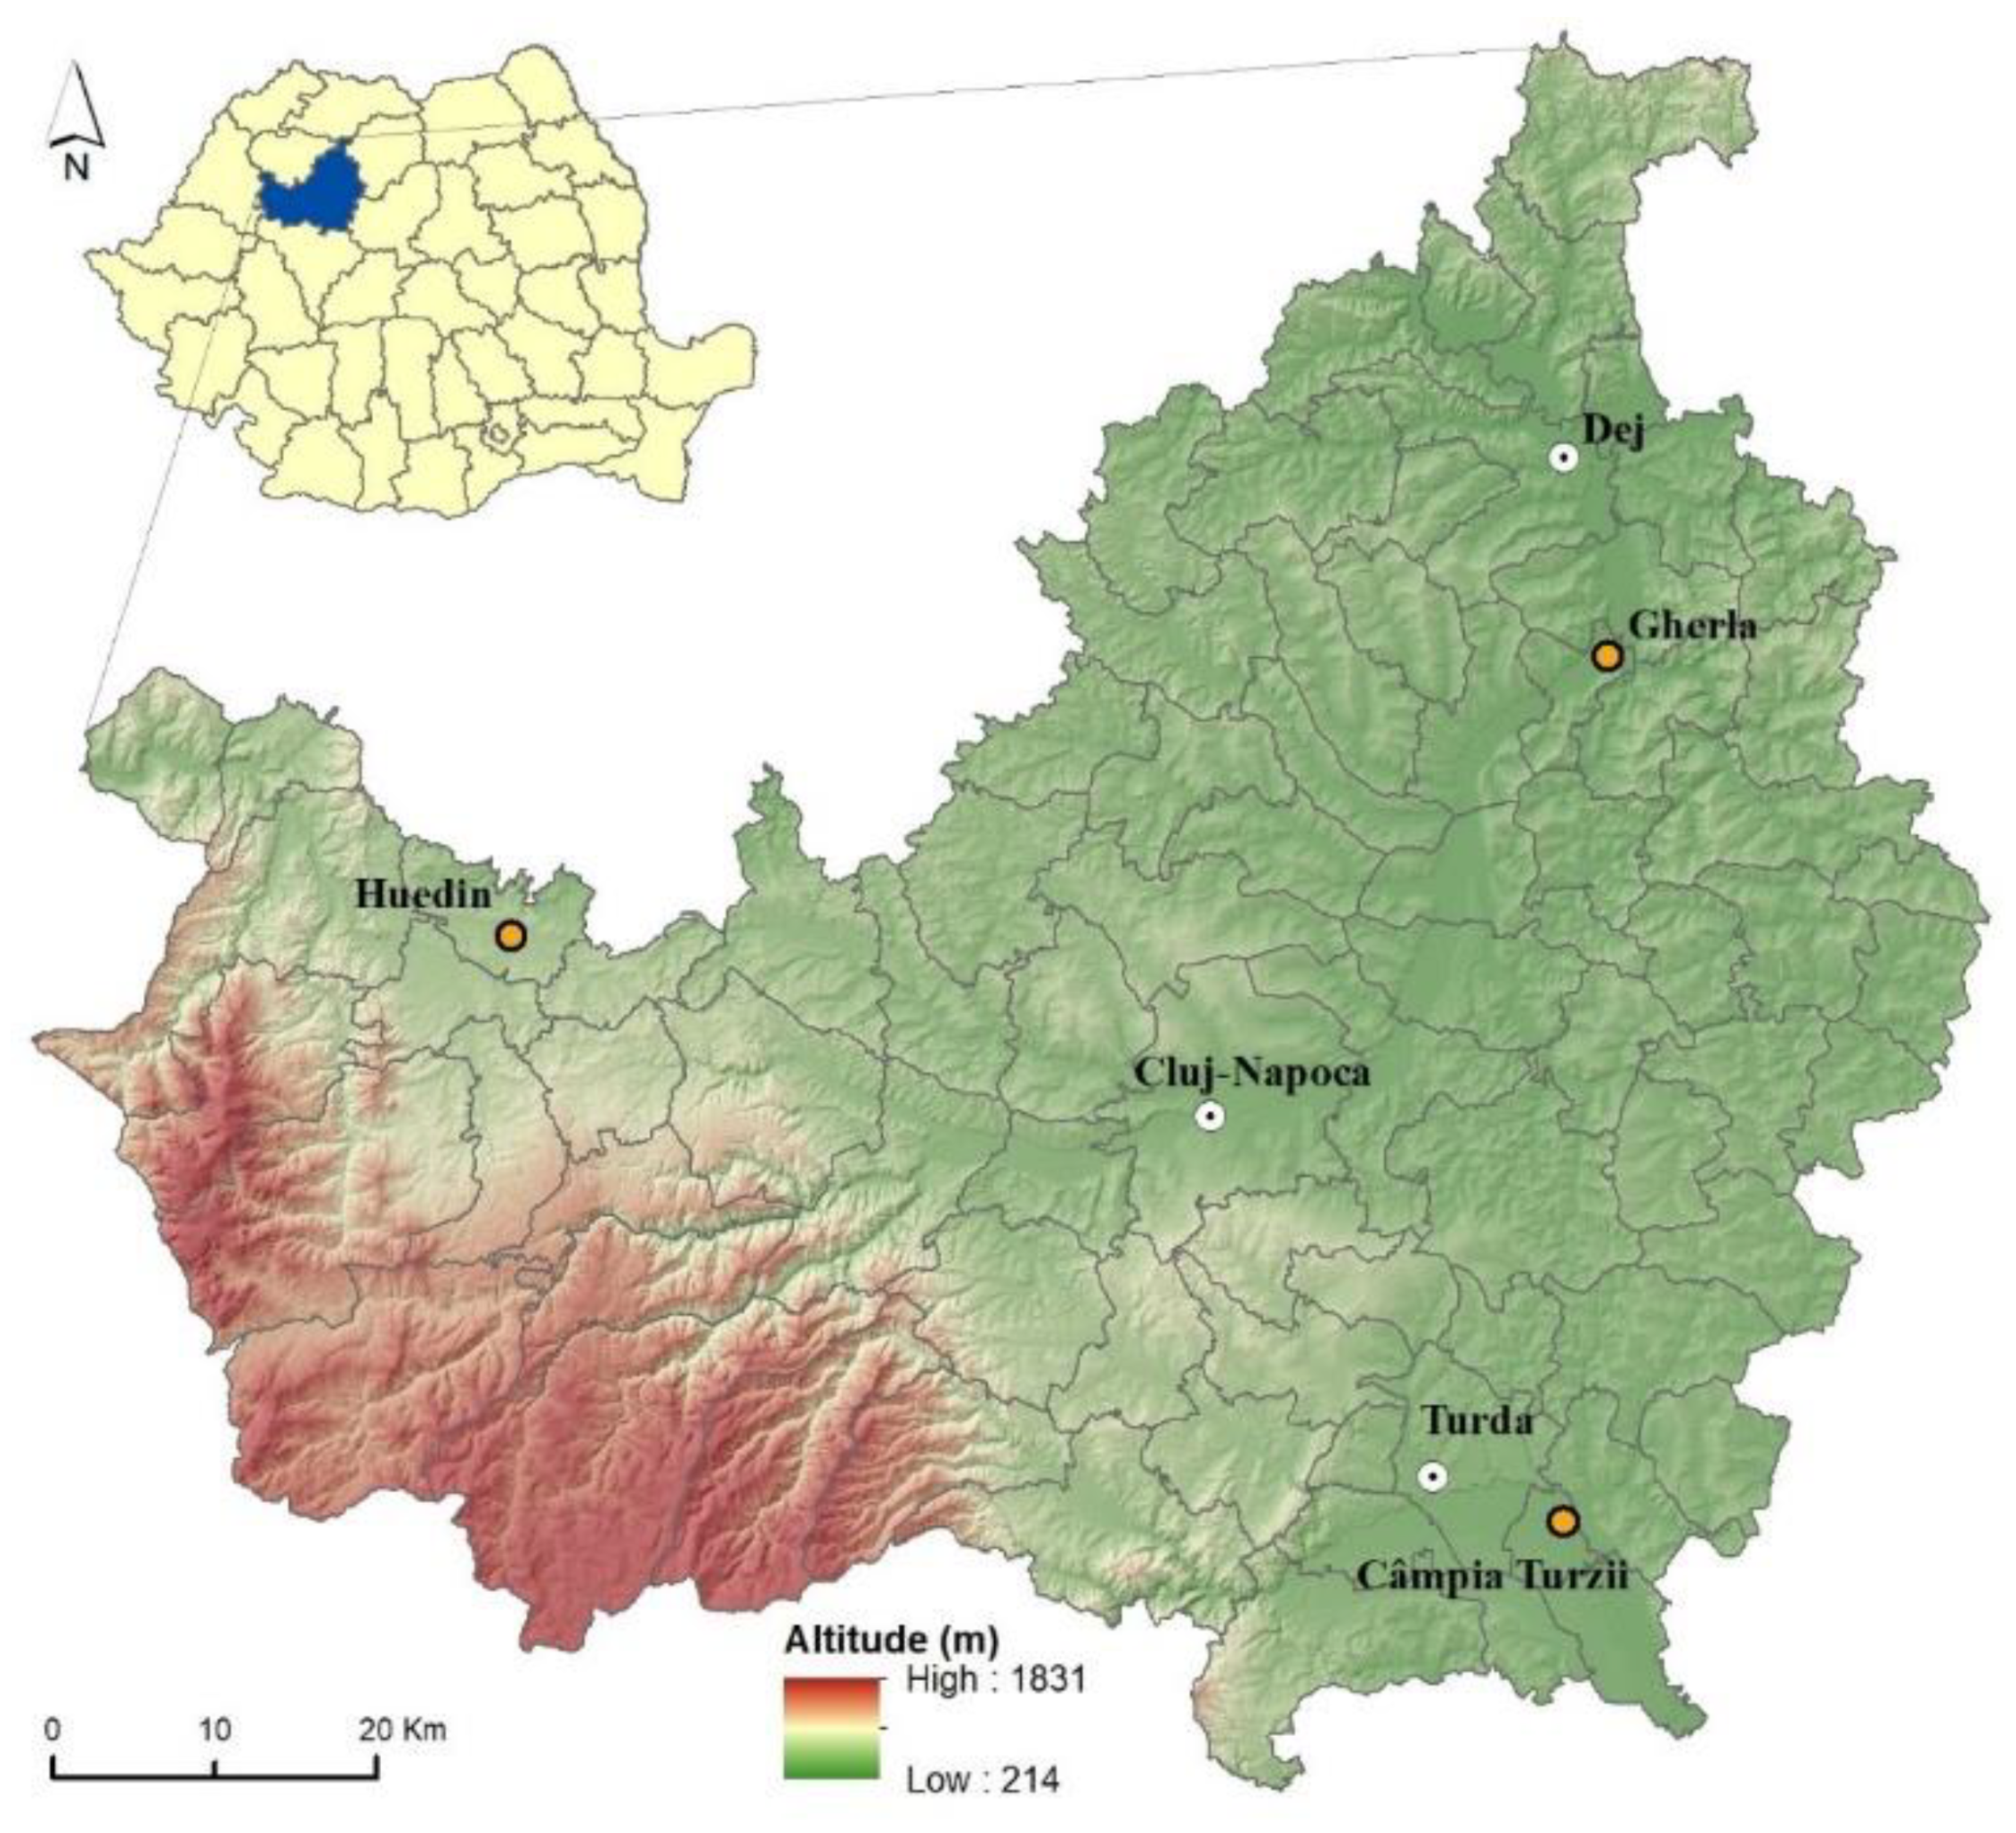
2.1. Study Area

Cluj County is located in the central part of Romania, in the Transylvanian Depression. The topography of the county is quite complex, varying from lowlands consisting mainly of river valleys and low hills or tableland to high mountains. The altitude ranges from less than 250 m to more than 1800 m (Figure 1). It is located in a continental and temperate climate, with mean annual temperatures of 6–9 °C in the lowlands and of 0–6 °C in the mountain areas [52].

2.2. Data Used

2.2.1. Climatic Data

One of the main aims of this paper is to determine the area differences for maize crop suitability zones when increasing the spatial resolution. The analysis of the two agro-climatological indices (GSL and GDDgrow) was performed based on two-gridded datasets of daily maximum and minimum temperatures extracted from the Agri4Cast Resources Portal (https://agri4cast.jrc.ec.europa.eu/DataPortal), with a spatial resolution of 25 × 25 km, and ROmanian ClimAtic DAtaset (ROCADA) [50], with a spatial resolution of 0.1/0.1° latitude/longitude (~11 km × 11 km).
In Agri4Cast Resources Portal, the meteorological data is available on a daily basis from 1975 to the last calendar year completed.
ROCADA is a database developed by the Romanian National Meteorological Administration, containing daily mean and extreme temperatures over the period 1961–2013. It covers the entire territory of Romania and was developed based on the highest spatial density of quality controlled weather station measurement data in Romania (160). Datasets are freely available on the World Data Center PANGAEA portal. ROCADA derived data have the best spatial resolution and accuracy when compared to other available gridded databases at present, such as E-OBS, CarpatClim [53], or Agri4Cast Resources Portal.
For a good quality and reliable comparison, a common period for the two databases was employed: 1981–2013. Daily maximum and minimum temperatures have been extracted from both databases in order to be processed for getting GSL and GDDgrow indices time series. The Cluj County area is covered by 34 grids in the Agri4Cast Resources Portal and by 113 grids in the ROCADA database.

2.2.2. Arable Land Data

The actual extent of arable land in Cluj County was determined using the National Agency for Cadaster and Real Estate Publicity [54] dataset, derived from high-resolution orthophoto-imagery and also from Corine Land Cover 2018, Version 20 [55] dataset developed by the European Environment Agency (EEA) under the framework of the Copernicus program.

2.3. Methods Employed

2.3.1. Indices Calculation

For this study, two extreme temperature indices developed by the Commission for Climatology Expert Team on Sector-Specific Climate Indices (ET-SCI) of the World Meteorological Organization for the Agriculture and Food Security sector were assessed in order to identify changes in the agro-climatic conditions and suitability zones area for maize crops in one of the most developed counties in Romania (Cluj).
In this study, we focused only on temperature-based indices for three reasons:
  • Maize (Zea mays L.) is a thermophilic crop with the photosynthetic C4 cycle, extremely responsive to climate change, especially to changes in temperature [56,57,58];
  • Temperature is much more important for plant growth than precipitation or any other climate variable derived from precipitation, since water availability for agriculture use is much easier to be solved in Europe (if necessary), by employing different agro-techniques (e.g., irrigation), whereas temperature conditions cannot be changed for open-air crops;
  • For Romania, temperature was the meteorological variable with a much more intense and generalized change at the national level over recent decades, compared to other variables such as precipitation or reference evapotranspiration [43,44,47,48,49,59,60].
GSL is one of the most important agro-ecological parameters for different crops; it is calculated as presented in Table 1. Also, the temperature requirements for maize crops were defined by the GDDgrow index considering a base temperature (Tb) of 10 °C (Table 1). The index is calculated as the annual sum of daily temperatures when the threshold of 10 °C is exceeded, accumulated during the vegetation season (Equation (1)). Thus, only the difference between mean daily temperature (Tmed) and Tb are considered for GDDgrow calculation.
G D D g r o w = i = 1 n ( T m e d i T b i ) ,
where,
  • Tmed is the mean daily temperature, and Tmed > 10.0 °C; daily Tmed is derived as the average value from daily maximum and minimum air temperature;
  • Tb is a user-defined location-specific base temperature and Tmed > Tb; in this case, the base temperature for the maize crop is 10.0 °C;
  • n is the number of days in the year considered for GDDgrow calculation.
The annual values of GSL and GDDgrow indices were calculated by employing the ClimPACT2 application (https://github.com/ARCCSS-extremes/climpact2/archive/master.zip), developed based on the recommendations of the ET-SCI [61].
Further analysis of GDDgrow was performed by sub-periods using two time-steps. The first time step covered the entire period and it is important from a climatological perspective. Then, we divided the entire period into three shorter sub-periods: two 10 year sub-periods (1981–1990 and 1991–2000) and one 13 year period (2001–2013) because, usually, maize hybrids are maintained in cultivation for approximately 10 years.
These methods applied to the above-mentioned data allowed identification of the differences between results obtained for each of the two databases in terms of suitability zones area for maize crops. Under the climate change conditions, modifications in the area of different suitability classes detected from one sub-period to another in the focus area were revealed, too.

2.3.2. Trend Detection

The trend of the two indices datasets was calculated over the entire period 1981–2013. It was assessed by using the non-parametric Mann–Kendall test [62,63] and the magnitude of the change was detected by employing Sen’s slope method. The Mann–Kendall test is applicable to the detection of a monotonic trend of a time series and Sen’s method uses a linear model to estimate the slope of the trend, while the variance of the residuals should be constant in time [43,64]. In recent decades, the combined method was widely used with good results to detect trends and slopes in different climatic parameters’ datasets [65,66,67,68,69,70]. To process the data for change detection, the Excel template MAKESENS, developed by the researchers of the Finnish Meteorological Institute [64], was employed. It performs two types of statistical analyses: testing for the presence of a monotonic increasing or decreasing trend with the non-parametric Mann–Kendall test and computing the slope of a linear trend estimated with Sen’s non-parametric method [71]. In the present paper, both methods were used in their basic forms. The statistical significance of the slopes was established at α = 0.05 [46].

2.3.3. Agro-Climatological Suitability Areas for Maize Crops

For this study, the suitability zones/classes for maize crops were established based on the two indices previously presented: GSL and GDDgrow (Table 2 and Table 3).
Three classes of suitability were established for maize crops in Romania considering the GDDgrow index (Table 3). The most favorable conditions were included in suitability class I, followed by the suitability class II, and by class III. Those areas with GDDgrow values lower than 800 °C/y are not suitable for maize cultivation [72,73,74,75,76] (Table 3).

2.3.4. Area Calculation

Based on GDDgrow index, the area for each suitability zone/class was calculated over the entire period considered (1981–2013) and for each sub-period (1981–1990, 1991-2000, and 2001–2013). The values are given in real units (km²) and in percentages of the total agricultural land area in Cluj County.
The statistical analysis consisted of calculating the share of arable land in the focus area for each suitability class for maize crop, based on GSL and GDDgrow indices. The areas were determined by means of thresholding analysis that was used to generate statistics throughout each interpolated dataset and the percentages of the total area within specific limits were calculated.
The location and area of the maize crop suitability classes were derived by employing a GIS technique developed in four steps.
  • First, we performed the spatial intersection by overlapping the arable land with GSL and GDDgrow indices layers at spatial resolutions of 25 × 25 km and 11 km × 11 km, respectively.
  • The second step consisted of calculating the area for each polygon (in km²) using the ArcGIS Spatial Statistics tool.
  • To get the total area for the county, we summed the areas of all polygons with similar suitability conditions (in km²).
  • The datasets were converted into percentages of the total arable land area for better accuracy and understanding.

2.3.5. Mapping Method

Geospatial and geostatistical analyses were completed using ArcGIS v10.6 (ESRI, The Redlands, CA) software. IDW interpolation was applied to a regular grid-shaped point dataset in order to predict values at unsampled locations and to create maps of GSL and GDDgrow indices as well as maps of suitability zones in Cluj County. The IDW technique computes an average value for each unsampled location using values from nearby weighted locations. Input data for the analysis was re-projected in Stereo 1970 (Romania’s National Projection System).

3. Results

From an agricultural point of view, maize, together with winter wheat and soy are the main crops cultivated in the county [51], and also they share the greatest area of arable land worldwide. That is the main reason why this study is focused on the maize crop.

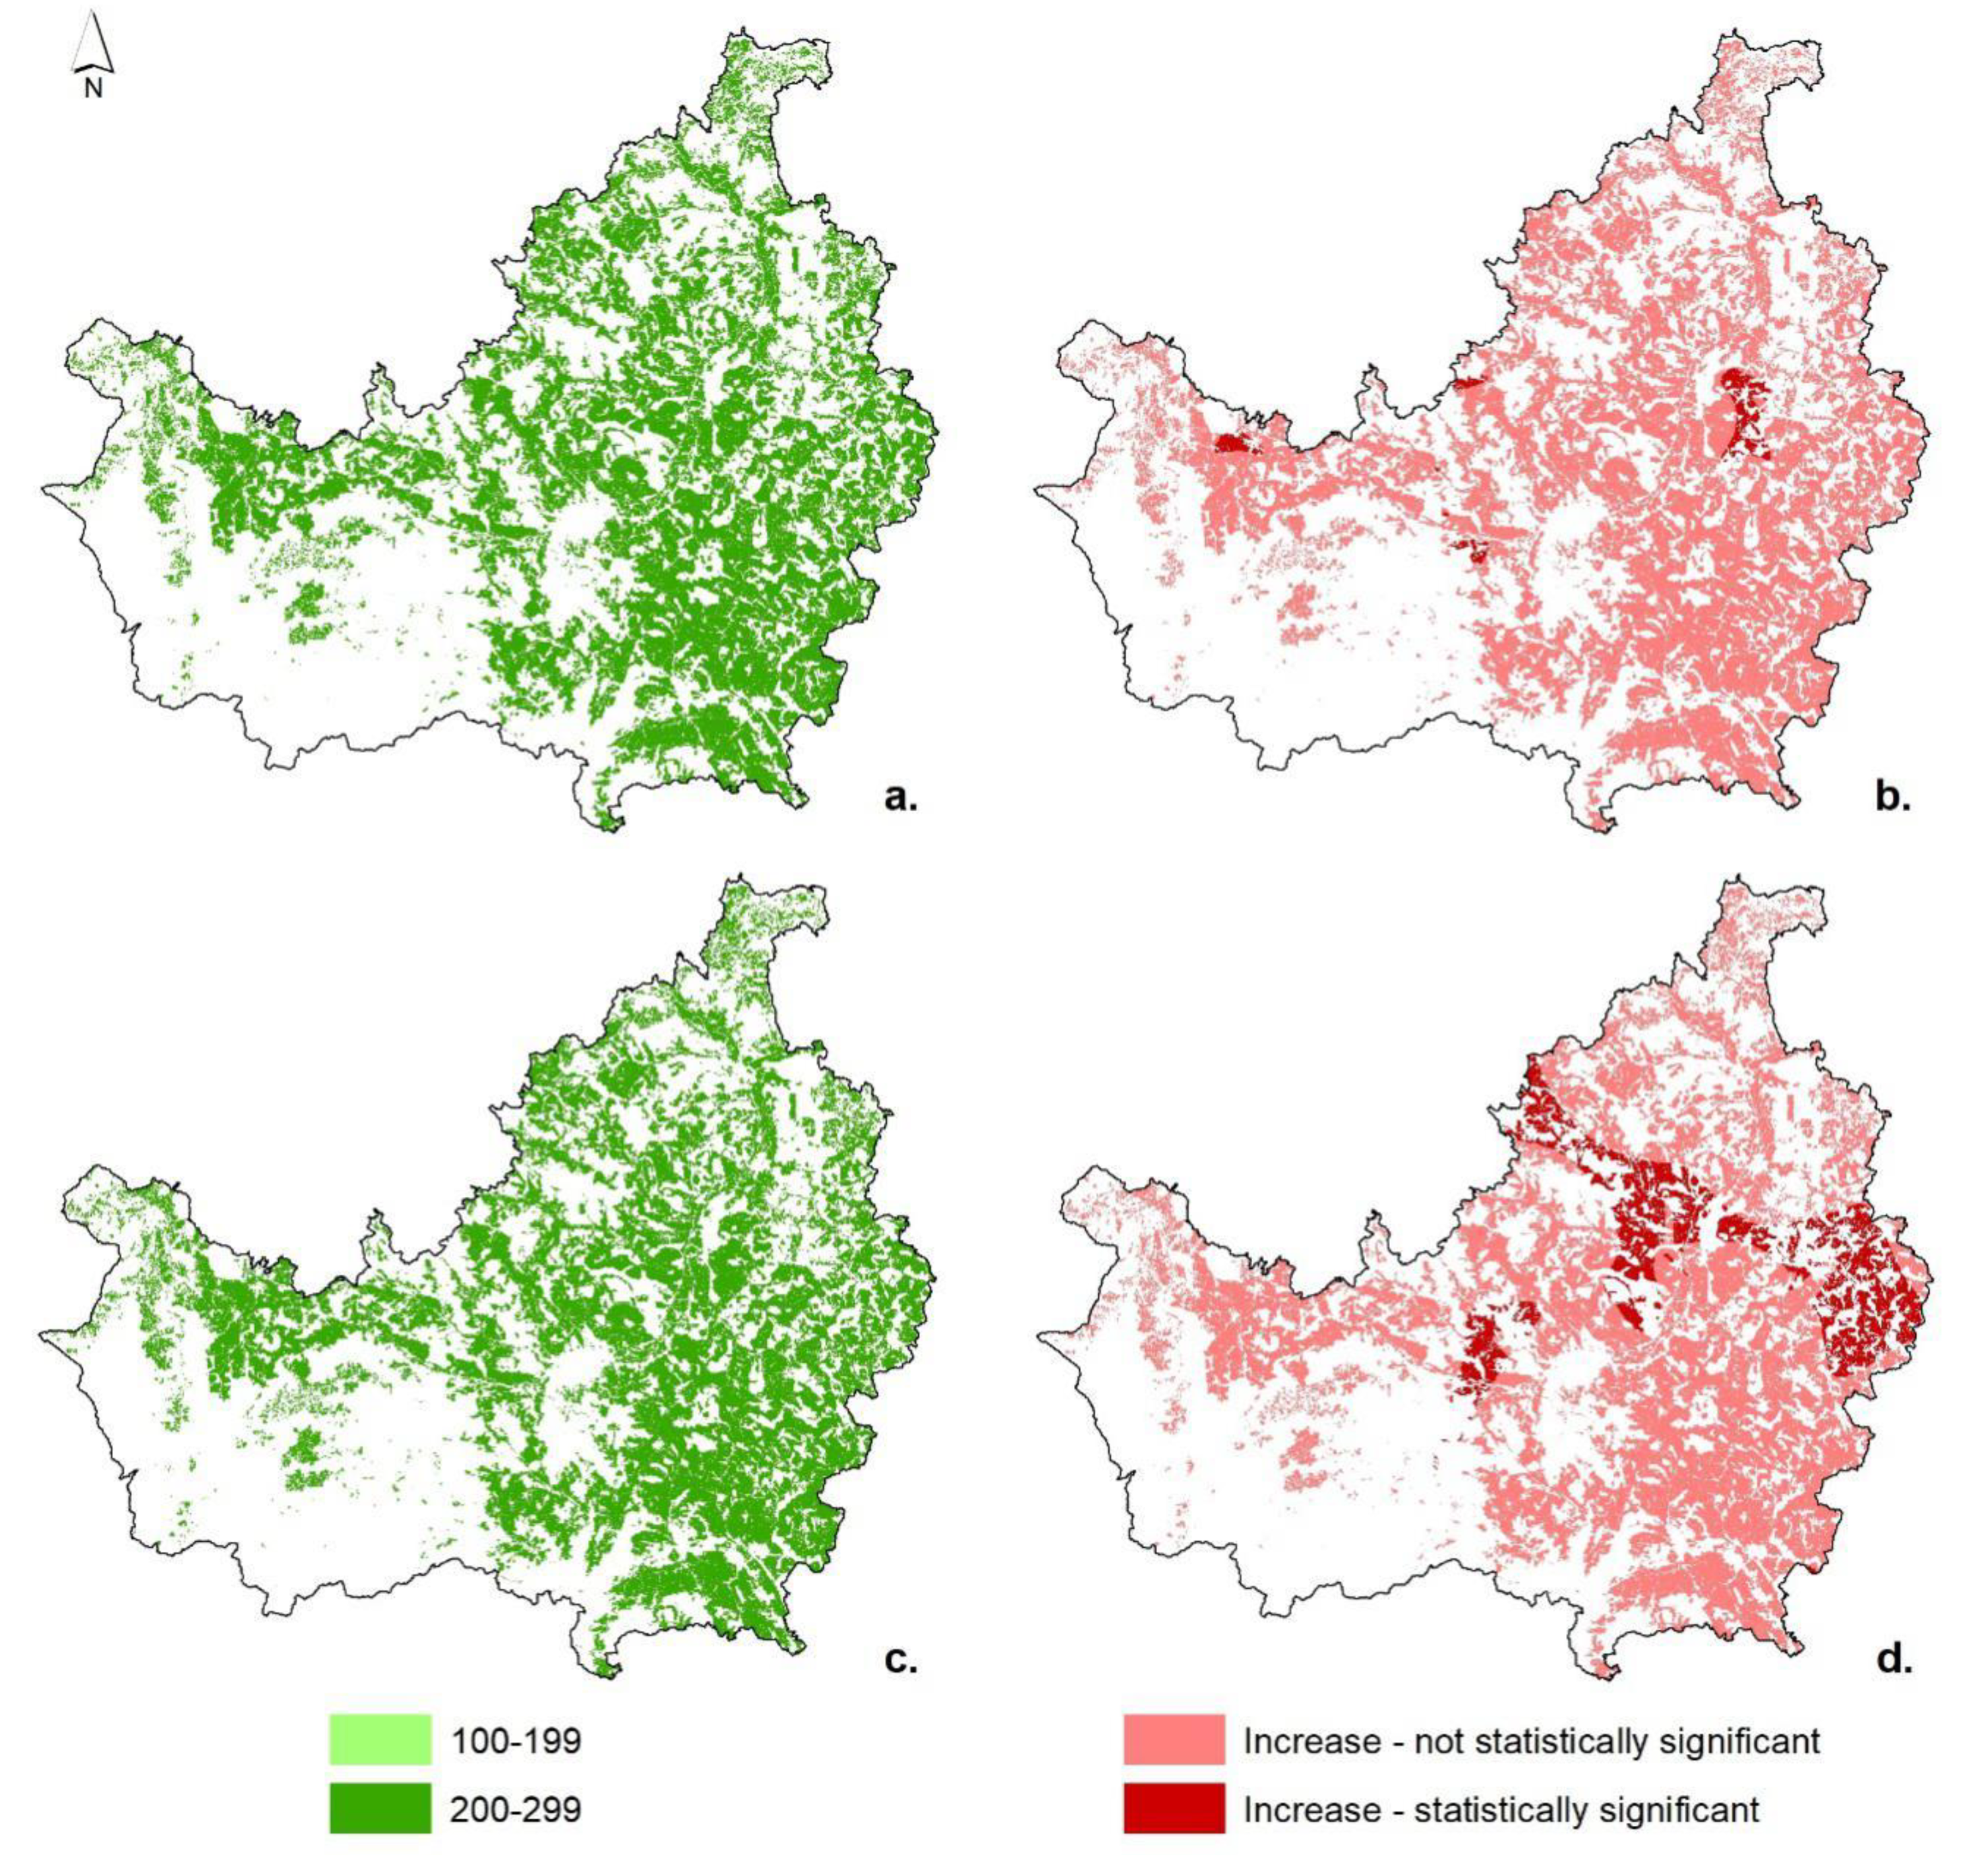
3.1. Spatial Distribution and Changes Detected in the GSL Index

Analysis based on data derived from both databases (ROCADA and Agri4Cast Resources Portal) revealed that GSL lasts between 200–250 days/y for the most extended part of the arable land of the county (Figure 2a,c). Under these conditions, based on the FAO classification and GSL of maize hybrid maturity (Table 2), the largest area of the arable land of Cluj County can be used for very late hybrids. Only an extremely small area (a few pixels covering 0.007% of the entire area) was characterized by GSL values lower than 200 days/y (185–200 days/y). However, it was appropriate for very late hybrids cultivation, too.
In terms of change, a generalized increase was detected for the entire county area, but the share of the statistically significant upward ones varies widely depending on the database: the area covered by significant changes detected based on the ROCADA data (Figure 2b) is much smaller compared to that identified based on the Agri4Cast Resources Portal data (Figure 2d). The magnitude of the trend in the case of significant changes was in the range of 6-15 days/decade considering ROCADA derived data and varied from 7.2 to 12.2 days/decade when JRC derived data was employed.
The significant changes covered 2.01% of the arable land when ROCADA data were considered for calculation and 13.66% when the Agri4Cast Resources Portal data was used.
The analysis for the 10/13-y sub-periods revealed that for each, the results were quite similar to those corresponding to the entire period: the largest area of the arable land is appropriate for very late-maturity maize hybrids cultivation.

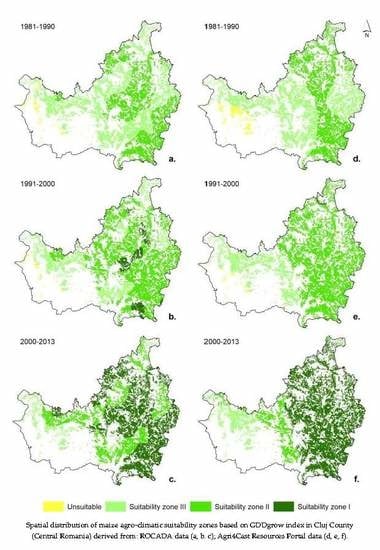
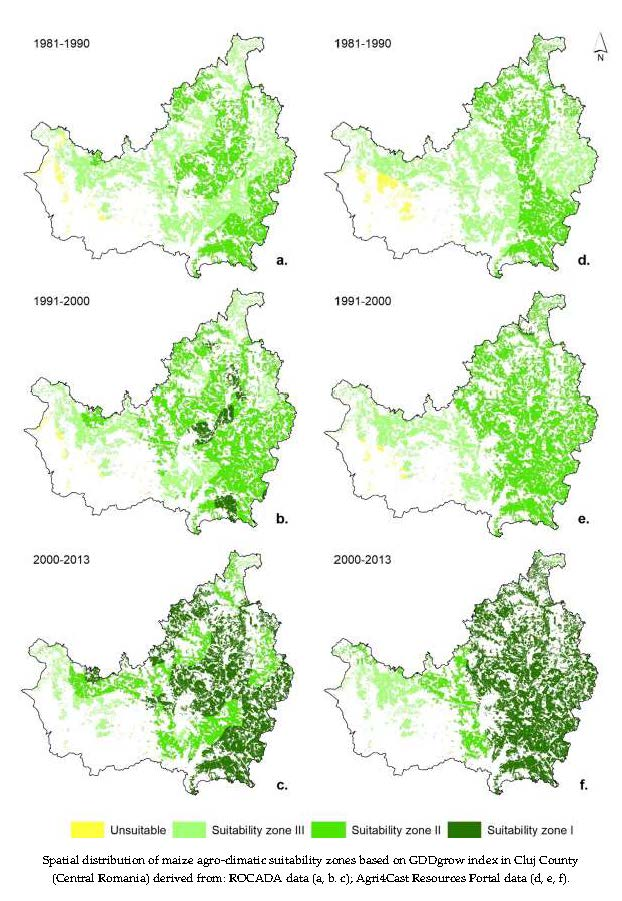
3.2. Spatial Distribution and Changes Detected in the GDDgrow Index

From an agricultural point of view, the GDDgrow index is at least as important as the GSL index. However, the results of the two indices should be discussed together as both contribute to the maturity of the crops.

3.2.1. Spatial Distribution and Changes Detected in the GDDgrow Index over the 33-y Period

Considering the GDDgrow index, different suitability classes were identified in the focus area based on both datasets. Under these circumstances and because there was no important spatial variation in the GSL index, the GDDgrow seemed to become the dominant factor in defining the agro-climatological conditions for maize crops in the considered region.
The detailed analysis indicated the differences were much more important between results obtained for each database in the case of this index compared to GSL. Considering both datasets, the arable land of Cluj County is characterized by multiannual average values of GDDgrow corresponding to all classes of suitability for maize cultivation (Figure 3a,c), but the difference in shares for the three classes of suitability is quite important when switching from one database to another (Figure 4).
Differences in the area covered by each class ranged from 0.5% to 12.7%, with lower values for unsuitable and suitability class III conditions, and higher for suitability classes II and I. Using the Agri4Cast Resources Portal data as input, suitability zone I covered 3.3%, whereas output based on ROCADA data indicated 6% more of the arable land was suitable for the most productive hybrids (9.3%). Consequently, the share of the arable land characterized by suitability class II is less extended for ROCADA data compared to that identified based on Agri4Cast Resources Portal data (Figure 4).
Even though the area values for the unsuitable and suitability class III conditions are quite close to one to another, the location of those areas may differ: in the case of the Agri4Cast Resources Portal data, the regions with similar conditions were more compact, whereas when the ROCADA database was used as source data, the two classes were more fragmented. Both area difference and fragmentation are a consequence of the grid dimension for each database. The main reason is the impact of the complex topography of the region on temperature, which is better emphasized by a finer spatial scale, such as that derived from ROCADA, since it is more sensitive to morphological details (river valleys, slopes aspect, etc.).
Changes detected considering both datasets over recent decades showed that the entire focus region experienced an accelerated increasing trend (statistically significant) in the GDDgrow index (Figure 3b,d). The slopes varied in the range of 77–108 °C/decade for ROCADA derived results, and 41–144 °C/decade respectively for Agri4Cast Resources Portal derived results.

3.2.2. Spatial Distribution and Changes Detected in the GDDgrow Index over the 10/13-y Sub-Periods

When the 10/13-y sub-periods were considered, we found that the thermal conditions considerably improved from one sub-period to another no matter what database was used (Figure 5). For the first sub-period, the suitability class was not identified at all.
The analysis revealed that the least favorable conditions for maize growing were specific to the sub-period 1981–1990 when the unsuitable and the suitability zone III conditions were dominant and covered more than 52% of the entire arable land area of the county. Suitability class III covered the largest area (50% in ROCADA and 51.2% for Agri4Cast Resources Portal), followed by suitability zone II extending over 47.5% (ROCADA data) and 44.6% (Agri4Cast Resources Portal) of the arable land (Figure 5a,d and Figure 6).
The most important shift towards better thermal conditions was detected for the last two sub-periods (after 1990). What is of crucial importance is that the best suitability conditions for maize crops were identified in Cluj County for both sub-periods. During the first one (1991–2000), suitability zone II became dominant (66.7%) and suitability I conditions covered 7.6% of the focus area based on input data derived from the ROCADA database. When Agri4Cast Resources Portal data were used as input, suitability class II extended over 75.9% of the arable land, and the best conditions (suitability zone I) were specific to only 0.6% of the considered region.
The best conditions (suitability zone I) became dominant over the sub-period 2001–-2013, extending over more than 57% of the focus area based on ROCADA data, and more than 74% of the arable land when the Agri4Cast Portal dataset was employed. The area covered by unsuitable conditions almost disappeared, extending over 0.1% (ROCADA) and 0.0% (Agri4Cast Resources Portal), and suitability zone III conditions dramatically decreased to less than 9% for ROCADA data and to less than 11% for Agri4Cast Portal data (Figure 5 and Figure 6).
As in the case for the entire 33-y period, the big difference in terms of area extension for each suitability zone was a consequence of the input data. Due to the grid dimensions, the results obtained based on the two datasets were quite different, especially for suitability classes I and II. This is an effect of topographic complexity: since temperature largely varies over a relatively short range, the value of the larger grid is much more affected when compared to that of the smaller grid. Results derived from the Agri4Cast Resources Portal data seemed to overestimate the dominant better conditions over the sub-periods 1991–2000 (suitability zone II) and 2001–2013 (suitability zone I). Under these conditions, we consider that using a better spatial scale would reduce the risks for stakeholders and prevent possible damage generated by not meeting the thermal conditions for maize crops.

4. Discussions

Previous studies [77,78] have documented the agro-climatic regions in Romania using traditional methods involving general information (classical mapping techniques derived from direct terrain observation data) and applied to natural features (climate, topography, and hydrology) with limitations in terms of ground spatial resolution and accuracy. The methodology proposed in the present study provided an accurate and rapid solution, assessing the thermal conditions of the arable land based on geospatial analyses.
In the general context of global climate change, research-based decisions of the authorities and stakeholders in agriculture are very important, since switching to an early maturity hybrid before the switching window will most likely not be beneficial, and may even reduce profitability. Persevering with a full season or mid-maturity hybrid after the switching window will most likely result in reduced profitability, too [79]. As we demonstrated, employing a coarse spatial resolution in regions with complex topography would cause big errors in agro-climatic conditions identification by overestimating better conditions, which could lead to significant losses. Under these circumstances, when using agro-ecological conditions derived from low-resolution data, especially in regions with complex topography, the stakeholders should be very cautious. This study, in its present form, could become an important tool for local farmers in order to adopt the most appropriate measures to increase their profitability by choosing hybrids according to the switching window for suitable conditions, following examples from other regions of the world (e.g., USA) [79].
Even more importantly, this study could serve as a good starting point for a model developed for much larger regions affected by climate change as part of their adaptation strategy towards a smarter and more sustainable agriculture [80,81,82]. As expert-knowledge analysis was identified as the major limitation of the models [83], we consider that our results could greatly contribute to adapting an existing agro-climatic suitability model or to developing a new one at a better spatial resolution, especially for other regions with complex topography, by including a large variety of climatic (precipitation, evapotranspiration) and non-climatic (soil type, slope gradient and aspect) parameters (overlapping more layers), in order to avoid growing season constraints and to determine phenophase-specific climate sensitivities [28,84,85,86,87], as well as to achieve realistic site-specific results and a higher efficiency of resource use in agricultural ecosystems [88,89].
Since our focus area covered a large variety of topography used for agriculture, ranging from low to high altitude, the results could be of interest to agriculture scientists and stakeholders in other regions of Europe or from other continents characterized by complex topography. This paper aimed not only to reassess the suitability zones under the impact of climate change, particularly temperature-based indices on maize crops from a new perspective, but also to prove that increasing accuracy, by using a much better spatial resolution compared to that existing at a European level, leads to a better evaluation of the agro-climatic conditions, especially in regions with complex topography. Furthermore, the results can be employed to forecast and reassemble the suitability areas that are extremely important for agriculture and the economy. For all the stakeholders involved in crop production, the potential yield of maize is directly connected to the length of the growing season (GSL) and to the accumulated temperature during GSL (GDDgrow). It is of major economic importance that a scientific argument based on agro-climatic indicators must be the main starting point for repositioning the suitability areas.

5. Conclusions

The main purpose of the work was to justify scientifically that, at a regional level, using a better spatial resolution for identification of agro-climatic conditions for maize crops could be of crucial importance. Using a coarse spatial resolution in regions with complex topography could dramatically influence the quality of the results on agro-climatic conditions (overestimation for up to 16% of the total area considered, included in a better suitability zone), leading to important damage derived from a decrease in productivity as a result of choosing inappropriate hybrids. The proposed methodology, focused on the improvement of the spatial resolution, which can be replicated for any other region in Europe or worldwide (but especially in an area with complex topography), could be extremely important in order to get high-quality results in the general context of sustainable, smart-oriented, and scientifically-based agriculture.
Secondly, our results indicated that, despite the almost general impact of climate change on agriculture reported so far, for some regions (like Cluj County) it led to a switch towards better suitability conditions for maize crops. Even though no important changes were identified in the GSL, the conditions for maize crops became more suitable due to the significant increase of GDDgrow, which was detected for the entire arable land area of the county. Thus, suitability zone I, which did not exist until 1990 (based on mean decadal values), became dominant during the sub-period 2001–2013. Our study proves that due to climate change, the areas of suitability considerably changed and current climatic conditions allow for temperate regions to support all the range of maize hybrids. Under these changing conditions, in approximately the same number of days, a higher temperature is cumulated and can be used by crops, allowing us to conclude that a switch of hybrids can be made in the focus area. Moreover, our model allowed identification of the thermal requirements for maize crops for each hybrid type at a spatial resolution of 11 km x 11 km, which is also good enough to produce a high sensitivity model for future development of forecasting.
Based on the results of this research and to meet the stakeholders’ needs, especially those of the maize growers, we can conclude that further analysis is needed to investigate this topic in more detail. This should focus on:
  • Extending the study to larger regions such as Romania as a whole or the entire PannEx region [90] in order to re-assess the agro-thermal conditions by including the requirements for each pheno-phase;
  • Developing the model by including other types of data (e.g., precipitation and soil) over the same historical period, as well as over the coming decades (2021–2050) based on Regional Climate Models output data.
Since critical hybrid switching decisions should be based on long-term research covering a wide range of climatic conditions [79], we consider that the results of this study could become an extremely important tool for stakeholders in the agriculture field (agriculture scientists, farmers, seed sellers, etc.) and for the public authorities in Cluj County in order to improve the productivity of the maize crops, primarily, and to design a new development strategy for a smart and sustainable climate change-oriented agriculture.

Author Contributions

A.-E.C. and T.C.M. had equal contribution to the paper. Conceptualization: A.-E.C.; Methodology: A.-E.C., T.C.M., S.D.V., and V.S.; Validation, A.-E.C., T.C.M., and S.D.V.; Formal Analysis, A.-E.C., T.C.M., S.D.V., V.S., and B.K.; Investigation, A.-E.C. and T.C.M.; Resources, B.K.; Data Curation, A.-E.C. and T.C.M.; Writing–Original Draft Preparation, A.-E.C. and T.C.M.; Writing–Review & Editing, A.-E.C., T.C.M., and V.S.; Visualization, T.C.M. and A.-E.C.; Supervision, A.-E.C., T.C.M., and S.D.V.; Project Administration, A.-E.C.; Funding Acquisition, S.D.V. All authors have read and agreed to the published version of the manuscript.

Funding

This research was funded by CLUJ COUNTY COUNCIL (Worldbank, 2019), and by the UEFISCDI grant number PN-III-P4-ID-PCE-2016-0729 and grant number PN-III-P4-ID-PCCF-2016-0084 implemented by Babeș-Bolyai University, Cluj-Napoca, Romania. The publication was supported by funds from the National Research Development Projects to finance excellence (PFE)-37/2018–2020 granted by the Romanian Ministry of Research and Innovation.

Acknowledgments

The authors acknowledge the National Meteorological Administration of Romania and Joint Research Center for freely provided climatic data. This paper was developed under the framework of the Regional Hydroclimatic Project PannEx: The Pannonian Basin Experiment (flagship question 1). The authors kindly acknowledge Cristina Keaveney and Nick Ticehurst for English technical support and the two anonymous reviewers for their valuable comments and suggestions which helped us to improve the quality of this paper.

Conflicts of Interest

The authors declare no conflict of interest. The funders had no role in the design of the study; in the collection, analyses, or interpretation of data; in the writing of the manuscript; or in the decision to publish the results.

References

  1. Bandara, J.S.; Cai, Y. The impact of climate change on food crop productivity, food prices and food security in South Asia. Econ. Anal. Policy 2014, 44, 451–465. [Google Scholar] [CrossRef]
  2. Intergovernmental Panel on Climate Change (IPCC). Climate Change 2014: Impacts, Adaptation, and Vulnerability. Summary for Policymakers; IPCC: Geneva, Switzerland, 2014. [Google Scholar]
  3. Quan, S.; Li, Y.; Song, J.; Zhang, T.; Wang, M. Wheat Yield: Perspective of Farmers in Henan, of China. Sustainability 2019, 11, 1928. [Google Scholar] [CrossRef] [Green Version]
  4. Kmoch, L.; Pagella, T.; Palm, M.; Sinclair, F. Using Local Agroecological Knowledge in Climate Change Adaptation: A Study of Tree-Based Options in Northern Morocco. Sustainability 2018, 10, 3719. [Google Scholar] [CrossRef] [Green Version]
  5. Olesen, J.E.; Bindi, M. Consequences of climate change for European agricultural productivity, land use and policy. Eur. J. Agron. 2002, 16, 239–262. [Google Scholar] [CrossRef]
  6. Lane, A.; Jarvis, A. Changes in Climate will modify the Geography of Crop Suitability: Agricultural Biodiversity can help with Adaptation. SATE-J. 2007, 4, 1–12. [Google Scholar]
  7. McKenzie, F.C.; Williams, J. Sustainable food production: Constraints, challenges and choices by 2050. Food Secur. 2015, 7, 221–233. [Google Scholar] [CrossRef]
  8. Rótolo, G.C.; Montico, S.; Francis, C.A.; Ulgiati, S. How land allocation and technology innovation affect the sustainability of agriculture in Argentina Pampas: An expanded life cycle analysis. Agric. Syst. 2015, 141, 79–93. [Google Scholar] [CrossRef]
  9. Johnston, K.J. The intensification of pre-industrial cereal agriculture in the tropics: Boserup, cultivation lengthening, and the classic Maya. J. Anthropol. Archaeol. 2003, 22, 126–161. [Google Scholar] [CrossRef]
  10. Chen, J. Rapid urbanization in China: A real challenge to soil protection and food security. Catena 2007, 69, 1–15. [Google Scholar] [CrossRef]
  11. Yu, J.; Chen, Y.; Wu, J. Computers, Environment and Urban Systems Modeling and implementation of classification rule discovery by ant colony optimisation for spatial land-use suitability assessment. Comput. Environ. Urban. Syst. 2011, 35, 308–319. [Google Scholar] [CrossRef]
  12. Kihoro, J.; Bosco, N.J.; Murage, H. Suitability analysis for rice growing sites using a multicriteria evaluation and GIS approach in great Mwea region Kenya. SpringerPlus 2013, 2, 265. [Google Scholar] [CrossRef] [PubMed] [Green Version]
  13. Lobell, D.; Schlenker, W.; Costa-Roberts, J. Climate trends and global crop production since 1980. Science 2011, 333, 616–620. [Google Scholar] [CrossRef] [PubMed] [Green Version]
  14. Lobell, D.; Field, C. Global scale climate—Crop yield relationships and the impacts of recent warming. Environ. Res. Lett. 2007, 2, 014002. [Google Scholar] [CrossRef]
  15. Battisti, D.S.; Naylor, R.L. Historical warnings of future food insecurity with unprecedented seasonal heat. Science 2009, 323, 240–244. [Google Scholar] [CrossRef] [PubMed] [Green Version]
  16. Liambila, R.N.; Kibret, K. Climate change impact on land suitability for rainfed crop production in Lake Haramaya Watershed, Eastern Ethiopia. J. Earth Sci. Clim. Chang. 2016, 7. [Google Scholar] [CrossRef]
  17. Ranjitkar, S.; Sujakhu, N.M.; Merz, J.; Kindt, R.; Xu, J.; Matin, A.; Zomer, R.J. Suitability analysis and projected climate change impact on banana and coffee production zones in Nepal. PLoS ONE 2016, 11. [Google Scholar] [CrossRef] [Green Version]
  18. Lalic, B.; Eitzinger, J.; Dalla Marta, A.; Orlandini, S.; Firanj Sremac, A.; Pacher, B. Agricultural Meteorology and Climatology; Firenze University Press: Firenze, Italy, 2018; pp. 41–55. [Google Scholar]
  19. Ceglar, A.; Zampieri, M.; Toreti, A.; Dentener, F. Observed northward migration of agro-climate zones in Europe will further accelerate under climate change. Earth Future 2019, 7. [Google Scholar] [CrossRef] [Green Version]
  20. Kenny, G.J.; Harrison, P.A.; Olesen, J.E.; Parry, M.L. The effects of climate change on land suitability of grain maize, winter wheat and cauliflower in Europe. Eur. J. Agron. 1993, 2, 325–338. [Google Scholar] [CrossRef]
  21. Worqlul, A.W.; Jaehak, J.; Dile, Y.T.; Osorio, J.; Schmitter, P.; Gerik, T.; Srinivasan, R.; Neville, C. Assessing potential land suitable for surface irrigation using groundwater in Ethiopia. Appl. Geogr. 2017, 85, 1–13. [Google Scholar] [CrossRef]
  22. Abson, D.J.; Dougill, A.J.; Stringer, L.C. Using Principal Component Analysis for information-rich socio-ecological vulnerability mapping in Southern Africa. Appl. Geogr. 2012, 35, 515–524. [Google Scholar] [CrossRef]
  23. Ramankutty, N.; Foley, J.A.; Norman, J.; McSweeney, K. The global distribution of cultivable lands: Current patterns and sensitivity to possible climate change. Glob. Ecol. Biogeogr. 2002, 11, 377–392. [Google Scholar] [CrossRef] [Green Version]
  24. Feng, Q.; Chaubey, I.; Engel, B.; Cibin, R.; Sudheer, K.P.; Volenec, J. Marginal land suitability for switchgrass, Miscanthus and hybrid poplar in the Upper Mississippi River Basin (UMRB). Environ. Model. Softw. 2017, 93, 356–365. [Google Scholar] [CrossRef] [Green Version]
  25. Fischer, G.; Shah, M.; Tubiello, F.; van Velhuizen, H. Socio-economic and climate change impacts on agriculture: An integrated assessment, 1990–2080. Philos. Trans. R. Soc. B Biol. Sci. 2005, 360, 2067–2083. [Google Scholar] [CrossRef] [PubMed]
  26. Gumma, M.; Thenkabail, P.S.; Fujii, H.; Namara, R. Spatial models for selecting the most suitable areas of rice cultivation in the Inland Valley Wetlands of Ghana using remote sensing and geographic information systems. J. Appl. Remote Sens. 2009, 3. [Google Scholar] [CrossRef] [Green Version]
  27. Masoud, J.; Forkuor, G.; Namara, R.; Ofori, E. Modeling inland valley suitability for rice cultivation. ARPN J. Eng. Appl. Sci. 2013, 8, 9–19. [Google Scholar]
  28. Holzkämper, A.; Calanca, P.; Fuhrer, J. Identifying climatic limitations to grain maize yield potentials using a suitability evaluation approach. Agric. For. Meteorol. 2013, 168, 149–159. [Google Scholar] [CrossRef]
  29. Bydekerke, L.; Van Ranst, E.; Vanmechelen, L.; Groenemans, R. Land suitability assessment for cherimoya in southern Ecuador using expert knowledge and GIS. Agric. Ecosyst. Environ. 1998, 69, 89–98. [Google Scholar] [CrossRef]
  30. Maleki, F.; Kazemi, H.; Siahmarguee, A.; Kamkar, B. Development of a land use suitability model for saffron (Crocus sativus L.) cultivation by multi-criteria evaluation and spatial analysis. Ecol. Eng. 2017, 106, 140–153. [Google Scholar] [CrossRef]
  31. Rhebergen, T.; Fairhurst, T.; Zingore, S.; Fisher, M.; Oberthür, T.; Whitbread, A. Climate, soil and land-use based land suitability evaluation for oil palm production in Ghana. Eur. J. Agron. 2016, 81, 1–14. [Google Scholar] [CrossRef] [Green Version]
  32. Zabihi, H.; Ahmad, A.; Vogeler, I.; Nor, M.; Golmohammadi, M.; Golein, B.; Nilashi, M. Land suitability procedure for sustainable citrus planning using the application of the analytical network process approach and GIS. Comput. Electron. Agric. 2015, 117, 114–126. [Google Scholar] [CrossRef]
  33. Akpoti, K.; Kabo-bah, A.T.; Zwart, S.J. Review—Agricultural land suitability analysis: State-of-the-art and outlooks for integration of climate change analysis. Agric. Syst. 2019, 173, 172–208. [Google Scholar] [CrossRef]
  34. EU. EU Adaptation Strategy. 2019. Available online: https://ec.europa.eu/clima/policies/adaptation/what_en (accessed on 20 December 2019).
  35. EU. The Post-2020 Common Agricultural Policy: Environmental Benefits and Simplification. 2019. Available online: https://ec.europa.eu/info/sites/info/files/food-farming-fisheries/key_policies/documents/cap-post-2020-environ-benefits-simplification_en.pdf (accessed on 18 December 2019).
  36. EPA. Agrophenology. 2019. Available online: https://www.eea.europa.eu/data-and-maps/indicators/timing-of-the-cycle-of-2/assessment (accessed on 20 December 2019).
  37. Soare, E.; Dobre, I. Changes and trends of corn production in Romania. Sci. Pap. Ser. Manag. Econ. Eng. Agric. Rural Dev. 2016, 16, 511–516. [Google Scholar]
  38. Cuculeanu, V.; Marica, A.; Simota, C. Climate change impact on agricultural crops and adaptation options in Romania. Clim. Res. 1999, 12, 153–160. [Google Scholar] [CrossRef] [Green Version]
  39. ANM (Administrația Naționala de Meteorologie). Cod de Bune Practici Agricole, în Contextul Schimbarilor Climatice Actuale si Previzibile; ANM: Bucharest, Romania, 2014.
  40. Ministerul Agriculturii și Dezvoltării Rurale. Ordinul nr. 1220/2018 Privind Aprobarea Catalogului Oficial al Soiurilor de Plante de Cultură din Romania Pentru Anul 2018; Ministerul Agriculturii și Dezvoltării Rurale: Bucharest, Romania, 2018.
  41. Worldbank. Cluj County Reimbursable Advisory Services; Worldbank: Washington, DC, USA, 2019. [Google Scholar]
  42. Prăvălie, R.; Sîrodoev, I.; Patriche, C.; Roșca, B.; Piticar, A.; Bandoc, G.; Sfîcă, L.; Tişcovschi, A.; Dumitraşcu, M.; Chifiriuc, C.; et al. The impact of climate change on agricultural productivity in Romania. A country-scale assessment based on the relationship between climatic water balance and maize yields in recent decades. Agric. Syst. 2020, 179. [Google Scholar] [CrossRef]
  43. Croitoru, A.E.; Holobaca, I.H.; Lazar, C.; Moldovan, F.; Imbroane, A. Air temperature trend and the impact on winter wheat phenology in Romania. Clim. Chang. 2012, 111, 393–410. [Google Scholar] [CrossRef]
  44. Croitoru, A.E.; Piticar, A. Changes in daily extreme temperatures in the extra-Carpathians regions of Romania. Int. J. Climatol. 2013, 33, 1987–2001. [Google Scholar] [CrossRef]
  45. Croitoru, A.E.; Piticar, A.; Imbroane, A.M.; Burada, D.C. Spatio-temporal distribution of aridity indices based on temperature and precipitation in the extra-Carpathian regions of Romania. Theor. Appl. Climatol. 2013, 112, 597–607. [Google Scholar] [CrossRef]
  46. Croitoru, A.E.; Piticar, A.; Dragotă, C.S.; Burada, D.C. Recent changes in reference evapotranspiration in Romania. Glob. Planet. Chang. 2013, 111, 127–137. [Google Scholar] [CrossRef]
  47. Croitoru, A.E.; Piticar, A.; Burada, D.C. Changes in precipitation extremes in Romania. Quat. Int. 2016, 415, 325–335. [Google Scholar] [CrossRef]
  48. Croitoru, A.E.; Piticar, A.; Sfîcă, L.; Harpa, G.V.; Roșca, C.F.; Tudose, T.; Horvath, C.; Minea, I.; Ciupertea, F.A.; Scripcă, A.S. Extreme Temperature and Precipitation Events in Romania; Editura Academiei Române: Bucharest, Romania, 2018; pp. 320–359. [Google Scholar]
  49. Harpa, G.V.; Croitoru, A.E.; Djurdjevic, V.; Horvath, C. Future changes in five extreme precipitation indices in the lowlands of Romania. Int. J. Climatol. 2019. [Google Scholar] [CrossRef]
  50. Dumitrescu, A.; Birsan, M.V. ROCADA: A gridded daily climatic dataset over Romania (1961–2013) for nine meteorological variables. Nat. Hazards 2015, 78, 1045–1063. [Google Scholar] [CrossRef]
  51. National Institute for Statistics (NIS). AGR108A. 2019. Available online: http://statistici.insse.ro:8077/tempo-online/#/pages/tables/insse-table (accessed on 25 October 2019).
  52. Sandu, I.; Pescaru, V.I.; Poiana, I. Clima Romaniei; Editura Academiei Romane: Bucharest, Romania, 2008. [Google Scholar]
  53. Sfîca, L.; Croitoru, A.E.; Iordache, I.; Ciupertea, A.F. Synoptic Conditions Generating Heat Waves and Warm Spells in Romania. Atmosphere 2017, 8, 50. [Google Scholar] [CrossRef] [Green Version]
  54. National Agency for Cadaster and Real Estate Publicity (ANCPI). Cluj County Orthoimagery; ANCPI: Bucharest, Romania, 2018. [Google Scholar]
  55. European Environment Agency (EEA). Corine Land Cover (CLC), Version 20. 2018. Available online: https://land.copernicus.eu/pan-european/corine-land-cover/clc2018?tab=download (accessed on 1 March 2020).
  56. Crafts-Brandner, S.J.; Salvucci, M.E. Sensitivity of photosynthesis in a C4 plant, maize, to heat stress. Plant Physiol. 2002, 129, 1773–1780. [Google Scholar] [CrossRef] [PubMed] [Green Version]
  57. Bonner, J.; Varner, J.E. Plant Biochemistry; Elsevier Academic Press: Amsterdam, The Netherlands, 2012; p. 656. [Google Scholar] [CrossRef]
  58. Cohen, S.J.; Waddell, M.W. Climate Change in the 21st Century; McGill-Queen’s Press-MQUP: Montreal, QC, Canada, 2009. [Google Scholar]
  59. Bojariu, R.; Bîrsan, M.V.; Cică, R.; Velea, L.; Burcea, S.; Dumitrescu, A.; Dascălu, S.I.; Gothard, M.; Dobrinescu, A.; Cărbunaru, F.; et al. Schimbările Climatice–de la Bazele Fizice la Riscuri și Adaptare; Printech: Bucharest, Romania, 2015; p. 200. [Google Scholar]
  60. Busuioc, A.; Caian, M.; Cheval, S.; Bojariu, R.; Boroneant, C.; Baciu, M.; Dumitrescu, A. Variabilitatea si Schimbarea Climei in Romania; Pro Universitaria Press: Bucharest, Romania, 2010. [Google Scholar]
  61. Alexander, L.; Herold, N. ClimPACT2 Indices and Software; The University of South Wales: Sydney, Australia, 2016; Available online: https://github.com/ARCCSS-extremes/climpact2 (accessed on 15 December 2016).
  62. Mann, H.B. Non-parametric tests against trend. Econometrica 1945, 13, 245–259. [Google Scholar] [CrossRef]
  63. Kendall, M.G. Rank Correlation Methods, 4th ed.; Charles Griffin: London, UK, 1975. [Google Scholar]
  64. Salmi, T.; Määttä, A.; Anttila, P.; Ruoho-Airola, T.; Amnell, T. Detecting Trends of Annual Values of Atmospheric Pollutants by the Mann-Kendall Test and Sen’s Slope Estimates—The Excel Template Application MAKESENS. Publications on Air Quality No. 31, Report Code FMI-AQ-31. 2002. Available online: http://www.fmi.fi/kuvat/MAKESENS_MANUAL.pdf (accessed on 10 January 2008).
  65. Wu, S.; Yin, Y.; Zheng, D.; Yang, Q. Moisture Conditions and Climate Trends in China during the Period 1971–2000. Int. J. Climatol. 2006, 26, 193–206. [Google Scholar] [CrossRef]
  66. Liu, X.; Zheng, H.; Zhang, M.; Liu, C. Identification of dominant climate factor for pan evaporation trend in the Tibetan Plateau. J. Geogr. Sci. 2011, 21, 594–608. [Google Scholar] [CrossRef]
  67. Tabari, H.; Aeini, A.; Hosseinzadeh Talaee, P.; Shifteh Some’e, B. Spatial distribution and temporal variation of reference evapotranspiration in arid and semi-arid regions of Iran. Hydrol. Process. 2011, 26, 500–512. [Google Scholar] [CrossRef]
  68. Tabari, H.; Abghani, H.; Hosseinzadeh Talaee, P. Temporal trends and spatial characteristics of drought and rainfall in arid and semiarid regions of Iran. Hydrol. Process. 2012. [Google Scholar] [CrossRef]
  69. Shifteh Some’e, B.; Ezani, A.; Tabari, H. Spatiotemporal trends of aridity index in arid and semi-arid regions of Iran. Theor. Appl. Clim. 2013, 111, 149–160. [Google Scholar] [CrossRef]
  70. Tabar, H.; Aghajanloo, M.B. Temporal pattern of monthly aridity index in Iran with considering precipitation and evapotranspiration trends. Int. J. Clim. 2013, 33, 396–409. [Google Scholar] [CrossRef]
  71. Gilbert, R.O. Statistical Methods for Environmental Pollution Monitoring; Van Nostrand Reinhold: New York, NY, USA, 1987. [Google Scholar]
  72. Roman, G.V.; Tabără, V.; Robu, T.; Pîrșan, P.; Ștefan, M.; Axinte, M.; Morar, G.; Cernea, S. Fitotehnie, Vol. I, Cereale și Leguminoase Pentru Boabe; Editura Universitară: Bucharest, Romania, 2011; p. 205. [Google Scholar]
  73. Edmeades, G.O. Developing Drought and Low N-Tolerant Maize. In Proceedings of the Symposium, El Batán, Mexico, 25–29 March 1996; CIMMYT: El Batán, Mexico, 1996. [Google Scholar]
  74. Bennetzen, J.L. (Ed.) Handbook of Maize; Springer: New York, NY, USA, 2009; pp. 693–713. [Google Scholar]
  75. Mishra, V. 2.12—Food Security Implications of Climate Variability and Climate Change. In Climate Vulnerability; Pielke, R.A., Ed.; Academic Press: Cambridge, MA, USA, 2013; pp. 117–128. [Google Scholar]
  76. Assefa, Y.; Roozeboom, K.L.; Thompson, C.R.; Schlegel, A.J.; Stone, L.; Lingenfelser, J.E. Corn and grain sorghum morphology, physiology and phenology. Corn Grain Sorghum Comp. 2014, 3–14. [Google Scholar] [CrossRef]
  77. Neacşa, O.; Berbecel, O. Climatologie şi Agrometeorologie (Climatology and Agroclimatology, in Romanian); Editura Didactică şi Pedagogică: Bucharest, Romania, 1979. [Google Scholar]
  78. Mitrică, B.; Mateescu, E.; Dragotă, C.S.; Grigorescu, I.; Dumitraşcu, M.; Popovici, E.A. Climate change impacts on agricultural crops in the Timiş Plain, Romania. Rom. Agric. Res. 2015, 32, 93–101. [Google Scholar]
  79. Jeschke, M.; Paszkiewicz, S. Hybrid Maturity Switches Based on Long-Term Research. Crop Insights. Available online: https://www.pioneer.com/us/agronomy/hybrid_maturity_switches.html.CornAdjuststoLaterPlanting_10 (accessed on 25 October 2019).
  80. Kim, J.; Park, H.; Chun, J.A.; Li, S. Adaptation Strategies under Climate Change for Sustainable Agricultural Productivity in Cambodia. Sustainability 2018, 10, 4537. [Google Scholar] [CrossRef] [Green Version]
  81. Loboguerrero, A.M.; Campbell, B.M.; Cooper, P.J.M.; Hansen, J.W.; Rosenstock, T.; Wollenberg, E. Food and Earth Systems: Priorities for Climate Change Adaptation and Mitigation for Agriculture and Food Systems. Sustainability 2019, 11, 1372. [Google Scholar] [CrossRef] [Green Version]
  82. Hou, J.; Hou, B. Farmers’ Adoption of Low-Carbon Agriculture in China: An Extended Theory of the Planned Behavior Model. Sustainability 2019, 11, 1399. [Google Scholar] [CrossRef] [Green Version]
  83. Caubel, J.; de Cortzar-Atauri, I.G.; Launay, M.; de Noblet-Ducoudr, N.; Huard, F.; Bertuzzi, P.; Graux, A.I. Broadening the scope for ecoclimatic indicators to assess crop climate suitability according to ecophysiological, technical and quality criteria. Agric. For. Meteorol. 2015, 207, 94–106. [Google Scholar] [CrossRef]
  84. Mkhabela, M.; Bullock, P.; Gervais, M.; Finlay, G.; Sapirstein, H. Assessing indicators of agricultural drought impacts on spring wheat yield and quality on the Canadian prairies. Agric. For. Meteorol. 2010, 150, 399–410. [Google Scholar] [CrossRef]
  85. Holzkämper, A.; Calanca, P.; Fuhrer, J. Analyzing climate effects on agriculture in time and space. Procedia Environ. Sci. 2011, 3, 58–62. [Google Scholar] [CrossRef] [Green Version]
  86. Gouache, D.; Le Bris, X.; Bogard, M.; Deudon, O.; Pagé, C.; Gate, P. Evaluating agronomic adaptation options to increasing heat stress under climate change during wheat grain filling in France. Eur. J. Agron. 2012, 39, 62–70. [Google Scholar] [CrossRef]
  87. Ceglar, A.; van der Wijngaart, R.; de Wit, A.; Lecerf, R.; Boogard, H.; Seguini, L.; van den Berg, M.; Toreti, A.; Zampieri, M.; Fumagalli, D.; et al. Improving WOFOST model to simulate winter wheat phenology in Europe: Evaluation and effects on yield. J. Agric. Syst. 2019, 168, 168–180. [Google Scholar] [CrossRef]
  88. Brink, M. Cereals and Pulses; PROTA: Wageningen, The Netherlands, 2006; Volume 1. [Google Scholar]
  89. Smith, C.W.; Betrán, J.; Runge, E.C.A. Corn: Origin, History, Technology, and Production; John Wiley & Sons: Hoboken, NJ, USA, 2004; Volume 4. [Google Scholar]
  90. Ceglar, A.; Croitoru, A.E.; Cuxart, J.; Djurdjevic, V.; Güttler, I.; Ivančan-Picek, B.; Jug, D.; Lakatos, M.; Weidinger, T. PannEx: The Pannonian Basin Experiment. Clim. Serv. 2018, 11, 78–85. [Google Scholar] [CrossRef]
Figure 1. Study area: Cluj County, Romania.
Sustainability 12 02783 g001
Figure 2. Spatial distribution and changes detected in the GSL index considering the arable land of Cluj County over the period 1981-2013: (a) spatial distribution based on ROCADA data (days/y); (b) trend detected in the GSL series calculated based on ROCADA data; (c) spatial distribution based on Agri4Cast Resources Portal data (days/y); (d) trend detected in GSL series calculated based on Agri4Cast Resources Portal data.
Sustainability 12 02783 g002
Figure 3. Spatial distribution and changes detected in suitability zones calculated based on GDDgrow index in the arable land of Cluj County over the period 1981–2013: (a) spatial distribution based on ROCADA data; (b) trend detected based on ROCADA data; (c) spatial distribution based on Agri4Cast Resources Portal data; (d) trend detected based on Agri4Cast Resources Portal data.
Sustainability 12 02783 g003
Figure 4. Arable land area covered by different suitability conditions for maize crops assessed by using GDDgrow index in Cluj County over the period 1981–2013 (%).
Sustainability 12 02783 g004
Figure 5. Spatial distribution of suitability zones based on GDDgrow index in Cluj County derived from: ROCADA data (ac); Agri4Cast Resources Portal data (df).
Sustainability 12 02783 g005
Figure 6. Area covered by suitability conditions for maize crops for the arable land in Cluj County over the 10/13-y sub-periods (%) derived from: (a) ROCADA data, (b) Agri4CastResources Portal data.
Sustainability 12 02783 g006
Table 1. Indices used (after [61]).
Index Short NameIndex Long NameDefinitionUnits
GSLGrowing season lengthAnnual number of days between the first occurrence of 6 consecutive days with Tmed > 5 °C and the first occurrence of 6 consecutive days with Tmed < 5 °CDays
GDDgrowGrowing degree
days
Annual sum of Tmed–Tb (where Tb is a user-defined location-specific base temperature and Tmed > Tb)°C
Table 2. FAO classification and GSL for maize hybrids maturity (after [72], completed).
Maturity HybridFAO ClassificationGSL (days/y)
Extremely early100–19976–85
Early200–29986–112
Intermediate300–399113–129
Late400–600130–145
Very late>600>150
Table 3. FAO classification of suitability classes for maize crops based on GDDgrow (°C) (after [72]).
Suitability ClassGDDgrow (°C/y)
Unsuitable<800
Suitability III800–1200
Suitability II1201–1400
Suitability I1401–1600

