Article

Impacts of Different Air Pollutants on Dining-Out Activities and Satisfaction of Urban and Suburban Residents

College of Chemical Engineering and Environment, China University of Petroleum, Beijing 102249, China
*
Author to whom correspondence should be addressed.
Sustainability 2020, 12(7), 2746; https://doi.org/10.3390/su12072746
Submission received: 12 February 2020 / Revised: 28 March 2020 / Accepted: 30 March 2020 / Published: 31 March 2020
(This article belongs to the Special Issue Urban Health and Sustainability)

Abstract

:
Air pollution has become a global environmental problem that directly affects the living quality of city residents. It not only does damages to the physical health of the human body but also has adverse effects on mood, outdoor activities, and social interactions, which further reduces the vitality of the city. Dining out is an important way of social interaction for city residents. Using Beijing as an example, this paper aims to study the impacts of different air pollutants on dining-out activities and satisfaction of urban and suburban residents. The results show that: (1) Air pollution can significantly reduce dining-out frequency and satisfaction; (2) Due to differences in environmental and health awareness, the impact of air pollution on dining-out behaviors varies among urban and suburban residents; and (3) O3 pollution has a greater emotional impact on suburban residents than urban residents, possibly because of the differences in defense strategies and levels of pollution exposure in the workplace. The findings imply that improving air quality can obtain not only health benefits but also long-term social and economic vitality. The publicity of environment and health information should be strengthened on key urban air pollutants, especially on particulate matter and O3, and on disadvantaged groups to enhance environmental justice.

1. Introduction

With the rapid development of the economy, China has become the world’s second-largest economy and the engine of global economic growth. At the same time, China is facing the problems of increased energy consumption and severe urban air pollution. According to the official statistics, in 2017, only 32.9% of the 380 cities met the national ambient air quality standard of PM2.5 (35 μg/m3), and only Diqing Tibetan Autonomous Prefecture met the WHO guideline value of PM2.5 (10 μg/m3). Some studies have found that air pollution not only affects people’s physical health, but also has negative impacts on individual activities and life satisfaction.
It has been widely recognized that air pollution directly affects human health. A large number of toxicological studies have confirmed that air pollution is associated with respiratory diseases [1,2], cardiovascular diseases [3,4], impaired cognitive function [5,6,7], and increased mortality [8,9,10].
Zeidner and Shechter believed that outdoor environments such as weather (temperature, precipitation, wind speed, etc.), noise, and environmental pollution could affect the human mood [11]. The association between air pollution and mental health has been increasingly gaining attention. Studies in different countries showed that both acute and long-term exposure to air pollution were positively correlated with the occurrence of negative mood. Szyszkowicz et al. found that exposure to air pollution was associated with increased risk of an emergency department visit for depression in Canada [12,13]. According to cohort or cross-sectional study, researchers pointed out that a lower level of air quality caused anxiety and depression [14,15,16]. Furthermore, a number of researchers found that air pollution could lower people’s expressed happiness [17,18,19,20] and life satisfaction [21,22]. The hazard of air pollution on people’s physical and mental health may further affect behaviors. In a polluted environment, residents will protect themselves by reducing exposure intensity and time, such as by wearing a mask, driving a private car, and decreasing the frequency of outing. Zhang et al. found that 82% of the Beijing respondents purchased masks or air purifiers as the individual health protection measure of haze [23]. Yu et al. found that ambient PM2.5 pollutions significantly discouraged the physical activities of first-year students in universities in Beijing [24]. Ward and Beatty found that when air pollution was severe, the average time that the American residents spent outside would be reduced by 18%, and reduced by 59% for the elderly [25]. Heyes et al. showed that the mood changes induced by air pollution could decrease risk tolerance operating and trading behavior of stock investors, which reduced the stock yield [26]. Air pollution can also increase suicide and unethical behavior when anxiety grows [27,28,29].
The objective of this paper is to study the influence of different air pollutants on the dining-out activities and satisfaction of urban and suburban residents. Dining out is one of the important consumption activities of city residents. It is a social platform for people to achieve face-to-face interaction and communication, which can effectively stimulate creativity and achieve new business cooperation. If air pollution is severe, people’s dining-out willingness will be reduced. By investigating the impact of pollution on residents’ dining-out pattern, we could understand the influence of air pollution on social interaction and urban vitality. Based on the research framework of Zheng et al. [30] which studied the influence of PM2.5 on the dining-out frequency and satisfaction of Beijing residents, this paper further studies the behavioral and emotional influence of different air pollutants on different population groups.
The remainder of the paper is structured as follows. Section 2 describes the data and methodology, and outlines hypotheses and models. Section 3 presents the empirical results, and Section 4 the conclusions and policy recommendations.

2. Data and Methodology

2.1. Study Area

Beijing has developed rapidly in the past 20 years, with impressive GDP growth and prosperous catering industry on the one hand, but severe air pollution and considerable differences of income and educational level between urban and suburban areas on the other hand. Xicheng and Huairou were randomly selected as the sample districts for the urban and suburban areas, respectively. Figure 1 shows the geographical location of the study areas. Table 1 describes the socioeconomic characteristics of the study areas in 2016.
As can be seen from Table 1, Xicheng is the core functional area of Beijing with a dense population and convenient transportation. Huairou is an ecological conservation development zone with a small population density. There are considerable differences between Xicheng and Huairou in economic structure, residents’ income, and educational level. The proportion of tertiary industry and annual per capita income and expenditure in Xicheng are twice that in Huairou, and the population with higher education in Xicheng is nearly three times that in Huairou.

2.2. Data

2.2.1. Dining-Out Data

We collected residents’ dining-out frequency, satisfaction, and consumption level from the Dianping website. Dianping is an independent third-party website which mainly provides users with restaurant information, consumer reviews, and ratings (5 point scales) of restaurants and other information services. The number of monthly active users in Dianping exceeds 200 million and the monthly page views (websites and mobile devices) exceeds 20 billion. The high traffic and popularity of the website ensure the representativeness of data. Fifty restaurants in Xicheng District and 60 restaurants in Huairou District were selected using systematic sampling. We used the daily total number of reviews, daily average scores, and weighted average of per capita consumption level of 50 (60) sample restaurants in Xicheng District (Huairou District) to measure the urban (suburban) residents’ dining-out frequency, satisfaction, and consumption level of the day. Although not all diners make comments online, the total number of reviews is less than the actual number of dining out, but the two numbers are highly correlated. If the number of dining out increases, the number of reviews will increase, and vice versa. Therefore, the change direction and degree of the number of reviews can be used to represent the change in the number of people dining out. Dining satisfaction is people’s overall feeling of the food taste and quality of service in the restaurant. A person’s rating of a meal can reflect their satisfaction with the meal. Studies have shown that subjective satisfaction decreases when air pollution is severe [21,22]. It can be inferred that even if the food taste and quality of service are the same, people in polluted environments may score lower.

2.2.2. Air Pollution and Weather Data

Air pollution data in 2016 were collected from Beijing Environmental Protection Monitoring Center, including station-level daily concentrations of five kinds of air pollutants (PM2.5, PM10, NO2, SO2, O3) from two monitoring stations, Guanyuan and Huairou, indicating the air pollution situation of Xicheng and Huairou District, respectively.
In addition to air pollution, some weather factors also affect mood and frequency of outdoor activities. We collected the daily data of average temperature, relative humidity, precipitation, wind speed, and visibility of Beijing from Weather Underground (www.wunderground.com/weather/cn/beijing), a website reporting real-time city-level meteorological data around the world, data of which have been used in a number of scientific studies [31,32].

2.3. Hypotheses and Models

Four hypotheses are developed and to be tested in this study.
Hypothesis 1.
Air pollution could reduce residents’ dining-out frequency, which could be shown as a reduction in the number of reviews.
The measurement model is as follows:
lnREVIEWSt = β0 + β1POLLUTIONt + β2Xt + β3HOLIDAYt + Tt + δt + εt
where t indicates the day, REVIEWS is the daily total number of sample restaurants’ reviews. POLLUTION is the daily concentration of one of the five pollutants (PM2.5, PM10, NO2, SO2, O3). X is the weather control variables (average temperature, relative humidity, precipitation, wind speed, and visibility). HOLIDAY is a dummy variable that indicates whether a day is a holiday (including weekends) to control the effect of increased eating out (including local residents and cross-region residents) on the frequency and satisfaction of dining out during the holidays. T is a linear time trend, with a value of 1 on the first day and an increase of 1 on each passing day, and a value of 366 on the last day of 2016. This variable is used to control the changes of people dining out over time. δ is the monthly fixed effect and ε represents the error term.
Hypothesis 2.
Air pollution could reduce residents’ dining-out satisfaction.
Air pollution might have a direct impact on people’s mood and could result in reduced satisfaction. Therefore, a decrease in their ratings of restaurants. The rating function reads:
lnRATINGt = β0 + β1′POLLUTIONt + β2′Xt + β3′HOLIDAYt + β4lnEXPDTt + Tt + δt + εt
where RATING is the daily average scores of sample restaurants. EXPDT is the daily weighted average of per capita consumption level of sample restaurants to control the influence of the restaurant quality on the rating. The other variables are the same as Equation (1).
Hypothesis 3.
Air pollution could have different effects on residents in urban and suburban districts.
Due to factors such as educational level [33,34], income level [35,36], and information disclosure [37,38], urban and suburban residents may have different behavioral and emotional responses to air pollution.
Hypothesis 4.
Different air pollutants could have different effects on people’s dining-out behavior and satisfaction.
Compared with NO2, SO2, and O3, particulate matter is more easily perceived. PM10 and PM2.5 are highly correlated with atmospheric visibility [39,40]. Most of the PM10 can be adhered to or removed by the cilia-mucus layer on the surface of the respiratory tract, but excessive particle deposition will irritate the airway. PM2.5 is small enough to penetrate the deepest part of lungs, which causes oxidative stress and other toxicological effects [41].
People who are exposed to high concentrations of NO2, SO2 and O3 may have uncomfortable symptom of respiratory tract. NO2 has a small stimulation effect on the upper respiratory tract and eye conjunctiva, and mainly acts on the deep respiratory tract and alveoli. Prolonged exposure to NO2 can cause chest tightness, respiratory distress, cough, and other symptoms [42]. SO2 is mainly absorbed by the nasal cavity and upper respiratory mucosa with irritating odor. The concentration above 0.5 ppm of SO2 in the atmosphere has a potential impact on the upper respiratory tract of the human body. At the concentration of 1 to 3 ppm, most people begin to feel shortness of breath [43]. O3 may trigger more intense physiological and emotional responses to sensitive populations. Exposure to a high concentration of O3 results in cough, dyspnea, and weakened lung function [44,45]. Additionally, O3 has a significant negative impact on life satisfaction, and people with environmental worries are more affected by O3 pollution [46].
Differences in perceptibility and damage mechanisms of various pollutants may cause different levels of behavioral and emotional responses.

3. Results and Analysis

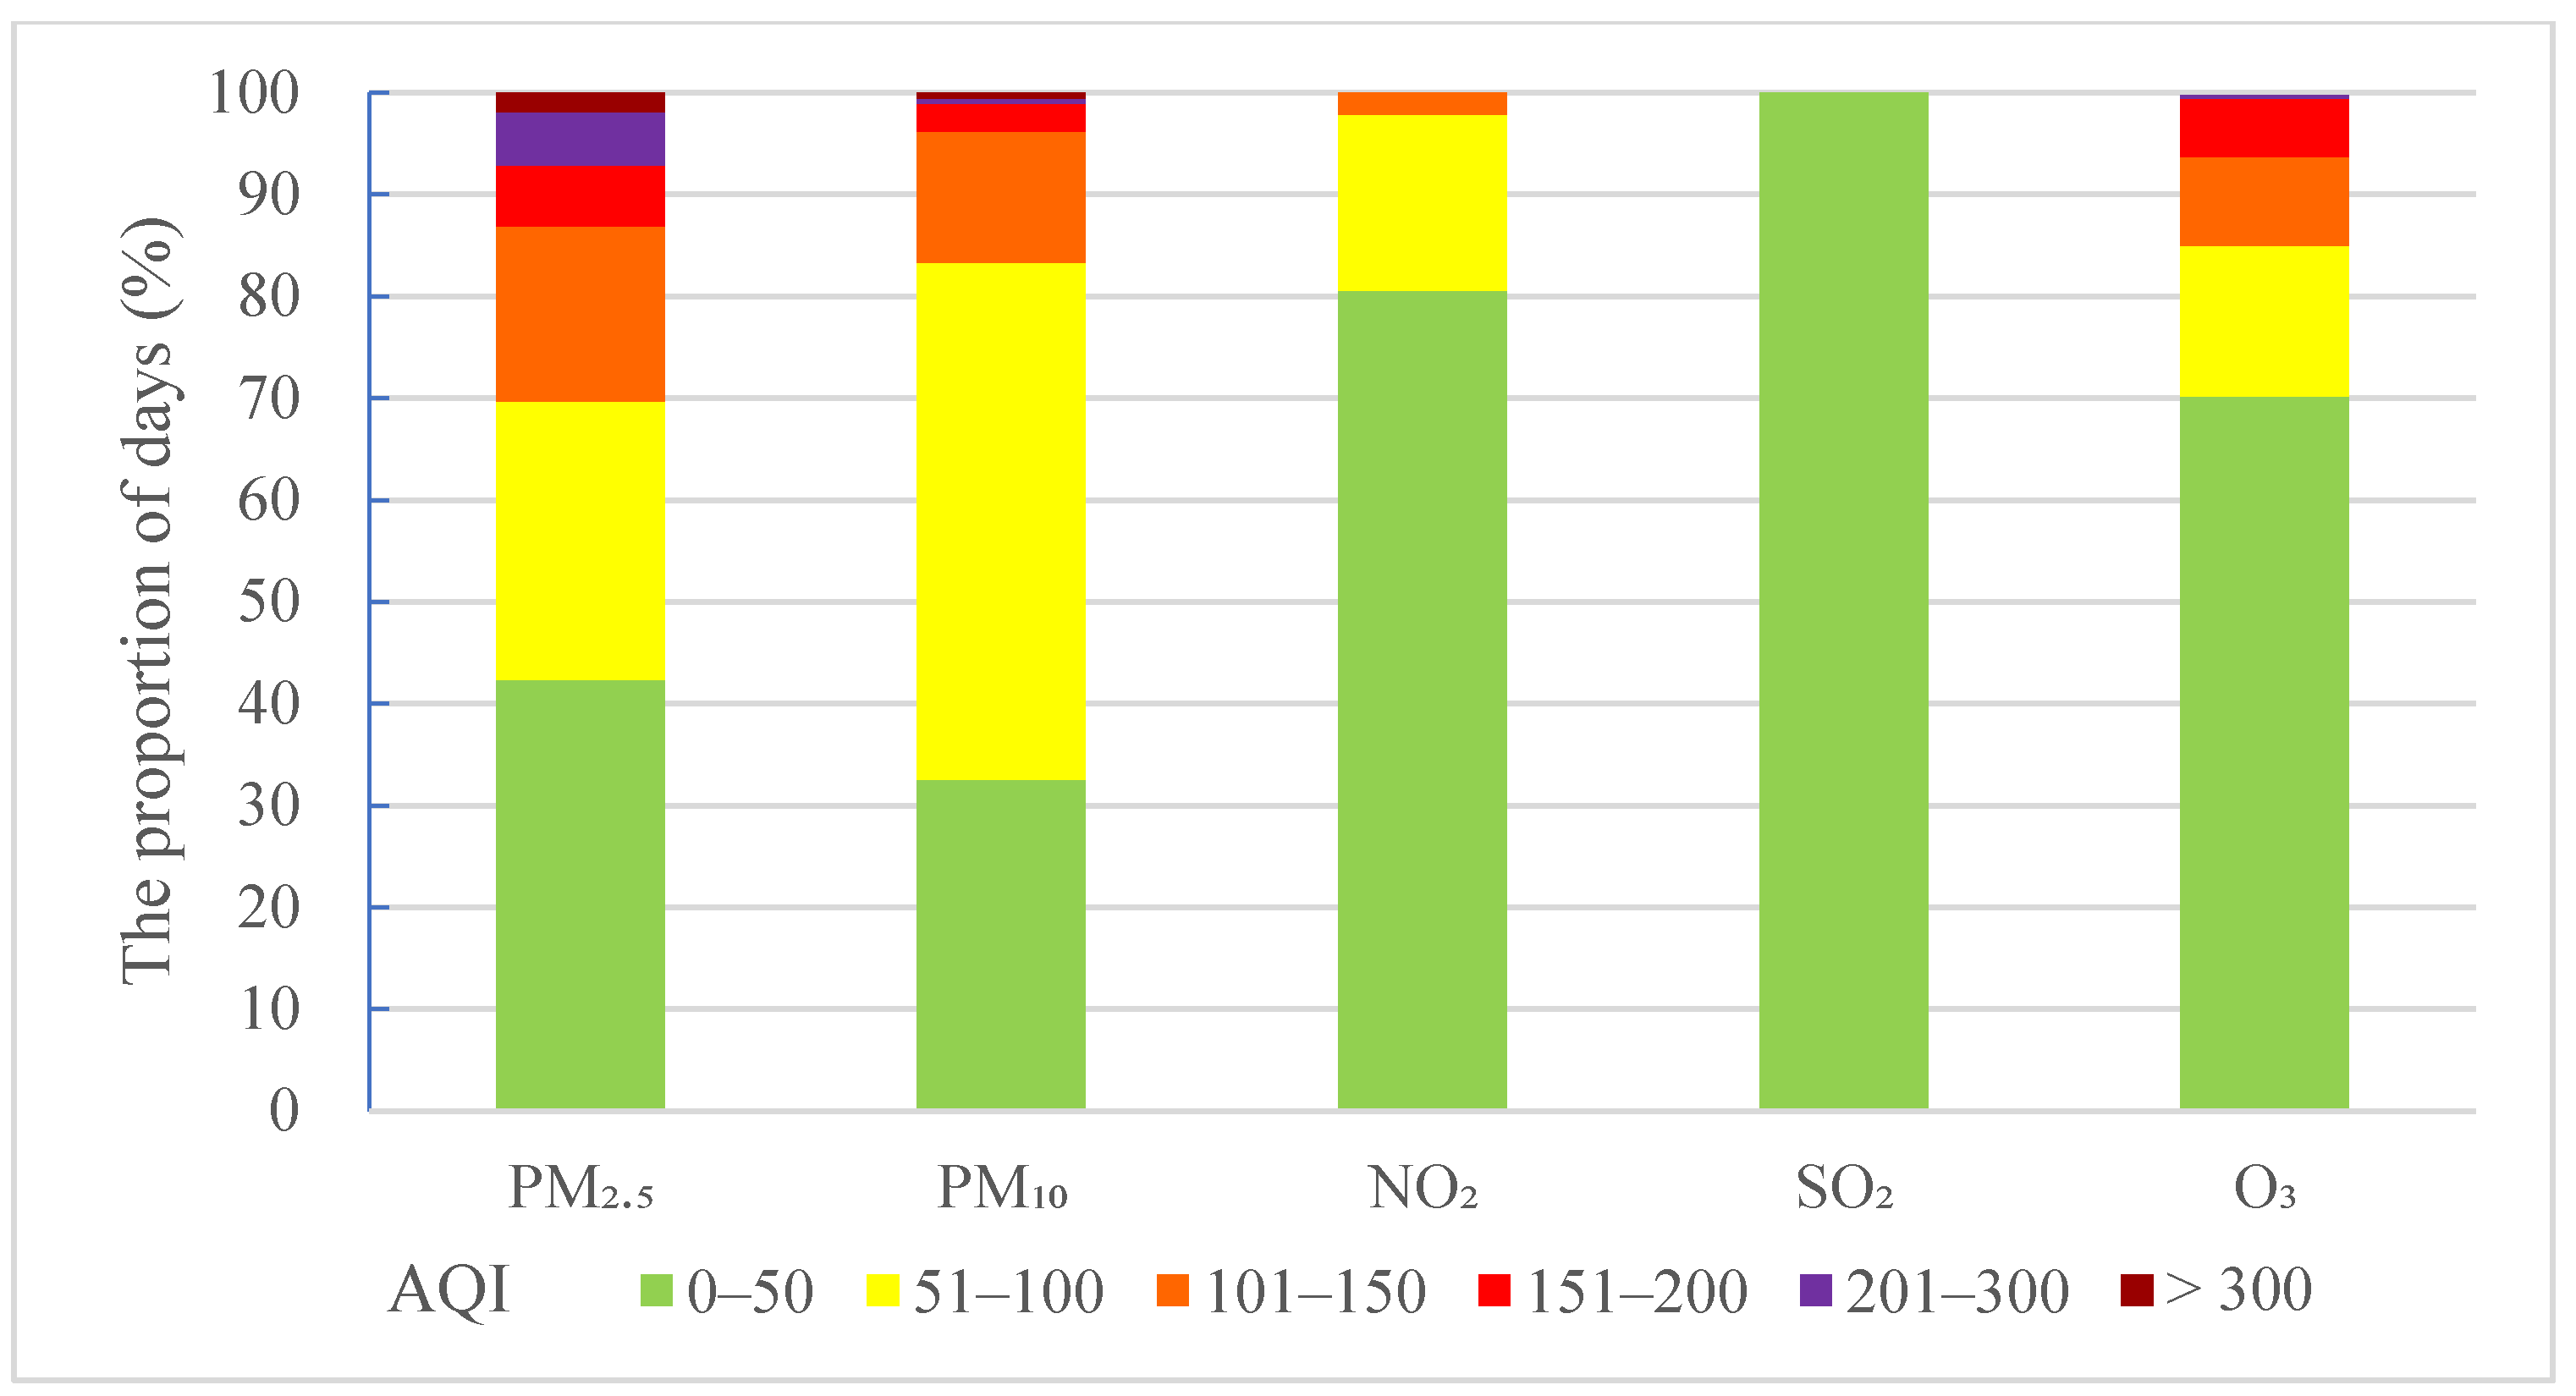
3.1. Air Quality in Urban and Suburban Areas of Beijing

Air pollution can be classified into six grades, according to the concentration limits for each pollutant in the Ambient Air Quality Index (AQI) Technical Regulations (HJ 633-2012) (see Table 2). The higher the AQI, the more significant impact of air pollution on human health. Annual distribution of AQI levels of five air pollutants in Xicheng and Huairou District in 2016 are shown in Figure 2 and Figure 3.
Figure 2 and Figure 3 show that among the five pollutants, the pollution levels of PM2.5 and PM10 are more severe. Compared with other pollutants, both PM2.5 and PM10 have more days of heavy and severe pollution and fewer days of excellent and good air quality. According to the source apportionment result of PM2.5 in Beijing released by the Beijing Municipal Environmental Protection Bureau in 2017, mobile sources account for up to 45% of the local pollution sources, with diesel vehicles making the largest contribution. Industrial sources account for 12% of the local sources, among which petrochemical industry, automotive industry, printing industry, and other volatile organic emission industries contribute more. Due to the great efforts of Beijing in energy structure adjustment and industrial pollution control in recent years, the pollution of SO2 has been well controlled, as more than 99% of the days are of excellent level. With the increasing numbers of motor vehicle, NOx and O3 become the important characteristic pollutants in Beijing. In 2016, the days with light or above level pollution of NO2, and O3 accounted for 16% and 18%, respectively. On the whole, the air quality in the suburban area is much better than that in urban areas.

3.2. Impact of Air Pollution on Dining-Out Frequency

Table 3 describes the variables of dining-out and air pollutants.
In Table 3, the number of reviews and per capita consumption of urban restaurants is higher than those of suburban restaurants. Moreover, all the daily average concentrations of the five air pollutants in urban areas are higher than those in suburban areas.
The influencing factors of the dining-out frequency of urban and suburban residents are shown in Table 4 and Table 5, respectively.
Table 4 and Table 5 show that F statistics of all the models are significant and the adjusted R2 is high, which suggests the model could well explain the relationship between dining-out frequency and air pollutants. The dummy variable HOLIDAY has a positive and significant effect on dining-out frequency, indicating that residents eat out more frequently during the holidays.
Table 4 indicates that PM2.5, PM10, and NO2 negatively influence the dining-out frequency of urban residents—that is, the higher the concentration of pollutants, the lower the dining-out frequency of urban residents. For every 1% increase in the concentrations of PM2.5, PM10, and NO2, the dining-out frequency of urban residents reduces 0.059%, 0.063%, and 0.058%, respectively. Beijing has made great efforts to control SO2 emissions in recent years. In 2016, the mean concentration of SO2 in Xicheng District is 11.4 μg/m3 and the highest concentration is 62.0 μg/m3. The daily air quality of SO2 in 2016 was excellent or good throughout the year, so it did not significantly affect the behavior of urban residents. Since there is no significant effect on the visibility and odor of the atmosphere, O3 pollution is not easy to perceive, so it has no significant impact on the behavior of residents.
Table 5 presents that all the five pollutants have no significant effect on the dining-out frequency of suburban residents. The above results support hypothesis 1 that air pollution could reduce residents’ dining-out frequency and hypothesis 3 that air pollution could have different effects on residents in urban and suburban districts. Except for O3 and SO2, the other three pollutants have impacts on the dining-out frequency of urban residents, while no pollutants affect the behavior of suburban residents. The possible reasons are that urban residents have a higher level of education and better access to information, thus having a stronger environmental health awareness and more significant behavioral responses to air pollution.

3.3. Impact of Air Pollution on Dining-Out Satisfaction

Table 6 and Table 7 present the findings for the influencing factors of dining-out satisfaction of urban and suburban residents.
F statistics of all the models in Table 6 and Table 7 are significant, which suggest that the models can partly explain the change of dining-out satisfaction. O3 pollution has a significant effect on the dining-out satisfaction of residents in a suburban area (p < 0.05, see Table 7). The higher the concentration of O3, the lower the dining-out satisfaction of suburban residents. These are consistent with the findings of other researchers [46], indicating that O3 pollution not only reduces overall satisfaction with life, but also reduces the satisfaction of specific activities such as dining out. This result supports the hypothesis 2 that air pollution could reduce residents’ dining-out satisfaction.
Unlike the significant impact of O3 on suburban residents, none of the five pollutants had an observable effect on the satisfaction of urban residents (see Table 6). The possible reasons are that people with different incomes and education levels invest differently in environmental defensive strategies [47]. People with higher incomes and education tend to buy more expensive and effective defensive products, such as masks and air filters, to reduce exposure risks to outdoor and indoor pollution. They also usually spend less time working outdoors, so the pollution exposure level is relatively low. Compared with suburban residents, the per capita income and education level of urban residents in Beijing are much higher. It can be inferred that urban residents have a higher willingness and ability to protect themselves from pollution damage than suburban residents. Therefore, in Beijing, the harm of O3 to the mental health of urban residents is less than that of suburban residents. This result supports the hypothesis 3 that air pollution could have different effects on residents in both urban and suburban districts.
Based on the results of regression analysis, we summarize the effects of five pollutants on the dining-out behavior and satisfaction of urban and suburban residents in Table 8.
Table 8 shows that for urban residents, the pollution of PM2.5, PM10, and NO2 lower their dining-out frequency. O3 reduces the dining-out satisfaction of suburban residents. These results support hypothesis 4 that different air pollutants could have different effects on people’s dining-out behavior and satisfaction. The results show that air pollution directly affects people’s outdoor activities and satisfaction. The main reason people reduce the frequency of eating out is to prevent pollution exposure from damaging health. The mechanism by which pollution triggers negative moods and then changes in dining-out frequencies is not observed.

4. Conclusions

This paper contributes to a better understanding of the emotional and behavioral influence of different air pollutants on different population groups. The main results are: (1) Air pollution can reduce willingness and satisfaction in outdoor activities; (2) Due to differences in environmental and health awareness, the impact of air pollution on dining-out behaviors varies among urban and suburban residents; and (3) O3 pollution has a greater emotional impact on suburban residents than urban residents possibly due to the differences in defense strategies and levels of pollution exposure in the workplace.
Consistent with previous studies, we find a negative and significant association between air pollution and people’s behavior and satisfaction. Furthermore, we compare the effects of different pollutants on people living in different areas. We find that people’s understanding of air pollutants is insufficient and it is urgent to enhance information disclosure and publicity of environmental knowledge. The results indicate the multidimensional effects of air pollution, which should be paid more attention to and studied in depth.
Air pollution affects all aspects of people’s lives. The impact of air pollution on people’s behavior and satisfaction could reduce the frequency of social interaction and its positive spillover effect in cities, thus further decreasing the social and economic vitality of the city. The findings of this paper imply that improving air quality can obtain not only health benefits, but also long-term social and economic vitality. Through strict regulations, China has made great achievements in controlling sulfur dioxide emissions and has brought huge environmental and social benefits. Next, more effective policies should be implemented to reduce emissions of particulate matter, and ozone precursors such as NOx and VOCs. The prevention and control of these pollutants requires the joint participation of government, companies, and citizens.
It is necessary to strengthen the publicity of the environment and health information on crucial air pollutants, especially on particulate matter and O3, which are nowadays the important characteristic pollutants in most large cities globally. Moreover, more emphasis on this information services should be targeted on people with low educational and income level to improve the environmental health awareness and defensive capability of these disadvantaged groups. This could contribute to strengthening environmental justice to promote the equal sharing of negative environmental impacts of social and economic development by people with different social and economic attributes.

Author Contributions

Conceptualization, H.M. (Hua Ma); formal analysis, R.G.; funding acquisition, H.M. (Hua Ma); investigation, R.G., H.M. (Hongmei Ma) and J.L.; methodology, R.G.; project administration, H.M. (Hua Ma); supervision, H.M. (Hua Ma); writing—original draft, R.G.; writing—review & editing, H.M. (Hua Ma). All authors have read and agreed to the published version of the manuscript.

Funding

This research was funded by Chinese National Funding of Social Sciences, grant number 14BGL208 and National Natural Science Foundation of China, grant number 71871131.

Conflicts of Interest

The authors declare that they have no conflict of interest.

References

  1. Laumbach, R.J.; Kipen, H.M. Respiratory health effects of air pollution: Update on biomass smoke and traffic pollution. J. Allergy Clin. Immunol. 2012, 129, 3–11. [Google Scholar] [CrossRef] [Green Version]
  2. Sava, F.; Carlsten, C. Respiratory health effects of ambient air pollution. Clin. Chest Med. 2012, 33, 759–769. [Google Scholar] [CrossRef]
  3. Beelen, R.; Stafogguiia, M.; Raaschou-Nielsen, O.; Andersen, Z.J.; Xun, W.; Katsouyanni, K.; Dimakopoulou, K.; Brunekreef, B.; Weinmayr, G.; Hoffmann, B.; et al. Long-term exposure to air pollution and cardiovascular mortality: An analysis of 22 European cohorts. Epidemiology 2014, 25, 368–378. [Google Scholar] [CrossRef]
  4. Du, Y.; Xu, X.; Chu, M.; Guo, Y.; Wang, J. Air particulate matter and cardiovascular disease: The epidemiological, biomedical and clinical evidence. J. Thorac. Dis. 2016, 8, E8–E19. [Google Scholar] [CrossRef]
  5. Calderón-Garcidueñas, L.; Mora-Tiscareño, A.; Ontiveros, E.; Gomez-Garza, G.; Barragan-Mejia, G.; Broadway, J.; Chapman, S.; Valencia-Salazar, G.; Jewells, V.; Maronpot, R.R.; et al. Air pollution, cognitive deficits and brain abnormalities: A pilot study with children and dogs. Brain Cogn. 2008, 68, 117–127. [Google Scholar] [CrossRef]
  6. Schikowski, T.; Vossoughi, M.; Vierkötter, A.; Schulte, T.; Teichert, T.; Sugiri, D.; Fehsel, K.; Tzivian, L.; Bae, I.; Ranft, U.; et al. Association of air pollution with cognitive functions and its modification by APOE gene variants in elderly women. Environ. Res. 2015, 142, 10–16. [Google Scholar] [CrossRef]
  7. Shehab, M.A.; Pope, F.D. Effects of short-term exposure to particulate matter air pollution on cognitive performance. Sci. Rep. 2019, 9, 8237. [Google Scholar] [CrossRef]
  8. Currie, J.; Vogl, T. Early-life health and adult circumstance in developing countries. Annu. Rev. Econ. 2013, 5, 1–36. [Google Scholar] [CrossRef] [Green Version]
  9. Lelieveld, J.; Evans, J.S.; Fnais, M.; Giannadaki, D.; Pozzer, A. The contribution of outdoor air pollution sources to premature mortality on a global scale. Nature 2015, 525, 367–371. [Google Scholar] [CrossRef]
  10. Di, Q.; Wang, Y.; Zanobetti, A.; Wang, Y.; Koutrakis, P.; Choirat, C.; Dominici, F.; Schwartz, J.D. Air Pollution and Mortality in the Medicare Population. N. Engl. J. Med. 2017, 376, 2513–2522. [Google Scholar] [CrossRef]
  11. Zeidner, M.; Shechter, M. Psychological responses to air pollution: Some personality and demographic correlates. J. Environ. Psychol. 1988, 8, 191–208. [Google Scholar] [CrossRef]
  12. Szyszkowicz, M.; Rowe, B.H.; Colman, I. Air pollution and daily emergency department visits for depression. Int. J. Occup. Med. Environ. Health 2009, 22, 355–362. [Google Scholar] [CrossRef]
  13. Szyszkowicz, M.; Kousha, T.; Kingsbury, M.; Colman, I. Air Pollution and Emergency Department Visits for Depression: A Multicity Case-Crossover Study. Environ. Health Insights 2016, 10, 155–161. [Google Scholar] [CrossRef] [Green Version]
  14. Marques, S.; Lima, M.L. Living in grey areas: Industrial activity and psychological health. J. Environ. Psychol. 2010, 31, 314–322. [Google Scholar] [CrossRef]
  15. Lim, Y.; Kim, H.; Kim, J.H.; Bae, S.; Park, H.Y.; Hong, Y. Air pollution and symptoms of depression in elderly adults. Environ. Health Perspect. 2012, 120, 1023–1028. [Google Scholar] [CrossRef] [Green Version]
  16. Vert, C.; Sánchez-Benavides, G.; Martínez, D.; Gotsens, X.; Gramunt, N.; Cirach, M.; Molinuevo, J.L.; Sunyer, J.; Nieuwenhuijsen, M.J.; Crous-Bou, M.; et al. Effect of long-term exposure to air pollution on anxiety and depression in adults: A cross-sectional study. Int. J. Hyg. Environ. Health 2017, 220, 1074–1080. [Google Scholar] [CrossRef]
  17. Brereton, F.; Clinch, J.P.; Ferreira, S. Happiness, geography and the environment. Ecol. Econ. 2008, 65, 386–396. [Google Scholar] [CrossRef]
  18. Cuñado, J.; de Gracia, F.P. Environment and Happiness: New Evidence for Spain. Soc. Indic. Res. 2013, 112, 549–567. [Google Scholar] [CrossRef]
  19. Zhang, X.; Zhang, X.; Chen, X. Happiness in the Air: How Does a Dirty Sky Affect Mental Health and Subjective Well-being? J. Environ. Econ. Manag. 2017, 85, 81–94. [Google Scholar] [CrossRef]
  20. Zheng, S.; Wang, J.; Sun, C.; Zhang, X.; Kahn, M.E. Air pollution lowers Chinese urbanites’ expressed happiness on social media. Nat. Hum. Behav. 2019, 3, 237–243. [Google Scholar] [CrossRef]
  21. Ferreira, S.; Akay, A.; Brereton, F.; Cuñado, J.; Martinsson, P.; Moro, M.; Ningal, T.F. Life satisfaction and air quality in Europe. Ecol. Econ. 2013, 88, 1–10. [Google Scholar] [CrossRef]
  22. Li, Z.; Folmer, H.; Xue, J. To what extent does air pollution affect happiness? The case of the Jinchuan mining area, China. Ecol. Econ. 2014, 99, 88–99. [Google Scholar] [CrossRef]
  23. Zhang, J.; Sun, Y.; Chen, D. Public understanding of smog pollution: A survey on the residents’ perception of air pollution in Haidian District. Stud. Sci. Sci. 2017, 4, 491–499. [Google Scholar] [CrossRef]
  24. Yu, H.; Yu, M.; Gordon, S.P.; Zhang, R. The association between ambient fine particulate air pollution and physical activity: A cohort study of university students living in Beijing. Int. J. Behav. Nutr. Phys. Act. 2017, 14, 136. [Google Scholar] [CrossRef]
  25. Ward, A.L.S.; Beatty, T.K.M. Who Responds to Air Quality Alerts? Environ. Resour. Econ. 2016, 65, 487–511. [Google Scholar] [CrossRef]
  26. Heyes, A.; Neidell, M.; Saberian, S. The Effect of Air Pollution on Investor Behavior: Evidence from the S&P 500. NBER 2016. [Google Scholar] [CrossRef] [Green Version]
  27. Ng, C.F.S.; Stickley, A.; Konishi, S.; Watanabe, C. Ambient air pollution and suicide in Tokyo, 2001–2011. J. Affect. Disord. 2016, 201, 194–202. [Google Scholar] [CrossRef]
  28. Casas, L.; Cox, B.; Bauwelinck, M.; Nemery, B.; Deboosere, P.; Nawrot, T.S. Does air pollution trigger suicide? A case-crossover analysis of suicide deaths over the life span. Eur. J. Epidemiol. 2017, 32, 973–981. [Google Scholar] [CrossRef]
  29. Lu, J.G.; Lee, J.J.; Gino, F.; Galinsky, A.D. Polluted Morality: Air Pollution Predicts Criminal Activity and Unethical Behavior. Psychol. Sci. 2018, 29, 340–355. [Google Scholar] [CrossRef] [Green Version]
  30. Zheng, S.; Zhang, X.; Song, Z.; Sun, C. Influence of air pollution on urban residents’ outdoor activity: Empirical study based on dining-out data from the Dianping website. J. Tsinghua Univ. Sci. Technol. 2016, 56, 89–96. [Google Scholar] [CrossRef]
  31. Chandra, N.; Lal, S.; Venkataramani, S.; Patra, P.K.; Sheel, V. Temporal variations of atmospheric CO2 and CO at Ahmedabad in western India. Atmos. Chem. Phys. 2016, 16, 6153–6173. [Google Scholar] [CrossRef] [Green Version]
  32. Miskell, G.; Pattinson, W.; Weissert, L.; Williams, D. Forecasting short-term peak concentrations from a network of air quality instruments measuring PM2.5 using boosted gradient machine models. J. Environ. Manag. 2019, 242, 56–64. [Google Scholar] [CrossRef] [PubMed]
  33. Yang, J.; Ou, C.; Song, Y.; Li, L.; Chen, P.; Liu, Q. Estimating years of life lost from cardiovascular mortality related to air pollution in Guangzhou, China. Sci. Total Environ. 2016, 573, 1566–1572. [Google Scholar] [CrossRef] [PubMed]
  34. Huang, L.; Rao, C.; Tj, V.D.K.; Bi, J.; Liu, Y. A comparison of individual exposure, perception, and acceptable levels of PM2.5 with air pollution policy objectives in China. Environ. Res. 2017, 157, 78–86. [Google Scholar] [CrossRef] [PubMed]
  35. Simone, D.; Eyles, J.; Newbold, K.B.; Kitchen, P.; Williams, A. Air quality in Hamilton: Who is concerned? perceptions from three neighborhoods. Soc. Indic. Res. 2012, 108, 239–255. [Google Scholar] [CrossRef]
  36. Johnson, T.; Mol, A.P.J.; Zhang, L.; Yang, S. Living under the dome: Individual strategies against air pollution in Beijing. Habitat Int. 2017, 59, 110–117. [Google Scholar] [CrossRef]
  37. Tian, X.; Guo, Q.; Han, C.; Ahmad, N. Different extent of environmental information disclosure across Chinese cities: Contributing factors and correlation with local pollution. Glob. Environ. Chang. 2016, 39, 244–257. [Google Scholar] [CrossRef]
  38. Borbet, T.C.; Gladson, L.A.; Cromar, K.R. Assessing air quality index awareness and use in Mexico City. BMC Public Health 2018, 18, 538. [Google Scholar] [CrossRef] [Green Version]
  39. Majewski, G.; Rogula-Kozłowska, W.; Czechowski, P.O.; Badyda, A.; Brandyk, A. The impact of selected parameters on visibility: First results from a long-term campaign in Warsaw, Poland. Atmosphere 2015, 6, 1154–1174. [Google Scholar] [CrossRef] [Green Version]
  40. Widziewicz, K.; Rogula-Kozłowska, W.; Loska, K.; Kociszewska, K.; Majewski, G. Health Risk Impacts of Exposure to Airborne Metals and Benzo a Pyrene during Episodes of High PM10 Concentrations in Poland. Biomed. Environ. Sci. 2018, 31, 23–36. [Google Scholar] [CrossRef]
  41. Bekki, K.; Ito, T.; Yoshida, Y.; He, C.; Arashidani, K.; He, M.; Sun, G.; Zeng, Y.; Sone, H.; Kunugita, N.; et al. PM2.5 collected in China causes inflammatory and oxidative stress responses in macrophages through the multiple pathways. Environ. Toxicol. Pharmacol. 2016, 45, 362–369. [Google Scholar] [CrossRef] [PubMed]
  42. Omidi, Y.; Goudarzi, G.; Heidari, A.M.; Daryanoosh, S.M. Health impact assessment of short-term exposure to NO2 in Kermanshah, Iran using AirQ model. Environ. Health Eng. Manag. 2016, 3, 91–97. [Google Scholar] [CrossRef] [Green Version]
  43. Jaeger, M.J.; Tribble, D.; Wittig, H.J. Effect of 0.5 ppm sulfur dioxide on the respiratory function of normal and asthmatic subjects. Lung 1979, 156, 119–127. [Google Scholar] [CrossRef] [PubMed]
  44. Lippmann, M. Health effects of tropospheric ozone. Environ. Sci. Technol. 1991, 25, 1954–1962. [Google Scholar] [CrossRef]
  45. Hunter, D.D.; Wu, Z.; Dey, R.D. Sensory neural responses to ozone exposure during early postnatal development in rat airways. Am. J. Respir. Cell Mol. Biol. 2010, 43, 750–757. [Google Scholar] [CrossRef] [Green Version]
  46. Schmitt, M. Subjective well-being and air quality in Germany. Schmollers Jahrb. 2013, 133, 275–286. [Google Scholar] [CrossRef]
  47. Sun, C.; Kahn, M.E.; Zheng, S. Self-protection investment exacerbates air pollution exposure inequality in urban China. Ecol. Econ. 2017, 131, 468–474. [Google Scholar] [CrossRef] [Green Version]
Figure 1. Distribution map of the study areas.
Sustainability 12 02746 g001
Figure 2. Annual distribution of AQI levels of five air pollutants in Xicheng District in 2016.
Sustainability 12 02746 g002
Figure 3. Annual distribution of AQI levels of five air pollutants in Huairou District in 2016.
Sustainability 12 02746 g003
Table 1. Socio-economic characteristics of Xicheng District and Huairou District.
IndicatorXicheng DistrictHuairou District
Resident population1,259,000393,000
Population density (People/km2)24,832185
Proportion of tertiary industry91.2%45.8%
Annual per capita disposable income (CNY)71,86336,013
Annual per capita consumption expenditure (CNY)45,32923,633
The proportion of college graduates and above41%15%
Table 2. Air quality index and corresponding pollutant concentration limits.
AQI ValuesPollution LevelConcentration Limits of Pollutants
24-h Average8-h Average
PM2.5
(μg/m3)
PM10
(μg/m3)
NO2
(μg/m3)
SO2
(μg/m3)
O3
(μg/m3)
50Excellent35504050100
100Good7515080150160
150Light level pollution115250180475215
200Middle level pollution150350280800265
300Heavy level pollution2504205651600800
400Severe level pollution3505007502100/
5005006009402620/
Table 3. Description of variables.
VariablesDescriptionUrbanSuburban
MeanS.D.MeanS.D.
REVIEWSDaily total number of sample restaurants’ reviews102325527
RATINGDaily average scores of sample restaurants4.40.14.40.5
EXPDTDaily per capita consumption of sample restaurants (CNY)11378816
PM2.5Daily concentration of PM2.5 (μg/m3)77.668.562.358.5
PM10Daily concentration of PM10 (μg/m3)113.880.295.071.6
NO2Daily concentration of NO2 (μg/m3)53.727.228.020.1
SO2Daily concentration of SO2 (μg/m3)11.411.96.66.5
O38-hour concentration of O3 (μg/m3)90.365.584.963.9
Table 4. Influencing factors of dining-out frequency of urban residents.
VariablesDependent Variable: lnREVIEWS(U)
(1)(2)(3)(4)(5)
lnPM2.5(U)−0.0593 ***
(0.0227)
----
lnPM10(U)-−0.0631 ***
(0.0208)
---
lnNO2(U)--−0.0582 **
(0.0306)
--
lnO3(U)---−0.0135
(0.0145)
-
SO2(U)----−0.0015
(0.0011)
HOLIDAY0.2934 ***
(0.0182)
0.2940 ***
(0.0182)
0.2904 ***
(0.0183)
0.2925 ***
(0.0183)
0.2931 ***
(0.0184)
Weather variablesYesYesYesYesYes
Time trendYesYesYesYesYes
Monthly fixed effectYesYesYesYesYes
Constant5.0404 ***
(0.1430)
5.0826 ***
(0.1419)
5.0628 ***
(0.1707)
4.6417 ***
(0.0840)
4.7749 ***
(0.0797)
Sample size366366366366366
F98.007 ***98.753 ***97.360 ***95.884 ***96.186 ***
Adjusted R20.7050.7070.7040.7030.701
Note: “Yes” means the variable is added to the model; Weather variables include average temperature, relative humidity, precipitation, wind speed, and visibility; Standard errors in parentheses; *** p < 0.01, ** p < 0.05, * p < 0.10.
Table 5. Influencing factors of dining-out frequency of suburban residents.
VariablesDependent Variable: lnREVIEWS(S)
(1)(2)(3)(4)(5)
lnPM2.5(S)−0.0095
(0.0337)
----
lnPM10(S)-−0.0008
(0.0335)
---
lnNO2(S)--−0.0332
(0.0391)
--
lnO3(S) ---−0.0323
(0.0249)
-
SO2(S)----−0.0040
(0.0033)
HOLIDAY0.5140 ***
(0.0330)
0.5135 ***
(0.0331)
0.5143 ***
(0.0330)
0.5168 ***
(0.0330)
0.5149 ***
(0.0329)
Weather variablesYesYesYesYesYes
Time trendYesYesYesYesYes
Monthly fixed effectYesYesYesYesYes
Constant2.9068 ***
(0.2071)
2.8508 ***
(0.2211)
2.6992 ***
(0.2092)
2.7108 ***
(0.0991)
2.9552 ***
(0.1283)
Sample size366366366366366
F95.928 ***95.898 ***96.172 ***96.538 ***96.463 ***
Adjusted R20.7010.7010.7010.7020.702
Note: “Yes” means the variable is added to the model; Weather variables include average temperature, relative humidity, precipitation, wind speed, and visibility; Standard errors in parentheses; *** p < 0.01, ** p < 0.05, * p < 0.10.
Table 6. Influencing factors of dining-out satisfaction of urban residents.
VariablesDependent Variable: lnRATING(U)
(1)(2)(3)(4)(5)
lnPM2.5(U)−0.0028
(0.0033)
----
lnPM10(U)-−0.0023
(0.0030)
---
lnNO2(U)--−0.0050
(0.0044)
--
lnO3(U)---−0.0026
(0.0020)
-
SO2(U)----−0.0001
(0.0002)
lnEXPDT(U)−0.0210 *
(0.0214)
−0.0212 *
(0.0214)
−0.0221 *
(0.0212)
−0.0226
(0.0212)
−0.0227 *
(0.0212)
HOLIDAY−0.0022
(0.0026)
−0.0020
(0.0026)
−0.0024
(0.0026)
−0.0022
(0.0026)
−0.0022
(0.0026)
Weather variablesYesYesYesYesYes
Time trendYesYesYesYesYes
Monthly fixed effectYesYesYesYesYes
Constant1.5952
(0.1000)
1.5947
(0.1000)
1.6095
(0.1011)
1.5984
(0.0999)
1.5906
(0.0999)
Sample size366366366366366
F1.287 **1.273 **1.349 **1.384 **1.228 **
Adjusted R20.0080.0070.0090.0100.006
Note: “Yes” means the variable is added to the model; Weather variables include average temperature, relative humidity, precipitation, wind speed, and visibility; Standard errors in parentheses; *** p < 0.01, ** p < 0.05, * p < 0.10.
Table 7. Influencing factors of dining-out satisfaction of suburban residents.
VariablesDependent Variable: lnRATING(S)
(1)(2)(3)(4)(5)
lnPM2.5(S)0.0047
(0.0060)
----
lnPM10(S)-0.0054
(0.0060)
---
lnNO2(S)--−0.0022
(0.0070)
--
lnO3(S)---−0.0086 **
(0.0045)
-
SO2(S)----−0.0004
(0.0006)
lnEXPDT(S)−0.0261
(0.0330)
−0.0265
(0.0330)
−0.0263
(0.0330)
−0.0240
(0.0329)
−0.0259
(0.0330)
HOLIDAY−0.0236 ***
(0.0059)
−0.0237 ***
(0.0060)
−0.0234 ***
(0.0059)
−0.0242 ***
(0.0059)
−0.0232 ***
(0.0059)
Weather variablesYesYesYesYesYes
Time trendYesYesYesYesYes
Monthly fixed effectYesYesYesYesYes
Constant1.5856 ***
(0.1501)
1.5810 ***
(0.1502)
1.6220 ***
(0.1488)
1.6403 ***
(0.1459)
1.6182 ***
(0.1462)
Sample size366366366366366
F2.564 ***2.585 ***2.510 ***2.900 ***2.533 ***
Adjusted R20.0410.0420.0400.0490.040
Note: “Yes” means the variable is added to the model; Weather variables include average temperature, relative humidity, precipitation, wind speed, and visibility; Standard errors in parentheses; *** p < 0.01, ** p < 0.05, * p < 0.10.
Table 8. Effects of different air pollutants on dining-out behavior and satisfaction.
PM2.5PM10NO2O3SO2
Urban areasFrequency(-) ***(-) ***(-) **//
Satisfaction/////
Suburban areasFrequency/////
Satisfaction///(-) **/
Note: “(-)” indicates a significantly negative impact, and “/” indicates the impact is insignificant; *** p < 0.01, ** p < 0.05, * p < 0.10.

