Article

Aerated Irrigation of Different Irrigation Levels and Subsurface Dripper Depths Affects Fruit Yield, Quality and Water Use Efficiency of Greenhouse Tomato

1
Key Laboratory of Agricultural Soil and Water Engineering in Arid and Semiarid Areas, Ministry of Education, Northwest A&F University, Yangling, Xianyang 712100, Shaanxi, China
2
College of Water Resources and Architectural Engineering, Northwest A&F University, Yangling, Xianyang 712100, Shaanxi, China
3
Institute of Water-Saving Agriculture in Arid Areas of China (IWSA), Northwest A&F University, Yangling, Xianyang 712100, Shaanxi, China
*
Author to whom correspondence should be addressed.
Sustainability 2020, 12(7), 2703; https://doi.org/10.3390/su12072703
Submission received: 5 March 2020 / Revised: 27 March 2020 / Accepted: 27 March 2020 / Published: 30 March 2020
(This article belongs to the Special Issue Sustainable Irrigation System)

Abstract

:
Aerated irrigation (AI) is a method to mitigate rhizosphere hypoxia caused by the wetting front from subsurface drip irrigation (SDI). This study evaluated the impacts of AI on soil aeration, plant growth performance, fruit yield (tomato), irrigation water use efficiency (IWUE), fruit nutrition (lycopene and Vitamin C (VC)) and taste (soluble sugar, organic acid and sugar–acid ratio) quality. A three-factorial experiment including AI and SDI at three irrigation levels (W0.6, W0.8 and W1.0, corresponding with crop-pan coefficients of 0.6, 0.8 and 1.0) and two dripper depths (D15 and D25, burial at 15 and 25 cm, respectively), totaling 12 treatments overall, was conducted in a greenhouse during the tomato-growing season (April–July) in 2016. The AI improved soil aeration conditions, with significantly increased soil oxygen concentration and air-filled porosity relative to SDI. Moreover, the AI improved crop growth performance, with increased root morphology (diameter, length density, surface area and volume density), delayed flowering time, prolonged flowering duration and increased shoot (leaf, stem and fruit) dry weight, and harvest index. Fruit yield per plant, fruit weight, IWUE, the contents of lycopene, VC and soluble sugar, and sugar–acid ratio significantly increased under AI treatments (P < 0.05). As the irrigation level increased, fruit yield, number, and weight increased (P < 0.05), but IWUE and fruit lycopene, soluble sugar, and organic acid content decreased (P < 0.05). The dripper depth had no significant impact on fruit yield, nutrition and taste quality. Principal component analysis revealed that the optimal three treatments in terms of fruit yield, IWUE, and nutrition and taste quality were the treatments W0.6D25AI, W1.0D25AI and W1.0D15AI. These results suggest that AI can improve tomato growth performance and increase fruit yield, nutrition and taste quality, and IWUE through enhancing soil aeration conditions.

1. Introduction

Compared with traditional irrigation methods, such as furrow irrigation and flood irrigation, subsurface drip irrigation (SDI) is increasingly applied in arid and semiarid regions because it can improve water use efficiency (WUE), thereby saving irrigation water and alleviating environmental pollution caused by excessive irrigation [1,2,3,4]. However, soil oxygen deficiency caused by continuous saturated wetting fronts near the drippers [5,6] during and even after an irrigation event is likely to be a major limitation on the development of SDI. Frequent and intensive irrigation often occurs in SDI; however, the drippers are positioned below the cultivation depth, and the soil near the drippers are thus often affected by soil compaction [6], further aggravating soil oxygen deficiency. However, crop roots prefer to grow near drippers [7], which may further bear the damage of oxygen deficiency. Bhattarai et al. [8] and Payero et al. [9] reported that yields decreased as the irrigation rate increased for cotton and corn, respectively, once the irrigation rate passed a certain threshold. They attributed these non-corresponding phenomena to oxygen deficiency conditions as a result of the SDI wetting front. If oxygen deficiency conditions from SDI occur over a prolonged period, the soil–crop root microenvironment firstly becomes altered through decreased soil respiration, soil microorganisms (including bacteria, fungi, and actinomycetes) abundance, and soil enzyme (including urease, phosphatase, catalase) activity [10,11]; then root nutrient uptake becomes damaged and root diseases may even occur [12,13,14,15,16]. Subsequently, stomata closure occurs, and the transpiration and photosynthesis rates reduce correspondingly, causing crop metabolic disorder and impairing the growth of the crop’s aboveground parts [17,18]. Finally, hypoxic conditions from SDI could lead to the income from the yield being insufficient to offset the investment in SDI infrastructure, leading to the slow adoption of SDI technology around the world [5].
Aerated irrigation (AI), which uses the Venturi air-injector installed on the SDI pipeline, enables the input of aerated water, including air bubbles, dissolved air, and water, into soil through the drippers [5]. Thus, AI not only makes full use of the high WUE attributable to SDI, but also alleviates damage from the oxygen deficiency conditions induced by SDI [5,6,19]. Previous studies have shown that AI provides yield benefits to a range of crops, including soybean [19,20], cotton [19,21,22], tomato [6,23], pumpkin [24], chickpea [24], wheat [22], and corn [25,26].
In recent years, research on AI has no longer focused on its influence on crops’ apparent and physiological characteristics, such as plant height, stem diameter, leaf area, dry biomass, days to flowering, fruit set percentage, sap flow, stomata conductance, leaf water potential, chlorophyll content, transpiration rate, and photosynthetic rate [6,19,20,22,24,26,27]. The initial differences between AI and SDI were that one only inputted water, while the other allowed water and air (both gas and dissolved phases) simultaneously into soil. Thus, the first change brought by adoption of AI rather than SDI was the change of the water–air ratio of the soil (aeration conditions), leading to changes in the microenvironment of the soil–root zone. Thus, the impacts of AI on the soil–crop root zone microenvironment, such as soil oxygen, water, greenhouse gas emission, the abundance of microorganisms, enzyme activity, and root and microbial respiration [6,10,11,23,26], have become the emphasis of research. Moreover, research on the conditions of AI have also no longer focused on only water–air coupling at different irrigation levels [6], dripper depths [11,24,28], aeration frequencies [11], soil types [20,22], and aeration methods [22,26,29,30]. Sustainable and precise irrigation based on water, air, fertilizer, and agrochemicals coupling developed from AI and SDI is thus becoming the future direction of research [31].
However, the original intention of AI was to increase crop yield and WUE. Furthermore, fruit (nutrition and taste) quality, in addition to yield, is becoming an important factor influencing human nutrition and health, and the commercial value of fruit, especially for tomato, one of the most popular vegetables [32,33,34,35]. Thus, increasing crop yield output and WUE should still be the main focus for research on AI. In this research, AI and SDI were applied at different irrigation levels and dripper depths in a greenhouse to seek the optimal treatments through a comprehensive evaluation based on a combination of the fruit yield, irrigation water use efficiency (IWUE), and fruit nutrition and taste quality parameters of greenhouse tomato. The impacts of AI on soil aeration conditions, root morphology and crop growth performance were also studied in order to provide a relevant theoretical basis for improving fruit yield, IWUE and fruit quality of greenhouse tomato.

2. Materials and Methods

2.1. Study Area

The experiment was conducted from April 11 to July 3, 2016 in a greenhouse at the Key Laboratory of Agricultural Soil and Water Engineering in Arid and Semiarid Areas of the Ministry of Education, Northwest A&F University, Yangling, Shaanxi, China (34°20′N, 108°24′E). The soil in the greenhouse used for the experiment was “Lou” soil (loess with a clay loam), with the following properties: sand, silt and clay contents of 26.0%, 33.0%, and 41.0% respectively; field capacity of 32.1% by volume; dry bulk density of 1.35 g cm−3; and pH of 7.82. This region has a semiarid climate with an annual sunshine duration of 2163.8 h and a frost-free period of 210 d. The groundwater depth is at least 150 m below the surface.

2.2. Experimental Design and Treatments

Tomato cultivar ‘Jinpeng No. 10′ seedlings were transplanted from humus pots on April 4, 2016, to moist soil in order to ensure seedling survival [10]. Seven days were allowed for seedling recovery before the experiment began on April 11. The length and width of the rows were 4 and 0.8 m, respectively, and the irrigation drippers were buried in the middle of the row. The spacing of the drippers or plants were both 35 cm, the distance between a plant and the nearest dripper was 5 cm, and there was a total of 11 plants in one row (one experiment plot). The soil surface was mulched with low-density white polyethylene in order to minimize surface evaporation. Pressurized irrigation water was supplied by a bucket, which was connected to a water pump. For the AI treatment, a Mazzei 287 Venturi air-injector (Mazzei Injector Company, LLC, Bakersfield, CA, USA) following Bernoulli’s principle was installed at the head of each irrigation line. The pressure differential within the Venturi injector (inlet, 0.1 MPa; outlet, 0.02 MPa) was calibrated with pressure gauges on both sides and controlled by a pressure-regulated bypass tubule, and a volumetric air concentration of 17% was established in the aerated water [36,37].
Three irrigation levels were applied: W0.6, W0.8 and W1.0, representing crop-pan coefficients (kcp) of 0.6, 0.8, and 1.0, respectively. Two burial depths of drippers were used: D15 and D25, representing burial depths of 15 and 25 cm, respectively. Non-aerated SDI (henceforth CK) was used as a control for AI. The experiment was performed with a three-factor (3×2×2) and completely randomized design. The experiments finally consisted of 12 treatments and were replicated three times.
Irrigation was applied every 3–4 d between 08:00 and 12:00, based on the total evaporation (measured daily) following the last irrigation event as determined by an E601 evaporation pan. The irrigation amount was calculated according to Zhao et al. and Doorenbos and Pruitt [38,39]:
W = A   ×   E p a n   ×   k c p
where W is the irrigation amount (L), A is the plot area controlled by one irrigation dripper (0.14 m2 = 0.35 m × 0.4 m), Epan is the total evaporation following the last irrigation event (mm), and kcp is the crop-pan coefficient.
The tomato-growing season had a duration of 83 d and the seedling, flowering, fruiting, and mature stages were April 11–19, April 20–25, April 26 to June 5, and June 6 to July 3, respectively. Within the tomato-growing season, the total irrigation amount for treatments W0.6, W0.8, and W1.0 were 19.73, 26.31, and 32.89 L, respectively, and 23 irrigation events occurred. Agronomic management practices, such as uniformly applied basal fertilizer before transplanting, pruning, spraying, and pollinating, were applied according to local production practices.

2.3. Measurement of Soil Oxygen Concentration, Air-Filled Porosity, Crop Growth Performance Parameters, Tomato Yield, and Fruit Nutrition and Taste Quality Index

The soil oxygen concentration was monitored by a Fiber-Optic Oxygen Meter connected with two oxygen miniprobes, and the values were recorded with Firesting Logger software (Firesting O2; PyroScience GmbH, Aachen, Germany) [40]. The probes were installed at the center of the rows 10 cm below the soil surface and 5 cm away from the plants. The oxygen concentration was recorded after the probes had been left for 2–3 min and after the gaps in the soil around the probes had been sealed with moist soil to minimize the gas exchange between the soil and atmosphere [10]. The soil oxygen concentration was measured between 12:00 and 14:00, because the value measured during this time could represent the daily mean value [6]. The soil oxygen concentration was measured about every 15 d and 2 d after the nearest irrigation event.
The soil moisture was measured at depths between 0 cm and 40 cm (at increments of 10 cm) with the gravimetric method at two sampling points in one plot. The soil moisture was measured on the same day as the soil oxygen concentration. Air-filled porosity was calculated at each sampling time:
P a = ( ρ s ρ b ) ρ s θ
where Pa is air-filled porosity (%), ρs is the particle density (2.65 g cm−3), ρb is the bulk density (g cm−3); θ is the volumetric water content (%).
The flowering time and duration for three ear flowers of each tomato plant were recorded. The dry matter of the aboveground parts (separated into stem, leaf, and fruit) and roots was derived from two plants at harvest (on 90 days after transplanting; DAT) for each experimental plot. Components were dried in the oven to a constant mass before weighting. Before the roots were dried, root diameter, surface area, length density, and volume density were analyzed with an Epson Perfection V700 scanner and a WinRHIZO Pro image processing system (Regent Instruments Inc., 2672 Chemin Sainte-Foy, Quebec City, Quebec, Canada) [28]. The fruit nutrition quality index including lycopene content and Vitamin C (VC) content, and the taste quality index including soluble sugar content, organic acid content, and sugar–acid ratio, were measured from four mature fruits at harvest for each experimental plot. Lycopene was extracted with 2% dichloromethane and petroleum as solvents to enhance the solubility of lycopene, and the absorption at 502 nm was subsequently measured [41]. The VC content was determined by molybdenum blue colorimetry and soluble sugar by anthrone colorimetry [42,43]. Organic acid was titrated with 0.1 mol L−1 NaOH and calculated as equivalents of citric acid [42,44]. The sugar–acid ratio was calculated by dividing the soluble sugar content by the organic acid content. Yield data, including the fruit yield per plant, the fruit weight, and the number of fruit per plant, were recorded for the fruit harvested from five plants from the middle of each plot. The IWUE (g L−1) was calculated as follows:
I W U E = Y / W
where Y is fruit yield per plant (g), and W is the irrigation amount (L).

2.4. Data Analysis

All statistical analyses were performed with SPSS 22.0 software (SPSS Inc., Chicago, IL, USA), SigmaPlot 10.0. All parameters were analyzed by one-way analysis of variance (ANOVA) including the factors of irrigation levels, dripper depths, and AI or CK, and the interactions of these factors. The least significant difference was determined when ANOVA indicated significant differences (P < 0.05). All statistical analyses were conducted to the P < 0.05 level, unless stated otherwise. A principal component analysis based on fruit yield and quality parameters was used to produce a new set of unrelated comprehensive indexes to improve the reliability of the evaluation and to obtain a comprehensive score and rank among the various treatments. Rotary factor method was used in the principal component analysis.

3. Results

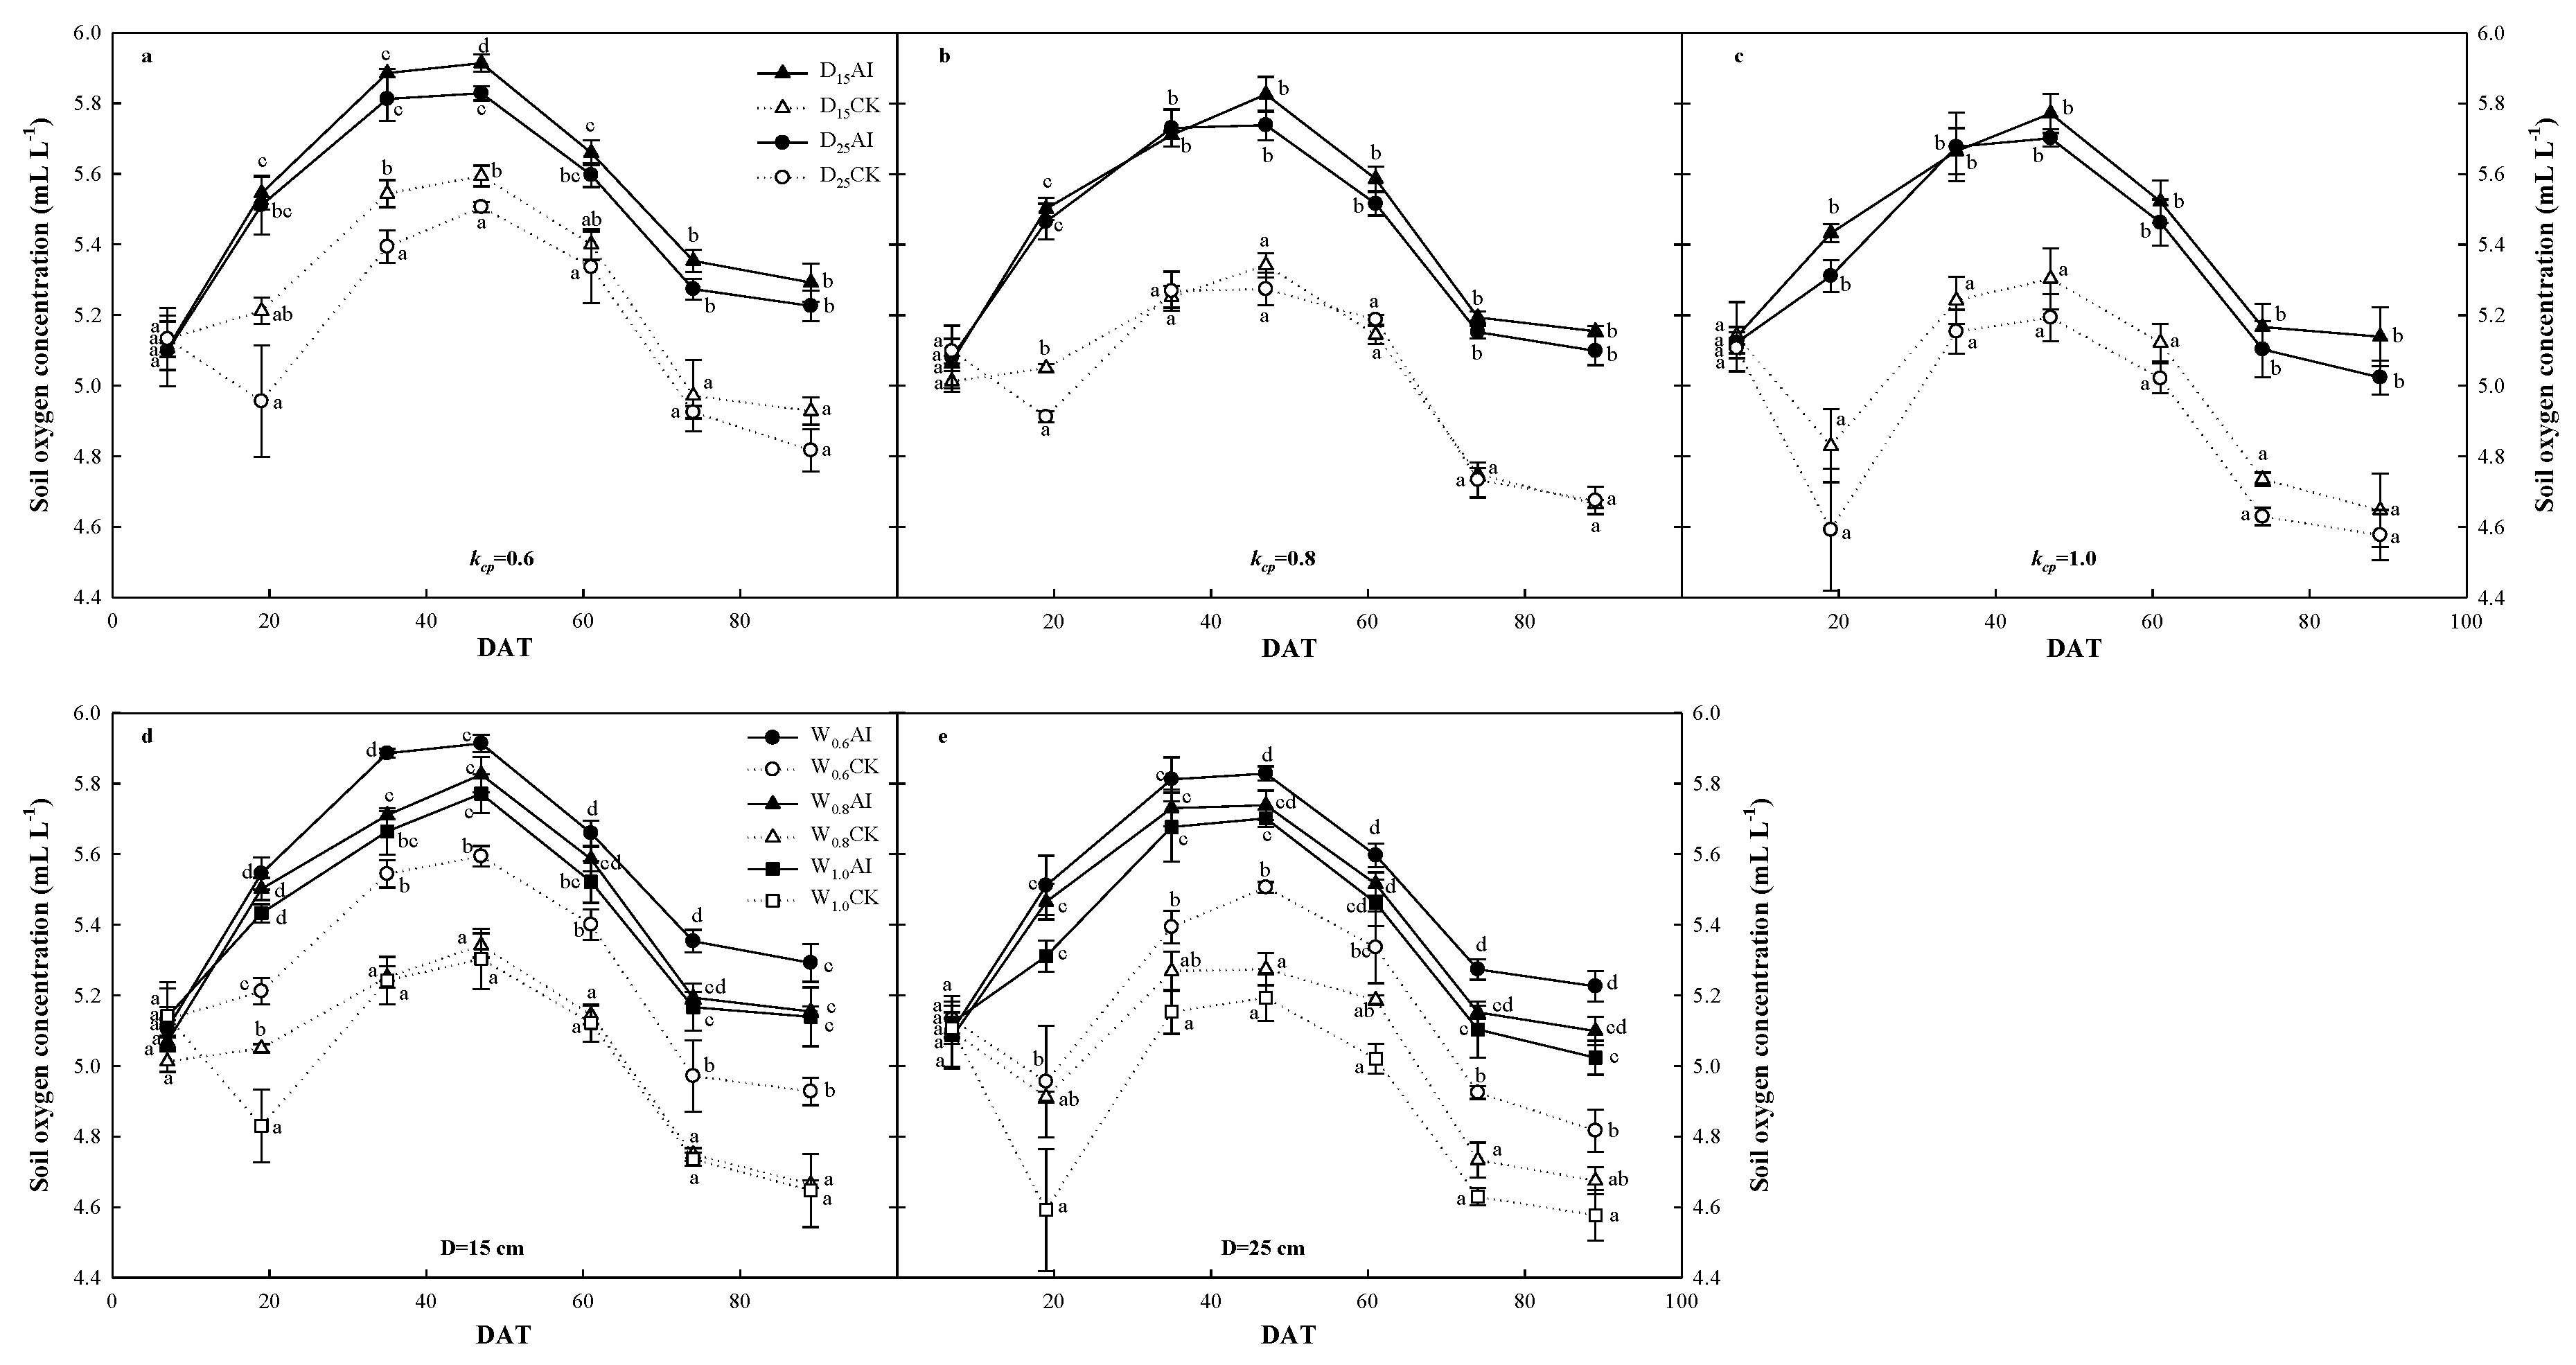
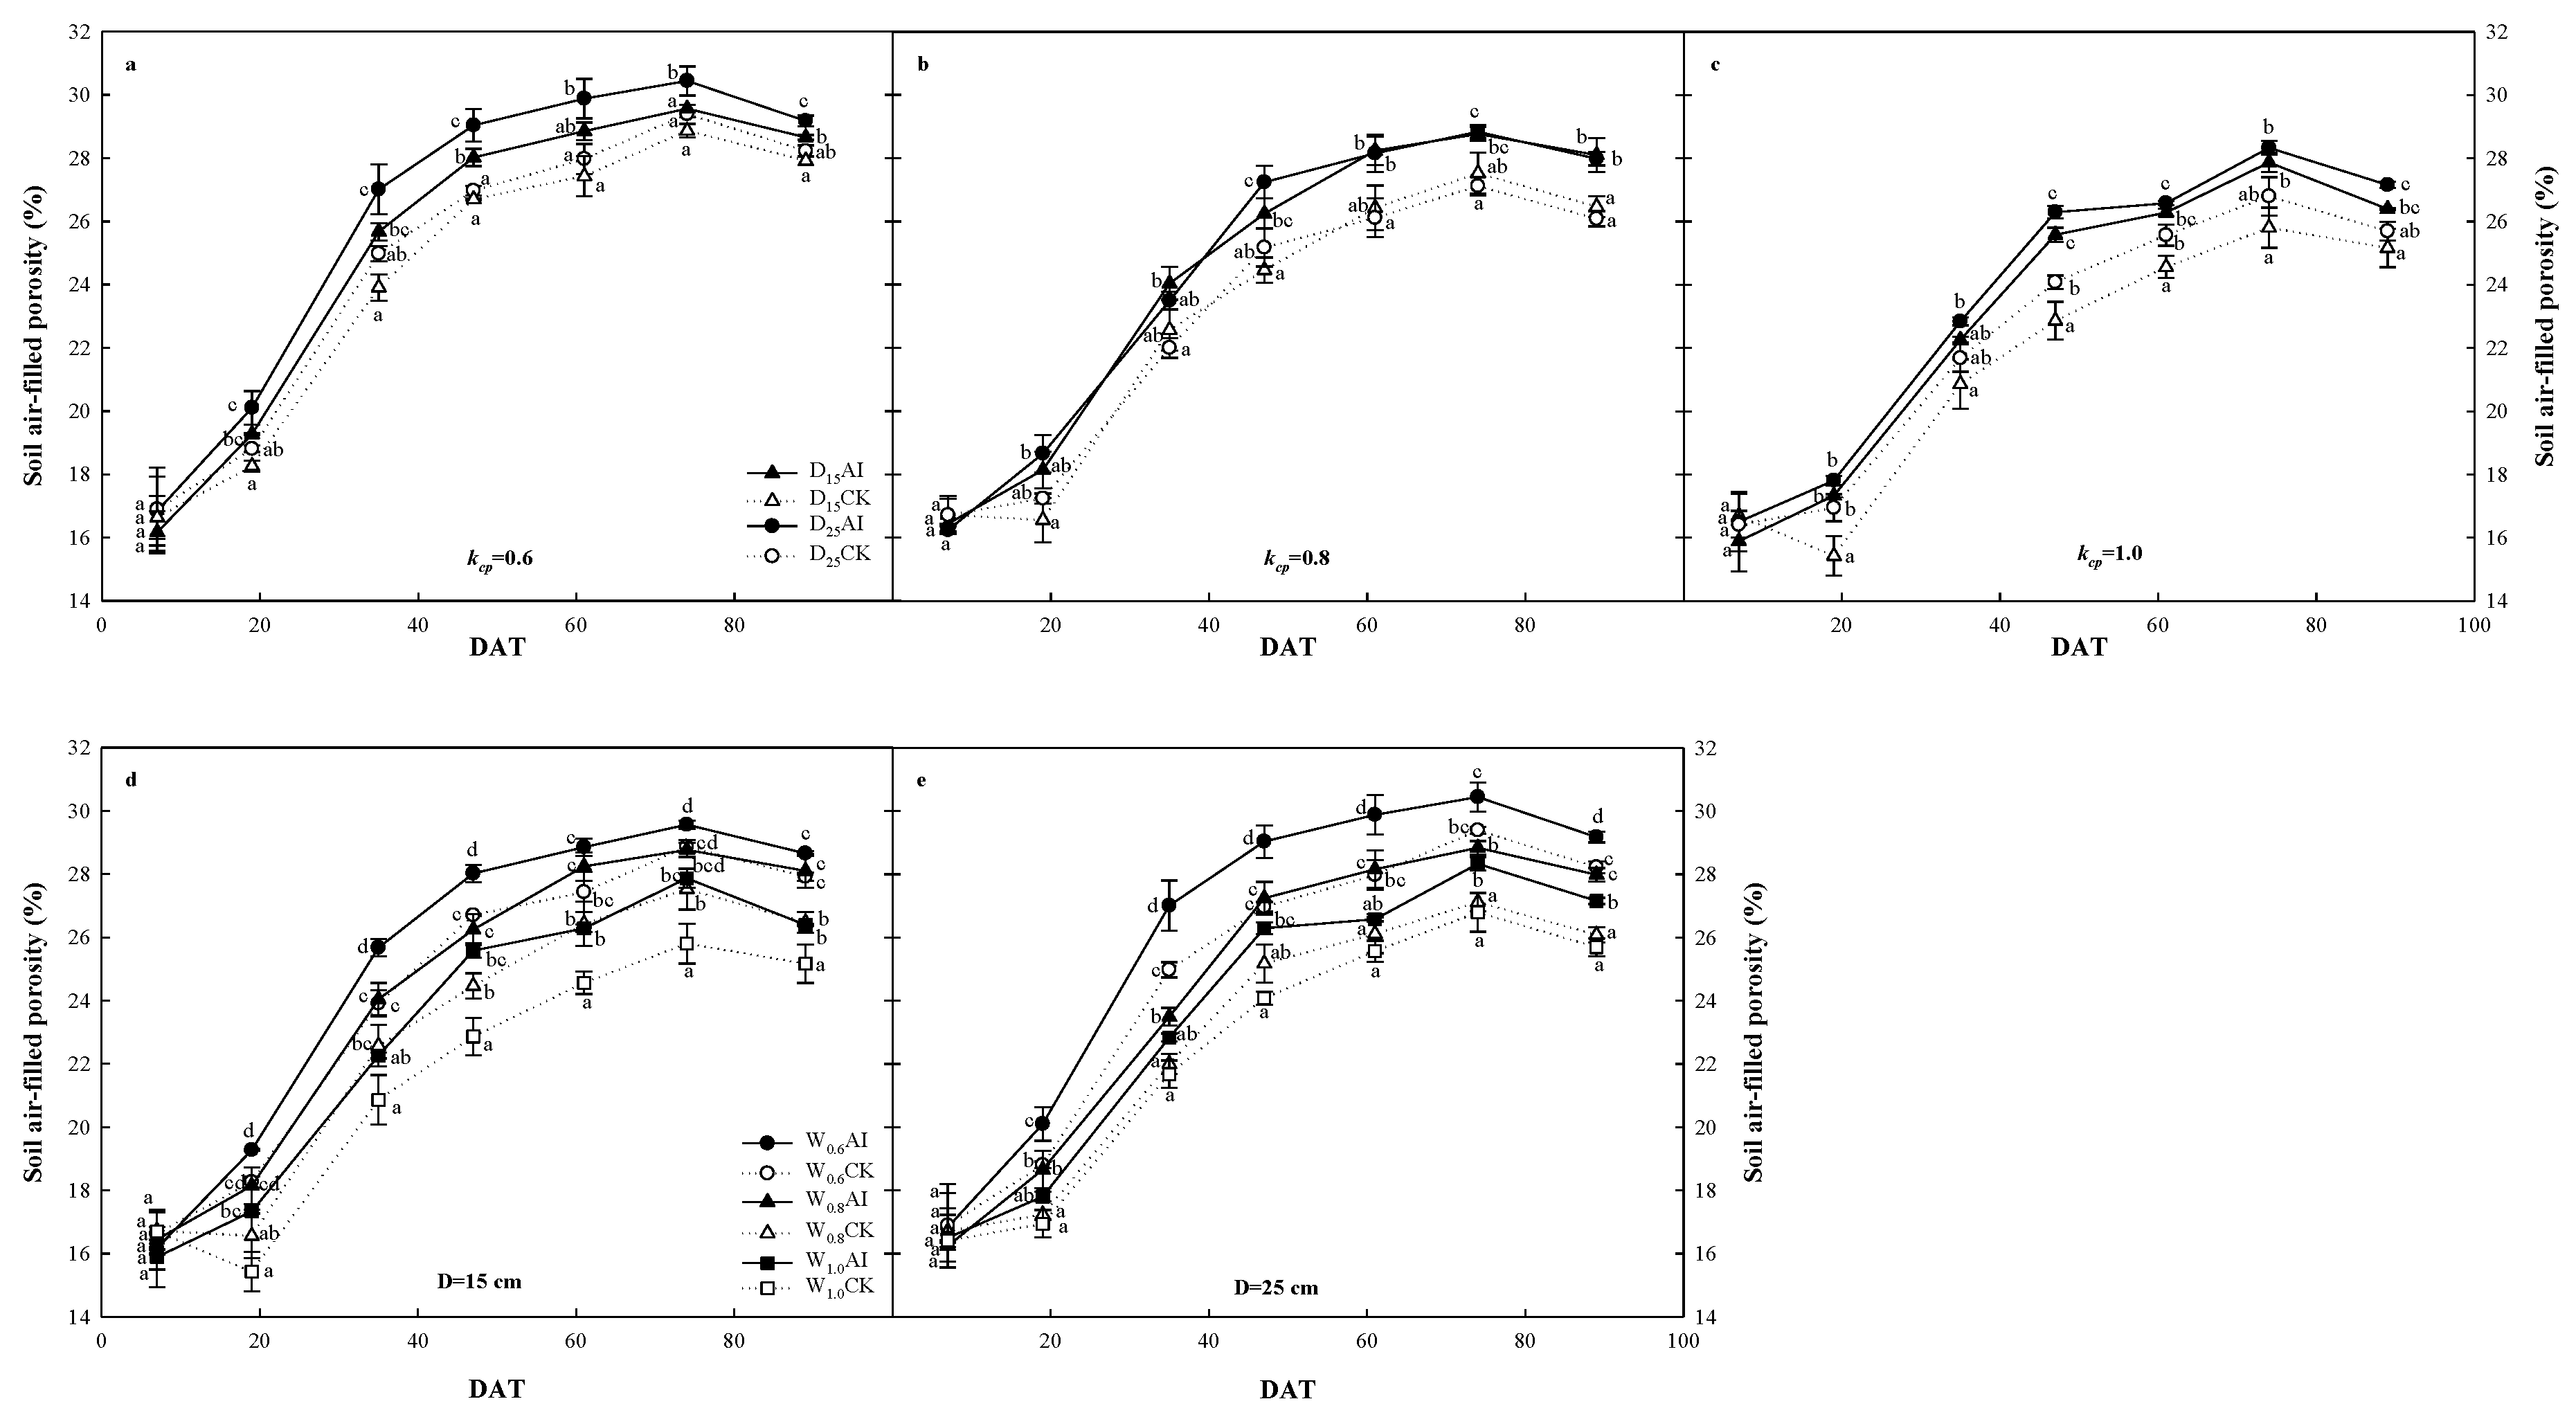
3.1. Variations of Soil Oxygen Concentration and Air-Filled Porosity

The variations of the soil oxygen concentration for all 12 treatments generally showed the trend of firstly increasing and then decreasing (Figure 1). The soil oxygen concentration in the D15 and D25 treatments had no significant differences under any irrigation level for both the AI and CK treatments (Figure 1a–c). Soil oxygen concentration decreased as irrigation level increased in both the AI and CK treatments under D15 or D25 (Figure 1d,e). However, only some measurement points between the W0.6AI and W1.0AI treatments had significant differences, and the W0.8AI treatment had no significant differences with the W0.6AI or W1.0AI treatments. The W0.6CK treatment had significant differences with W1.0CK or W0.8CK treatments under the D15 condition but had significant differences only with the W1.0CK treatment under the D25 condition. The average values in the W0.6CK, W0.8CK, and W1.0CK treatments were 5.25, 5.03, and 5.00 mL L−1 under D15, respectively, but were 5.15, 5.02, and 4.90 mL L−1 under D25, respectively. Thus, soil oxygen concentration in the W0.6D15CK treatment was significantly higher than in the W0.8D15CK and W1.0D15CK treatments by 4.26% and 4.79%, respectively, and the W0.6D25CK treatment was significantly higher than the W1.0D25CK treatment by 4.97%.
The soil oxygen concentrations in the AI treatments under the same irrigation levels and dripper depths were significantly higher than the CK treatments (Figure 1). The average values of the soil oxygen concentration in the W0.6AI, W0.8AI, and W1.0AI treatments were 5.54, 5.43, and 5.41 mL L−1 under D15, respectively, and were 5.48, 5.40, and 5.34 mL L−1 under the D25 condition, respectively. Thus, the soil oxygen concentrations of the AI treatments under the W0.6, W0.8, and W1.0 levels were significantly higher than the CK treatments by 5.09%, 7.43%, and 7.44% under D15, respectively, and were significantly higher than the CK treatments under D25 by 5.95%, 6.97%, and 8.37%, respectively.
The soil air-filled porosity generally increased initially and then stabilized during the tomato-growing season (Figure 2). A comparison of either the D15AI and D25AI treatments or the D15CK and D25CK treatments revealed that the soil air-filled porosity generally had no significant differences at any irrigation level (Figure 2a–c). Similar to the oxygen concentration, the soil air-filled porosity at the same dripper depth also decreased as the irrigation level increased in both the AI and CK treatments (Figure 2d,e). The W1.0AI treatment showed a significant difference with the W0.6AI treatment but had no significant differences with the W0.8AI treatment under D15 and D25. The W0.6AI treatment had a significant difference with the W0.8AI treatment under D25, but only some measurement points had a significant difference under D15. The average values of the W0.6AI, W0.8AI, and W1.0AI treatments were 25.17%, 24.28%, and 23.09%, respectively, under D15, and 26.07%, 24.37%, and 23.64%, respectively, under D25. Thus, the soil air-filled porosity in the W0.6AI treatment was significantly higher than the W1.0AI treatment, by 8.29% and 9.30% under D15 and D25, respectively. The soil air-filled porosity in the W0.6D25AI treatment was significantly higher than the W0.8D25AI treatment, by 6.50%. The W0.6CK, W0.8CK, and W1.0CK treatments generally had a significant difference from each other under the D15 or D25 conditions, except for the W0.8D25CK and W1.0D25CK treatments, which showed no significant difference. The average soil air-filled porosity of the W0.6CK, W0.8CK, and W1.0CK treatments were 24.25%, 22.96%, and 21.62%, respectively, under D15, and were 24.75%, 22.92%, and 22.45%, respectively, under D25. Thus, the soil air-filled porosity in the W0.6CK treatment was significantly higher than the W0.8CK treatment by 5.29% and 7.38%, respectively, and significantly higher than the W1.0CK treatment under D15 and D25 by 10.81% and 9.28%, respectively. Furthermore, values in the W0.8D15CK treatment were significantly higher than the W1.0D15CK treatment, by 5.83%.
In general, at the same irrigation level and dripper depth, the air-filled porosity in the AI treatments were significantly higher than the CK treatments (Figure 2). Thus, the values in the W0.6AI, W0.8AI and W1.0AI treatment were significantly higher than the corresponding CK treatments under D15, by 3.68%, 5.44%, and 6.33%, respectively, and significantly higher than the corresponding CK treatments under D25, by 5.07%, 5.96%, and 5.04%, respectively.

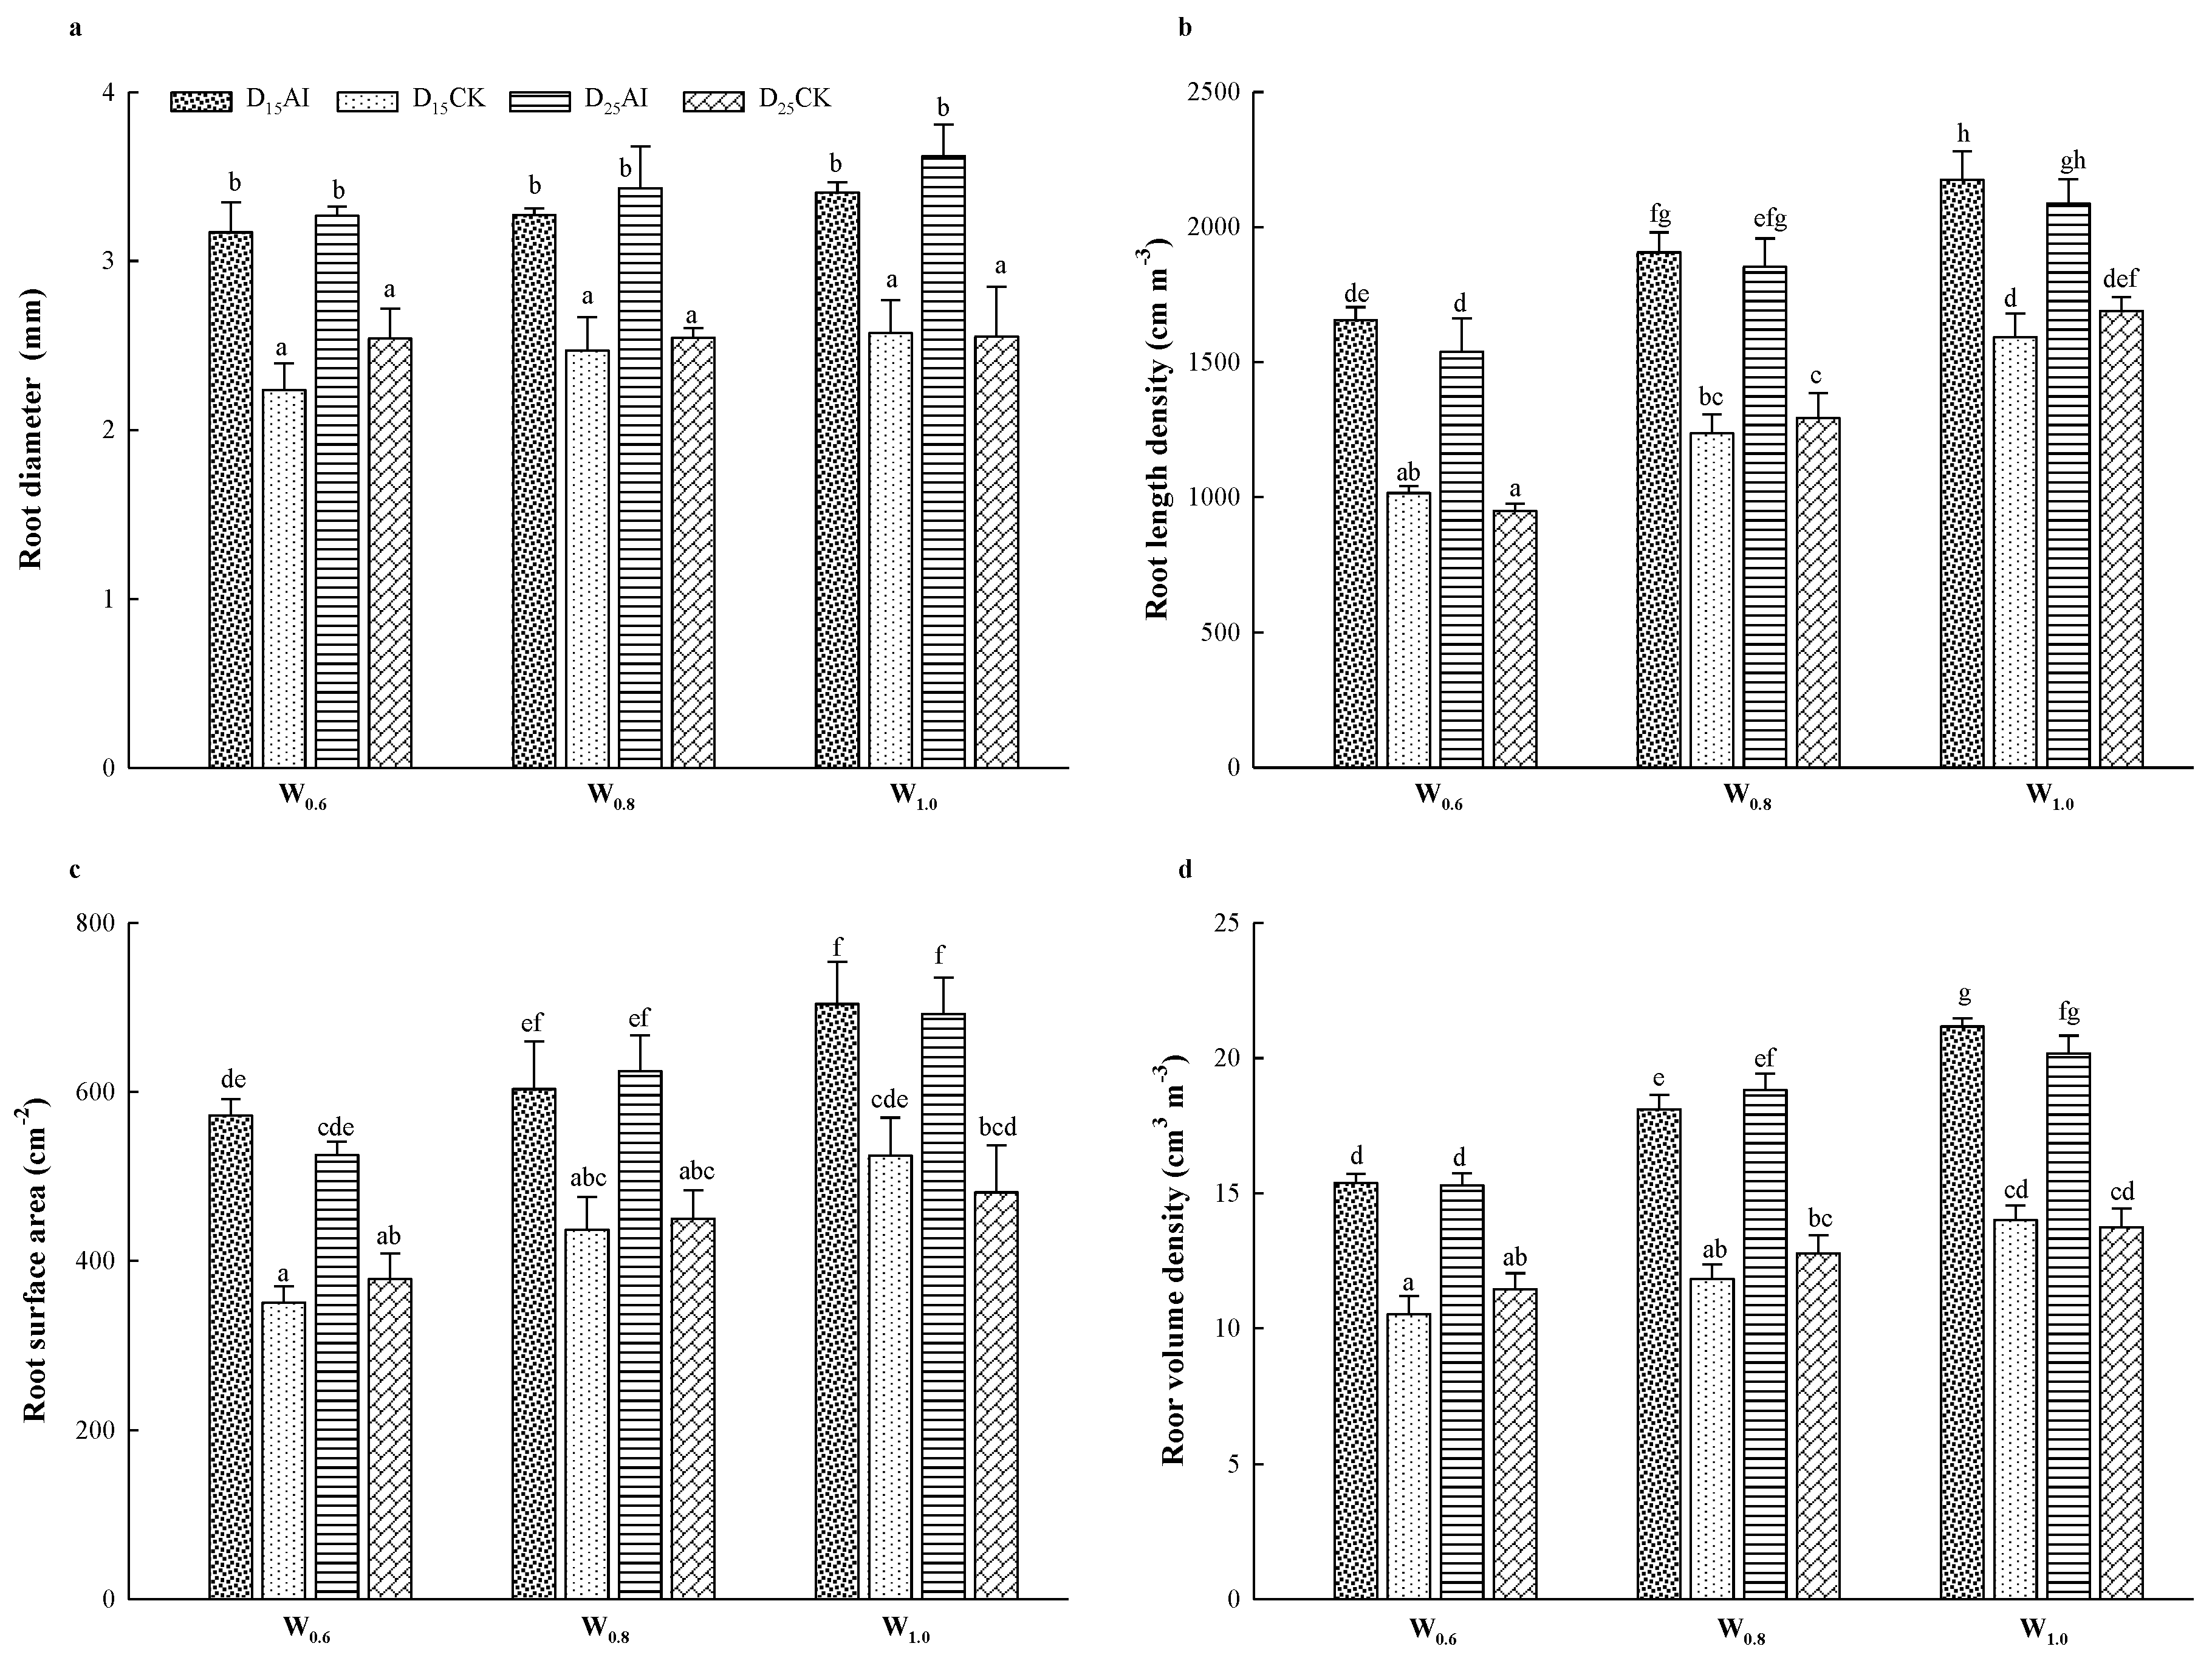
3.2. Impacts of AI on Flowering Time and Duration, Dry Matter, Root Parameters, Fruit Yield, Nutrition and Taste Quality

Except for the flowering duration of the second ear, the flowering time and duration for all three ears in the AI treatments were significantly different from the CK treatments (Table 1). The flowering times of the first ear in the W0.8D25AI and W1.0D15AI treatments were significantly delayed by 3.00 and 2.34 d, respectively, compared with the W0.8D25CK and W1.0D15CK treatments. The flowering time of the third ear in all AI treatments were significantly different compared to the CK treatments at the same irrigation level and dripper depth, with the exception of the flowering time between the W1.0D25AI and W1.0D25CK treatments. The flowering duration of the third ear in the W0.6D15AI treatment significantly increased by 2.00 d compared with the W0.6D15CK treatment. The mean values of the six AI and CK treatments showed that the AI treatments significantly delayed the flowering time of the first, second, and third ear by 2.00, 1.56, and 1.89 d, respectively, and the AI treatments significantly prolonged the flowering duration of the first and third ear by 0.89 and 1.00 d, respectively. The flowering time of the first ear was also significantly different as the irrigation level increased, and the values in the W0.8D25AI (or W1.0D25AI), W1.0D15AI, and W1.0D25CK treatments were significantly delayed by 3.00, 2.67, and 3.33 d, respectively, compared with the W0.6D25AI, W0.6D15AI, and W0.6D25CK treatments. The mean values for the W0.6, W0.8, and W1.0 treatments showed that the W0.8 and W1.0 treatments significantly delayed the flowering time of the first ear by 2.00 and 2.50 d relative to the W0.6 treatments. The flowering time of third ear in the W0.6D25AI treatment was significantly delayed by 2.00 d compared with the W0.6D15AI treatment, and the mean values of the D15 and D25 treatments showed that the flowering time of the third ear in the D25 treatments were significantly delayed, being 1.00 d later than the D15 treatments. The irrigation level and dripper depth had no significant impact on the flowering duration.
The F-values revealed that AI and dripper depth had no significant effects on the root dry weight (Table 2); however, the mean values in the W0.6, W0.8, and W1.0 treatments showed that the root dry weight in the W1.0 treatments significantly increased by 24.03%, compared with the W0.6 treatments. The fruit dry weight in the W0.6D25AI treatment significantly increased by 29.15% compared to the W0.6D25CK treatment. Moreover, the AI treatments had significant or highly significant (P < 0.01) impacts on the leaf, stem, and fruit dry weight and harvest index, with mean values of the AI treatments being significantly higher than the CK treatments, by 12.09%, 15.79%, 23.94%, and 6.49%, respectively. The irrigation level had significant or highly significant (P < 0.01) effects on leaf and stem dry weight; the mean values of the four W0.6, W0.8, and W1.0 treatments showed that the leaf dry weight in the W1.0 treatments significantly increased by 17.24% compared with the W0.6 treatments, and the stem dry weight in the W0.8 and W1.0 treatments significantly increased by 16.18 and 22.78%, respectively, compared with the W0.6 treatments. However, variations of irrigation level had no significant effects on the fruit dry weight and harvest index. Variations of dripper depth had no significant impacts on either the dry matter partitioning or harvest index.
The root diameter showed no significant difference within the AI or CK treatments, but all the AI treatments were significantly higher than all the CK treatments (Figure 3a). Thus, AI had a significant effect on the root diameter, but the irrigation level and dripper depth did not exhibit a significant effect (Table 3). The AI treatments significantly increased the mean root diameter by 26.04% compared with the CK treatments. The root length density, surface area, and volume density in all AI treatments was significantly higher than the CK treatments at the same irrigation levels and dripper depth (Figure 3b–d). Moreover, the F-values revealed that AI treatment had highly significant impacts on the root length density, root surface, and volume density, with the mean values being significantly higher than the CK treatments by 30.65%, 29.58%, and 31.76%, respectively (Table 3). As the irrigation level increased, a comparison of the three treatments (i.e., the W0.6D15AI, W0.8D15AI, and W1.0Da5AI treatments) revealed significantly higher root length density, surface area, and volume density under the W1.0 treatments than under the W0.6 treatments (Figure 3b–d). Moreover, the F-values showed that the irrigation level had highly significant impacts on the root length density, surface area, and volume density (Table 3). Compared with the W0.6 treatments, the mean values in W1.0 treatments significantly increased by 31.60%, 23.97%, and 23.82%, respectively. Variations of dripper depth had no significant impacts on root diameter, length density, surface area, and volume density.
The variations of dripper depth had no significant effects on the yield parameters and IWUE (Table 4). However, the AI and irrigation level, not only separately, but also interactively, had highly significant (P < 0.01) effects on yield per plant. The yield per plant in every AI treatment was significantly higher than the corresponding CK treatment at the same irrigation level and dripper depth, with the AI treatments significantly increasing the mean yield per plant by 29.22%. The yield per plant among the W0.6AI, W0.8AI, and W1.0AI treatments or between the W0.6CK and W1.0CK treatments in both D15 and D25 were significantly different from one another. The yield per plant under the W0.8 and W1.0 treatments was significantly higher than under the W0.6 treatments, by 13.19% and 25.28%, respectively, and that under the W1.0 treatments was significantly higher than that under W0.8 treatments, by 13.92%. Thus, the highest and lowest yield per plant was obtained from the W1.0D15AI and W0.6D15CK treatment, which had no significant difference with the W1.0D25AI and W0.6D25CK treatment, respectively. The F-values also showed that the AI and irrigation level separately had highly significant (P < 0.01) effect on the fruit weight and IWUE. The fruit weight and IWUE in every AI treatment were both significantly higher than the corresponding CK treatment, with the AI treatments increasing the mean values by 25.32% and 28.59%, respectively, compared with the CK treatments. The fruit weight under the W1.0 treatments was significantly higher than in the corresponding W0.6 treatments, with an increase of 12.53%. The highest fruit weight was obtained from the W1.0D15AI treatment, which had no significant difference from the W1.0D25AI treatment, and the lowest fruit weight was obtained from the W0.8D25CK treatment, which had no significant difference with the W0.8D15CK, W0.6D15CK, and W0.6D25CK treatments. The IWUE under the W0.8 or W1.0 treatments was significantly lower than under the corresponding W0.6 treatments, with the mean values decreased by 15.75% and 24.52% under W0.8 and W1.0 treatments, respectively, compared with the W0.6 treatments. Thus, the highest IWUE was obtained from the W0.6D25AI treatment, which had no significant difference from the W0.6D15AI treatment. The lowest IWUE was obtained from the W1.0D15CK treatment, which had no significant difference from the W1.0D25CK, W0.8D25CK, and W0.8D15CK treatments.
The AI had no significant effects on the number of fruit per plant (Table 4). However, the variation of irrigation level had significant impacts on the number of fruit per plant. The number of fruit per plant in the W1.0D15CK or W0.8D15CK treatments was also significantly higher than in the W0.6D15CK treatment, and the mean number of fruit per plant under the W1.0 treatment significantly increased by 11.35% relative to the W0.6 treatment. The highest number of fruit per plant was obtained from the W1.0D15AI treatment, which only had a significant difference with the W0.6D15CK treatment (the lowest value).
Both the AI and irrigation level had significant or highly significant (P < 0.01) effects on the contents of lycopene and soluble sugar (Table 5). Lycopene in all AI treatments were significantly higher than in the corresponding CK treatments, with the AI treatments significantly increasing the mean values by 38.98%. The lycopene contents in the W1.0D15AI and W1.0D25AI treatments were significantly lower than those under W0.6D15AI and W0.6D25AI treatments, respectively. Moreover, the mean contents of lycopene under W1.0 conditions were significantly decreased by 22.33%, compared with those under the W0.6 conditions. The soluble sugar content both in the W0.6AI and W1.0AI treatments was significantly different from the W0.6CK and W1.0CK treatments, respectively, and the AI treatments significantly increased the mean soluble sugar content by 26.83%, compared with the CK treatments. The soluble sugar content in W0.6D25CK treatment was significantly different from that in W1.0D25CK treatment and the mean soluble sugar content in the W1.0 treatments was 20.26% lower than in W0.6 treatments. The variation of dripper depth had no significant impacts on the lycopene and soluble sugar content. Thus, the highest and lowest contents of lycopene and soluble sugar were both obtained from the W0.6D25AI and W1.0D15CK treatments and had no significant difference with the W0.6D15AI and W1.0D25CK treatments, respectively. The AI also had highly significant (P < 0.01) effects on the VC content and sugar–acid ratio. The VC content in all AI treatments and the sugar–acid ratio in the W0.6AI and W1.0AI treatments had a significant difference from the corresponding CK treatments, with the mean VC content and sugar–acid ratio in the AI treatments being 36.35% and 31.69% higher than in the CK treatments, respectively. Variations of both irrigation level and dripper depth had no significant impacts on the VC content. The highest and lowest VC contents were obtained from W0.6D25AI and W0.8D15CK treatments, respectively. The variation of dripper depth had significant impacts on the sugar–acid ratio, with the sugar–acid ratio in the W0.6D15AI and W0.6D25AI treatments showing a significant difference from each other, and the mean values in the D25 treatments increasing by 15.52% compared with the D15 treatments. The highest and lowest sugar–acid ratios were obtained from the W1.0D25AI and W1.0D15CK treatments, respectively. The organic acid in the AI treatments under W0.6 were significantly lower than in the corresponding CK treatments; however, under W0.8, they were significantly higher than in the CK treatments. Thus, the AI treatments had no significant effect on the organic acid content. The irrigation level had significant effects on organic acid, with the mean values in the W0.8 and W1.0 treatments significantly decreased by 12.19 and 16.10%, respectively, compared with the W0.6 treatments. The highest and lowest organic acid contents were obtained from the W0.6D15CK and W1.0D25AI treatments, respectively.
The yield per plant was positively correlated with the number of fruit per plant, fruit weight, VC content, and sugar–acid ratio (P < 0.01 or 0.05), and the correlation coefficient was greater than 0.5 (Table 6). The number of fruit per plant was negatively correlated with the organic acid. The fruit weight, IWUE, and lycopene, VC, and soluble sugar contents were positively correlated with each other (P < 0.01 or 0.05), with correlation coefficients greater than 0.6. The sugar–acid ratio was negatively correlated with the organic acid, with a coefficient of −0.678 (P < 0.01).
Three principal components were extracted through principal component analysis, and the cumulative variance contribution rate was 96.966% (Table 7). The variance contribution of the first principal component was 60.521%, which was mainly positively correlated with IWUE, VC, lycopene, and soluble sugar (Table 8). Moreover, these four parameters were positively correlated with each other (P < 0.01), and the coefficient of correlation was greater than 0.8 (Table 6), indicating that Z1 (Equation (4)) increased with IWUE, VC, lycopene, or soluble sugar increasing. The variance contribution of the second principal component was 25.701% (Table 7), which was mainly positively correlated with the yield and number of fruit per plant (Table 8). Similarly, yield per plant was also significantly positively correlated with the number of fruit per plant, with a coefficient of 0.644 (Table 6). Thus, Z2 (Equation (4)) increased as the yield per plant or number of fruit per plant increased. The variance contribution of the third principal component was 10.743% (Table 7), which was mainly negatively correlated with the organic acid (Table 8). Thus, Z3 (Equation (4)) decreased as organic acid increased.
Combining the variance contribution rates of the three principal components, the linear function of the comprehensive evaluation of every treatment based on the fruit yield and quality parameters were obtained as follows:
Z = 0.60521 Z 1 + 0.25701 Z 2 + 0.10743 Z 3
where Z is comprehensive score of every treatment (Table 9); and Z1, Z2, and Z3 are the score of the first, second, and third principal components, respectively, which were calculated from standardized fruit yield and quality parameters multiplied by the score coefficient.
The top six treatments identified by the comprehensive ranking were all AI treatments, which all had a positive comprehensive score (Table 9). The W0.6D25AI treatment was optimal, and had the highest Z1, that is the highest value of nutrition quality (VC and lycopene), taste quality (soluble sugar), and IWUE (Table 4 and Table 5). The second ranked was the W1.0D25AI treatment because of its high Z2 and Z3 (Table 9) comprising a higher value of fruit yield and number of fruit per plant and the lowest organic acid content (Table 4 and Table 5). The third ranked treatment was the W1.0D15AI treatment because it had the highest Z2 (Table 9), indicating the highest value of fruit yield and number per plant (Table 4). The bottom six treatments were all CK treatments, and had at least two negative values of Z1, Z2 and Z3, indicating lower values of nutrition quality, IWUE, fruit yield, number of fruit per plant, or soluble sugar content, or a higher organic acid content.

4. Discussion

In this research, the soil oxygen concentration and air-filled porosity in the AI treatments were significantly higher than those in the corresponding CK treatments (Figure 1 and Figure 2), indicating that the AI treatments effectively improved the soil aeration conditions. Previous research has reported that AI is effective at aerating the rhizosphere, as indicated by an increase in dissolved oxygen saturation [26], greater dissolved oxygen concentration over a 72 h period [6], and continuously higher diurnal soil oxygen concentration values [22] relative to unaerated control. On account of Bernoulli’s principle and preferential root growth around emitters, AI allows air (both dissolved and gas phases) and water simultaneously, not only water, to enter the rhizosphere soil. Thus, the dissolved soil oxygen concentration (Figure 1), but also the soil air-filled porosity (Figure 2) increased with the AI treatments in this research. Furthermore, AI not only effectively slows down the trend toward hypoxia and increases the minimum soil oxygen concentration during an irrigation event [10], but also ensures a higher soil oxygen concentration at other times as demonstrated in this research. Bhattarai et al. [24] have reported that larger areas of the rhizosphere are saturated under SDI than under AI. Ben-Noah and Friedman [29] have shown that air injecting treatment pushed the water around the drippers downwards and lowered the water content below the dripper. These results are consistent with the increasing soil air-filled porosity with the AI treatments in this research.
The seasonal variation tendency of soil oxygen concentration and air-filled porosity mainly arises through the interactions of irrigation, air temperature, and moist soil for seedling survival at the beginning of the experiment. The smaller initial values of the soil oxygen concentration and air-filled porosity and the initial increasing trend were primarily caused by the initial moist soil and then a relatively steady and smaller irrigation amount provided by the SDI. With irrigation water provided by SDI, the variation of soil air-filled porosity stabilizes at a later stage of tomato growth. The decreasing trend of soil oxygen concentration at the later stage may result from the increasing air temperature during the tomato-growth stage, as stable irrigation (or soil water) was no longer the dominant factor affecting soil oxygen. Friedman and Naftaliev [45] found that the soil oxygen concentration decreased with increasing air temperature. Ben-Noah and Friedman [29] have reported that increased oxygen diffusion rates were negligible compared with increased oxygen consumption rates by roots and microorganism respiration at high temperature.
In the current research, AI effectively promoted plant growth by delaying the flowering time, prolonging flowering duration (Table 1); increasing leaf, stem, and fruit dry weight (Table 2); and increasing root diameter, length density, surface area, and volume density (Table 3). Correspondingly, AI significantly increased the tomato yield, with a higher yield per plant and fruit weight, and then increased IWUE (Table 4). Du et al. [46] have reported that AI increased yield by 19.3% and WUE by 17.9% through a meta-analysis of 27 earlier studies. Other research has also shown the potential of AI for increasing crop yield and WUE through increasing crop production, which manifested through improved plant growth performance (e.g., plant height, stem diameter, leaf area, and dry matter partition), reproductive performance (e.g., days to flowering, fruit set and harvest, and number of nodes and ears), root morphology, and WUE parameters [6,20,22,26,27,28].
Previous research has reported the positive effects of AI on fruit size, shape, and total soluble solids [22,24]. In this research, AI significantly promoted tomato fruit nutrition and taste quality with higher contents of lycopene, VC, and soluble sugar and an improved sugar–acid ratio (Table 5). Li et al. [27] have reported that air injection with an air pump increased the lycopene and VC contents and sugar–acid ratio. Ozaki et al. [47] have suggested that hydrogen peroxide applied to soil increased the soluble sugar content of melon fruits through increasing photosynthetic activity and sugar metabolizing enzyme activities, which was because reactive oxygen species such as hydrogen peroxide could be the key factor involved in activating the Calvin cycle and sugar metabolism. Antioxidants, such as various carotenoids (including lycopene) and VC, which are provided by tomato fruits, play an important role in human nutrition and also have the potential to reduce the risk of various cancers and heart diseases [48]. Lycopene also has positive impacts on the red color of tomato [49], which affects the commercial value of tomato. Horchani et al. [50] have reported that root hypoxia limits carotenoid and ascorbate (VC) accumulation in fruits through reducing the induction of most genes in their biosynthesis pathways. Kläring and Zude [51] have also reported that when tomato plants were not able to adapt to hypoxia, several indicators for carotenoids and chlorophyll, respectively, significantly decreased.
AI can effectively improve the soil–crop root zone microenvironment through, firstly, improving soil aeration conditions by affecting the air–water ratio of soil, and then increasing the rhizosphere soil microbial abundance and soil enzyme activity [10,11], promoting soil microbial activity and, correspondingly, the soil respiration [10,24]. Subsequently, the crop root is affected, including root respiration [10,52], root morphology [28], and nutrition uptake and transport to the shoot [12,15]. Then, the AI effectively promotes crop transpiration and photosynthesis by influencing sap flow [6], stomata conductance [20], leaf water potential, and chlorophyll content [22]. Thus, AI promotes plant growth performance and significantly increases the fruit yield, WUE, and fruit nutrition and taste quality. Because of the positive impacts of AI on the fruit yield, IWUE, fruit nutrition and taste quality index, AI treatments had higher ranking according to the comprehensive score, compared with CK treatments (Table 9).
Fruit nutrition and taste qualities decreased as the irrigation level increased, although the VC content showed no significant differences with irrigation level variation (Table 5). Wang et al. [53] have reported that deficit irrigation significantly improved fruit nutrition and taste quality. Compared with full irrigation, water stress increased the activities of sucrose synthase and sucrose phosphate synthase [54] and improved soluble sugar content. A reduced leaf area index may be the reason for higher VC and lycopene in deficit irrigation; Dumas et al. [48] found that the accumulation of VC and lycopene benefitted from a higher fruit light exposure. The W0.6D25AI treatment was the highest ranking according to the comprehensive score (Table 9) and also benefitted from the highest IWUE, and the highest VC, lycopene, and soluble sugar contents compared with the other treatments (Table 4 and Table 5). The variation of dripper depth had no significant impacts on the fruit yield and taste and nutrition quality index, which may be because both 15 and 25 cm are within the concentrated distribution area of tomato root. Previous research on soybean and chickpea (a shallow-rooted and medium-rooted crop, respectively) has also shown that the values of soil respiration, root length density, photosynthesis, WUE, and transpiration rate all showed no significant differences between drippers buried at 15 or 25 cm [24].

5. Conclusions

The fruit yield and weight, IWUE, the contents of lycopene, VC, and soluble sugar, and the sugar–acid ratio in fruits with the AI treatments were significantly higher than the CK treatments by 29.22%, 25.32%, 28.59%, 38.98%, 36.35%, 26.83%, and 31.69%, respectively. These increase in AI treatments were accompanied by increased plant growth performance, which may benefit from increased soil oxygen concentration and air-filled porosity. The positive impact of AI on the fruit yield, taste and nutrition quality, and IWUE makes the aforementioned six AI treatments (i.e., all the AI treatments in this research) rank in the top six among the 12 treatments. In addition, this study provides guidance for future research or the practical applications of AI.

Author Contributions

Y.Z. and L.S.; methodology, software, investigation, data curation, X.W., Z.S. and Y.S.; formal analysis, data curation, Y.Z.; conceptualization, writing—original draft preparation, visualization, H.C.; validation, resources, writing—review and editing, supervision, project administration, funding acquisition. All authors have read and agreed to the published version of the manuscript.

Funding

This research was funded by the National Key Research and Development Program of China, grant number 2016YFC0400201.

Conflicts of Interest

The authors declare no conflict of interest.

References

  1. Thompson, T.L.; Doerge, T.A.; Godin, R.E. Subsurface drip irrigation and fertigation of broccoli: II. Agronomic, economic, and environmental outcomes. Soil Sci. Soc. Am. J. 2002, 66, 178–185. [Google Scholar] [CrossRef]
  2. Hanson, B.; May, D. Effect of subsurface drip irrigation on processing tomato yield, water table depth, soil salinity, and profitability. Agric. Water Manag. 2004, 68, 1–17. [Google Scholar] [CrossRef]
  3. Smith, R.; Raine, S.R.; Minkevich, J. Irrigation application efficiency and deep drainage potential under surface irrigated cotton. Agric. Water Manag. 2005, 71, 117–130. [Google Scholar] [CrossRef] [Green Version]
  4. McHugh, A.; Bhattarai, S.P.; Lotz, G.; Midmore, D.J. Effects of subsurface drip irrigation rates and furrow irrigation for cotton grown on a vertisol on off-site movement of sediments, nutrients and pesticides. Agron. Sustain. Dev. 2008, 28, 507–519. [Google Scholar] [CrossRef] [Green Version]
  5. Bhattarai, S.P.; Su, N.; Midmore, D.J. Oxygation unlocks yield potentials of crops in oxygen-limited soil environments. Adv. Agron. 2005, 88, 313–377. [Google Scholar]
  6. Bhattarai, S.P.; Pendergast, L.; Midmore, D.J. Root aeration improves yield and water use efficiency of tomato in heavy clay and saline soils. Sci. Hortic. 2006, 108, 278–288. [Google Scholar] [CrossRef]
  7. Machado, R.M.; Do Rosário, M.; Oliveira, G.; Portas, C.A. Tomato root distribution, yield and fruit quality under subsurface drip irrigation. Plant Soil. 2003, 255, 333–341. [Google Scholar] [CrossRef] [Green Version]
  8. Bhattarai, S.P.; McHugh, A.; Lotz, G.; Midmore, D.J. The response of cotton to subsurface drip and furrow irrigation in a vertisol. Exp. Agric. 2006, 42, 29. [Google Scholar] [CrossRef]
  9. Payero, J.O.; Tarkalson, D.D.; Irmak, S.; Davison, D.; Petersen, J.L. Effect of irrigation amounts applied with subsurface drip irrigation on corn evapotranspiration, yield, water use efficiency, and dry matter production in a semiarid climate. Agric. Water Manag. 2008, 95, 895–908. [Google Scholar] [CrossRef] [Green Version]
  10. Zhu, Y.; Cai, H.; Song, L.; Chen, H. Aerated irrigation promotes soil respiration and microorganism abundance around tomato rhizosphere. Soil Sci. Soc. Am. J. 2019, 83, 1343–1355. [Google Scholar] [CrossRef]
  11. Li, Y.; Niu, W.; Wang, J.; Liu, L.; Zhang, M.; Xu, J. Effects of artificial soil aeration volume and frequency on soil enzyme activity and microbial abundance when cultivating greenhouse tomato. Soil Sci. Soc. Am. J. 2016, 80, 1208–1221. [Google Scholar] [CrossRef]
  12. Drew, M.C. Effects of flooding and oxygen deficiency on plant mineral nutrition. Adv. Plant Nutr. 1988, 3, 115–159. [Google Scholar]
  13. Drew, M.C. Soil aeration and plant root metabolism. Soil Sci. 1992, 154, 259–268. [Google Scholar] [CrossRef]
  14. Drew, M.C. Oxygen deficiency and root metabolism: Injury and acclimation under hypoxia and anoxia. Annu. Rev. Plant Biol. 1997, 48, 223–250. [Google Scholar] [CrossRef] [PubMed]
  15. Gibbs, J.; Turner, D.; Armstrong, W.; Sivasithamparam, K.; Greenway, H. Response to oxygen deficiency in primary maize roots. II. Development of oxygen deficiency in the stele has limited short-term impact on radial hydraulic conductivity. Funct. Plant Biol. 1998, 25, 759–763. [Google Scholar] [CrossRef]
  16. Barrett-Lennard, E. The interaction between waterlogging and salinity in higher plants: Causes, consequences and implications. Plant Soil 2003, 253, 35–54. [Google Scholar] [CrossRef]
  17. Drew, M.C. Plant injury and adaptation to oxygen deficiency in the root environment: A review. Plant Soil 1983, 75, 179–199. [Google Scholar] [CrossRef]
  18. Else, M.A.; Coupland, D.; Dutton, L.; Jackson, M.B. Decreased root hydraulic conductivity reduces leaf water potential, initiates stomatal closure and slows leaf expansion in flooded plants of castor oil (Ricinus communis) despite diminished delivery of ABA from the roots to shoots in xylem sap. Physiol. Plant. 2001, 111, 46–54. [Google Scholar] [CrossRef]
  19. Bhattarai, S.P.; Huber, S.; Midmore, D.J. Aerated subsurface irrigation water gives growth and yield benefits to zucchini, vegetable soybean and cotton in heavy clay soils. Ann. Appl. Biol. 2004, 144, 285–298. [Google Scholar] [CrossRef]
  20. Bhattarai, S.P.; Midmore, D.J. Oxygation enhances growth, gas exchange and salt tolerance of vegetable soybean and cotton in a saline vertisol. J. Integr. Plant Biol. 2009, 51, 675–688. [Google Scholar] [CrossRef]
  21. Pendergast, L.; Bhattarai, S.P.; Midmore, D.J. Benefits of oxygation of subsurface drip-irrigation water for cotton in a Vertosol. Crop Pasture Sci. 2014, 64, 1171–1181. [Google Scholar] [CrossRef]
  22. Chen, X.; Dhungel, J.; Bhattarai, S.P.; Torabi, M.; Pendergast, L.; Midmore, D.J. Impact of oxygation on soil respiration, yield and water use efficiency of three crop species. J. Plant Ecol. 2011, 4, 236–248. [Google Scholar] [CrossRef]
  23. Chen, H.; Hou, H.; Hu, H.; Shang, Z.; Zhu, Y.; Cai, H.; Qaisar, S. Aeration of different irrigation levels affects net global warming potential and carbon footprint for greenhouse tomato systems. Sci. Hortic. 2018, 242, 10–19. [Google Scholar] [CrossRef]
  24. Bhattarai, S.P.; Midmore, D.J.; Pendergast, L. Yield, water-use efficiencies and root distribution of soybean, chickpea and pumpkin under different subsurface drip irrigation depths and oxygation treatments in vertisols. Irrig. Sci. 2008, 26, 439. [Google Scholar] [CrossRef]
  25. Abuarab, M.; Mostafa, E.; Ibrahim, M. Effect of air injection under subsurface drip irrigation on yield and water use efficiency of corn in a sandy clay loam soil. J. Adv. Res. 2013, 4, 493–499. [Google Scholar] [CrossRef] [PubMed] [Green Version]
  26. Lei, H.; Bhattarai, S.P.; Balsys, R.; Midmore, D.J.; Holmes, T.; Zimmerman, W. Temporal and spatial dimension of dissolved oxygen saturation with fluidic oscillator and Mazzei air injector in soil-less irrigation systems. Irrig. Sci. 2016, 34, 421–430. [Google Scholar] [CrossRef]
  27. Li, Y.; Niu, W.; Dyck, M.; Wang, J.; Zou, X. Yields and nutritional of greenhouse tomato in response to different soil aeration volume at two depths of subsurface drip irrigation. Sci. Rep. 2016, 6, 1–10. [Google Scholar] [CrossRef]
  28. Li, Y.; Niu, W.; Xu, J.; Wang, J.; Zhang, M. Root morphology of greenhouse produced muskmelon under sub-surface drip irrigation with supplemental soil aeration. Sci. Hortic. 2016, 201, 287–294. [Google Scholar] [CrossRef]
  29. Ben-Noah, I.; Friedman, S. Aeration of clayey soils by injecting air through subsurface drippers: Lysimetric and field experiments. Agric. Water Manag. 2016, 176, 222–233. [Google Scholar] [CrossRef]
  30. Ben-Noah, I.; Friedman, S. Oxygation of clayey soils by adding hydrogen peroxide to the irrigation solution: Lysimetric experiments. Rhizosphere 2016, 2, 51–61. [Google Scholar] [CrossRef]
  31. Bhattarai, S.P.; Midmore, D.J.; Su, N. Sustainable irrigation to balance supply of soil water, oxygen, nutrients and agro-chemicals. In Biodiversity, Biofuels, Agroforestry and Conservation Agriculture; Springer: Dordrecht, The Netherlands, 2010; pp. 253–286. [Google Scholar]
  32. Chen, J.; Kang, S.; Du, T.; Qiu, R.; Guo, P.; Chen, R. Quantitative response of greenhouse tomato yield and quality to water deficit at different growth stages. Agric. Water Manag. 2013, 129, 152–162. [Google Scholar] [CrossRef]
  33. Rao, A.V.; Agarwal, S. Role of antioxidant lycopene in cancer and heart disease. J. Am. Coll. Nutr. 2000, 19, 563–569. [Google Scholar] [CrossRef]
  34. Ruiz-Altisent, M.; Lleó, L.; Riquelme, F. Instrumental quality assessment of peaches: Fusion of optical and mechanical parameters. J. Food Eng. 2006, 74, 490–499. [Google Scholar] [CrossRef]
  35. Toor, R.K.; Savage, G.P.; Heeb, A. Influence of different types of fertilisers on the major antioxidant components of tomatoes. J. Food Compos. Anal. 2006, 19, 20–27. [Google Scholar] [CrossRef]
  36. Zhu, Y.; Cai, H.; Song, L.; Chen, H. Effects of climatic factors and soil parameters on soil respiration under oxygation conditions. Nongye Jixie Xuebao 2016, 47, 223–232. [Google Scholar]
  37. Zhu, Y.; Cai, H.; Song, L.; Chen, H. Oxygation improving soil aeration around tomato root zone in greenhouse. Trans. Chin. Soc. Agric. Eng. 2017, 33, 163–172. [Google Scholar]
  38. Zhao, W.; Cai, H.; Shan, Z.; Chen, X.; Wang, J. High yield indicators of greenhouse tomato under non-pressure irrigation. Trans. Chin. Soc. Agric. Eng. 2009, 25, 16–21. [Google Scholar]
  39. Doorenbos, J. Guidelines for Predicting Crop Water Requirements. Irrigation Drainage Papers; Food and Agriculture organization: Rome, Italy, 1975; Volume 24. [Google Scholar]
  40. Klimant, I.; Meyer, V.; Kühl, M. Fiber-optic oxygen microsensors, a new tool in aquatic biology. Limnol. Oceanogr. 1995, 40, 1159–1165. [Google Scholar] [CrossRef] [Green Version]
  41. Sharma, S.; Le Maguer, M. Lycopene in tomatoes and tomato pulp fractions. Ital. J. Food Sci. 1996, 8, 107–113. [Google Scholar]
  42. Gao, J. Experimental Guidance for Plant Physiology; China Higher Education Press: Beijing, China, 2006. [Google Scholar]
  43. Spiro, R.G. Analysis of sugars found in glycoproteins. In Methods in Enzymology; Academic Press: New York, NY, USA, 1966; Volume 8, pp. 3–26. [Google Scholar]
  44. AOAC. Official Methods of Analysis, 15th ed.; Association of Official Analytical Chemists: Washington, DC, USA, 1990. [Google Scholar]
  45. Friedman, S.; Naftaliev, B. A survey of the aeration status of drip-irrigated orchards. Agric. Water Manag. 2012, 115, 132–147. [Google Scholar] [CrossRef]
  46. Du, Y.D.; Niu, W.Q.; Gu, X.B.; Zhang, Q.; Cui, B.J.; Zhao, Y. Crop yield and water use efficiency under aerated irrigation: A meta-analysis. Agric. Water Manag. 2018, 210, 158–164. [Google Scholar] [CrossRef]
  47. Ozaki, K.; Uchida, A.; Takabe, T.; Shinagawa, F.; Tanaka, Y.; Takabe, T.; Hayashi, T.; Hattori, T.; Rai, A.K.; Takabe, T. Enrichment of sugar content in melon fruits by hydrogen peroxide treatment. J. Plant Physiol. 2009, 166, 569–578. [Google Scholar] [CrossRef] [PubMed]
  48. Dumas, Y.; Dadomo, M.; Di Lucca, G.; Grolier, P. Effects of environmental factors and agricultural techniques on antioxidantcontent of tomatoes. J. Sci. Food Agric. 2003, 83, 369–382. [Google Scholar] [CrossRef]
  49. Stevens, M.A.; Rick, C.M. Genetics and breeding. In The Tomato Crop; Springer: Dordrecht, The Netherlands, 1986; pp. 35–109. [Google Scholar]
  50. Horchani, F.; Gallusci, P.; Baldet, P.; Cabasson, C.; Maucourt, M.; Rolin, D.; Aschi-Smiti, S.; Raymond, P. Prolonged root hypoxia induces ammonium accumulation and decreases the nutritional quality of tomato fruits. J. Plant Physiol. 2008, 165, 1352–1359. [Google Scholar] [CrossRef] [PubMed]
  51. Kläring, H.P.; Zude, M. Sensing of tomato plant response to hypoxia in the root environment. Sci. Hortic. 2009, 122, 17–25. [Google Scholar] [CrossRef]
  52. Aguilar, E.; Turner, D.; Gibbs, D.; Armstrong, W.; Sivasithamparam, K. Oxygen distribution and movement, respiration and nutrient loading in banana roots (Musa spp. L.) subjected to aerated and oxygen-depleted environments. Plant Soil 2003, 253, 91–102. [Google Scholar] [CrossRef]
  53. Wang, F.; Kang, S.; Du, T.; Li, F.; Qiu, R. Determination of comprehensive quality index for tomato and its response to different irrigation treatments. Agric. Water Manag. 2011, 98, 1228–1238. [Google Scholar] [CrossRef]
  54. Qi, H.Y.; Li, T.L.; Zhang, J.; Wang, L.; Chen, Y.H. Effects on sucrose metabolism, dry matter distribution and fruit quality of tomato under water deficit. Agric. Sci. China 2003, 11, 1253–1258. [Google Scholar]
Figure 1. Seasonal variations of soil oxygen concentration for the 12 treatments during the tomato-growing season. (a), (b), and (c) show the aerated irrigation (AI) or non-aerated SDI (CK) treatments at two dripper depths (D15 and D25) but the same irrigation levels of kcp (W) of 0.6, 0.8, and 1.0, respectively. (d) and (e) show the AI or CK treatments at three irrigation levels (W0.6, W0.8 and W1.0) but the same dripper depth of 15 and 25 cm, respectively. Different letters in the same column indicate significance at P < 0.05. The error bars show ±standard deviation and the n value is 3 (replicated three times).
Sustainability 12 02703 g001
Figure 2. Seasonal variations of the soil air-filled porosity for the 12 treatments during the tomato-growing season. (a), (b), and (c) show the aerated irrigation (AI) or non-aerated SDI (CK) treatments at two dripper depths (D15 and D25) but the same irrigation levels of kcp (W) of 0.6, 0.8, and 1.0, respectively. (d) and (e) show the AI or CK treatments at three irrigation levels (W0.6, W0.8 and W1.0) but the same dripper depth of 15 and 25 cm, respectively. Different letters in the same column indicate significance at P < 0.05. The error bars show ±standard deviation and the n value is 3 (replicated three times).
Sustainability 12 02703 g002
Figure 3. The impacts of the AI and CK treatments under the three irrigation levels (W0.6, W0.8, and W1.0) and two dripper depths (D15 and D25) on the root (a) diameter, (b) length density, (c) surface area and (d) volume density at harvest time. Different letters indicate significance at P < 0.05. The error bars show ±standard deviation and the n value is 3 (replicated three times).
Sustainability 12 02703 g003
Table 1. The flowering time (indicated by DAT) and flowering duration of three ears with the AI and CK treatments under three irrigation levels (W0.6, W0.8, and W1.0) and two dripper depths (D15 and D25).
TreatmentsFirst EarSecond EarThird Ear
Flowering TimeFlowering DurationFlowering TimeFlowering DurationFlowering TimeFlowering Duration
W0.6D15AI16.00abc 17.67a25.67ab7.00a31.67bcd8.00c
W0.6D15CK15.33ab6.00a25.00ab6.00a30.00a6.00a
W0.6D25AI16.00abc7.67a27.00b6.00a33.67e7.67bc
W0.6D25CK14.00a6.33a25.00ab6.00a31.33abc6.33ab
W0.8D15AI18.33cde7.00a26.00ab6.00a32.33cde7.67bc
W0.8D15CK16.00abc6.00a25.00ab6.00a30.33ab6.33ab
W0.8D25AI19.00e7.00a27.00b6.00a33.00de7.67bc
W0.8D25CK16.00abc6.33a25.00ab6.00a31.33abc6.67abc
W1.0D15AI18.67de6.33a26.00ab6.00a32.67cde7.67bc
W1.0D15CK16.33abcd6.00a24.33a6.00a30.33ab7.00abc
W1.0D25AI19.00e6.33a27.00b6.00a32.67cde7.67bc
W1.0D25CK17.33bcde6.00a25.00ab6.00a31.33abc8.00c
F-value
AI11.44 ** 27.61 **14.74 **0.58635.09 **9.80 **
W6.86 **1.580.0380.5790.0151.042
D0.0260.09720.5865.64 *0.38
1 The different letters in the same column indicate significance at P < 0.05; 2 * indicates significance at P < 0.05, ** indicates significance at P < 0.01. The same applies below.
Table 2. The impacts of AI and CK treatments under three irrigation levels (W0.6, W0.8, and W1.0) and two dripper depths (D15 and D25) on the dry matter partitioning and harvest index (fruit weight: total dry weight) at harvest time.
TreatmentDry Weight (g)Harvest Index
RootLeafStemFruit
W0.6D15AI2.55ab28.25ab29.60abc78.53bcd0.5627a
W0.6D15CK2.42a24.03a24.14a58.08ab0.5270a
W0.6D25AI2.41a26.98ab26.83abc76.77bcd0.5731a
W0.6D25CK2.21a23.94a23.21a54.39a0.5155a
W0.8D15AI3.20ab30.19ab33.98bc80.37cd0.5442a
W0.8D15CK2.68ab27.47ab29.10abc61.65abc0.5125a
W0.8D25AI2.98ab30.96ab34.07bc78.65bcd0.5332a
W0.8D25CK2.55ab26.71ab26.66ab58.09ab0.5082a
W1.0D15AI3.50b32.84b35.86bc85.31d0.5429a
W1.0D15CK3.03ab29.92ab32.00abc68.26abcd0.5045a
W1.0D25AI3.13ab33.44b36.17c85.87d0.5466a
W1.0D25CK2.98ab28.50ab30.38abc68.79abcd0.5207a
F-value
AI2.6845.35 *8.41 **22.58 **5.00 *
W5.21 **3.82 *6.34 **2.190.585
D0.9220.0520.4730.1560.001
Table 3. The impacts of factors of AI (or CK), irrigation level (W, including W0.6, W0.8, and W1.0) and dripper depths (D, including D15 and D25) on the root parameters (diameter, length density, surface area, and volume density) at harvest time.
TreatmentsRoot Diameter
(mm)
Root Length Density
(cm m−3)
Root Surface Area
(cm−2)
Root Volume Density
(cm3 m−3)
AICKMeanAICKMeanAICKMeanAICKMean
W0.63.222.392.80a 11597982.81289.9a548.5364.2456.4a15.3410.9913.16a
W0.83.352.512.93a1879.51264.81572.2ab614443.3528.6ab18.4712.3115.39ab
W1.03.512.563.04a2130.71641.11885.9b697.9502.6600.2b20.6713.8817.28b
D153.282.432.851912.11281.51596.8626.4437.2531.818.2212.1215.17
D253.442.552.99182613111568.5613.9436.252518.112.6615.38
Mean3.36B2.49A 1869.1B1296.2A 620.1B436.7A 18.16B12.39A
F-value
AI 84.2 ** 37.21 ** 41.60 ** 73.01 **
W 0.582 10.01 ** 4.806 * 4.986 *
D 0.617 0.043 0.025 0.031
1 The different lowercase or uppercase letters in the same column or row indicate significance at P < 0.05.
Table 4. The impacts of the AI and CK treatments under three irrigation levels (W0.6, W0.8, and W1.0) and two dripper depths (D15 and D25) on fruit yield, number and weight of fruit per plant, and IWUE.
TreatmentsYield Per Plant (g)Number of Fruit Per PlantFruit Weight (g)IWUE (g L−1)
W0.6D15AI1096.5 ± 52.6c11.4 ± 0.542ab99.0 ± 4.94bcde53.9 ± 2.59e
W0.6D15CK803.8 ± 42.8a10.7 ± 0.692a79.0 ± 4.43a39.5 ± 2.10b
W0.6D25AI1103.3 ± 40.4c11.8 ± 0.638ab102.1 ± 8.24cde54.2 ± 1.98e
W0.6D25CK851.4 ± 53.2a11.4 ± 0.995ab85.9 ± 8.72ab41.8 ± 2.61bc
W0.8D15AI1285.7 ± 43.3d12.4 ± 0.400ab106.1 ± 4.42def47.4 ± 1.60d
W0.8D15CK926.4 ± 46.7ab12.6 ± 0.751b80.1 ± 5.83a34.1 ± 1.72a
W0.8D25AI1320.2 ± 36.7d12 ± 0.469ab112.6 ± 3.91efg48.6 ± 1.35d
W0.8D25CK908.6 ± 46.8ab11.9 ± 0.645ab77.1 ± 1.73a33.5 ± 1.72a
W1.0D15AI1576.7 ± 38.6e13.1 ± 0.479b123.8 ± 4.83g46.5 ± 1.14cd
W1.0D15CK1016.7 ± 38.3bc12.6 ± 0.638b85.8 ± 5.91ab30.0 ± 1.13a
W1.0D25AI1496.3 ± 44.4e12.8 ± 0.463b120.5 ± 5.00fg44.1 ± 1.30bcd
W1.0D25CK1069.5 ± 57.7c12.7 ± 0.765b88.2 ± 4.71abc31.5 ± 1.70a
F-value
AI156.31 **0.41474.88 **155.21 **
W29.60 **5.28 **5.083 **17.54 **
D0.0360.0050.3390.088
W × D10.2020.6690.2470.233
W × AI5.89 **0.1922.5430.109
D × AI0.5950.04600.407
W × D × AI1.0360.0880.5690.678
1 × is the interaction effect of experiment factors of irrigation level (W), method (AI or CK) and/or dripper depth (D).
Table 5. The impacts of the AI and CK treatments under three irrigation levels (W0.6, W0.8, and W1.0) and two dripper depths (D15 and D25) on fruit nutrition (lycopene and VC) quality and taste (soluble sugar content, organic acid content, and sugar–acid ratio) quality.
TreatmentsLycopene (ug g−1)VC (mg 100 g−1)Soluble Sugar (%)Organic Acid (%)Sugar–Acid Ratio
W0.6D15AI45.38 ± 2.78e3.90 ± 0.33ef4.21 ± 0.53cd0.854 ± 0.060bcde4.97 ± 0.54cd
W0.6D15CK25.19 ± 2.15ab2.86 ± 0.42bcd3.12 ± 0.30ab1.017 ± 0.049f3.27 ± 0.45ab
W0.6D25AI46.22 ± 2.76e4.23 ± 0.31f4.93 ± 0.57d0.777 ± 0.059abc6.73 ± 0.85e
W0.6D25CK29.76 ± 2.52b3.18 ± 0.43cde3.69 ± 0.41bc0.978 ± 0.054ef3.84 ± 0.42abc
W0.8D15AI41.25 ± 1.92de3.93 ± 0.12ef3.38 ± 0.36abc0.934 ± 0.039def3.71 ± 0.45abc
W0.8D15CK24.54 ± 0.91ab1.97 ± 0.10a3.05 ± 0.27ab0.712 ± 0.040ab4.48 ± 0.53abcd
W0.8D25AI43.63 ± 1.44e4.07 ± 0.14f4.01 ± 0.34bcd0.869 ± 0.041cde4.77 ± 0.51bcd
W0.8D25CK25.21 ± 1.23ab2.36 ± 0.32abc3.31 ± 0.27abc0.717 ± 0.044ab4.73 ± 0.40bcd
W1.0D15AI35.53 ± 1.81c3.06 ± 0.17def4.01 ± 0.28bcd0.734 ± 0.061abc5.98 ± 0.72de
W1.0D15CK21.76 ± 2.17a2.19 ± 0.45ab2.43 ± 0.16a0.873 ± 0.072cdef3.01 ± 0.29a
W1.0D25AI37.01 ± 2.18cd3.84 ± 0.24ef4.26 ± 0.20cd0.685 ± 0.048a6.83 ± 0.79e
W1.0D25CK25.50 ± 1.70ab2.43 ± 0.37abc2.55 ± 0.20a0.831 ± 0.051abcd3.20 ± 0.30a
F-value
AI163.48 **63.35 **28.81 **1.82725.998 **
W4.6 *2.4243.463 *5.358 **0.308
D1.5311.6843.6251.7324.526 *
Table 6. Correlation coefficients among fruit yield index, IWUE, fruit nutrition and taste quality index.
FactorsYield Per Plant (g)Number of Fruit Per PlantFruit Weight (g)IWUE (g L−1)Lycopene (ug g−1)VC
(mg 100 g−1)
Soluble Sugar
(%)
Organic Acid
(%)
Sugar–Acid Ratio
Yield per plant (g)10.644 *0.962 **0.4540.5510.604 *0.45−0.4310.596 *
Number of fruit per plant 10.456−0.258−0.094−0.131−0.163−0.641 *0.223
Fruit weight (g) 10.647 *0.707*0.777 **0.628 *−0.2990.661 *
IWUE (g L−1) 10.956 **0.943 **0.891 **0.0580.609 *
Lycopene (ug g−1) 10.948 **0.844 **−0.0470.609 *
VC (mg 100 g−1) 10.847 **0.0730.597 *
Soluble sugar (%) 1−0.2570.863 **
Organic acid (%) 1−0.678 *
Sugar–acid ratio 1
Table 7. The eigenvalue, variance, and cumulative variance contribution of principle components based on principal component analysis.
Principle Components EigenvalueVariance Contribution Rate (%)Cumulative Variance Contribution Rate (%)
15.44760.52160.521
22.31325.70186.223
30.96710.74396.966
40.1731.92198.887
50.0580.63999.526
60.0320.35399.879
70.0070.08199.96
80.0030.03799.997
900.003100
Table 8. The component matrix based on rotary factor method.
FactorsPrinciple Components
123
IWUE (g L−1)0.9850.0230.009
VC (mg 100 g−1)0.9680.215−0.066
Lycopene (ug g−1)0.9450.1680.038
Soluble sugar (%)0.909−0.0340.394
Yield per plant (g)0.4470.8620.193
Number of fruit per plant−0.3020.8610.35
Fruit weight (g)0.6510.7320.131
Organic acid (%)0.085−0.339−0.924
Sugar–acid ratio 0.6220.1910.744
Table 9. The comprehensive score of the 12 treatments calculated by principal component analysis based on the impacts of these treatments on fruit yield index, IWUE, and fruit nutrition and taste quality index.
TreatmentsMain Factor 1Main Factor 2Main Factor 3Comprehensive ScoreComprehensive Ranking
W0.6D15AI1.1799−0.70252−0.136360.51888285
W0.6D15CK−0.17724−1.43581−1.20373−0.6055498
W0.6D25AI1.46025−0.856791.093380.78097731
W0.6D25CK0.09878−0.98895−0.77664−0.277797
W0.8D15AI0.500830.94261−1.441530.39053286
W0.8D15CK−1.23719−0.369191.14365−0.72080111
W0.8D25AI0.932780.54084−0.615290.63743224
W0.8D25CK−0.9064−0.952261.23719−0.6604110
W1.0D15AI0.33251.664960.53580.68666863
W1.0D15CK−1.437560.48576−0.63815−0.81370812
W1.0D25AI0.494251.06361.244330.70610632
W1.0D25CK−1.240890.60777−0.44266−0.6423319

