Article

Renegotiation Strategy of Public-Private Partnership Projects with Asymmetric Information—An Evolutionary Game Approach

1
College of Architecture & Environment, Sichuan University, Chengdu 610065, China
2
School of Civil Engineering and Transportation, South China University of Technology, Guangzhou 510641, China
3
State Key Laboratory of Subtropical Building Science, South China University of Technology, Guangzhou 510641, China
*
Author to whom correspondence should be addressed.
Sustainability 2020, 12(7), 2646; https://doi.org/10.3390/su12072646
Submission received: 26 February 2020 / Revised: 23 March 2020 / Accepted: 23 March 2020 / Published: 26 March 2020

Abstract

:
The characteristics of public-private partnerships (PPPs) determine that renegotiation is inevitable. Moreover, the strategic choice of the government and investors during renegotiation is critical for the project to continue. Previous studies suggested that the government’s decision-making mistakes and investors’ opportunism during renegotiation are the significant reasons for project failures. However, most of the research focused on the behavioral decision of one party while few have applied evolutionary game theory to study the mutual influence of the strategy choices of both parties involved. To address this issue, this paper established an evolutionary game model of the government’s and investors’ renegotiation strategies, and analyzed the evolutionary stability strategy and related parameters. The results showed that the government’s selection of strategy is based on two values, i.e., the buyback cost and the difference between subsidy cost and the expected social benefit of the project in the future. The higher the expected social benefit, the higher the probability that the government chooses to maintain the project. Besides, investors’ strategy is mainly determined by speculative net benefit and financial status. The probability of investors’ opportunism is positively correlated with the speculative net benefit and negatively correlated with the project benefit of non-opportunism. In addition, cooperative benefits created by reasonable participation in the project will effectively restrict opportunistic behaviors, and the interactive behavior of both game players will move toward the optimal portfolio strategy. This study can provide relevant management suggestions for avoiding excessive subsidies and restraining opportunistic behaviors, which are conducive to the sustainable development of PPP projects.

1. Introduction

Public-private partnerships (PPPs) have been continuously and extensively applied in the field of infrastructure, and become one of the most popular and essential governance structures to provide public infrastructure or services [1,2]. With the standardization of PPP mode, most of the projects will gradually transform from the financing and construction phases to its operation. Therefore, the research will be more focused on solving various complex problems in the process of projects, which can promote the sustainable development of PPPs and ensure the long-term sustainable operation of the projects [3,4,5,6]; one of these issues is renegotiation.
Concession agreements are typically incomplete contracts because PPP projects usually have long-term concessions, large-scale investments, and complicated contract relationships [5,7]. Therefore, the government and investors cannot include all possible events into the contracts at the initial stage of cooperation. When the conflict and contradiction escalate, all stakeholders will adjust the contract terms through renegotiation [8]. In consequence, renegotiation often occurs in the process of PPP projects, and its existence is necessary, especially for some with significant uncertainties, where the value of the terms with appropriate flexibility that allow renegotiation may exceed the transaction cost of renegotiation.
However, there has been serious information asymmetry in PPP projects, which enable investors to act opportunistically in renegotiations of PPPs [9]. Case statistics showed that the proportion of renegotiation initiated by the private sector was much higher than that initiated by the government, which led to the contract terms moving in the private sector’s favor [10], and the social benefits were relatively low. If the private sector wishes to renegotiate, it can choose to reduce investment and efficiency, which will affect the overall social efficiency and return of the project but will increase the benefits of the private sector [11]. In addition, if the private sector selected in the initial stage has a low management capacity, in order to ensure its benefits, it will urge the government to renegotiate and also increase the probability of renegotiation in the later stage [12]. For the government, excessive subsidies will not only harm the public interest but also affect social credibility.
Moreover, according to the statistical analysis of China’s renegotiation cases [13], the renegotiation results in two main categories, withdrawal of social capital and adjustment of investment return mechanism. Withdrawing social capital before the original expiry date of the contract results in the early termination of PPP projects [14], realized in the form of the buyback. The adjustment of the return mechanism is mainly in the form of government subsidies. When a PPP project is in distress, the government and private partners have to decide to renegotiate contract terms or terminate the projects [15]. In practice, the government usually maintains the project through renegotiation with investors in order to prevent the failure of the project, which may lead to the financial burden of excessive subsidies and the severe opportunistic behavior of investors. Continuous renegotiation and massive public financial guarantee will lead to a large number of public resources being used to make up for the losses of the private sector in PPP projects. Therefore, in order to find the optimal strategy and maximize the returns, evaluating the payoffs of renegotiation against early termination for stakeholders is essential [15,16].
In general, the outcome of the renegotiation determined whether the project should proceed, but most studies focus on one aspect of renegotiation and few on the reasons for the different outcomes. At the same time, investors’ opportunism will have an impact on the direction of the renegotiation. Besides, there is insufficient research on the internal mechanism between investors’ opportunistic behavior and the government’s corresponding strategy selection, including the mutual influence of both parties’ behavioral decisions. Therefore, the objective of this research is to explore the strategy selection during renegotiation and reveal the evolutionary mechanism of renegotiation’s results to develop measures to control opportunism and avoid excessive subsidies.
The paper is organized as follows. In Section 2, a systematic literature review on renegotiation of PPP projects is presented. In Section 3, the reason for choosing evolutionary game model is elaborated. In Section 4, the assumptions are explained, and the evolutionary game model of the renegotiation strategy between the government and investors is described. Section 5 focuses on the equilibrium analysis of the evolutionary game and the impact of factors on stable strategies. In Section 6, a numerical simulation is presented based on the model in Section 4. Finally, Section 7 and Section 8 draw discussion and conclusions.

2. Literature Review

Renegotiations are normal nowadays. According to the statistics of PPP projects in major Latin American countries and regions, the renegotiation rate of 307 transportation and water projects was 61% and 87% by 2004, and the data showed that the renegotiation rate increased gradually with the progress of the projects [17]. Due to the incompleteness of PPP contracts [18,19], renegotiation is necessary, and there has been a large amount of literature concerning the rationality of PPP renegotiation. Domingues and Zlatkovic [20] proved that an effective communication mechanism and good governance relationship can promote the positive effect of renegotiation through the case study of PPP projects in Europe. Yin and Wang [21] indicated that PPP contracts allowing reasonable renegotiation can provide a risk release mechanism for PPP projects, which is conducive to the maintenance of project value. In general, it is necessary to permit stakeholders to initiate renegotiation under certain conditions, rather than design the contract as carefully as possible to prevent renegotiation.
On the dark side of renegotiation, the most concentrated problem is opportunism under information asymmetry. Cruz and Marques [22] indicated that the probability of renegotiating increased with the size of the concession as well as with the lack of regulation when contracts were signed. Furthermore, Albalate and Bel [23] indicated that the high occurrence of renegotiation would have a significant impact on the efficiency of PPP projects. As for the influence of opportunism, Ho et al. [24] analyzed the transaction cost of opportunism in PPP projects and divided opportunism into two categories, ex-ante inefficiency, and ex-post inefficiency. Opportunistic bidding distorts true information and misleads the government in making the wrong decision to award a project, often leading to early termination after the project is awarded, or seeking government assistance through renegotiation. In the process of project construction and operation, investors’ inefficiency includes shirking behaviors, high monitoring cost, and financial distress, which may directly lead to project failure due to information asymmetry and bounded rationality.
An overview of previous literature shows that frequent renegotiation, and early termination was considered as the failure of the project [25,26], and various trigger factors were analyzed in order to avoid such a situation. Song et al. [27] analyzed the reasons for the early termination based on the case study of 23 PPP projects in China and emphasized that the early termination usually occurred after renegotiation. The government’s decision-making error caused by information asymmetry was the main reason for the termination of projects. Xiong et al. [28] indicated that the high occurrence of renegotiation and early termination of PPP projects suggesting ex-post risk management is needed and proposed a risk management model applied with risk impact evaluation, ex-post risk response measures assessment, selection, and enforcement. Moreover, World Bank’s statistics showed that there are 334 projects (6.85%) which were terminated early in developing countries from 1984 to 2010 [29], and even some famous PPP projects also experienced a renegotiation and early termination, such as Ho et al. [30], who made a detailed analysis of the English Channel tunnel franchise’s early termination case. Therefore, as a possible outcome after renegotiation, early termination also needs to be handled reasonably to ensure the sustainability of the PPP mode.
There has also been some literature that focuses on limiting opportunism in renegotiation. Russo et al. [31] developed an incentive mechanism in the renegotiation and concluded that the lack of investors’ screening mechanism was the main reason for the high rate of renegotiation and project termination. Moreover, to avoid unnecessary renegotiation, the critical triggers for renegotiation were identified by Domingues and Sarmento through a case study of European transport concessions [32]. Xiong [9] constructed a game theoretical model to study the influence of information asymmetry on the decision-making of renegotiations in PPP projects and improved the decision-making rules for renegotiations through eliminating information asymmetry. In short, if the opportunistic behavior in renegotiation is not managed, the positive impact of renegotiation will be lost, and hidden dangers will be laid for the project.
The review of the existing literature shows that renegotiation has always been an essential topic in the research of the PPP project. First of all, reasonable renegotiation is beneficial to the sustainability of PPP projects, but investors’ opportunism will affect the strategic selection in the renegotiation. Besides, the current research focuses more on opportunistic behaviors or early termination after the failure of renegotiation but pays less attention to the various factors that lead to different outcomes of renegotiation. Hence, the goal of this paper was to explore the evolutionary mechanism of strategy selection, and thus to provide suggestions for the government’s decision-making and limiting opportunism.

3. Methodology

In the research of information asymmetry of PPP projects, game theory [33,34,35] and principal-agent [36,37] are the most common methods. According to the traditional game theory, the players are completely rational [38,39,40], which is usually difficult to achieve in reality. With the development of game theory, evolutionary game theory provides a practical method to solve these problems. The advantage of evolutionary game theory is that it can be used to dynamically study the process of multiagent behaviors’ change and observe the influence of different factors on the behaviors’ change of different compensation subjects.
The evolutionary game has been successfully applied to economies and societies to analyze long-term economic and trading behavior [41]. It liberates the limits of absolute rationality, which is the hypothesis of “economic man” repeatedly emphasized in asymmetric information game theory. Every player obtains the information of competitors through continuous trial and error, learns, simulates and corrects behaviors, and replaces absolute rationality with bounded rationality [42]. In recent studies, evolutionary game theory has also been used to study moral hazard in the construction industry under asymmetric information [43], the behavioral decision-making of stakeholders [44,45], the government subsidy mechanism of supply chain [46], and incentives for green retrofits [47]. Therefore, for the problem of behavioral decisions in the renegotiation under asymmetric information, the evolutionary game will better analyze the whole decision-making process. More importantly, we want to observe the selection of renegotiation strategy under different scenarios (instead of a specific case). Therefore, we could simulate game players’ behavior as close to reality as possible in the evolutionary game when the case data is difficult to obtain.
Based on the discussion above, considering the bounded rationality and information asymmetry of behavior decisions, this paper proposes an evolutionary game model of renegotiation strategy selection. From the perspective of benefit, we analyzed the rationality of the government’s strategy to maintain the project and the impact of investors’ opportunistic behavior on the renegotiation consequence. The behavioral decision-making evolutionary path, stable strategies and the critical conditions for the system to reach a stable equilibrium state are obtained. Moreover, the key parameters affecting the player’s strategy selection are simulated numerically, so as to provide constructive suggestions for the government on rational decision-making decisions and restrain the opportunistic behavior of investors.

4. Evolutionary Game Model

4.1. Description of the Problem

According to relevant literature research, the renegotiation of PPP projects is generally conducted between the government and investors. Therefore, this study sets the players of the game as the government and investors, and the former occupies a dominant position during renegotiation [16,31]. Hence, the government’s strategies are defined as two categories, namely, “maintain the project” and “terminate the project”. Relatively, due to information asymmetry, the government cannot grasp the true income of investors at this stage, and it is uncertain whether investors have an opportunistic tendency, and investors can choose whether to use this asymmetric information to obtain opportunistic benefits. Therefore, the investors’ strategy is divided into “opportunism” and “non-opportunism”.
From the perspective of benefit, no matter whether the government chooses to maintain the project or buyback, it will generate additional political costs [16], and the total amount paid will be, therefore, higher than the amount of subsidy or buyback. When the government chooses to maintain the project, both parties need to analyze the future benefit of the project. Furthermore, investors’ opportunism will lead to different results. When the government chooses to terminate the project early, investors are concerned about their financial situation at this time, and opportunism will lead to different unrecovered costs. Therefore, for the two types of game players, the government and investors in the renegotiation process of the PPP project, the evolutionary game model of renegotiation strategy choices was constructed.

4.2. Assumptions

Considering what has been mentioned above, we propose the following assumptions:
Assumption 1.
According to the above description of the research problem, the renegotiation is basically between the government and investors, therefore it is assumed that only these two parties exist in the game and they are both bounded rationally and choose strategies independently and dynamically based on returns.
Assumption 2.
Under the condition of information asymmetry, there are two strategic choices for investors in the renegotiation stage of the PPP projects. One is to conduct reasonable renegotiation under the condition of non-opportunism (“non-opportunism”), and the other is to take opportunistic behavior to obtain additional benefits (“opportunism”). There are two types of government strategies, one is to maintain the project in the form of subsidies (“maintain the project”), the other is to terminate early, buyback the project from the original investors, and re-tender to replace the investors (“terminate the project”).
Assumption 3.
PPP projects usually have the characteristics of public goods, the government therefore focuses more on the social benefits of the project, and the opportunistic behaviors of the investors will lead to additional speculative income and damage the social benefits.
At the renegotiation stage, the normal benefit of the project is R 0 , and the normal social benefit of the government is S 0 . When investors have opportunistic behaviors, the influence coefficient on the government’s benefit is λ and λ < 1 . When investors adopt opportunistic behaviors, the corresponding opportunistic cost will be generated, and the difference between opportunistic benefit and cost is the net benefit. We suppose that the speculative net benefit obtained by investors is ΔR.
Assumption 4.
Suppose that the government needs to accept the subsidy application from the investors when choosing to maintain the project. Both players will analyze the future benefits and social benefits of the project, and whether or not the investors adopt opportunistic behaviors will lead to different results.
Under such circumstances, investors will get the subsidy U , and the subsidy cost coefficient of the government is α , and α > 1 . In the case of non-opportunism, the expected future benefit of the project is R 1 and the expected social benefit created is S 1 . In the case of opportunism, the expected future benefit of the project is R 2 , and the expected social benefit is S 2 . Moreover, the government will face the risk of future frequent renegotiations if investors have taken opportunistic behaviors, and the loss will be expressed as Δ S . Since the opportunism of investors will affect the reasonable progress of the project, S 1 > S 2 and R 1 > R 2 are set in this paper.
Assumption 5.
When the government chooses to terminate the project, the project needs to be bought back. Whether the investors adopt opportunism will result in different unrecovered costs at the renegotiation node.
Under such circumstances, investors will get the buyback amount N , and the government’s buyback cost coefficient is θ , and θ > 1 . In the case of non-opportunism, the unrecovered cost of investors is K 1 , while in the case of opportunism, the unrecovered cost is K 2 .
Based on the above-mentioned five assumptions, the payoff matrix between the government and investors on renegotiation strategy is established, as shown in Table 1.
In an evolutionary game, considering game players’ bounded rationalities, the choice of strategy is expressed by probability. Therefore, we assume that the probability of investors choosing non-opportunism strategy is x , and the probability of investors choosing opportunism strategy is 1 x . Additionally, we suppose that the probability of the government choosing to maintain the project is y , and the probability of the government choosing to terminate the project is 1 y . Obviously, 0 x 1 , 0 y 1 .
According to Table 1, the expected revenue for investors to choose the non-opportunistic strategy is:
U 11 = y ( R 0 + U + R 1 ) + ( 1 y ) ( R 0 + N K 1 ) = y [ U + R 1 ( N K 1 ) ] + R 0 + N K 1
The expected revenue of investors to adopt the opportunistic strategy is:
U 12 = y ( R 0 + U + Δ R + R 1 ) + ( 1 y ) ( R 0 + N + Δ R K 2 ) = y [ U + R 2 ( N K 2 ) ] + R 0 + Δ R + N K 2
The average expected revenue of investors is:
U 1 = x U 11 + ( 1 x ) U 12
Accordingly, the expected revenue for the government to choose to maintain the project is:
U 21 = x ( S 0 α U + S 1 ) + ( 1 x ) ( λ S 0 α U Δ S + S 2 ) = x [ S 0 + S 1 ( λ S 0 Δ S + S 2 ) ] + λ S 0 α U Δ S + S 2
The expected revenue for the government to choose to terminate the project is:
U 22 = x ( S 0 θ N ) + ( 1 x ) ( λ S 0 θ N ) = x ( 1 λ ) S 0 + λ S 0 θ N
The average expected revenue for the government is:
U 2 = y U 21 + ( 1 y ) U 22
According to the evolutionary game theory, the replication dynamic equations of the proportion x for investors is:
F ( x ) = d x d t = x ( U 11 U 1 ) x ( 1 x ) [ y ( R 1 R 2 + K 1 K 2 ) ( K 1 + Δ R K 2 ) ]
The replication dynamic equations of the proportion y for the government is:
F ( y ) = d y d t = y ( U 21 U 2 ) y ( 1 y ) [ x ( S 1 S 2 + Δ S ) ( α U + Δ S θ N S 2 ) ]

4.3. The Stability Analysis of Equilibrium Strategy

When the replication dynamic equations equal 0, we can get the stable state of the system. Equation (7) indicates that only when x = 0 , 1 or y = K 1 K 2 + Δ R R 1 R 2 + K 1 K 2 does the strategy of investors reach a local stable. Equation (8) indicates that the strategy of the government is locally stable when y = 0 , 1 or x = α U + Δ S S 2 θ N S 1 S 2 + Δ S . Therefore, the system composed of Equations (7) and (8) has equilibrium points E1(0,0), E2(1,0), E3(0,1), E4(1,1) and E5( x , y ), and when 0 < x , y < 1 is satisfied, there is an equilibrium point E5( x , y ). Among them, E1, E2, E3 and E4 are the pure strategy Nash equilibrium, and E5 is the mixed strategy Nash equilibrium.
Since the prerequisite of investors to participate in the PPP projects is that the income can reach the balance of a financial situation, the prerequisite conditions analyzed in this paper is R 1 R 2 > K 2 K 1 , i.e., the future income of the project can cover the unrecovered costs.
According to the method proposed by Friedman [48], the evolutionary stable strategy (ESS) can be obtained through the Jacobian matrix J computational analysis of the system, namely, that if and only if Determinant J (Det J) > 0 and Trace J (Tr J) < 0, the point has local stability. The Jacobian matrix J is as follows:
J = ( F ( x ) x F ( x ) y F ( y ) x F ( y ) y ) = ( ( 1 2 x ) [ ( R 1 R 2 + K 1 K 2 ) y ( K 1 + Δ R K 2 ) ] x ( 1 x ) ( R 1 R 2 + K 1 K 2 ) y ( 1 y ) ( S 1 S 2 + Δ S ) ( 1 2 y ) [ ( S 1 S 2 + Δ S ) x ( α U + Δ S θ N S 2 ) ] )
Det J and Tr J calculation formulas for each point are shown in Table 2.
According to the Det J and Tr J of the Jacobian matrix, various equilibrium scenarios are analyzed below. Due to the different boundary conditions, the nine scenarios can be divided into three categories according to the different government dominant strategies for specific discussion. Details are shown in Table 3, Table 4, and Table 5.
In the three scenarios of Table 3, when θ N < α U + S 2 Δ S < α U + S 1 is satisfied, the government’s dominant strategy is to maintain the project. That is, no matter how investors choose their strategy, the government will choose to maintain the project in the renegotiation. In other words, the government is optimistic about the future benefit of the project, even if investors have opportunistic behavior, but it has little impact on the reasonable progress of the project, and the renegotiation is moving in the right direction. Therefore, it is estimated that the risk of renegotiation in the future is small, and the buyback cost is enormous, which the government cannot afford. In the case that the government chooses to maintain the project strategy unchanged, the strategic choice of investors is analyzed as follows.
In scenario 1, the investors’ dominant strategy is non-opportunism under the constraint condition Δ R < K 2 K 1 < R 1 R 2 . As the speculative net benefit Δ R is less than the difference between the project’s future benefit under the two strategies ( R 1 R 2 ), that is to say, investors’ reasonable participation in the project after the completion of the negotiation will create more value, and taking opportunistic actions will damage the profit of the project. The evolutionary path is shown in Figure 1a, and the ESS of the system is E4(1,1).
In scenario 2, when K 2 K 1 < Δ R < R 1 R 2 is satisfied, the speculative net benefit Δ R of the investors cannot make up the difference of future returns, the dominant strategy is therefore non-opportunism. Thus, the ESS of the system is E4(1,1), and the evolutionary path is shown in Figure 1b.
In scenario 3, the investors’ dominant strategy is opportunism under the constraint condition K 2 K 1 < R 1 R 2 < Δ R , and the ESS of the system is E3(0,1). At this time, the situation is opposite to scenario 1. The evolutionary path of scenario 3 is shown in Figure 1c.
In the three scenarios (Table 4), when α U + S 2 Δ S < α U + S 1 < θ N is satisfied, the government’s dominant strategy is to terminate the project. That is, regardless of the investors’ strategy, the expected benefit of maintaining the project strategy is less than the expected benefit of terminating the project strategy. Even if the investors reasonably participate in the construction and operation of the project, the estimated future income of the project is relatively poor, and the subsidy cost required to rescue the failed project is exceptionally high. The detailed analysis of investors’ strategies is shown as follows.
In scenario 4, the speculative net benefit Δ R is less than the difference between unrecovered costs under the two strategies ( K 2 K 1 ). In other words, the ability level of investors and their financial situation is different under different strategies. In this case, investors’ income may not reach the expected level due to opportunistic behavior (such as winning the bid at a low price), and the dominant strategy is therefore non-opportunism. The ESS of the system is E2 (1,0), and the evolutionary path of scenario 4 is shown in Figure 2a.
In scenarios 5 and 6, when the government decides to terminate the project since speculative net benefit Δ R can make up the difference of unrecovered costs, the dominant strategy of the investors is to adopt opportunistic behavior, and the ESS is E1(0,0). The evolutionary path is shown in Figure 2b,c.
Three scenarios in Table 5 satisfy the constraint condition α U + S 2 Δ S < θ N < α U + S 1 . This constraint condition means that investors’ strategic choice influences the government’s strategic choice. When investors reasonably construct and operate the project, the benefit brought by maintaining the project will be higher, and the dominant strategy is to maintain the project. However, when the degree of investor opportunism is relatively high, it will seriously harm the public interests, and based on the past performance of investors, the government estimates the risk of future negotiation is high, so it should choose to terminate the project and change investors to avoid more significant losses.
In scenario 7, the dominant strategy of investors is non-opportunism, and the government therefore chooses to maintain the project, and the ESS of this system is E4 (1,1). The evolution path is shown in Figure 3a.
In scenario 8, the investors’ strategy is also influenced by the government’s strategy. When the government chooses to maintain the project, the expected benefit of the non-opportunism strategy is higher than that of the opportunism strategy, while when the government chooses to terminate the project, the expected benefit of the opportunism strategy is higher than the non-opportunism strategy. Therefore, the ESS in this system of the long-term game between the two players is E1 (0,0) and E4 (1,1), and the evolutionary trend is shown in Figure 3b.
In scenario 9, the dominant strategy of investors is opportunism, so the government chooses to terminate the project. Hence, the ESS of this system is E1 (0,0), and the evolution path is shown in Figure 3c.

5. Analysis of Evolutionary Game Results

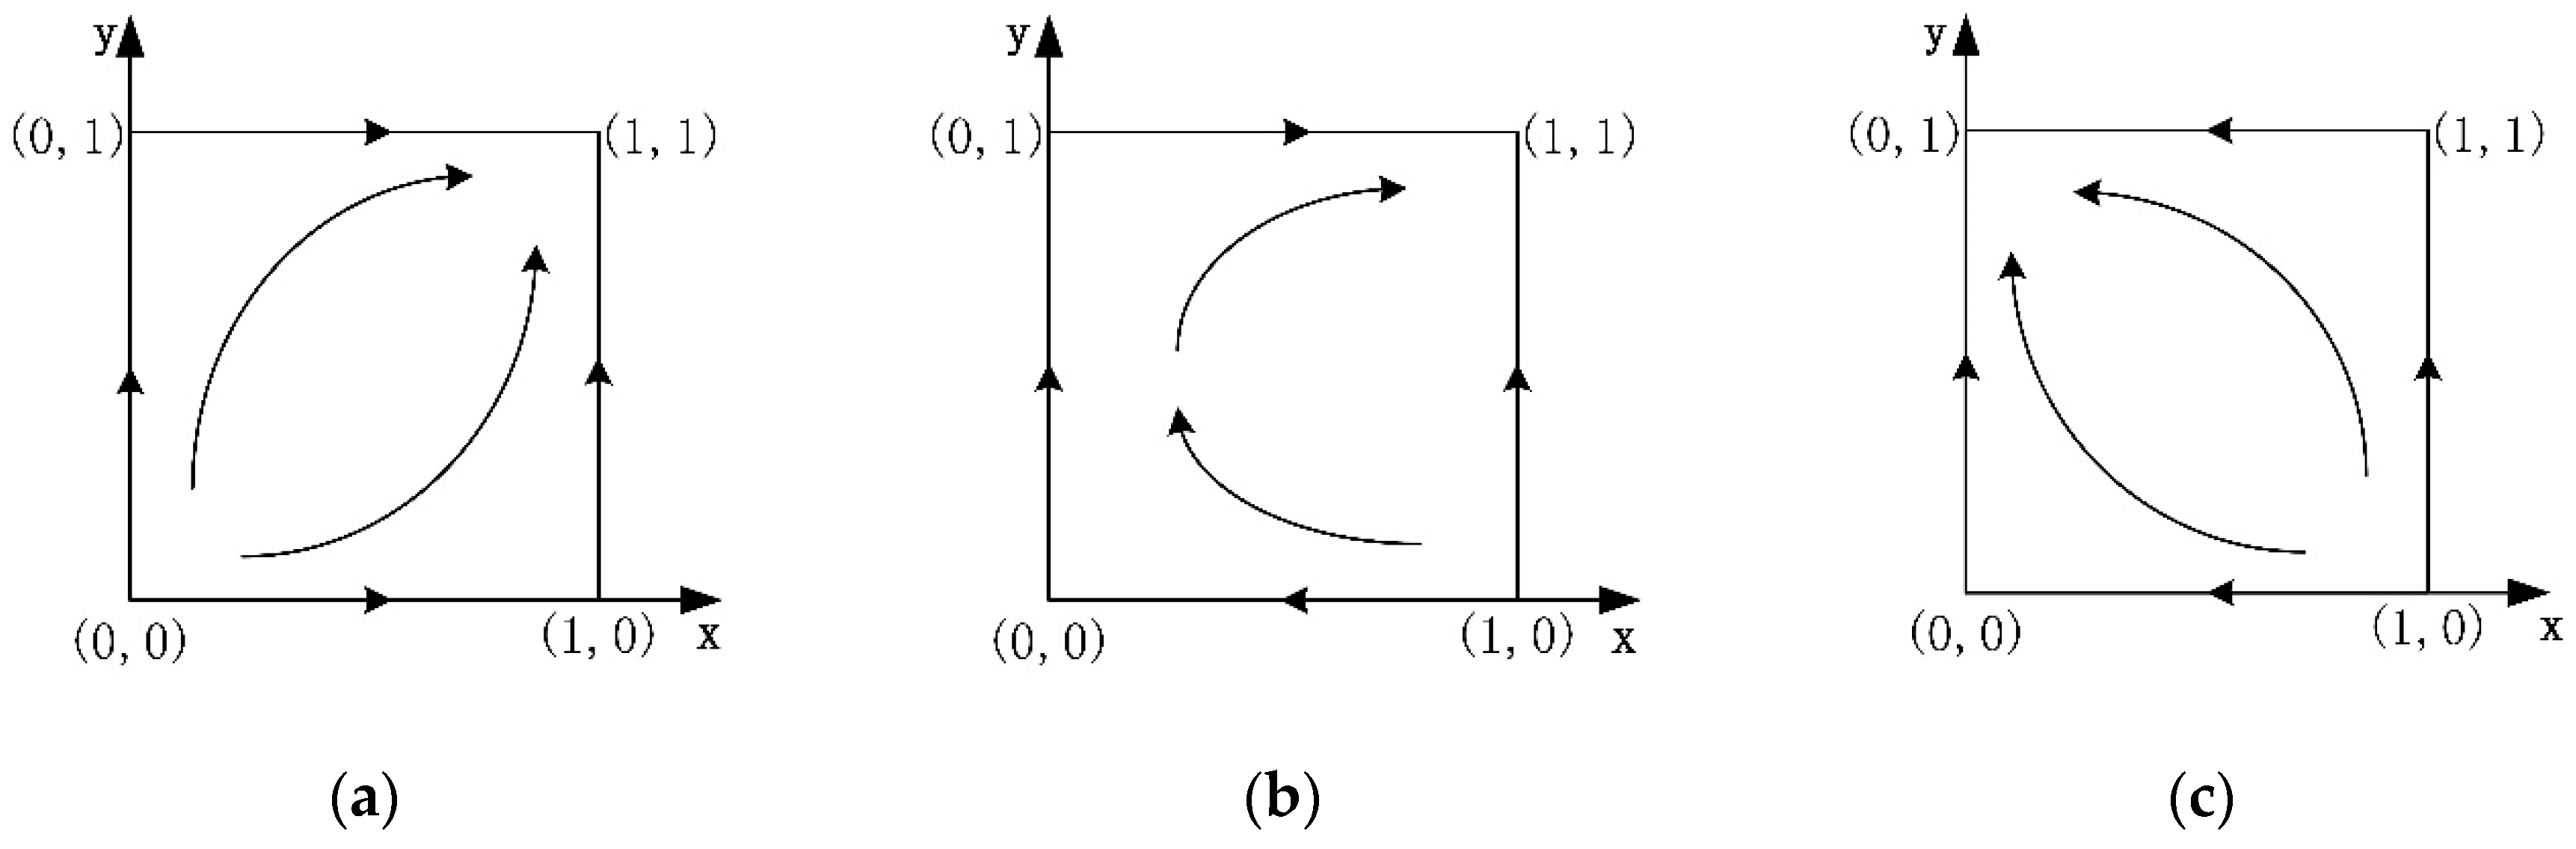
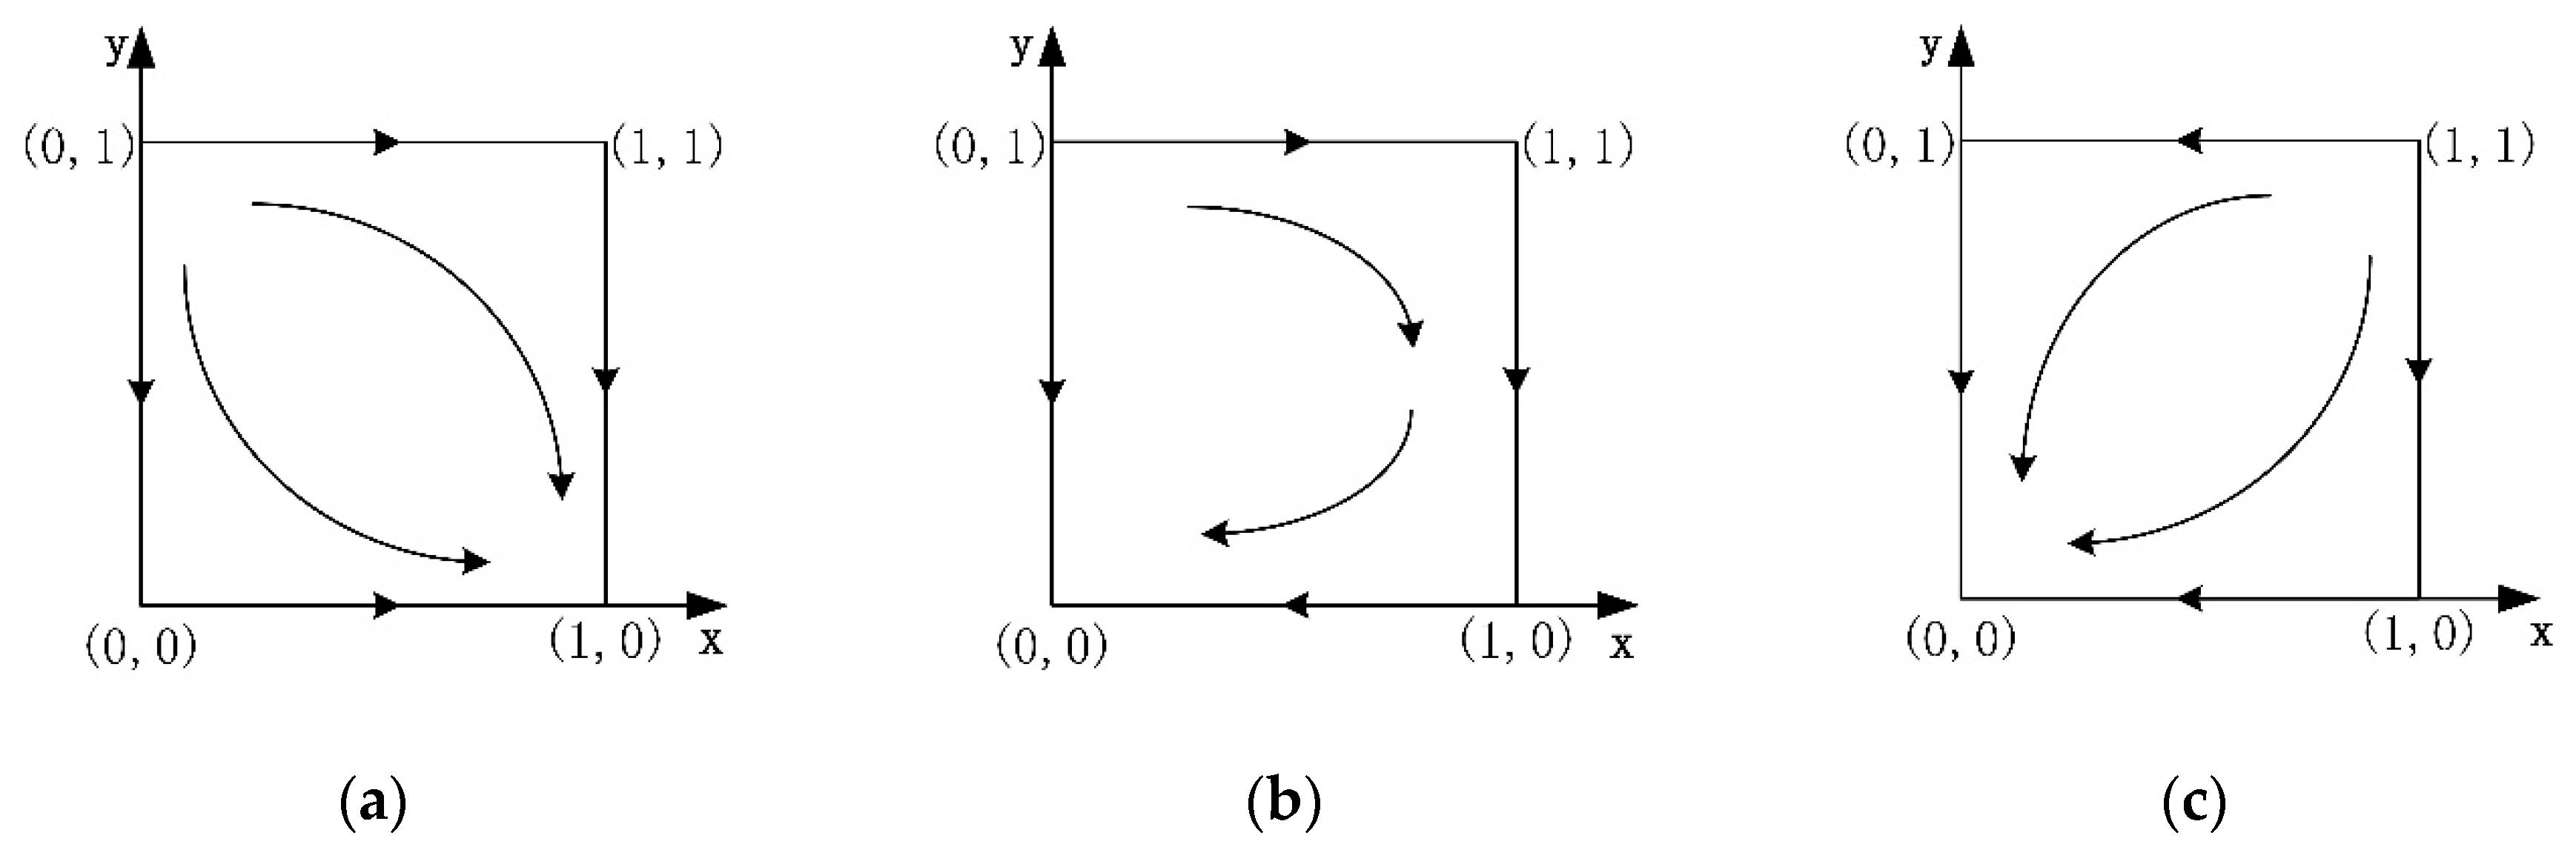
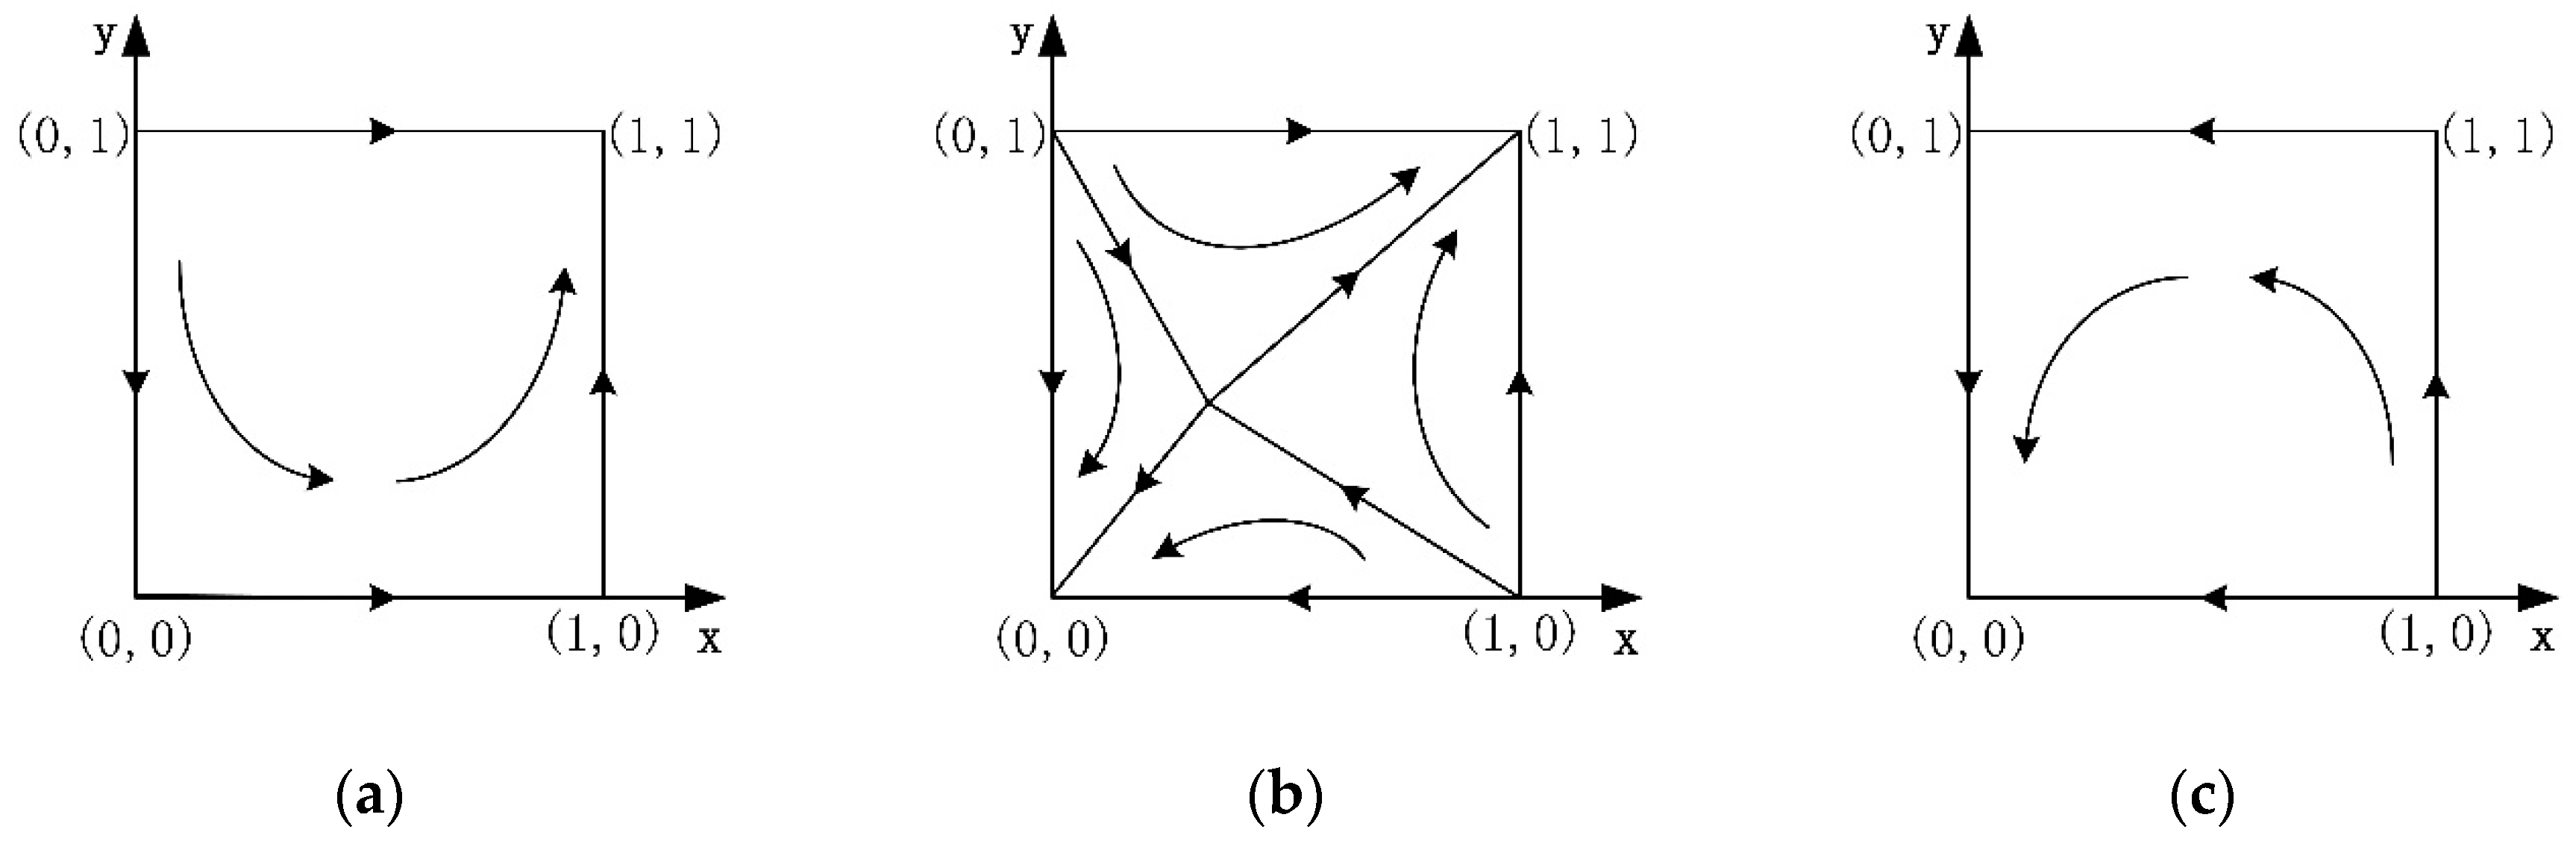
5.1. Pure Strategy Nash Equilibrium

According to the analysis of all the above scenarios, the strategy selection of government is based on the relationship among θ N , α U + S 2 Δ S and α U + S 1 . When the expected benefit of the subsidy is greater than the expected benefit of the buyback, both players will analyze and predict the future status of the project and believe that maintaining the project will create higher value. When the expected benefit of the subsidy is less than the expected benefit of the buyback, the maintenance of the project is expected to cause a huge financial burden on the government. Even if the termination of the project is generally regarded as the failure of the PPP projects, from the perspective of income, timely stop loss is an effective measure to avoid a worse situation. In particular, when the condition α U + S 2 Δ S < θ N < α U + S 1 is satisfied, faced with the risk of frequent future negotiations and investors’ damage to the social benefits of the project, the government will no longer tolerate the opportunistic behavior of investors but is more inclined to maintain the project with the right investors.
The strategy selection of the investors is based on the relationship among speculative net benefit ( Δ R ), project future benefit difference ( R 1 R 2 ), and unrecovered cost difference ( K 2 K 1 ). When the speculative net benefit is higher than R 1 R 2 and K 2 K 1 , the government’s choice of strategy will not affect that of the investors, who will unconditionally take opportunistic behavior. However, when the speculative net benefit is less than the difference between the two types, investors choose non-opportunism and participate in the project reasonably to pursue more project benefits. In particular, under the constraint condition K 2 K 1 < Δ R < R 1 R 2 , the speculative net benefit can cover the cost difference, but without opportunism, the more significant benefit of the project will be created.
In the process of system evolution, scenarios 1, 2, and 7 can reach the evolutionary stable strategy E4 (1,1). For investors, non-opportunism is the dominant strategy, while for government, maintaining the project with original investors is the best result, and the optimal strategy in the real situation is achieved at this time. The final evolutionary stable strategy in scenarios 5, 6, and 9 is E1 (0,0). Owing to the opportunistic behavior of investors, the government loses confidence in the project, leading to the government terminating and buying back the project, and the investors withdrawing from the project. The evolutionary stable strategy in scenario 3 is E3(0,1), the government’s dominant strategy is maintaining the project, while investors choose to adopt opportunistic behavior. Although this situation is acceptable to the government from the perspective of income, inhibiting opportunism is more conducive to the healthy development of the project. In scenario 4, the evolutionary stable strategy is E2(1,0), and the government’s dominant strategy is to terminate the project, and the investors’ dominant strategy is non-opportunism, indicating that the project has fallen into significant difficulties, which investors’ opportunism has little impact.

5.2. Mixed Strategy Nash Equilibrium

In scenario 8, there are two evolutionary stable strategies, and the initial strategies of both players determine the probability of reaching both strategies. We use the area of M1 region (E1, E2, E5, and E4) to represent the probability that the evolutionary stable strategy is E1 (opportunism, terminate the project). Correspondingly, the area of M2 region (E2, E4, E3, and E5) represents the probability that the evolutionary stable strategy is E4 (non-opportunism, maintain the project). M1 area is expressed by Equation (10).
M 1 = 1 2 ( x + y ) = 1 2 ( α U + Δ S S 2 θ N S 1 S 2 + Δ S + K 1 K 2 + Δ R R 1 R 2 + K 1 K 2 )
For both players, E4 is the best result of the PPP project’s renegotiation. When the area of M1 increases, the system’s final evolutionary stable strategy tends to opportunism, and termination of the project, and when M2 increases, the system’s evolutionary stable strategy tends to non-opportunism, and maintaining the project. According to Equation (10), the influence of each parameter on the evolutionary path of scenario 8 is analyzed, and the influence of these related parameters on M1 and M2 is shown in Table 6.
  • When other parameters remain unchanged, M1 is positively correlated with Δ S and Δ R . It means that the higher the risk of future renegotiation is estimated by the government and the higher the excess profits obtained by investors’ opportunism, the higher the probability of the system reaching a stable strategy (opportunism, terminate the project).
  • M1 is negatively correlated with S 1 and S 2 . It means that whether the investors have an opportunism tendency or not, the higher the social benefits generated when investors receive subsidies to maintain the project, the higher the probability of the system reaching a stable strategy (non-opportunism, maintain the project).
  • M1 is positively correlated with K 1 , which means that when renegotiation occurs, the higher the unrecovered cost is in the case of non-opportunism, the more likely investors are to adopt opportunistic behavior, and the higher the probability of system stability strategy reaching opportunism, and terminating the project. M2 is positively correlated with K 2 , which means that the higher the unrecovered cost is in the case of opportunism, the higher the probability that the system stability strategy will reach non-opportunism, and maintaining the project.
  • M1 is positively correlated with the subsidy cost α U , while M2 is positively correlated with buyback cost θ N . The higher the total cost of government departments due to subsidies, the higher the probability that the system’s evolutionary stability strategy will be opportunism, and terminating the project. Similarly, the higher the buyback cost, the higher the probability of non-opportunism, and maintaining the project.
  • M1 and R 2 are positively correlated. In the case of opportunism, the higher the future income of the project, the more likely investors are to adopt opportunism, the higher the probability of opportunism, and terminating the project. Similarly, M2 and R 1 are positively correlated. The higher the future income of the project under the condition of non-opportunism, the higher the probability of non-opportunism, and maintaining the project.
In summary, the initial strategy selection of the government and investors will affect the final evolutionary stable strategy of the system, and the parameters such as future project income, subsidy cost, buyback cost, unrecovered cost of investors, speculative net benefit and so on, all affect the initial strategy selection. In the following, the effects of various factors will be graphically demonstrated through numerical simulation.

6. Numerical Simulation

Based on the above analysis of game model results, in order to more intuitively show the impact of initial strategy selection and the changes of different parameters on the renegotiation results, this paper used the Python program to conduct simulation analysis on the evolutionary game and observe the changes of the evolutionary results.
The appropriate functions are called in the Python program to acquire evolutionary paths of dynamic behaviors over time. Original values should be set before the numerical simulation, and the combined strategies are defined as ( x 0 , y 0 ), wherein 0 x 0 , y 0 1 . In the evolutionary game, the values of x 0 and y 0 represent the initial probability of choosing a strategy. After setting the initial value of the strategy selection, we can observe the evolution path with time through the change of other parameters.

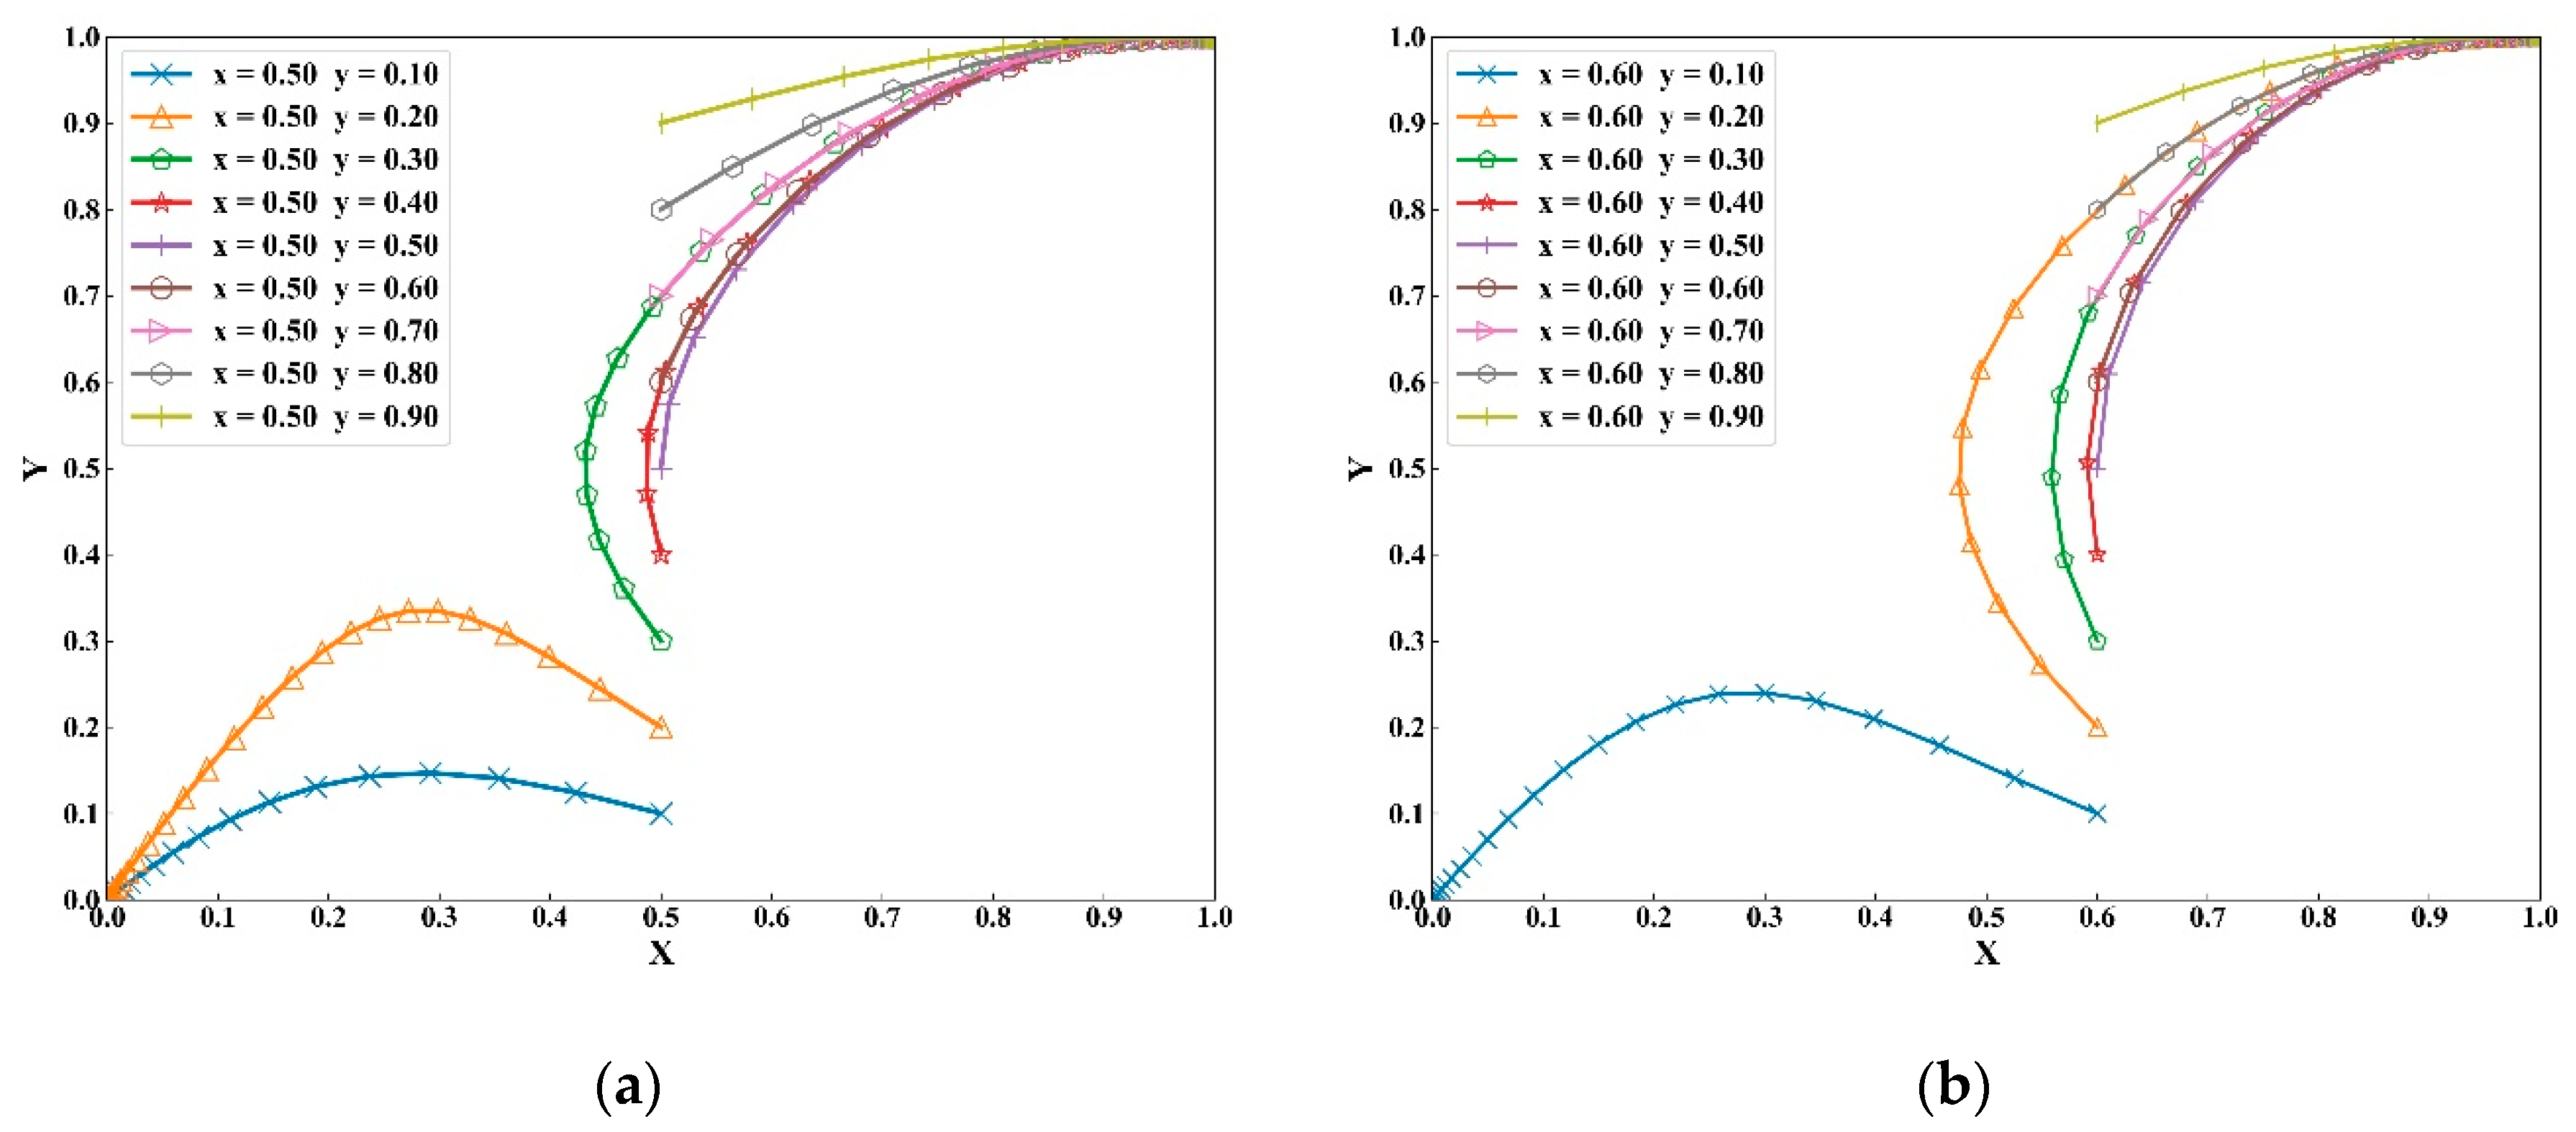
6.1. The Impact of Initial Strategy Selection on Evolutionary Results

Based on the analysis of the scenario 8, the evolution of the different initial strategies may lead to different results. Therefore, this section observes the change of system evolutionary stable strategy by changing the probability of strategy selection, and with other parameters remain unchanged. Parameters are set according to the constraint conditions of scenario 8, as shown in Table 7.
In order to further illustrate their impacts on replication dynamic systems, we divide the initial probabilities into two groups. Initial probabilities indicate that the government’s and investors’ initial willingness [49], e.g., the high value of x 0 indicates that investors’ initial opportunism and willingness are high, and cooperation willingness are low.
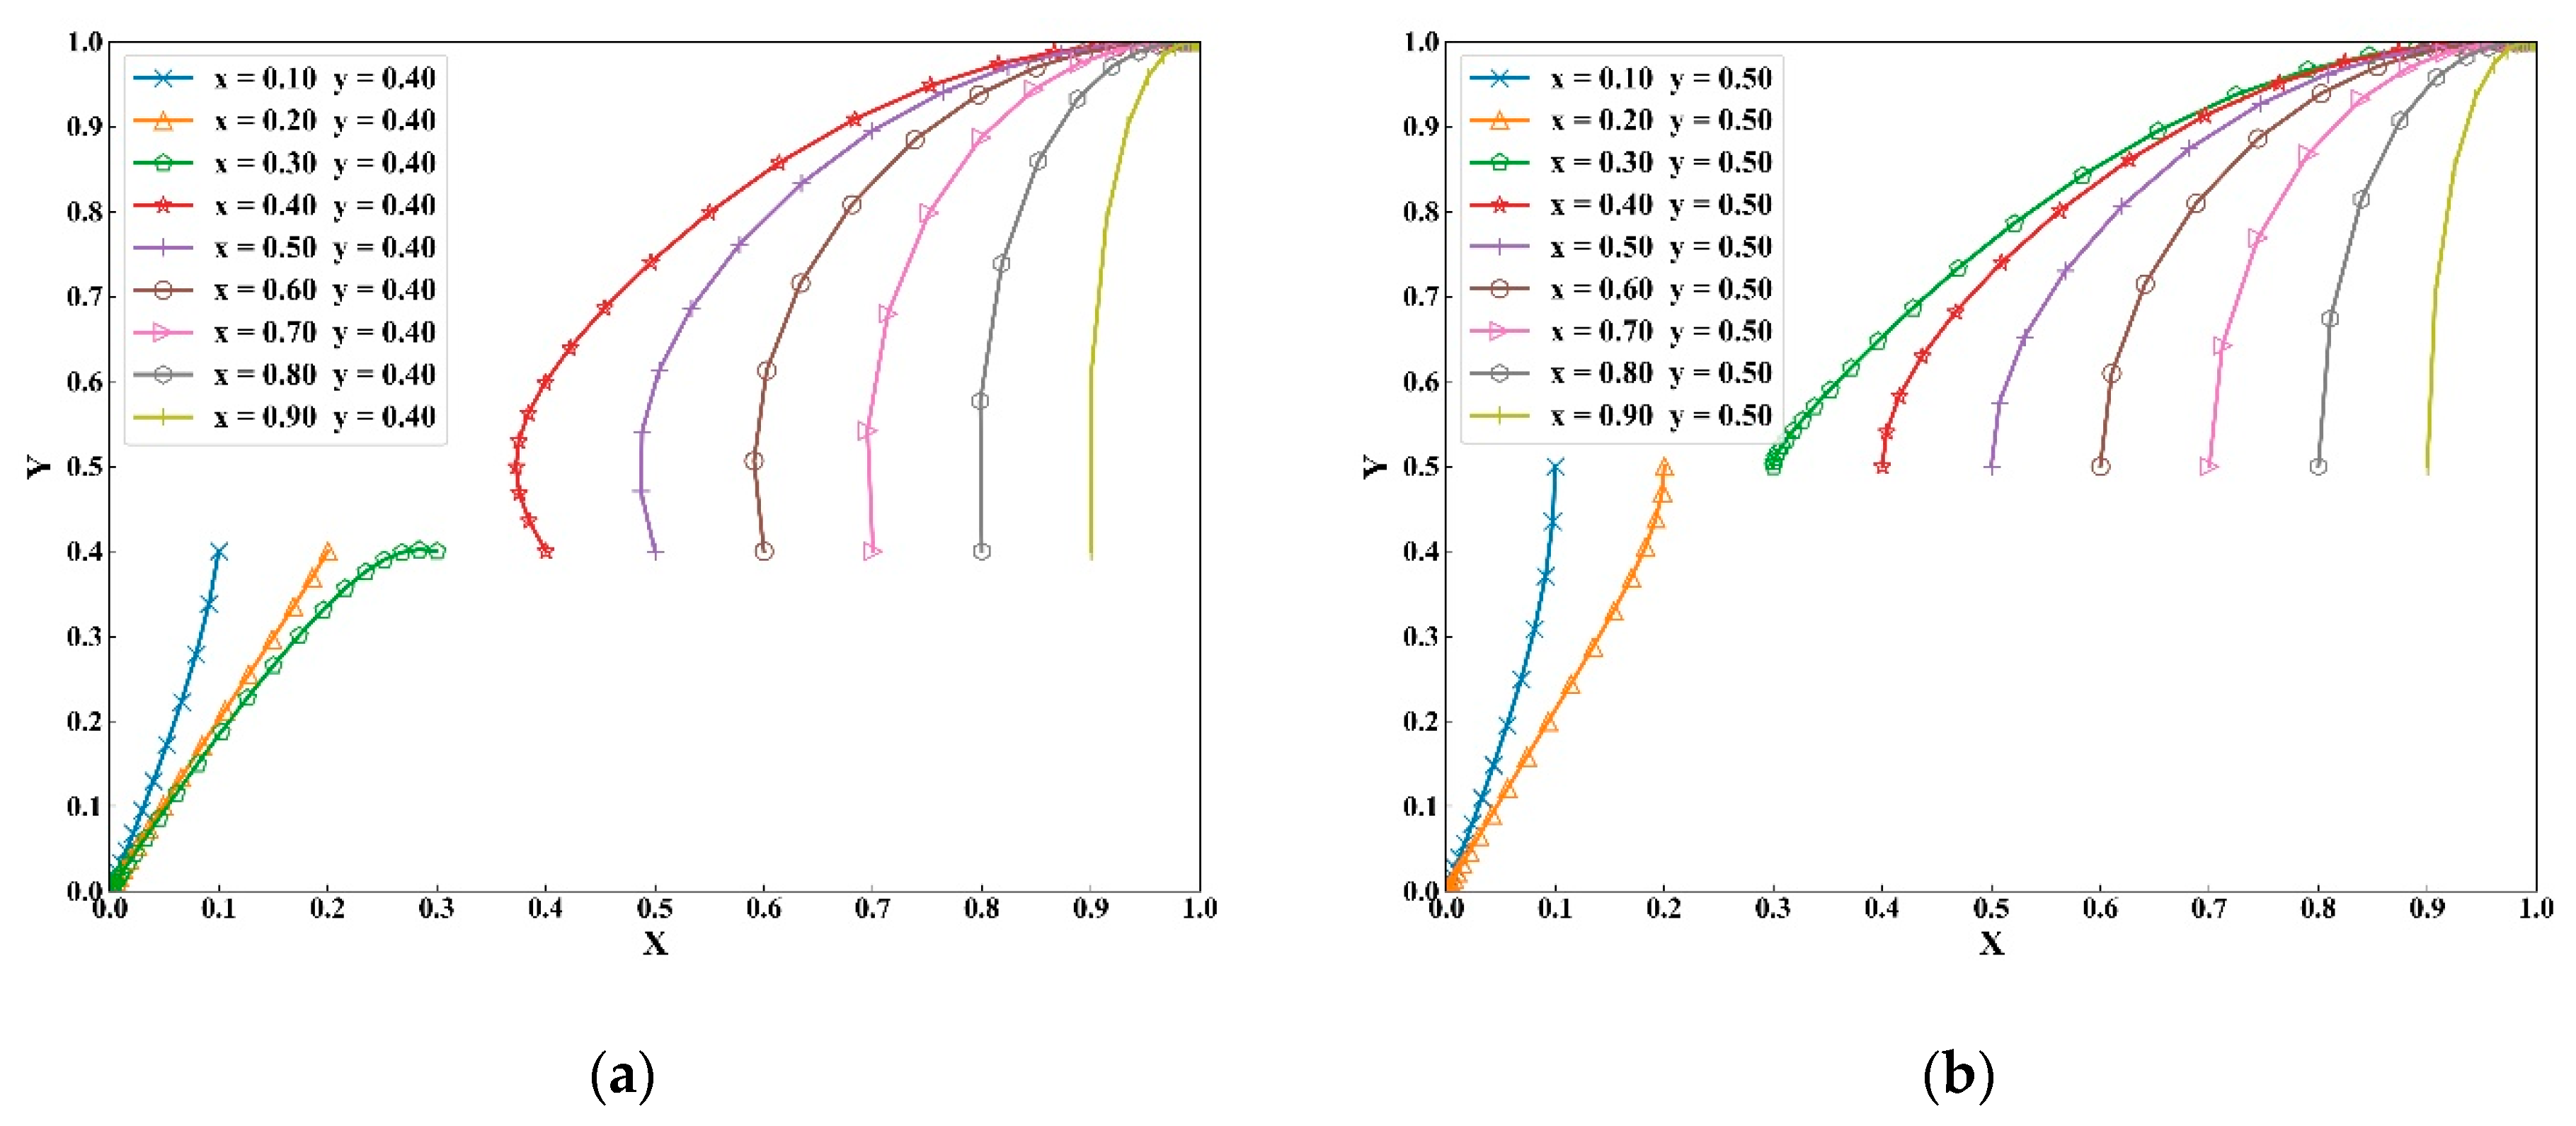
  • As shown in Figure 4a, when other parameters remain unchanged, x 0 = 0.5 remains unchanged, and y 0 increases successively from 0.1 to 0.9. From y 0 = 0.3 , the ESS of the system changes from (0,0) to (1,1). Similarly, when x 0 = 0.6 is fixed in Figure 4b, the value of y 0 is successively increased from 0.1 to 0.9. When y 0 = 0.2 , the ESS changes to (1,1). Moreover, with the increase of y 0 , the evolution speed of the system is also accelerating. We can find that when the initial probability of the government ( y 0 ) is high, it will stabilize at state 1; on the contrary, when the initial probability of it is low, it will stabilize at state 0. From Figure 4a,b, when the initial probability of investors ( x 0 ) increases, the system will stabilize at (1,1) more quickly.
  • As shown in Figure 5a, when y 0 = 0.4 is fixed, x 0 increases from 0.1 to 0.9 successively. When x 0 = 0.4 , the evolutionary stable strategy of the system changes from (0,0) to (1,1). When y 0 = 0.5 is fixed in Figure 5b, x 0 increases from 0.1 to 0.9, and when x 0 = 0.3 , the ESS of the system is changed to (1,1). With the increase of x 0 , the evolution speed of the system is also accelerating. Similarly, it is clear that when the initial probability of investors ( x 0 ) is high, it will stabilize at state 1; on the contrary, when the initial probability of it is low, it will stabilize at state 0. Comparing Figure 5a,b, when the initial probability of the government ( y 0 ) increases, the system will stabilize at (1,1) more quickly.
From the above analysis, we can find that the initial probabilities will affect the overall replicated dynamic system and the final state in the mixed strategy Nash equilibrium of scenario 8. In summary, when the initial probabilities of the government and investors are high, they will stabilize at state 1; on the contrary, when the initial probabilities of them are low, they will stabilize at state 0. Moreover, both the increase in the probability of government’s maintaining projects and the increase in the probability of investors’ non-opportunism will accelerate the evolution of the system to the stable strategy (1,1), which shows that the behavioral decision-making on renegotiation between the government and investors is mutually influenced.

6.2. The Impact of Parameters on Evolutionary Results

6.2.1. The Impact of Parameters on Investors’ Strategy Selection

In practice, the termination of PPP project is usually defined as the failure of the project, and the government needs to pay for the failure of the project. As a result, the government is more inclined to maintain the project with investors without obvious fault in the renegotiation. Therefore, when the constraint condition α U + S 2 Δ S < θ N < α U + S 1 is satisfied, this section mainly analyzes the influence of changes in essential parameters on investors’ strategy selection. The starting point was assigned the value of (0.5, 0.5).
With other parameters being constant, we discuss the impact of parameter Δ R = 4 ,   5 ,   6 ,   7 ,   8 , respectively, on the evolutionary results of the investors’ strategy. As shown in Figure 6, with the increase of Δ R , the trend of investors’ non-opportunism is slowing down. In particular, when Δ R = 7 , the evolutionary trend in the figure was observed. For a short time after the start, the value of x decreases and is below the initial value of 0.5. However, as the system evolution process continues, investors may be influenced by other factors, but still choose not to take opportunistic behaviors. Besides, when Δ R is high enough, such as Δ R = 8 , investors’ ultimate evolutionary strategy is opportunism.
According to the analysis of parameter Δ R , it can be found that the higher Δ R is, the higher the probability of investors taking opportunism will be. If the government lacks the mechanism of screening and punishing investors, the probability of investors obtaining high speculative net benefits becomes greater [31]. If measures to deal with opportunism are increased during the formulation of contract terms in the initial stage of the project or the adjustment of contract terms in the renegotiation, corresponding opportunism cost of investors will be increased. In the case of the low value of Δ R , investors will spontaneously, reasonably, and effectively participate in the project.
The impact of unrecovered cost under opportunism ( K 2 ) on the evolutionary results is discussed as follows. In the case of non-opportunism, the unrecovered cost K 1 is equal to 10, the value of K 2 is chosen to fluctuate around 10. As shown in Figure 7, with the increase of K 2 , investors’ strategic choice gradually changes from x = 0 to x = 1 , that is, from opportunism to non-opportunism, and the evolution speed gradually increases.
As the private information of investors, the unrecovered cost cannot be fully grasped by the government. Based on the analysis of parameters, the following conclusions can be drawn. As K 2 increases, the probability of investors taking opportunism decreases. K 2 , which represents the unrecovered cost of investors in the opportunistic situation, may be influenced by the efficiency level of investors themselves. As different types of investors have different financial information, if the income of the project is defined, the higher the cost coefficient is, the smaller the net benefit will be. Going back to the bidding stage of the project, if the investors win the bid at a low price in order to get the concession successfully, it means that they have given up part of the income and increased the cost of participation in the project [24]. Therefore, the influence factors can be summed up in the type of investors. The government should put forward higher requirements about the quality of the project, so as to reduce the probability of inappropriate investors to participate in projects. Even if such investors take opportunism behavior seeking extra income, it is hard to achieve the desired income level so that they will rely on renegotiations for subsidies.
The impact of future benefits of the project ( R 1 ) on the evolutionary results is discussed. As shown in Figure 8, with the increase of R 1 , investors’ strategy evolves from x = 0 to x = 1 , that is, from opportunism to non-opportunism, and the larger the value of R1 is, the faster the evolution speed of reaching x = 1.
R 1 represents the future benefits of the project created by maintaining the project in the case of non-opportunism. Therefore, the larger the value of R 1 is, the less the probability of investors adopting opportunism is. If the government and investors maintain a good cooperative relationship in PPP projects, for example, the government implements a reasonable incentive mechanism [46], and investors actively participate in the project, the PPP projects could create additional cooperative benefits, achieve a win-win effect, and the system will evolve into the optimal strategy (non-opportunism, maintain the project).

6.2.2. The Impact of Parameters on the Government’s Strategy Selection

According to the above discussion, the government’s strategy selection is based on the income of buyback and subsidy. Therefore, the fixed boundary condition K 2 K 1 < Δ R < R 1 R 2 remains unchanged, that is, the return of reasonable operation project is the highest for investors. On this basis, the impact of changes in essential parameters on the government’s strategy selection is analyzed.
The influence of S 1 on the evolution results is discussed with other parameters fixed. As shown in Figure 9, as S 1 continues to grow, the government’s strategic choice changes from y = 0 to y = 1 . As S 1 represents the future social benefits of the project under investors’ non-opportunism, corresponding to the analysis of R 1 , if both parties participate in the project reasonably and effectively, more excellent cooperation benefits will be created, and maintaining the project is the best choice for both the government and investors.
Subsequently, the influence of subsidy and buyback costs on the government’s strategic selection are discussed. We let both cost coefficients be 1.3 in this section ( α = 1.3 , θ = 1.3 ), and the subsidy U and repurchase amount N directly represent the two types of costs.
First, let N = 10 remain unchanged, and the value of U fluctuates around 10. As can be seen from Figure 10, although the evolution result of the government’s strategy keeps y = 1 unchanged, the evolution speed slows down gradually as U increases. It can be concluded that considering the future benefits of the project, the government is more inclined to save the project, but with the increase of subsidy, the evolutionary rate of choosing to maintain the project is slowed.
Accordingly, the influence of parameter N is analyzed, as shown in Figure 11. Fixed U = 10 remains unchanged, and with the increase of N , the rate of evolution toward y = 1 is increasing. The evolutionary trend of Figure 10 and Figure 11 is completely opposite, that is, as the cost of buyback increases, the evolutionary rate of choosing to maintain the project increases gradually.
The government’s risk and loss estimates for subsequent renegotiations are expressed in Δ S . When Δ S continues to grow from 0, the evolution trend is shown in Figure 12, and the evolution curves almost coincide. Similar to the evolution curves of parameter U , the evolution speed to y = 1 gradually decreases with the increase of Δ S . Δ S represents the tolerance of the government to the opportunism of investors, although the change of Δ S has little influence on the overall evolution trend from the figure, frequent opportunistic renegotiation will make Δ S continuously increase. Finally, the possibility of the government to maintain the project is decreasing.
For the government, if the future development of the project is optimistic, then generous subsidies and control of opportunism will maximize the return of all parties in the PPP projects. However, if the return of saving the project is not significant, or even less than the return of buyback, then the unconditional subsidy will harm the sustainable development and violate the efficiency goal advocated by PPP mode. Therefore, the rational decision-making of the government in the renegotiation is the key to the success of PPP projects.

7. Discussion

In this paper, we develop the renegotiation strategy selection model under asymmetric information. In addition to analyzing the results of evolutionary game, we also verified the evolutionary results through detailed numerical simulations. Through the simulation of boundary conditions and important parameters, we successfully simulated various scenarios of renegotiation to find the optimal strategy in different scenarios, and accurately captured the interactive behavior of strategies selection between the government and investors. Based on the characteristics of evolutionary game, we considered bounded rationality and asymmetric information, and the renegotiation situation in various scenarios would be closer to the reality.
  • According to Section 5, we could find that the evolutionary results was intuitively divided into two categories: one reaches a pure Nash equilibrium with one equilibrium point, and the other reaches a mixed Nash equilibrium with two equilibrium points. Firstly, the strategy selection of the government is based on θ N , α U + S 2 Δ S and α U + S 1 , and the strategy selection of investors is based on Δ R , R 1 R 2 , and K 2 K 1 . Then, when the system reaches the evolutionary stable strategy E4(1,1), maintaining the project with original investors is the best result for the government, while investors will not take opportunistic behaviors due to the low speculative net income; when the system stabilizes at E1(0,0), owing to the opportunistic behavior of investors, the government loses confidence in the project, and chooses to terminate the project; when the system stabilizes at E3(0,1) in scenario 3, it is shown that the government has tolerated opportunistic behavior of investors because of the high cost of buyback; when the evolutionary stable strategy is E2(1,0) in scenario 4, we could speculate that the project has fallen into significant difficulties, and it is unworthy to continue maintaining the project.
  • In Section 6.1, based on the numerical simulation of the evolution path, it reveals that the initial probabilities will affect the final stable state directly in the scenario 8. Due to the different initial strategic preferences of the government and investors in the renegotiation, it is more helpful to access the real results by simulating randomly. Under the constraint condition K 2 K 1 < Δ R < R 1 R 2 and α U + S 2 Δ S < θ N < α U + S 1 , when the initial probabilities of the government and investors are high, they will stabilize at state 1, which is the point E4(1,1). When the initial probabilities of the government and investors are low, they will stabilize at state 0, which is the point E1(0,0). It means that when other parameters remain unchanged, the preference of the strategy selection at the beginning of the negotiation will affect the final evolution results, besides, the behavioral decision-making between the government and investors is mutually influenced.
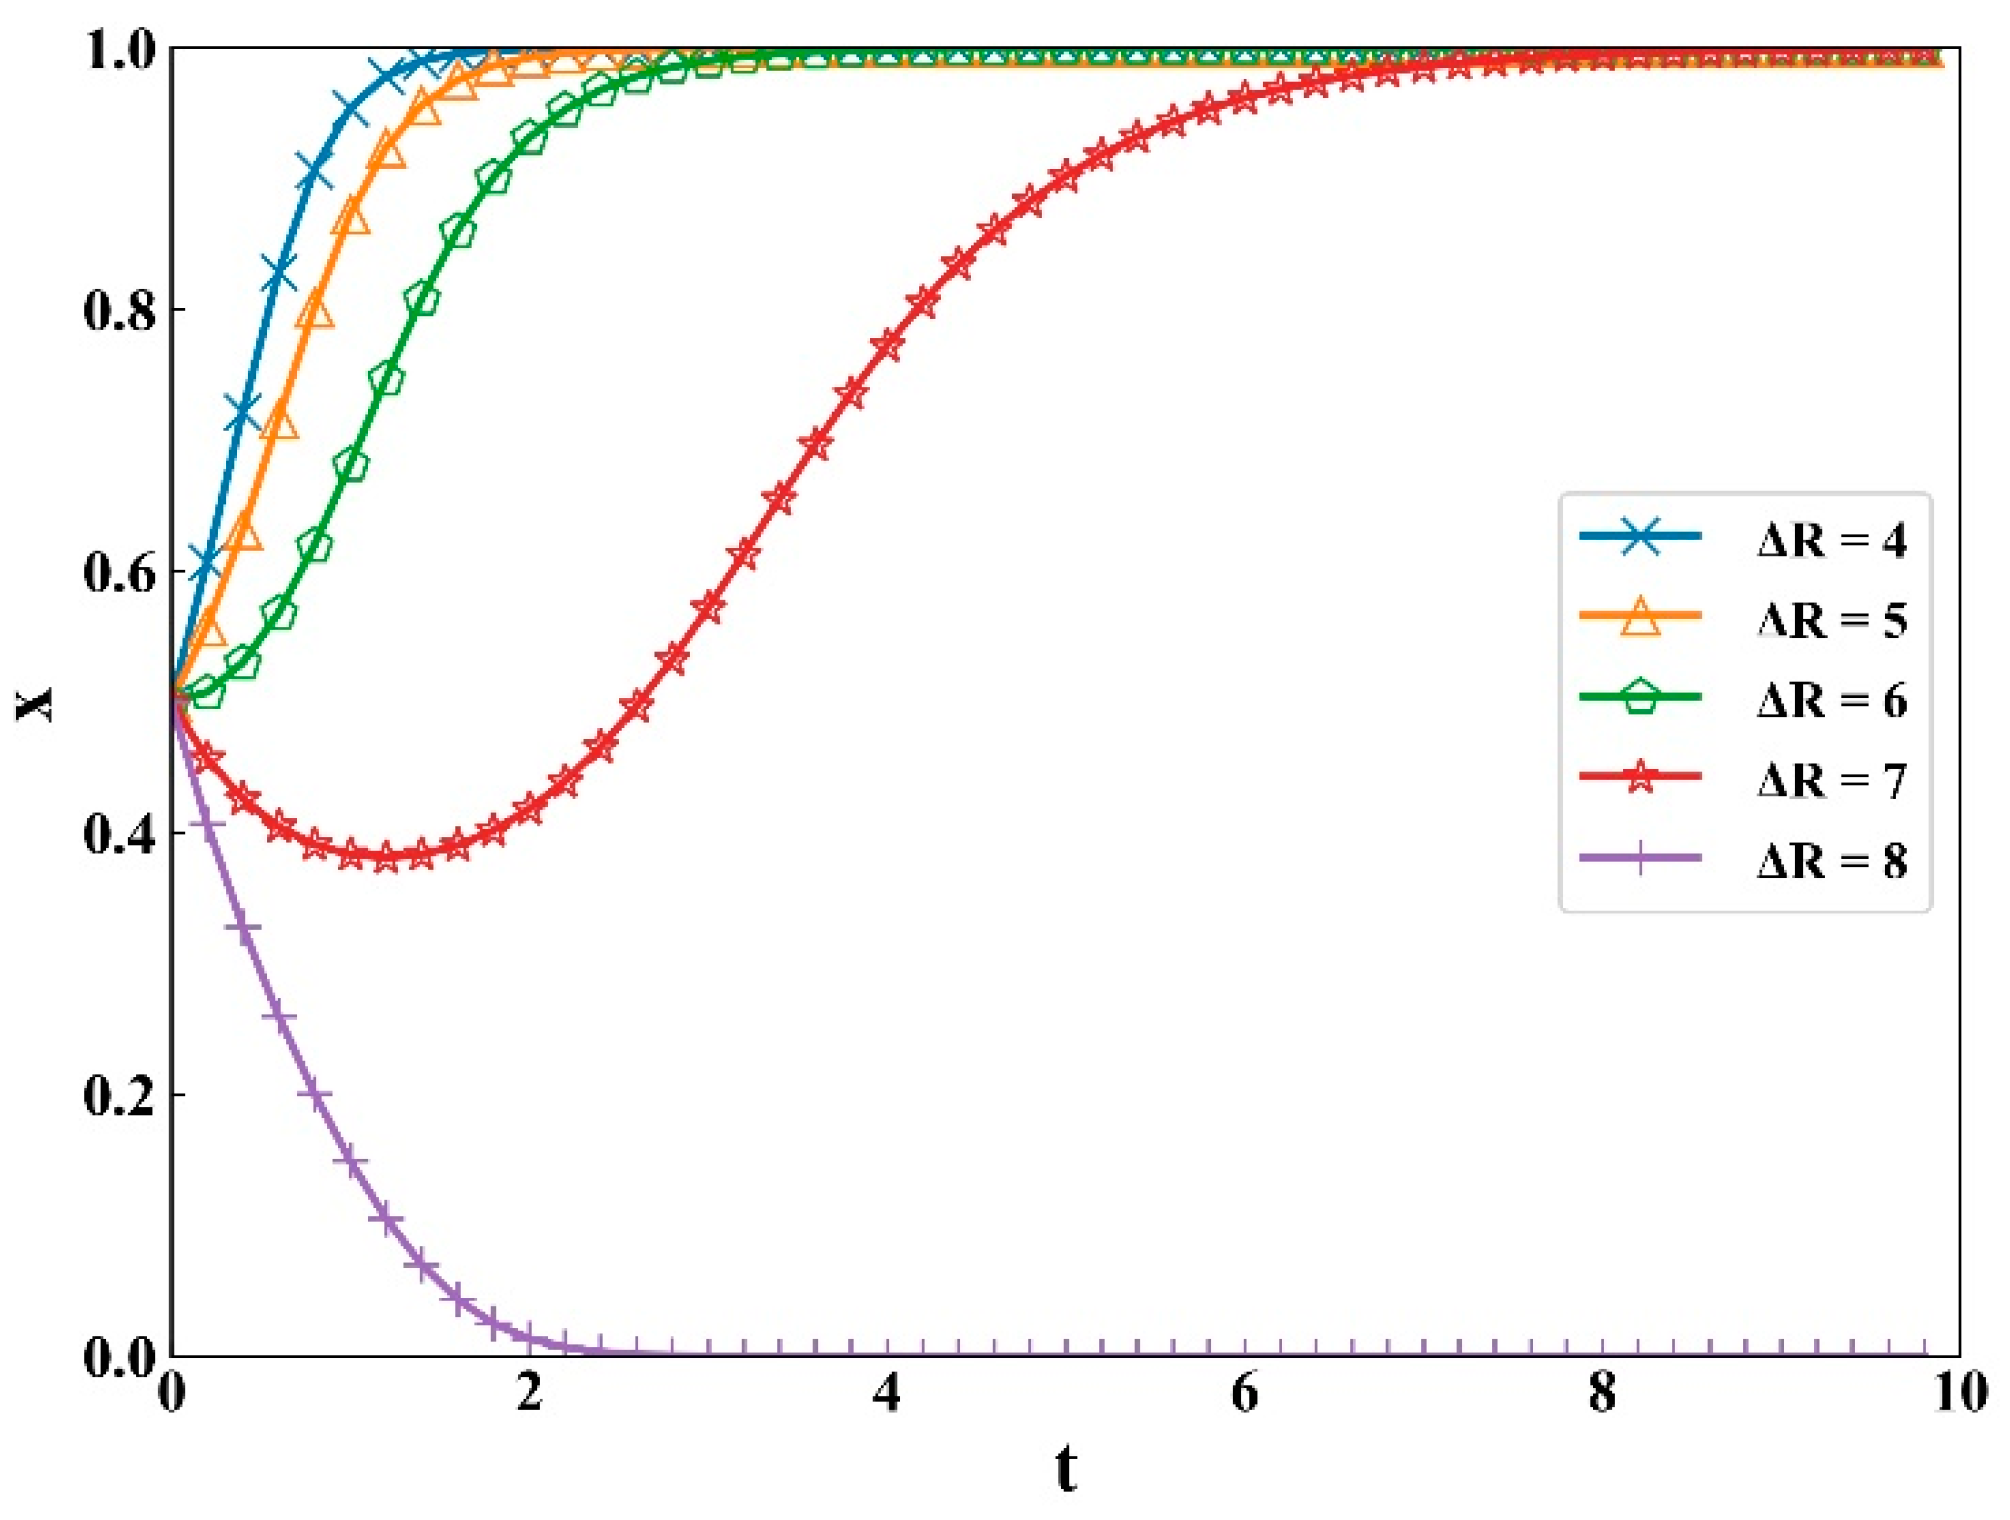
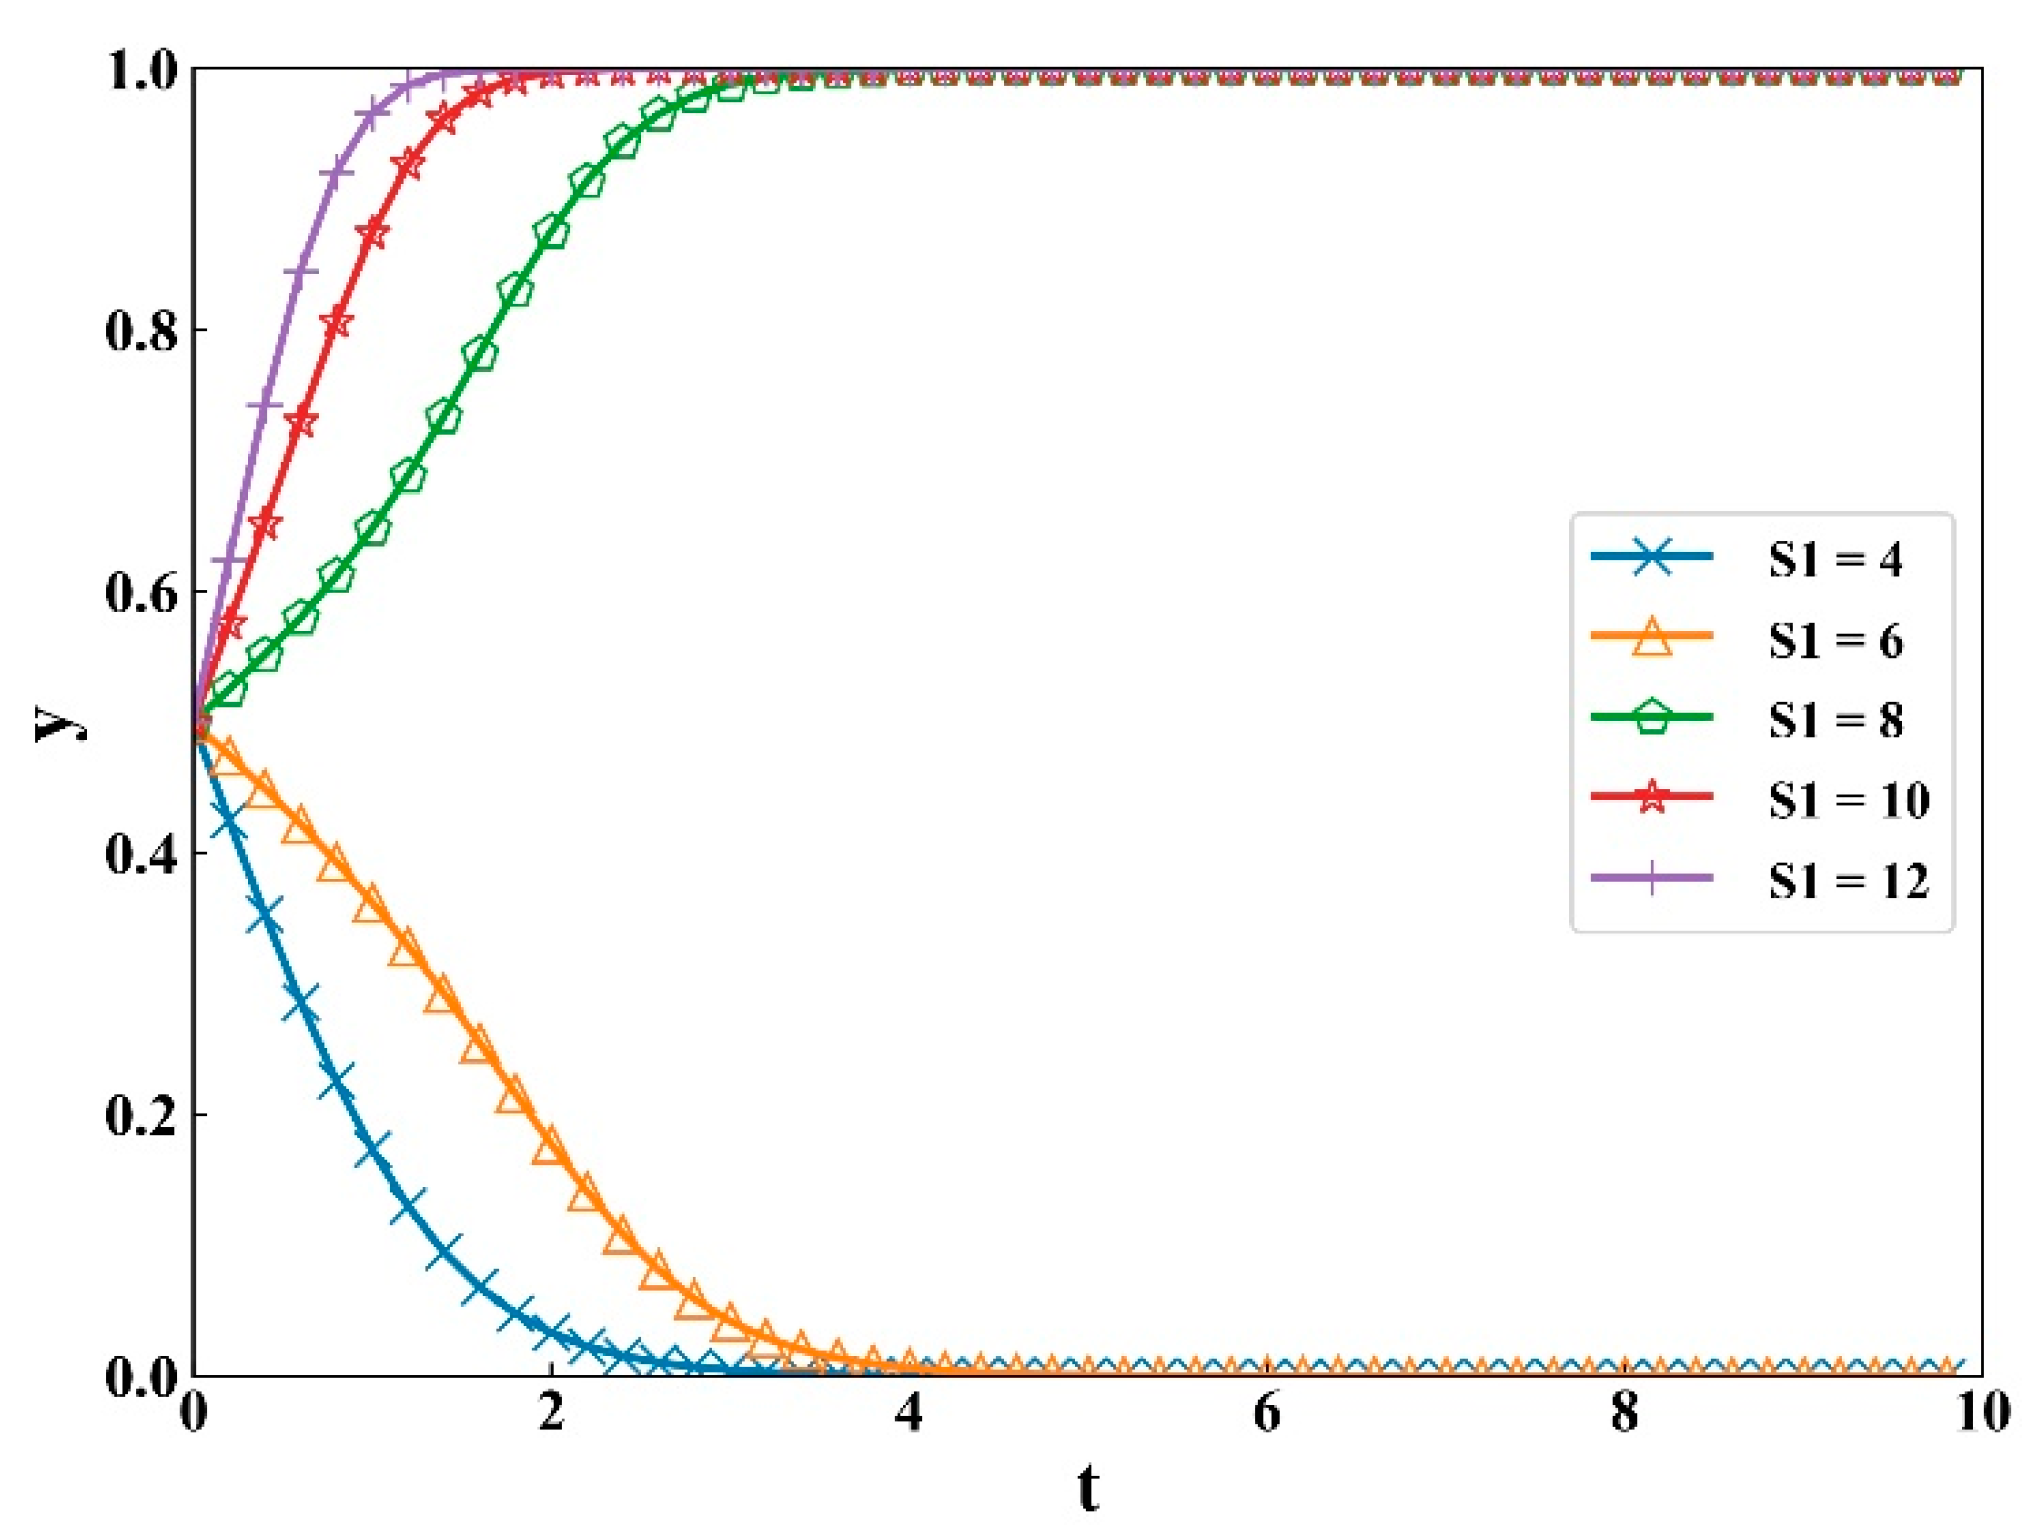
  • In Section 6.2.1, we explored the influences of significant parameters on investors’ strategy selection, where some significant findings could be acquired according to the simulation results as shown in Figure 6, Figure 7 and Figure 8. Firstly, it can be found that the higher speculative net benefits are, the higher the probability of investors taking opportunism will be. In this regard, the government would lack the mechanism of screening and punishing investors, and driven by high returns, investors would take opportunistic behaviors. Secondly, as K 2 increases, the probability of investors taking opportunism decreases. If the speculative costs are high, the cost unrecovered of investors is high, and the probability of opportunism would be reduced. For these error investors, it is hard to achieve the desired income so that they would rely on subsidies. Lastly, if the government and investors maintain a good cooperative relationship in PPP projects, the high returns generated by the project would prevent investors from taking opportunistic behavior.
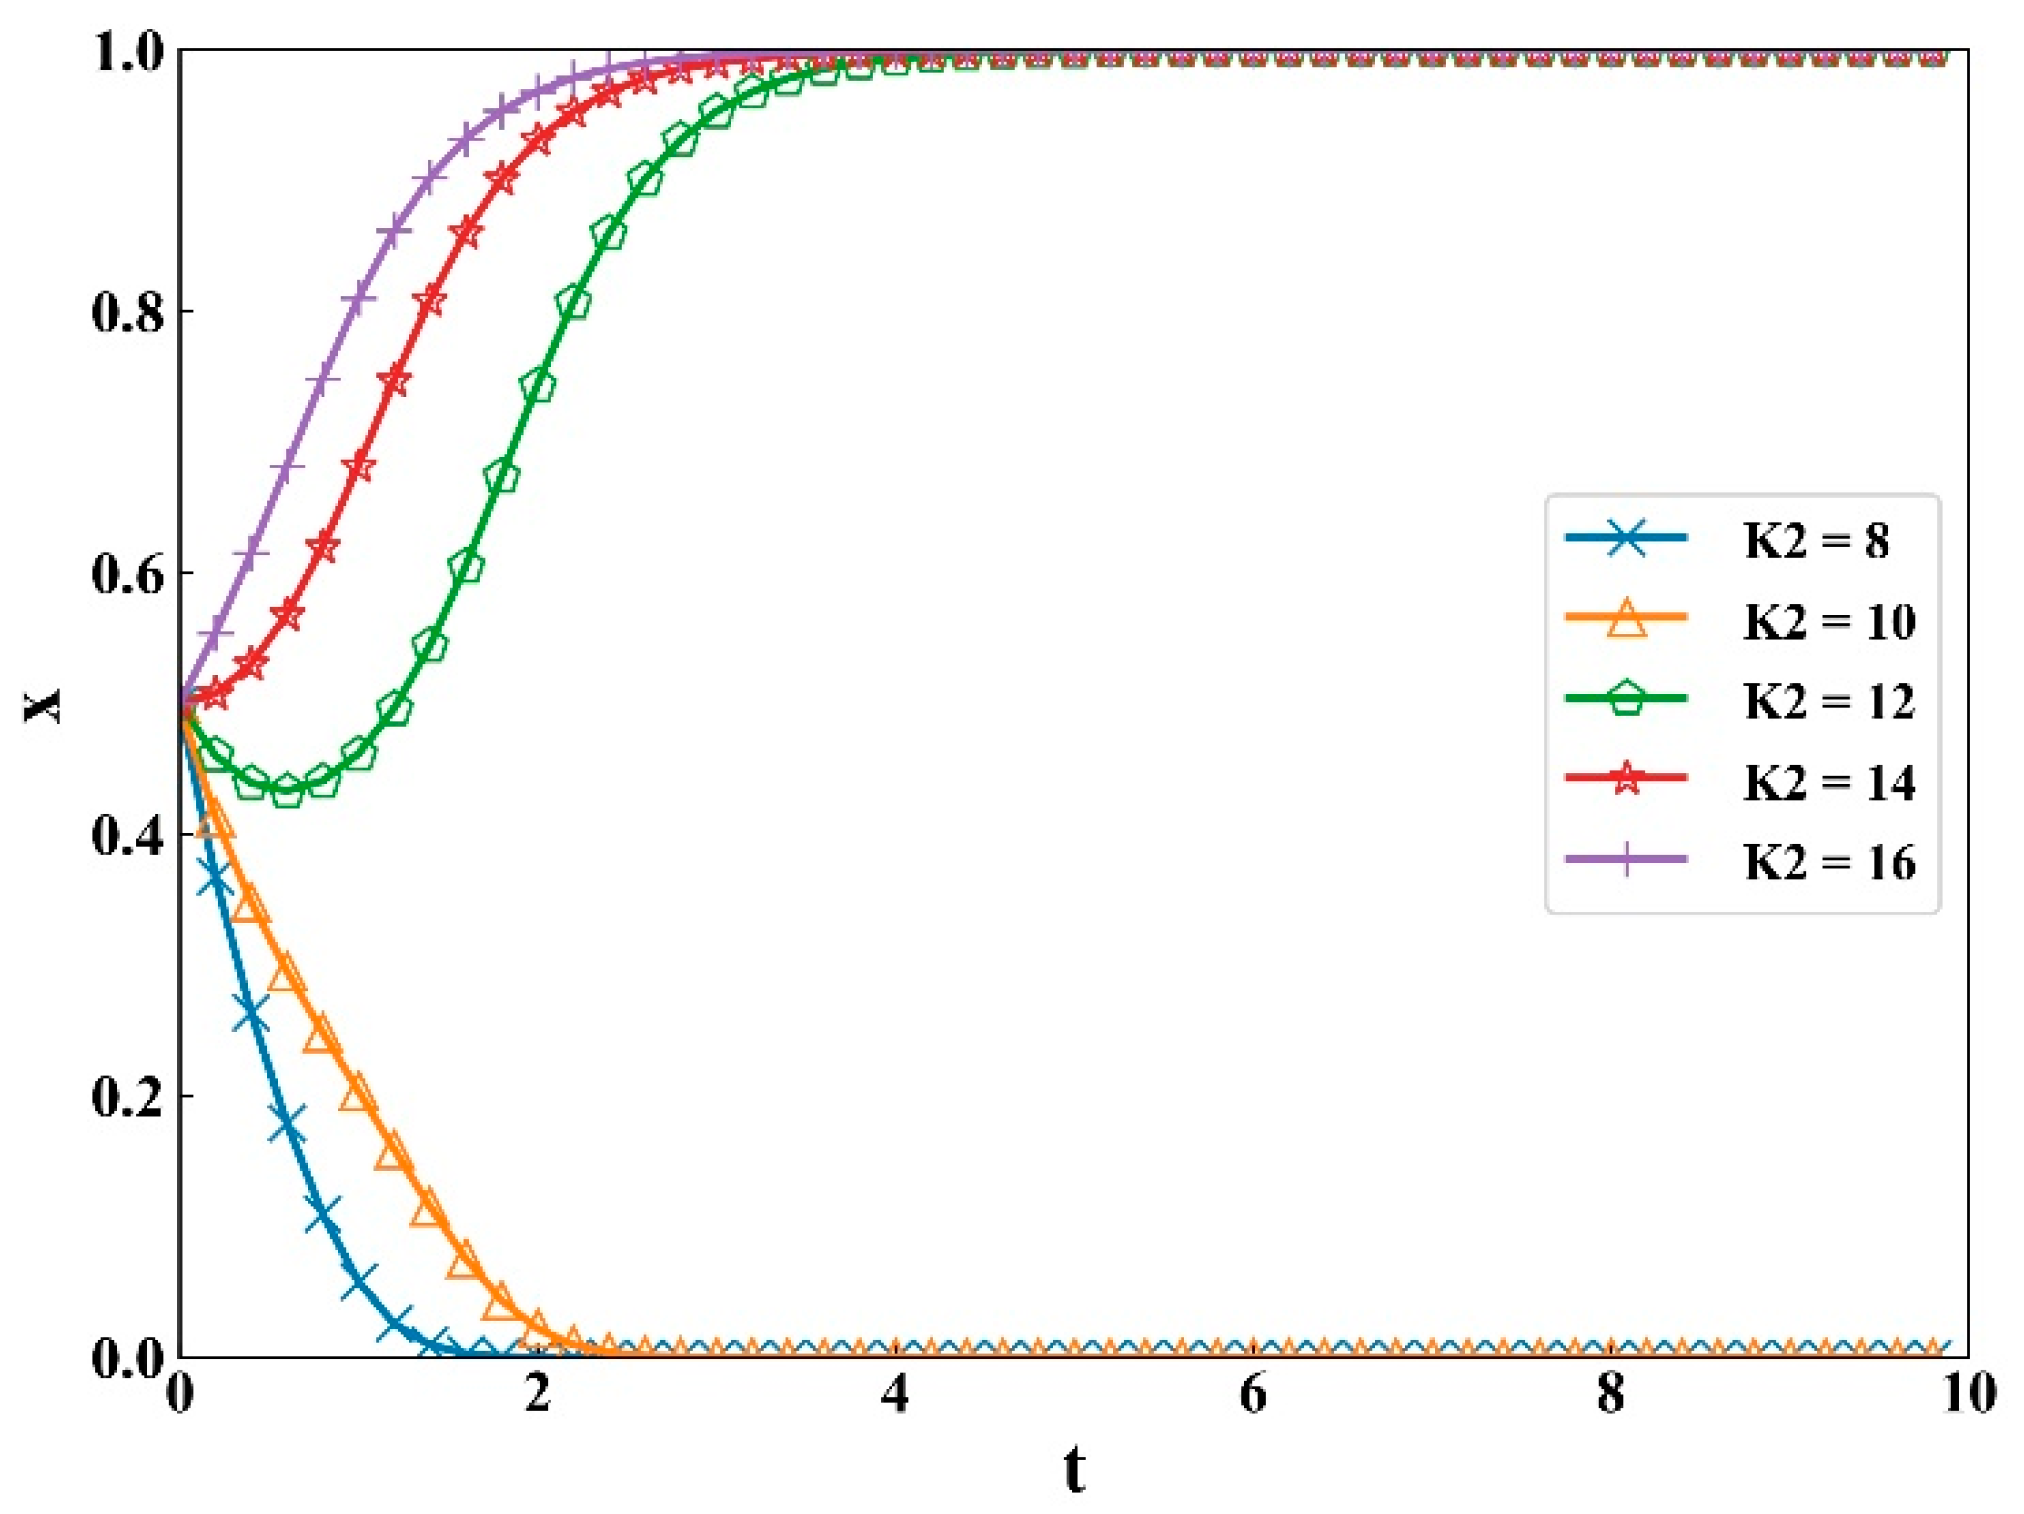
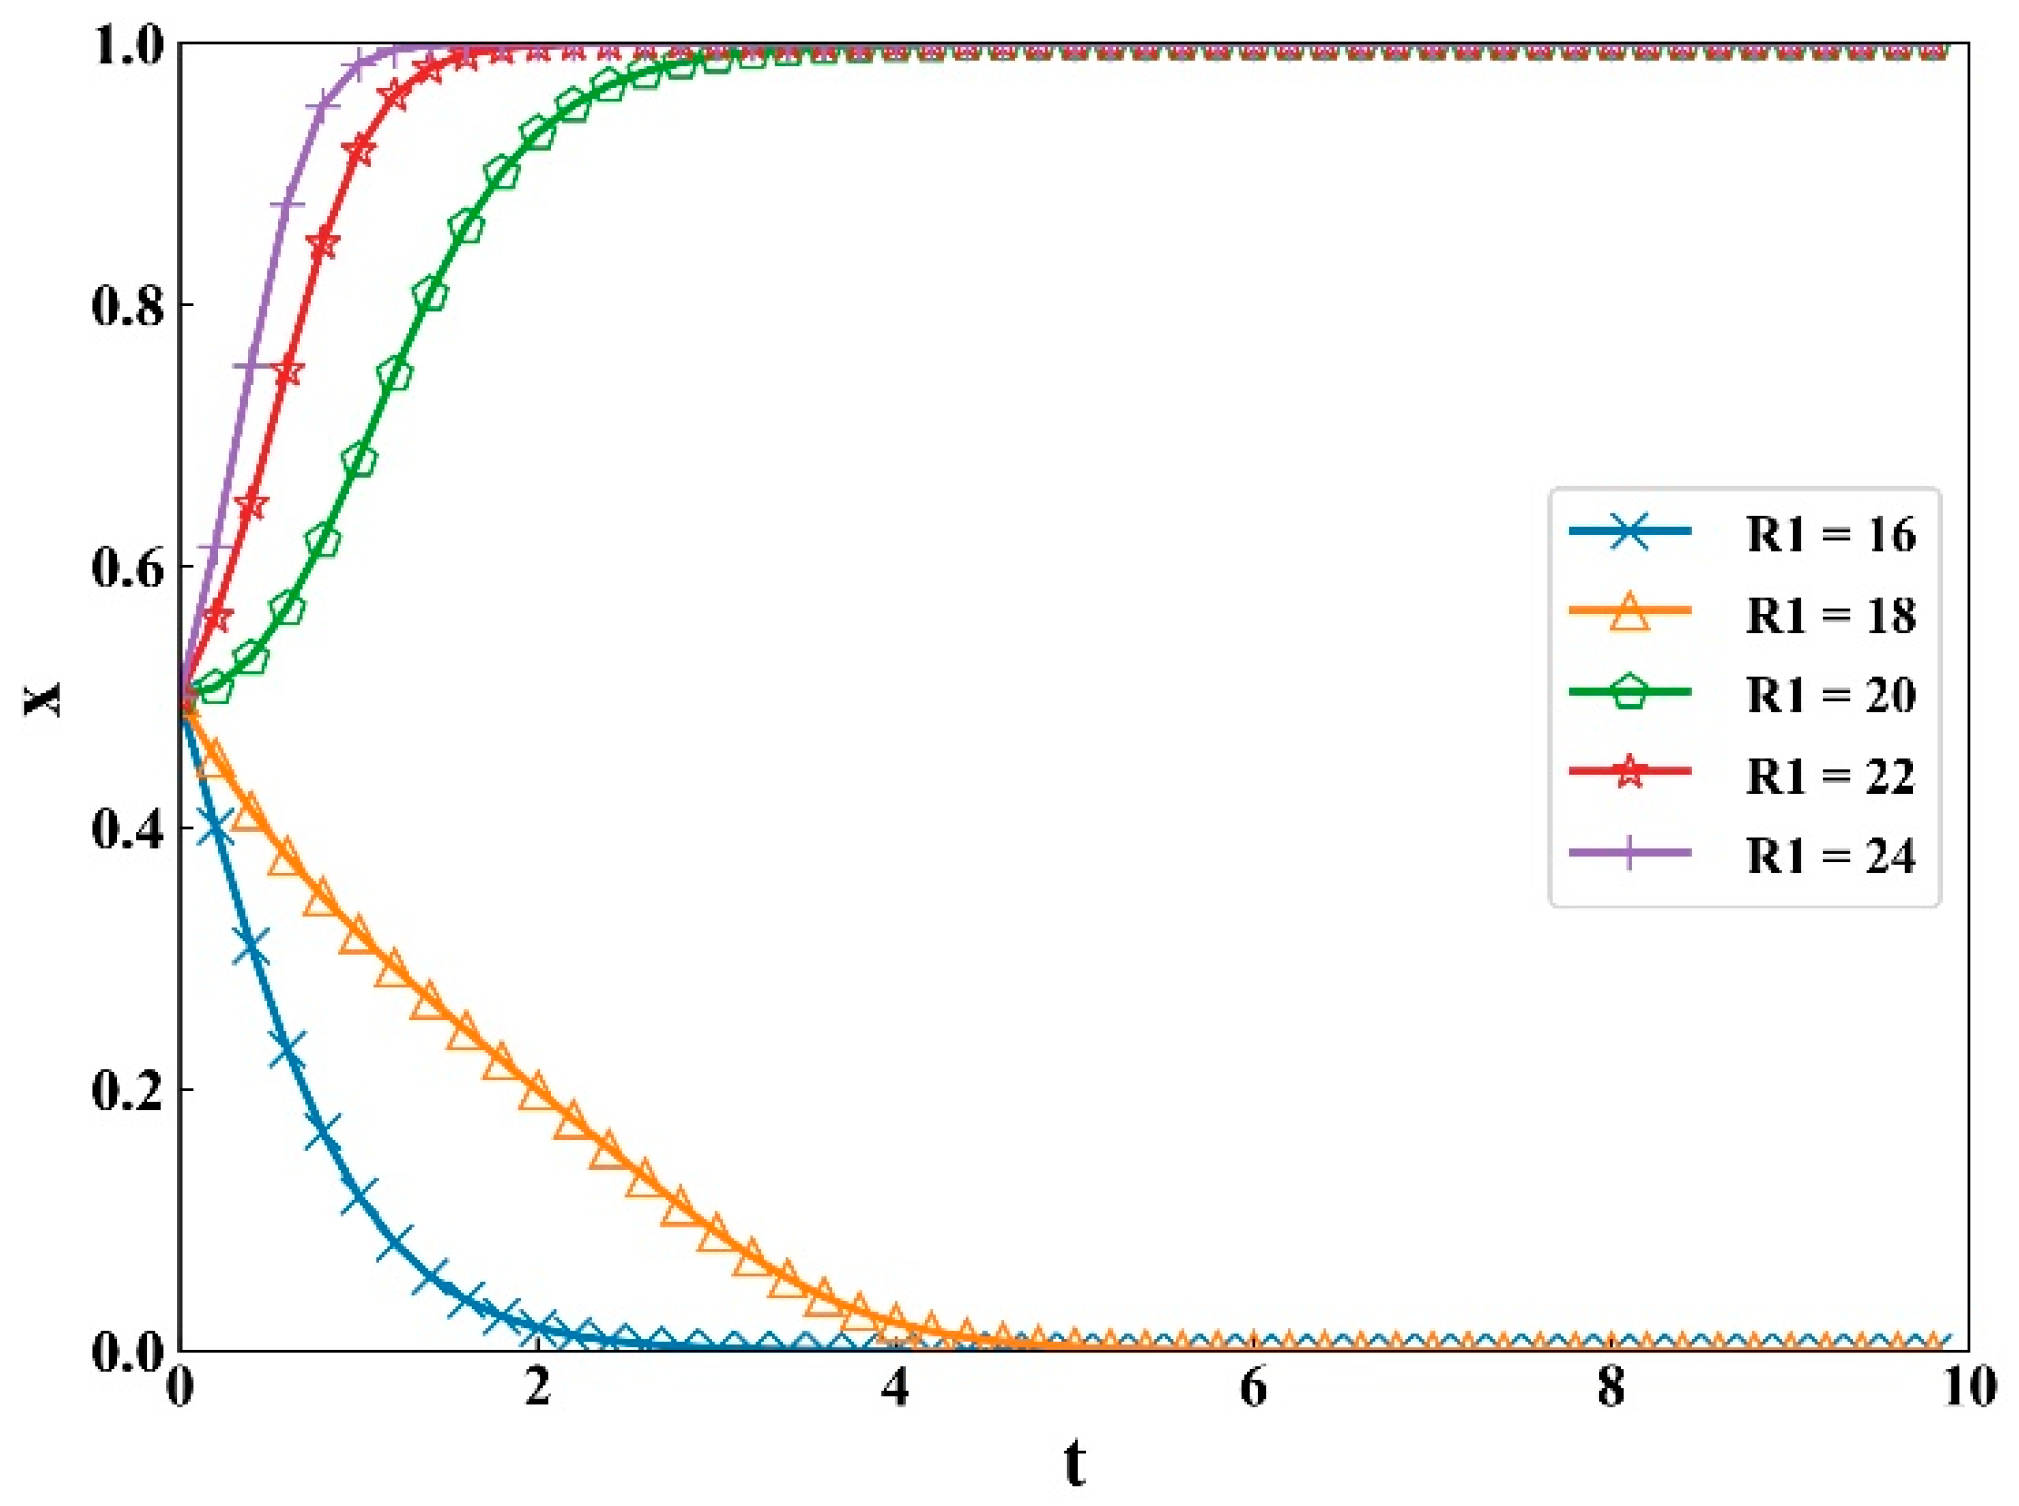
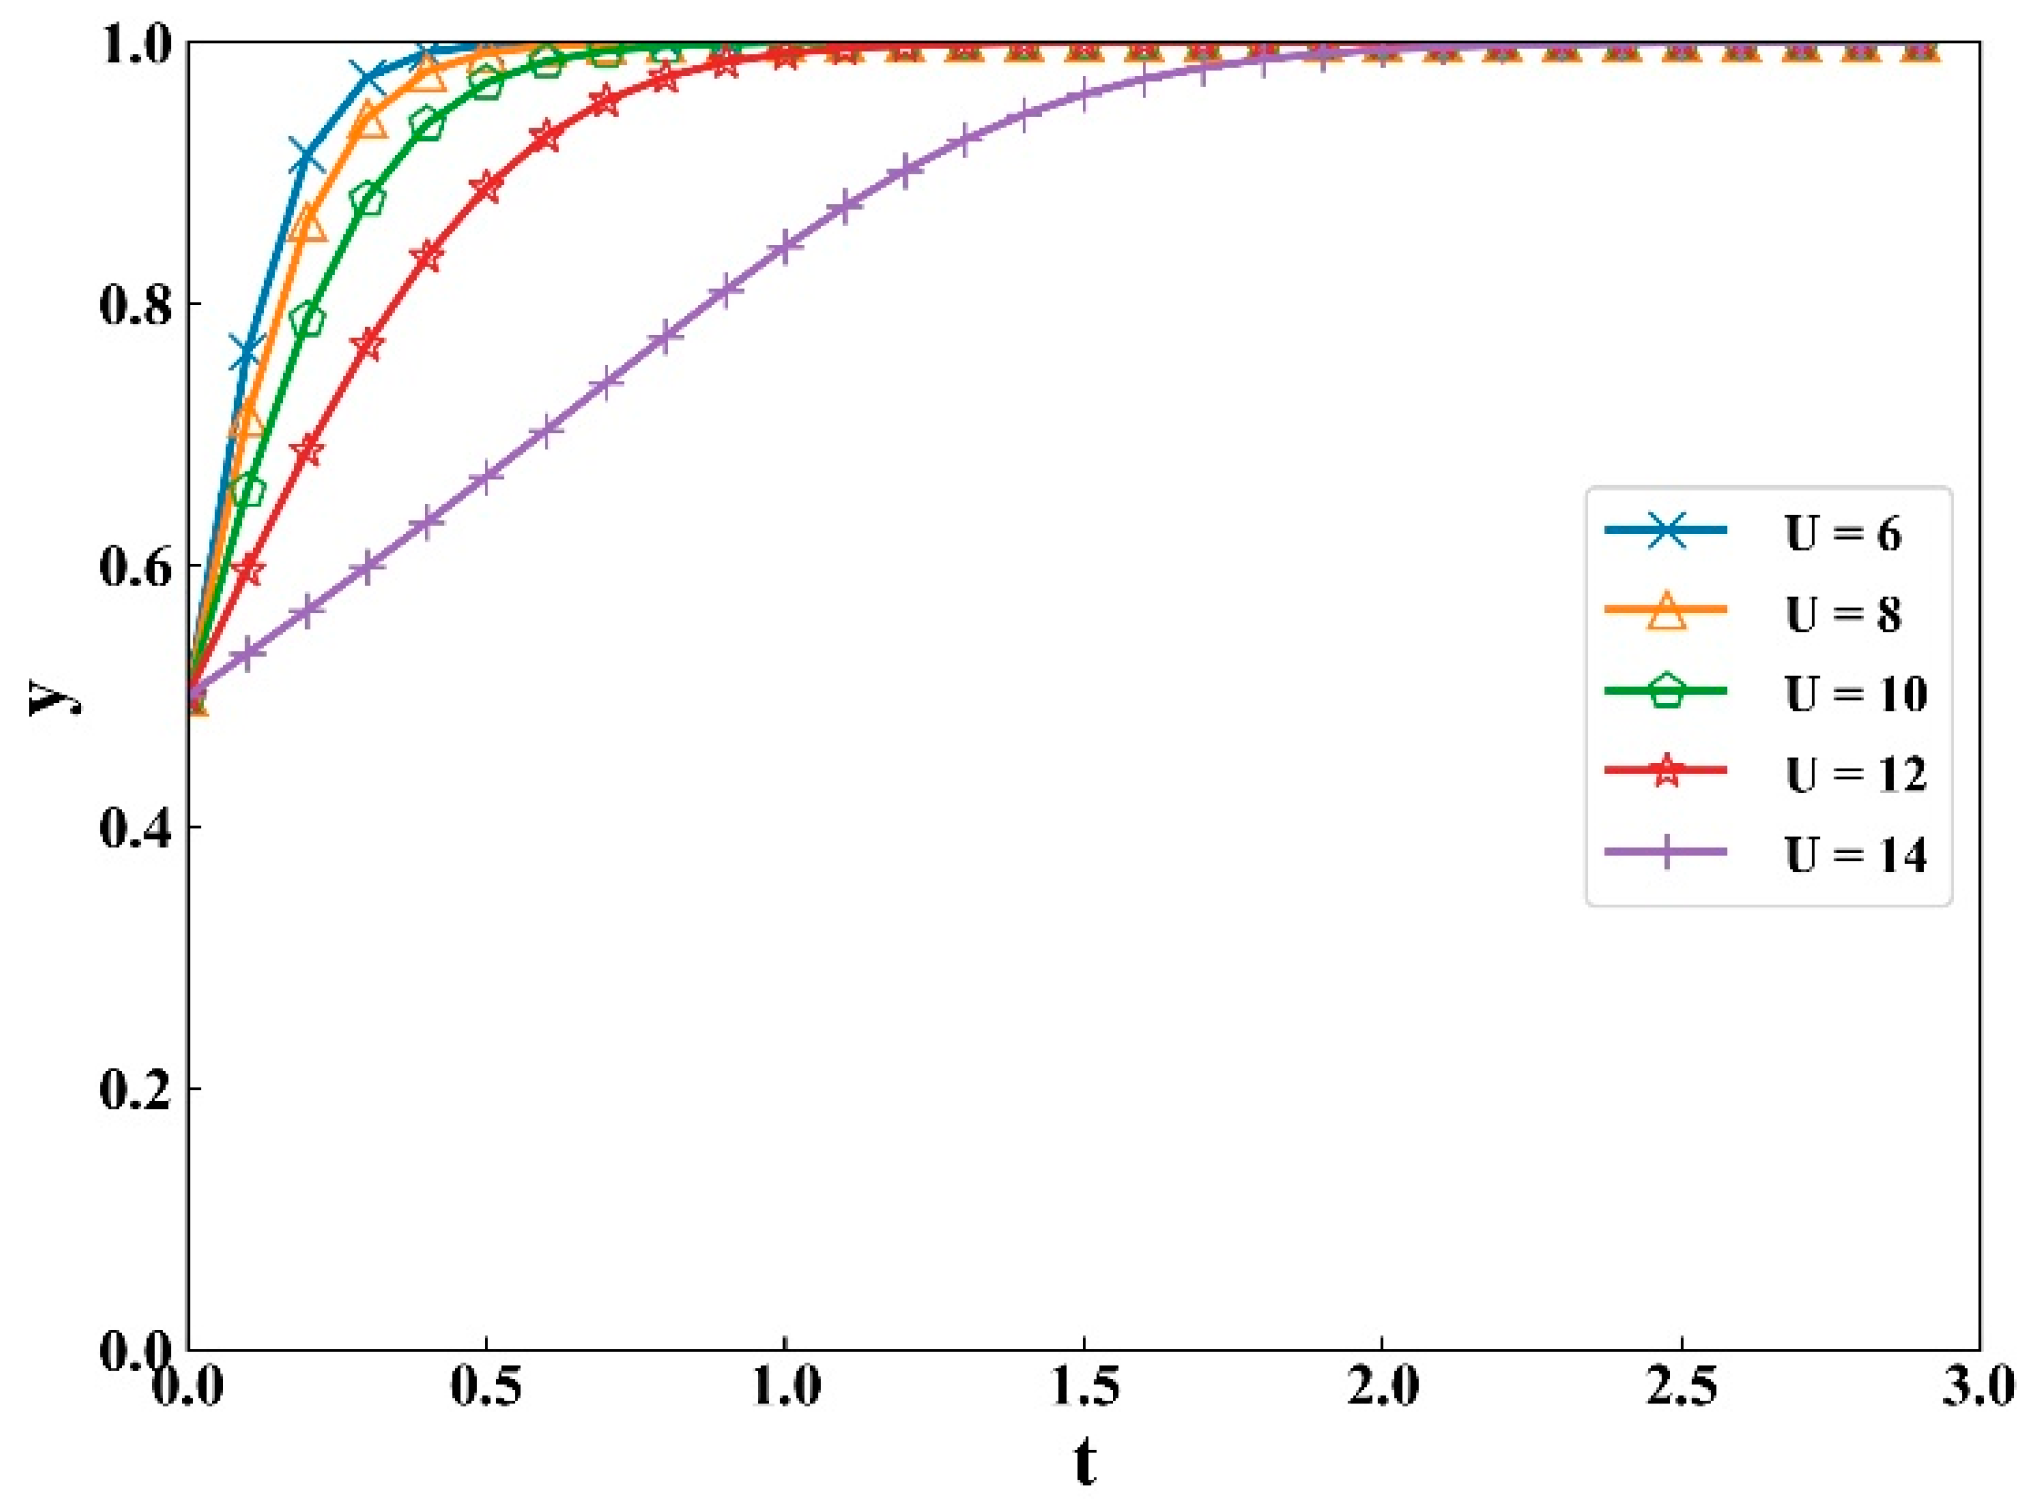
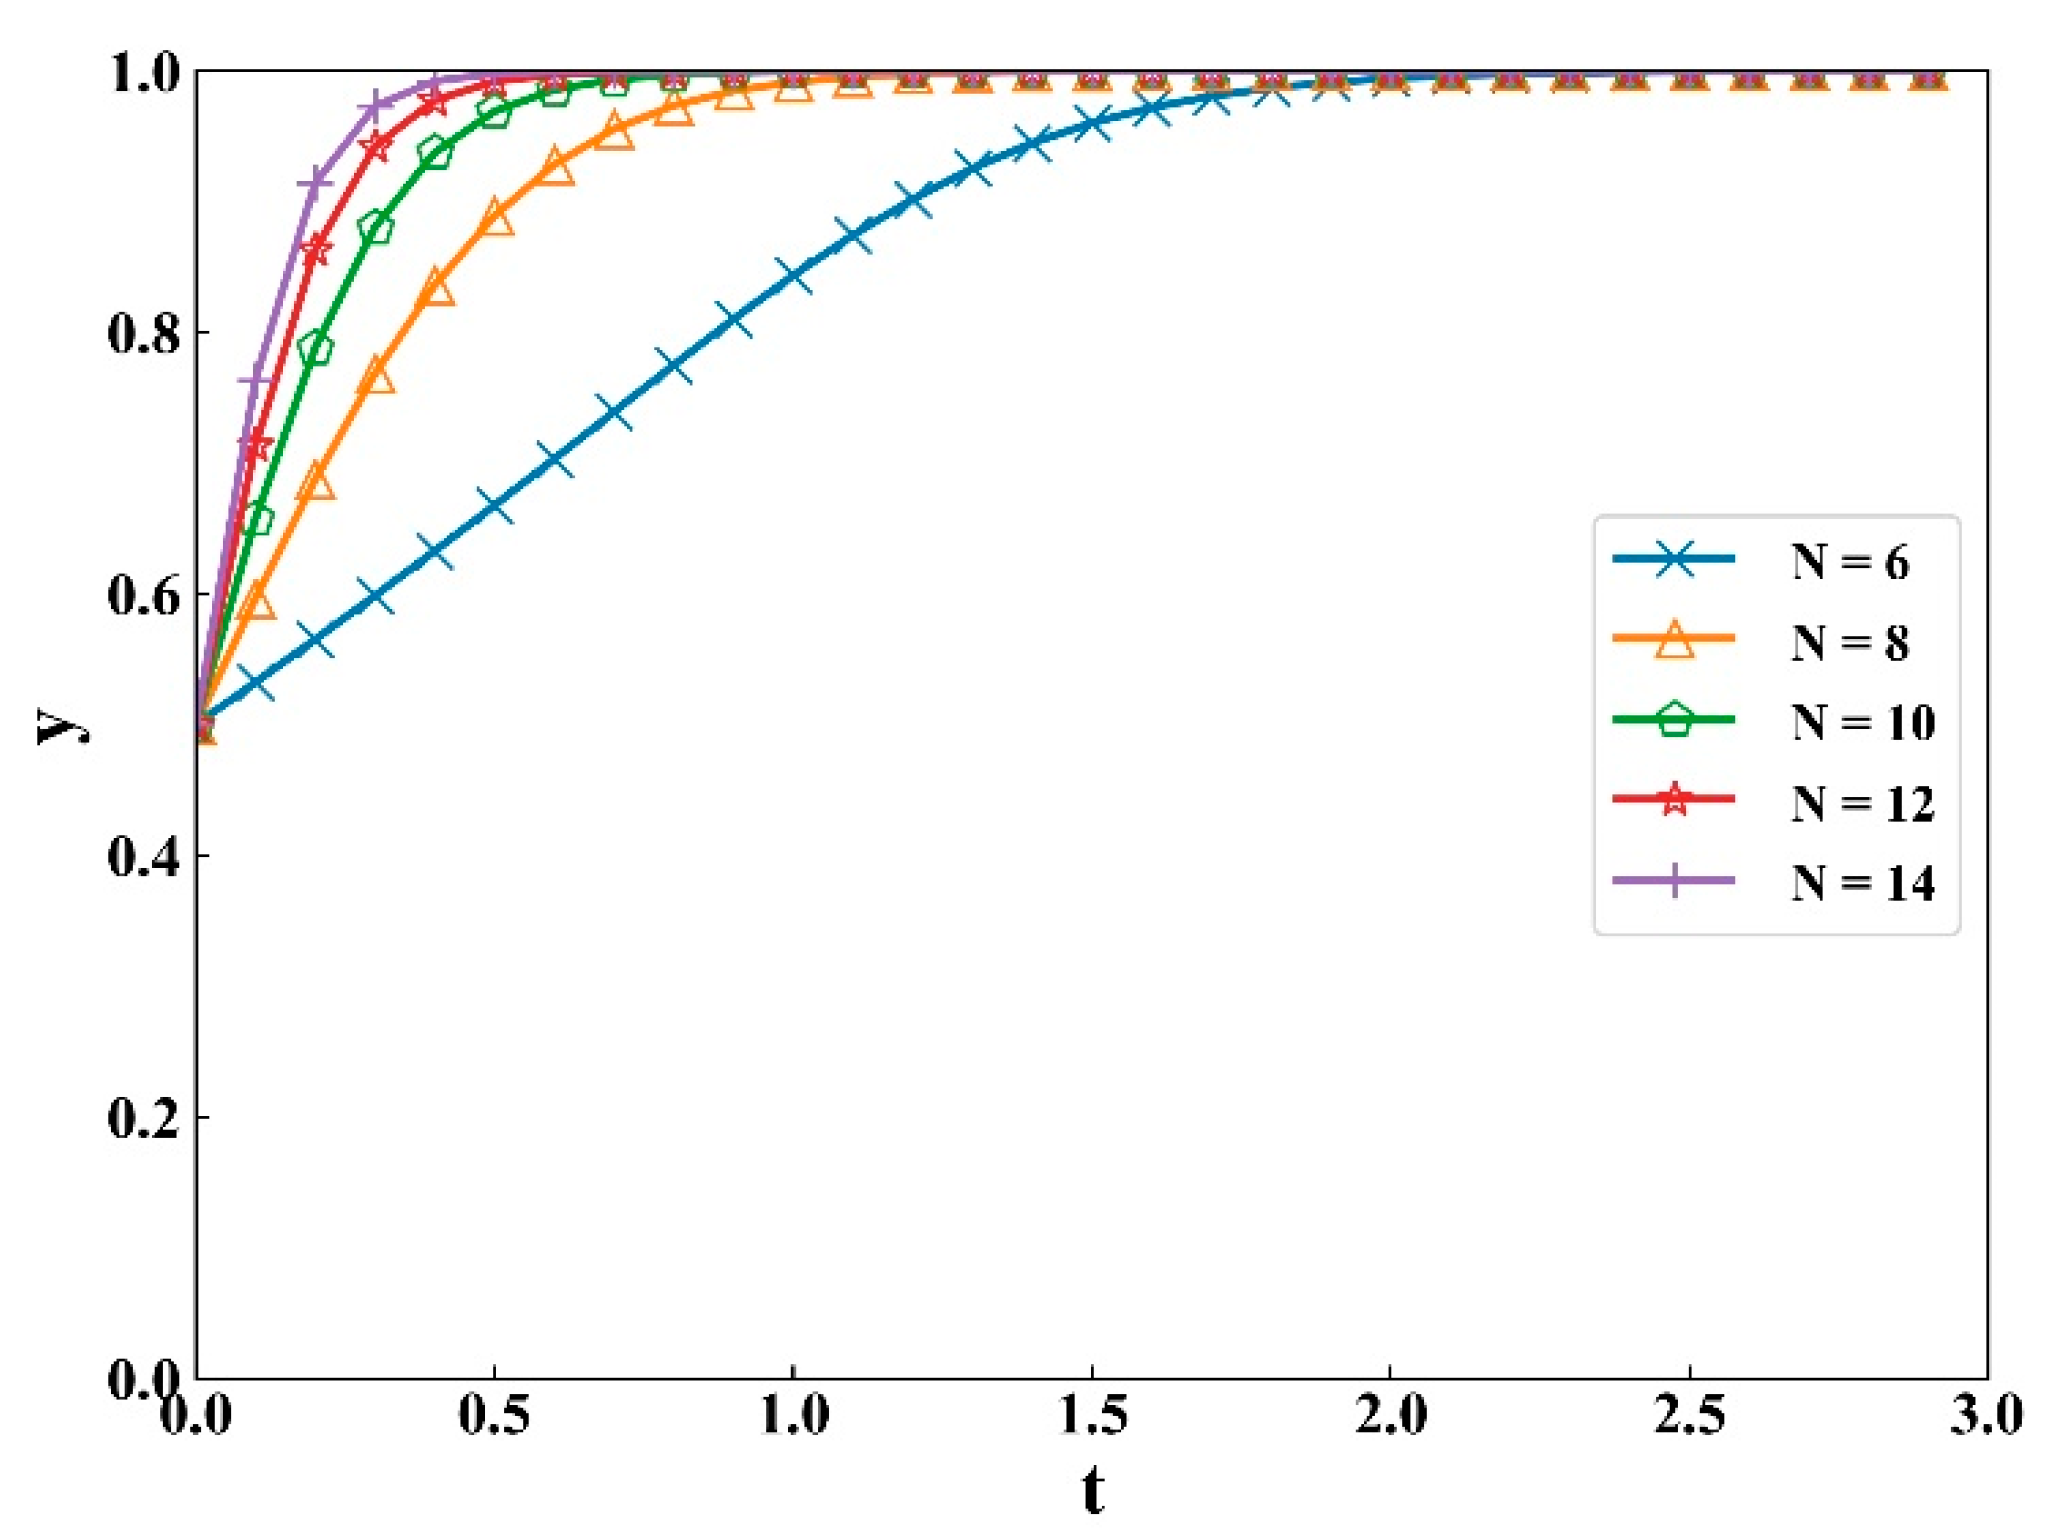
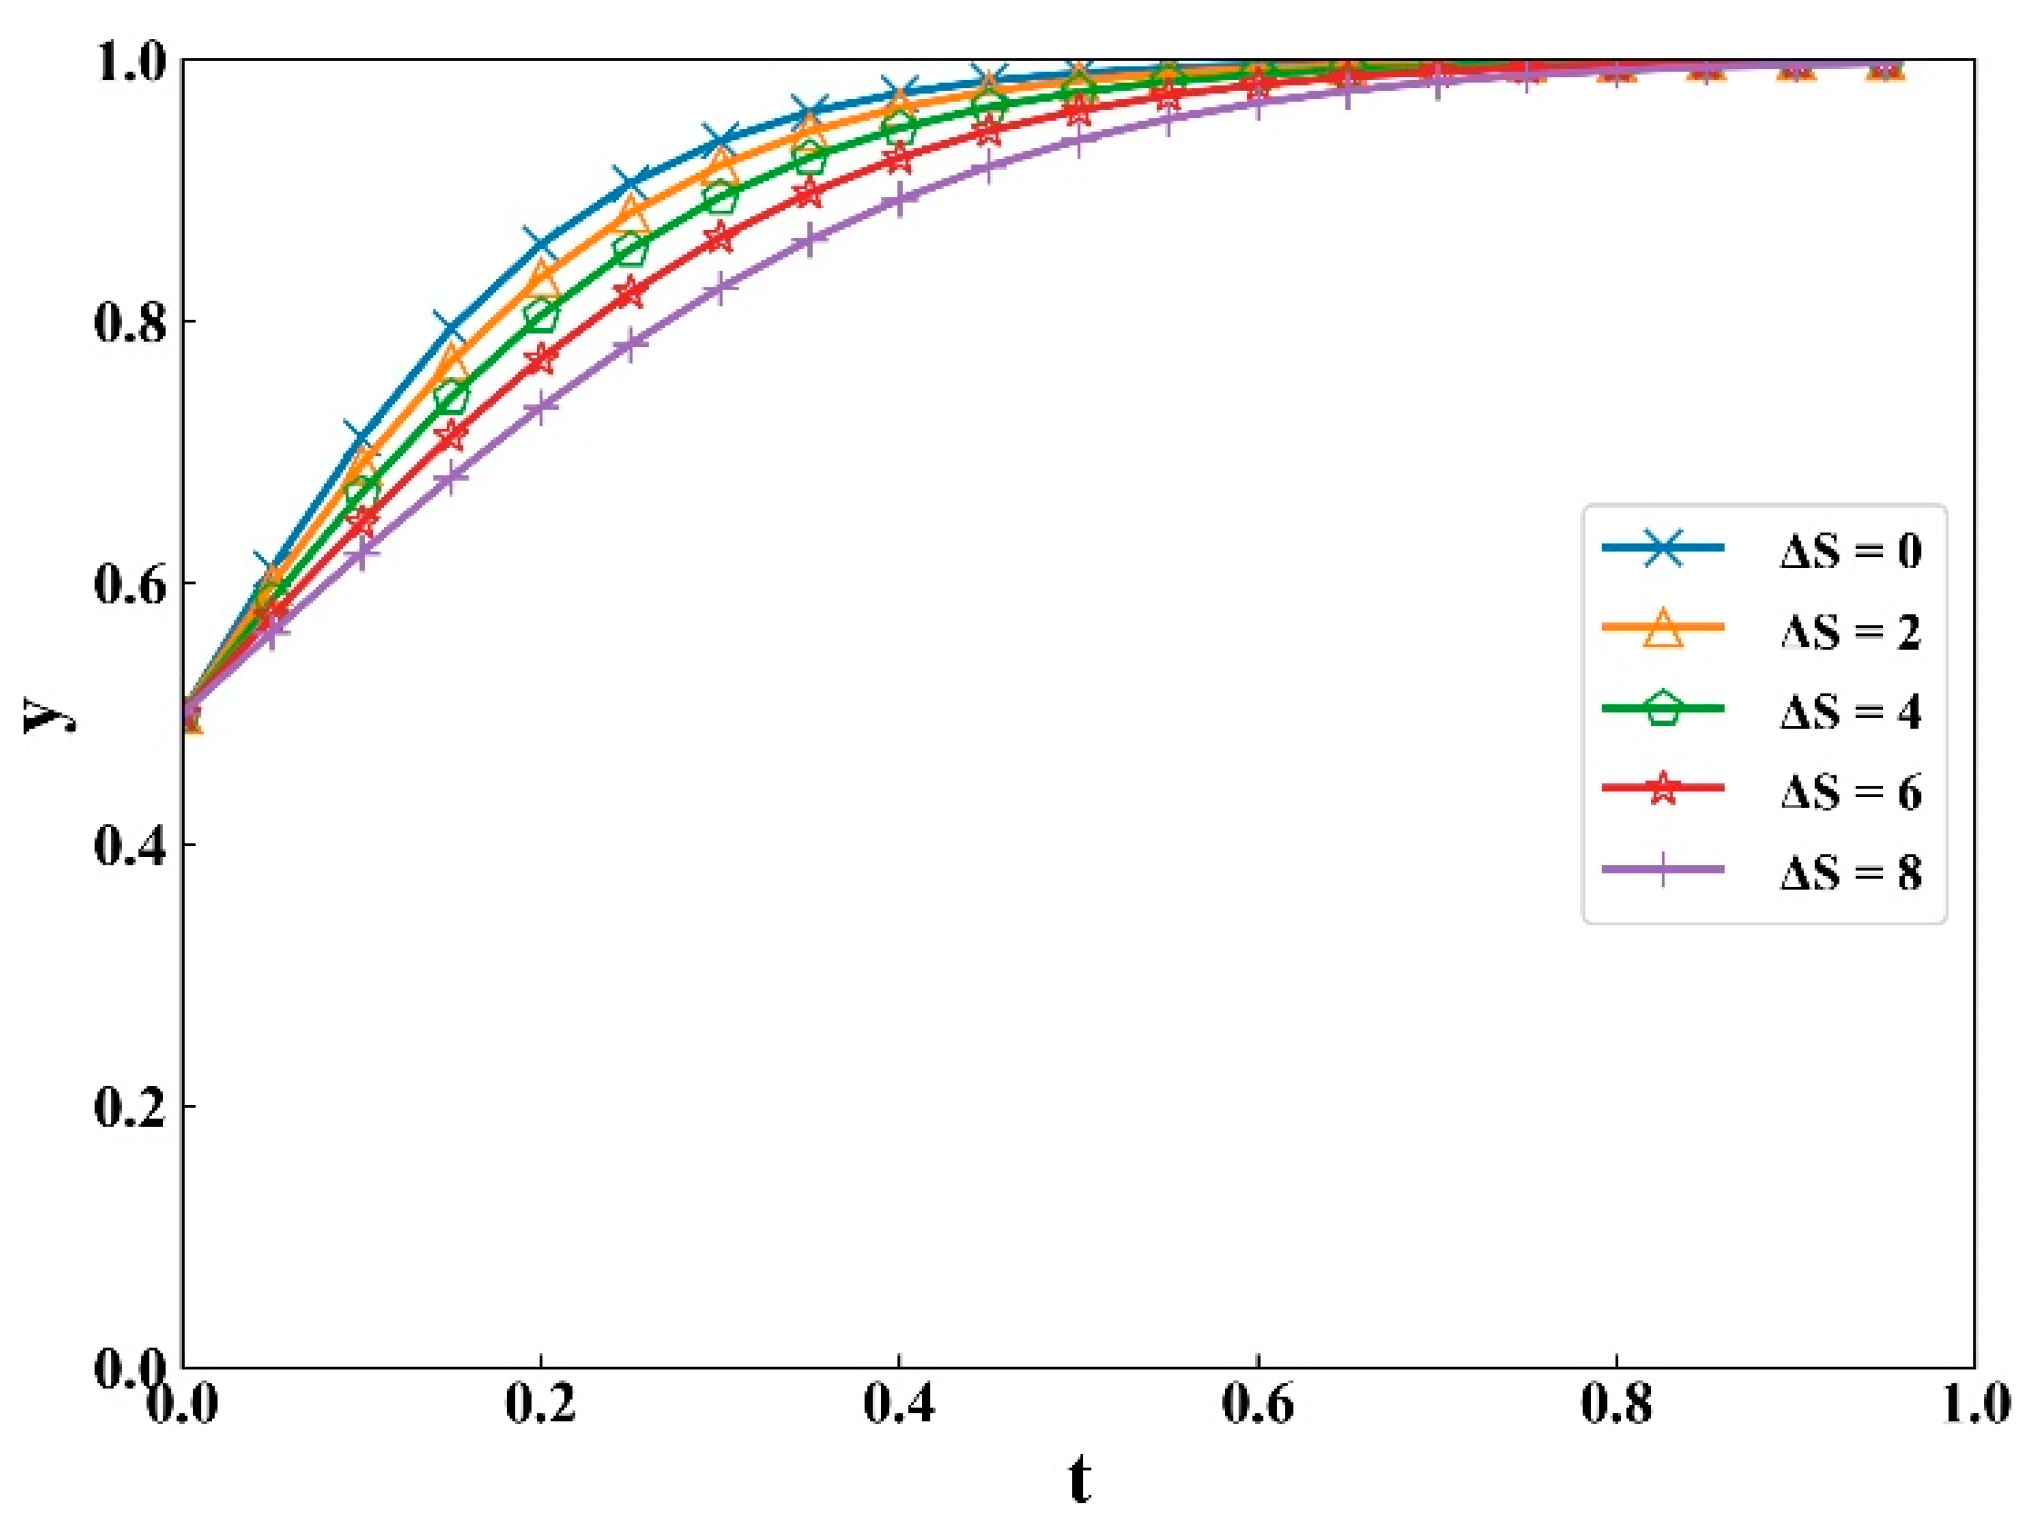
  • In Section 6.2.2, we also explored the influences of significant parameters on the government’s strategy selection based on the simulation results as shown in Figure 9, Figure 10, Figure 11 and Figure 12. First of all, we found that when the future social benefits of the project under non-opportunism increased, the government will no doubt choose to maintain the project. Then, according to Figure 10, considering the future benefits of the project, the government is more inclined to save the project, but with the increase of subsidy, the evolutionary rate of choosing to maintain the project was slowed. On the contrary, with the cost of buyback increases, the evolutionary rate of choosing to maintain the project was increased gradually as shown in Figure 11. Subsequently, frequent opportunistic renegotiation will make risk continuously increase and thus the evolutionary rate of choosing to maintain the project was slowed.
  • In general, by exploring the influences of special parameters, some significant influential factors in real renegotiation cases could be acquired. Firstly, combined with the analysis in Section 6.2.1 and Section 6.2.2, we can find that cooperation benefits are very favorable to PPP projects. Hence, the government and investors should devote more time and attention to the preliminary phase of the project to build a good relationship, and the corresponding incentives would make the investors abandon opportunism spontaneously to achieve a win-win result. In addition, exploring solutions to create value in renegotiation would also increase the payoffs for both partners. Secondly, the initial probability of the government’s strategy, to some extent, reflects the acceptance of the termination of PPP projects. If there was a sound social capital withdrawal mechanism, the government would not blindly subsidize the project in distress. Meanwhile, it would be advisable for both partners to recognize the possibility of renegotiation and early-termination at the start and establish a clear framework in contracts to facilitate the processes. Thirdly, the government should focus more on the screening mechanism of the investors in the retender, avoiding inefficient investors from participating in the project. This is an issue that has to be addressed in the tender, since the ex-ante inefficiency would lead to the ex-post inefficiency (as analyzed in Section 6.2.1). Another problem is to avoid frequent renegotiations, and some necessary contract terms would prevent frivolous demands while opening a channel for reasonable and serious ones [15].

8. Conclusions

Concentrating on the renegotiation of PPP projects, this research established the return matrix of the government and investors with different strategies and analyzed the evolutionary-stable strategy of the system. Besides, the rationality of maintaining the project and the influence of investors’ opportunism on the renegotiation results are studied as well. Moreover, the internal mechanism of mutual influence between the two players’ strategy selection are discussed. The results showed the evolutionary path and evolutionary stability strategy in different situations. Based on the in-depth analysis of the boundary conditions of various situations, the key factors influencing the selection of strategies of both parties are obtained. In order to visually show the results, this paper carried out evolutionary simulation on the initial strategies of players, proving that the strategies selection of the government and investors affect each other, and further carried out numerical simulation on critical parameters.
  • Based on the analysis of evolutionary paths and the ESS, non-opportunism and maintaining the project is the optimal strategy combinations for the government and investors. However, when the project is in great trouble, or the opportunistic behavior of investors has caused great damage to the project, it is useless to continue the subsidy, and the termination of the project is one way to stop the loss in time. Moreover, the effective control of opportunism is an important issue to be solved after the adoption of subsidies.
  • Whether investors adopt opportunistic behavior depends on the speculative net benefit and the financial situation of investors. Additionally, the higher the expected benefit created by reasonable participation in the project, the lower the probability of investors adopting opportunism, and the higher the probability of achieving the strategy (i.e., non-opportunism, maintain the project).
  • The government’s decision-making mainly depends on the subsidy cost and the buyback cost. Similarly, if the project is expected to develop well in the future, the government will be supported to make the decision to maintain the project.
Based on the above analysis on avoiding excessive subsidies and restraining investors’ opportunism, this paper can provide some management enlightenment for the government and regulatory authorities to promote the sustainable development of PPP projects.
  • For the government, when accepting subsidy applications from investors, the priority is to make sure that it is worthwhile to maintain the project, and second, to ensure that the amount of subsidy does not create a substantial financial burden. Otherwise, subsidies are not the optimal strategy at this point. Although the early termination is still regarded as a significant failure of the project, as a possible result of renegotiation, a reasonable ex-post treatment mechanism, such as the withdrawal mechanism of social capital, needs to be developed. The rational withdrawal path of social capital is a further supplement to the sustainability of PPPs. On the other hand, it is also an effective measure to encourage investors to participate in PPP projects actively.
  • The cooperation benefits of PPP projects should be more emphasized. In the process of PPP projects, investors are dominated by their interests. Therefore, corresponding incentive measures will promote investors to participate in projects spontaneously and actively. When the return in the case of non-opportunism is higher than that of opportunism, the possibility of investors’ speculative behavior will be reduced. Additional transaction costs will be incurred in renegotiation, however, if the current problems can be effectively resolved through renegotiation and the parties’ understanding can be deepened, it will be conducive to the development of future cooperation. Besides, this is also the meaning and value of setting up renegotiation.
  • The screening and supervision mechanism of investors should be set. According to the analysis of the ESS and essential parameters, if the government lacks the judging and screening mechanism for investors at the initial stage of the project, or investors cannot afford the construction and operation of PPP projects, it will increase the risk of excessive government subsidies and future frequent negotiations. At the same time, investors’ opportunistic behavior may damage the overall benefits of the project in the cooperation; the government, therefore, needs to exercise its regulatory function [50,51] and increase investors’ opportunistic cost through punitive measures to restrain opportunistic behavior.
In this paper, evolutionary game theory was applied to the renegotiation of PPP projects. By studying the evolution mechanism of both parties’ behavior decisions, the key factors influencing whether the project will continue were obtained. Theoretically, we explained the different results of renegotiation in detail, including the impact of investors’ opportunism on the project and the basis of government decision-making. In a practical sense, this paper carried out a numerical simulation on critical parameters to provide useful suggestions for restraining opportunistic behavior of investors and rational decision-making of the government, so as to promote further improvement and sustainable development of PPP projects.
There are still some limitations in this study that need to be further improved in the future. First of all, the results of this research are mainly based on simulation. We observed the selection of renegotiation strategy under different scenarios, and analyzed the influence of different parameters on strategy selection. Therefore, we will select a scenario and extensively collect renegotiation case data to expand further research. Secondly, this paper selects two critical stakeholders in renegotiation, i.e., government and investors, as the research objects; hence, how to construct a multiple evolutionary game model and analyze the influence of multi-party behavioral decisions is another important research direction. Finally, this paper provides relevant suggestions for the sustainable development of PPP projects from the direction of restraining investors’ opportunism and avoiding excessive subsidies, so as to have a deeper understanding of premature termination of projects. Thus, a direct extension is to study the exit path of social capital after the early termination of PPP projects, which will make a further contribution to the sustainability of PPP projects.

Author Contributions

Conceptualization, H.X., Y.L. and H.L.; Methodology, Y.L. and H.X.; Software, Y.L.; Validation, Y.L. and H.X.; Formal analysis, Y.L. and H.X.; Investigation, Y.L. and H.X.; Resources, H.L. and H.X.; Data curation, Y.L.; Writing—original draft preparation, Y.L and H.X.; Writing—review and editing, H.L. and Y.L.; Visualization, Y.L.; Supervision, H.L. and H.X.; Project administration, H.L. All authors have read and agreed to the published version of the manuscript.

Funding

This work was supported by National Natural Science Foundation of China (Grant No. 71501074), the “13th Five-Year” Plan of Philosophy and Social Sciences of Guangdong Province (2019 General Project) (Project No.: GD19CGL27), the State Key Laboratory of Subtropical Building Science, South China University of Technology, China (2020ZB17) and the Fundamental Research Funds for the Central Universities (approval number 2019MS116; project number x2tj/D2192640).

Acknowledgments

The authors gratefully acknowledge those experts for their constructive comments and suggestions.

Conflicts of Interest

The authors declare no conflict of interest.

References

  1. Wang, S.Q.; Tiong, R.L.K.; Ting, S.K.; Ashley, D. Evaluation and management of political risks in China’s bot projects. J. Constr. Eng. Manag. 2000, 126, 242–250. [Google Scholar] [CrossRef]
  2. Geddes, R.R.; Reeves, E. The Favourability of US PPP Enabling Legislation and Private Investment in Transportation Infrastructure. Util. Policy 2017, 48, 157–165. [Google Scholar] [CrossRef]
  3. Du, J.; Wu, H.; Jin, R. Capital Structure of Public-Private Partnership Projects: A Sustainability Perspective. Sustainability 2019, 11, 3505. [Google Scholar] [CrossRef] [Green Version]
  4. Yuan, J.; Li, W.; Guo, J.; Zhao, X.; Skibniewski, M.J. Social Risk Factors of Transportation PPP Projects in China: A Sustainable Development Perspective. Int. J. Environ. Res. Public Health 2018, 15, 1323. [Google Scholar] [CrossRef] [PubMed] [Green Version]
  5. Cui, C.; Liu, Y.; Hope, A.; Wang, J. Review of studies on the public private partnerships (PPP) for infrastructure projects. Int. J. Proj. Manag. 2018, 36, 773–794. [Google Scholar] [CrossRef]
  6. Liang, Y.; Wang, H. Sustainable Performance Measurements for Public-Private Partnership Projects: Empirical Evidence from China. Sustainability 2019, 11, 3653. [Google Scholar] [CrossRef] [Green Version]
  7. Xiong, W.; Zhang, X. Concession Renegotiation Models for Projects Developed through Public-Private Partnerships. J. Constr. Eng. Manag. 2014, 140. [Google Scholar] [CrossRef]
  8. Liu, H.; Li, W. Risk on Early Contract Termination of PPP Project Based on SNA Perspective. J. Civ. Eng. Manag. 2019, 36, 35–41. [Google Scholar]
  9. Xiong, W.; Zhao, X.; Wang, H. Information Asymmetry in Renegotiation of Public-Private Partnership Projects. J. Comput. Civil. Eng. 2018, 32. [Google Scholar] [CrossRef]
  10. Zhu, L.; Zhao, X.; Chua, D.K.H. Agent-Based Debt Terms’ Bargaining Model to Improve Negotiation Inefficiency in PPP Projects. J. Comput. Civil. Eng. 2016, 30. [Google Scholar] [CrossRef]
  11. Rasmusen, E. Games and Information, 4th ed.; Blackwell Publishing: Oxford, UK, 2006. [Google Scholar]
  12. de Brux, J. The Dark and Bright Sides of Renegotiation: An Application to Transport Concession Contracts. Util. Policy 2010, 18, 77–85. [Google Scholar] [CrossRef]
  13. Liu, T.; Zhao, T.; Wang, S. Research on Renegotiations of China’s PPP Projects Based on Case Analysis. Constr. Econ. 2016, 37, 31–34. [Google Scholar]
  14. HM Treasury. Standardisation of PFI Contracts; HM Treasury: London, UK, 2007. [Google Scholar]
  15. Zhang, X.; Xiong, W. Renegotiation and Early-Termination in Public Private Partnerships. International J. Archit. Eng. Constr. 2015, 4, 204–213. [Google Scholar] [CrossRef] [Green Version]
  16. Ho, S.P. Model for Financial Renegotiation in Public-Private Partnership Projects and Its Policy Implications: Game Theoretic View. J. Constr. Eng. Manag. 2006, 132, 678–688. [Google Scholar] [CrossRef]
  17. Guasch, J.L.; Laffont, J.J.; Straub, S. Concessions of infrastructure in Latin America: Government-led renegotiation. J. Appl. Econom. 2007, 22, 1267–1294. [Google Scholar] [CrossRef] [Green Version]
  18. Cruz, C.O.; Marques, R.C. Flexible contracts to cope with uncertainty in public-private partnerships. Int. J. Proj. Manag. 2013, 31, 473–483. [Google Scholar] [CrossRef]
  19. Demirel, H.C.; Leendertse, W.; Volker, L.; Hertogh, M. Flexibility in PPP contracts—Dealing with potential change in the pre-contract phase of a construction project. Constr. Manag. Econ. 2017, 35, 196–206. [Google Scholar] [CrossRef] [Green Version]
  20. Domingues, S.; Zlatkovic, D. Renegotiating PPP Contracts: Reinforcing the ‘P’ in Partnership. Transp. Rev. 2015, 35, 204–225. [Google Scholar] [CrossRef]
  21. Yin, Y.; Wang, Y. An Empirical Study on Relationship between Contract Flexibility and Project Management Performance in Construction Project: The Perspective of Trust between Owner and Contractor. Manag. Rev. 2015, 27, 151–162. [Google Scholar]
  22. Cruz, C.O.; Marques, R.C. Exogenous Determinants for Renegotiating Public Infrastructure Concessions: Evidence from Portugal. J. Constr. Eng. Manag. 2013, 139, 1082–1090. [Google Scholar] [CrossRef]
  23. Albalate, D.; Bel, G. Regulating concessions of toll motorways: An empirical study on fixed vs. variable term contracts. Transp. Res. Pt. A-Policy Pract. 2009, 43, 219–229. [Google Scholar] [CrossRef] [Green Version]
  24. Ho, S.P.; Levitt, R.; Tsui, C.W.; Hsu, Y. Opportunism-Focused Transaction Cost Analysis of Public-Private Partnerships. J. Manag. Eng. 2015, 31, 31. [Google Scholar] [CrossRef]
  25. Zhang, X.; Soomro, M.A. Failure Path Analysis with Respect to Private Sector Partners in Transportation Public-Private Partnerships. J. Manag. Eng. 2016, 32. [Google Scholar] [CrossRef]
  26. Xiong, W.; Zhang, X.; Chen, H. Early-Termination Compensation in Public-Private Partnership Projects. J. Constr. Eng. Manag. 2016, 142. [Google Scholar] [CrossRef]
  27. Song, J.; Hu, Y.; Feng, Z. Factors Influencing Early Termination of PPP Projects in China. J. Manag. Eng. 2018, 34. [Google Scholar] [CrossRef]
  28. Xiong, W.; Zhao, X.; Yuan, J.F.; Luo, S. Ex Post Risk Management in Public-Private Partnership Infrastructure Projects. Proj. Manag. J. 2017, 48, 76–89. [Google Scholar] [CrossRef]
  29. World Bank. Private Participation in Infrastructure Projects Database; World Bank: Washington, DC, USA, 2011. [Google Scholar]
  30. Ho, S.P.; Tsui, C.W. When Are Public-Private Partnerships Not an Appropriate Governance Structure? Case Study Evidence. In Proceedings of the Construction Research Congress, Banff, AB, Canada, 8–10 May 2010. [Google Scholar]
  31. Russo, J.C.; Guimaraes Dias, M.A.; da Silva Rocha, A.B.; Cyrino Oliveira, F.L. Renegotiation in Public-Private Partnerships: An Incentive Mechanism Approach. Group Decis. Negot. 2018, 27, 949–979. [Google Scholar] [CrossRef]
  32. Domingues, S.; Sarmento, J.M. Critical renegotiation triggers of European transport concessions. Transp. Policy 2016, 48, 82–91. [Google Scholar] [CrossRef]
  33. Medda, F. A game theory approach for the allocation of risks in transport public private partnerships. Int. J. Proj. Manag. 2007, 25, 213–218. [Google Scholar] [CrossRef]
  34. Song, J.; Jin, L.; Zhao, Y.; Hu, W. Using bargaining-game model to negotiate compensation for the early termination of BOT highway projects. Transp. Res. Pt. A-Policy Pract. 2017, 105, 197–209. [Google Scholar] [CrossRef]
  35. Liu, J.; Gao, R.; Cheah, C.Y.J.; Luo, J. Incentive mechanism for inhibiting investors’ opportunistic behavior in PPP projects. Int. J. Proj. Manag. 2016, 34, 1102–1111. [Google Scholar] [CrossRef]
  36. Steinle, C.; Schiele, H.; Ernst, T. Information Asymmetries as Antecedents of Opportunism in Buyer-Supplier Relationships: Testing Principal-Agent Theory. J. Bus.-Bus. Mark. 2014, 21, 123–140. [Google Scholar] [CrossRef]
  37. Keser, C.; Willinger, M. Theories of behavior in principal-agent relationships with hidden action. Eur. Econ. Rev. 2007, 51, 1514–1533. [Google Scholar] [CrossRef]
  38. Robson, A.J. Individual strategy and social structure: An evolutionary theory of institutions. Can. J. Econ.-Rev. Can. Econ. 1999, 32, 247–250. [Google Scholar] [CrossRef]
  39. Schmidt, C. Are evolutionary games another way of thinking about game theory? J. Evol. Econ. 2004, 14, 249–262. [Google Scholar] [CrossRef]
  40. Taylor, P.D.; Jonker, L.B. Evolutionary Stable Strategies and Game Dynamics. Math. Biosci. 1978, 40, 145–156. [Google Scholar] [CrossRef]
  41. Li, D.; Ma, J.; Tian, Z.; Zhu, H. An Evolutionary Game for the Diffusion of Rumor in Complex Networks. Phys. A: Stat. Mech. Its Appl. 2015, 433, 51–58. [Google Scholar] [CrossRef]
  42. Friedman, D.; Fung, K.C. International Trade and the Internal 0rganization of Firms: An Evolutionary Approach. J. Int. Econ. 1996, 41, 113–137. [Google Scholar] [CrossRef]
  43. Du, Y.; Zhou, H.; Yuan, Y.; Xue, H. Exploring the Moral Hazard Evolutionary Mechanism for BIM Implementation in an Integrated Project Team. Sustainability 2019, 11, 5719. [Google Scholar] [CrossRef] [Green Version]
  44. Shen, H.; Peng, Y.; Guo, C. Analysis of the Evolution Game of Construction and Demolition Waste Recycling Behavior Based on Prospect Theory under Environmental Regulation. Int. J. Environ. Res. Public Health 2018, 15, 1518. [Google Scholar] [CrossRef] [Green Version]
  45. Gao, X.; Shen, J.; He, W.; Sun, F.; Zhang, Z.; Guo, W.; Zhang, X.; Kong, Y. An evolutionary game analysis of governments’ decision-making behaviors and factors influencing watershed ecological compensation in China. J. Environ. Manag. 2019, 251. [Google Scholar] [CrossRef] [PubMed]
  46. Sun, H.; Wan, Y.; Zhang, L.; Zhou, Z. Evolutionary game of the green investment in a two-echelon supply chain under a government subsidy mechanism. J. Clean Prod. 2019, 235, 1315–1326. [Google Scholar] [CrossRef]
  47. Yang, X.; Zhang, J.; Shen, G.Q.; Yan, Y. Incentives for green retrofits: An evolutionary game analysis on Public-Private-Partnership reconstruction of buildings. J. Clean Prod. 2019, 232, 1076–1092. [Google Scholar] [CrossRef]
  48. Friedman, D. Evolutionary Games in Economics. Econometrica 1991, 59, 637–666. [Google Scholar] [CrossRef] [Green Version]
  49. Liu, C.; Huang, W.; Yang, C. The evolutionary dynamics of China’s electric vehicle industry—Taxes vs. subsidies. Comput. Ind. Eng. 2017, 113, 103–122. [Google Scholar] [CrossRef]
  50. Sabry, M.I. Good governance, institutions and performance of public private partnerships. Int. J. Public Sect. Manag. 2015, 28, 566–582. [Google Scholar] [CrossRef]
  51. Verhoest, K.; Petersen, O.H.; Scherrer, W.; Soecipto, R.M. How Do Governments Support the Development of Public Private Partnerships? Measuring and Comparing PPP Governmental Support in 20 European Countries. Transp. Rev. 2015, 35, 118–139. [Google Scholar] [CrossRef]
Figure 1. Evolution path of different scenarios: (a) scenario 1; (b) scenario 2; (c) scenario 3.
Sustainability 12 02646 g001
Figure 2. Evolution path of different scenarios: (a) scenario 4; (b) scenario 5; (c) scenario 6.
Sustainability 12 02646 g002
Figure 3. Evolution path of different scenarios: (a) scenario 7; (b) scenario 8; (c) scenario 9.
Sustainability 12 02646 g003
Figure 4. The impact of changes in y 0 on the evolutionary result. (a) x 0 = 0.5, wherein y 0 = 0.1, 0.2, 0.3, 0.4, 0.5, 0.6, 0.7, 0.8, 0.9; (b) x 0 = 0.6, wherein= 0.1, 0.2, 0.3, 0.4, 0.5, 0.6, 0.7, 0.8, 0.9.
Sustainability 12 02646 g004
Figure 5. The impact of changes in x 0 on the evolutionary result. (a) y 0 = 0.4, wherein x 0 = 0.1, 0.2, 0.3, 0.4, 0.5, 0.6, 0.7, 0.8, 0.9; (b) y 0 = 0.5, wherein x 0 = 0.1, 0.2, 0.3, 0.4, 0.5, 0.6, 0.7, 0.8, 0.9.
Sustainability 12 02646 g005
Figure 6. The impact of Δ R on the evolutionary results.
Sustainability 12 02646 g006
Figure 7. The impact of K 2 on the evolutionary results.
Sustainability 12 02646 g007
Figure 8. The impact of R 1 on the evolutionary results.
Sustainability 12 02646 g008
Figure 9. The impact of S 1 on the evolutionary results.
Sustainability 12 02646 g009
Figure 10. The impact of U on the evolutionary results.
Sustainability 12 02646 g010
Figure 11. The impact of N on the evolutionary results.
Sustainability 12 02646 g011
Figure 12. The impact of Δ S on the evolutionary results.
Sustainability 12 02646 g012
Table 1. The payoff matrix between the government and investors.
Government
Maintain the Project (y)Terminate the Project (1-y)
Investorsnon-opportunism (x) R 0 + U + R 1 , S 0 α U + S 1 R 0 + N K 1 , S 0 θ N
opportunism (1-x) R 0 + U + Δ R + R 2 , λ S 0 α U Δ S + S 2 R 0 + N + Δ R K 1 , λ S 0 θ N
Table 2. Determinant and Trace of Jacobian.
Equilibrium Point Det JTr J
E1(0,0) ( K 2 K 1 Δ R ) ( α U + θ N Δ S + S 2 ) ( K 2 K 1 Δ R ) + ( α U + θ N Δ S + S 2 )
E2(1,0) ( K 1 K 2 + Δ R ) ( S 1 α U + θ N ) ( K 1 K 2 + Δ R ) + ( S 1 α U + θ N )
E3(0,1) ( R 1 R 2 Δ R ) ( α U θ N + Δ S S 2 ) ( R 1 R 2 Δ R ) + ( α U θ N + Δ S S 2 )
E4(1,1) ( Δ R R 1 + R 2 ) ( α U θ N S 1 ) ( Δ R R 1 + R 2 ) + ( α U θ N S 1 )
E5( x , y ) ( K 1 K 2 + Δ R ) ( R 1 R 2 Δ R ) R 1 R 2 + K 1 K 2 ( α U + Δ S S 2 θ N ) ( S 1 α U + θ N ) S 1 S 2 + Δ S 0
Table 3. Local stability analysis of the equilibrium point in scenario 1–3.
ScenariosConstraint ConditionsEquilibrium PointDet JTr JResults
Scenario 1 θ N < α U + S 2 Δ S < α U + S 1 , Δ R < K 2 K 1 < R 1 R 2 E1(0,0)++Unstable
E2(1,0)±Saddle
E3(0,1)±Saddle
E4(1,1)+ESS
E5( x , y )
Scenario 2 θ N < α U + S 2 Δ S < α U + S 1 , K 2 K 1 < Δ R < R 1 R 2 E1(0,0)±Saddle
E2(1,0)++Unstable
E3(0,1)±Saddle
E4(1,1)+ESS
E5( x , y )
Scenario 3 θ N < α U + S 2 Δ S < α U + S 1 , K 2 K 1 < R 1 R 2 < Δ R E1(0,0)±Saddle
E2(1,0)++Unstable
E3(0,1)+ESS
E4(1,1)±Saddle
E5( x , y )
Table 4. Local stability analysis of the equilibrium point in scenarios 4–6.
ScenariosConstraint ConditionsEquilibrium PointDet JTr JResults
Scenario 4 α U + S 2 Δ S < α U + S 1 < θ N , Δ R < K 2 K 1 < R 1 R 2 E1(0,0)±Saddle
E2(1,0)+ESS
E3(0,1)++Unstable
E4(1,1)±Saddle
E5( x , y )
Scenario 5 α U + S 2 Δ S < α U + S 1 < θ N , K 2 K 1 < Δ R < R 1 R 2 E1(0,0)+ESS
E2(1,0)±Saddle
E3(0,1)++Unstable
E4(1,1)±Saddle
E5( x , y )
Scenario 6 α U + S 2 Δ S < α U + S 1 < θ N , K 2 K 1 < R 1 R 2 < Δ R E1(0,0)+ESS
E2(1,0)±Saddle
E3(0,1)±Saddle
E4(1,1)++Unstable
E5( x , y )
Table 5. Local stability analysis of the equilibrium point in scenarios 7–9.
ScenariosConstraint ConditionsEquilibrium PointDet JTr JResults
Scenario 7 α U + S 2 Δ S < θ N < α U + S 1 , Δ R < K 2 K 1 < R 1 R 2 E1(0,0)±Saddle
E2(1,0)±Saddle
E3(0,1)++Unstable
E4(1,1)+ESS
E5( x , y )
Scenario 8 α U + S 2 Δ S < θ N < α U + S 1 , K 2 K 1 < Δ R < R 1 R 2 E1(0,0)+ESS
E2(1,0)++Unstable
E3(0,1)++Unstable
E4(1,1)+ESS
E5( x , y ) Saddle
Scenario 9 α U + S 2 Δ S < θ N < α U + S 1 , K 2 K 1 < R 1 R 2 < Δ R E1(0,0)+ESS
E2(1,0)++Unstable
E3(0,1)±Saddle
E4(1,1)±Saddle
E5( x , y )
Table 6. The impact of the parameter changes on the system evolution result.
Parameter Δ S S 1 S 2 K 1 K 2 α U θ N R 1 R 2 Δ R
M1
M21
1 ↑ means increase, ↓ means decrease.
Table 7. The parameter values.
R 1 R 2 S 1 S 2 Δ R Δ S U α N θ K 1 K 2
201210865101.8101.31014

