Article

Can Higher Education, Economic Growth and Innovation Ability Improve Each Other?

1
School of Urban and Environmental Science, Huaiyin Normal University, Huai’an 223300, China
2
Department of Electronic Engineering, National Formosa University, Yunlin 632, Taiwan
3
Department of Civil, Environmental and Architectural Engineering, Korea University, Seoul 02841, Korea
*
Author to whom correspondence should be addressed.
Sustainability 2020, 12(6), 2515; https://doi.org/10.3390/su12062515
Submission received: 25 February 2020 / Revised: 18 March 2020 / Accepted: 22 March 2020 / Published: 23 March 2020

Abstract

:
This study argues that the coupling between higher education, economic growth, and innovation ability is of great significance for regional sustainable development. Through the experience of Jiangsu Province in China, this study establishes a coupling coordination evaluation index system and applies the coupling coordination model to evaluate interactive relationships among the three. It finds that during 2007–2017, the level of coupling of 13 prefecture-level cities in Jiangsu was increasing over time, which fully verified the previous scholars’ view that the three can improve each other over a long period. However, this study finds that there are obvious differences within Jiangsu. Inadequate investment in higher education has become a crucial constraint on sustainable economic growth in northern and central Jiangsu, which are backward regions of Jiangsu. By contrast, in southern Jiangsu, which is the advanced region of Jiangsu, although the resources of higher education are abundant the growth of innovation ability cannot support sustained economic growth well. Thus, the quality of higher education should be improved to meet the needs of the innovation-based economy. Accordingly, cross-regional cooperation and balanced investment in higher education are the keys to practicing a balanced and sustained regional development. The results of this study’s coupling coordination analysis and evaluation can serve as a reference for governments in enhancing regional sustainable development.

1. Introduction

Since the emergence of the knowledge economy in the 1990s, knowledge has become a crucial resource for regional development. Innovation through accumulating knowledge has been a critical factor in sustainable regional development. Since 2000, human development is facing more serious problems, including resource problems, environmental problems, and ecological problems, which have led to global thinking about sustainable economic growth models. Whether education development can meet the ever-changing needs has become an important topic of common concern in many fields. The 2015 United Nations Sustainable Development Summit passed the 2030 Agenda for Sustainable Development [1]. The aim of Goal 4 is to ensure inclusive and equitable quality education and promote lifelong learning opportunities for all. This indicates the urgency of incorporating sustainable development education at all levels [2].
In this era of globalization, governments worldwide focus on sustainable development education, which is likely to result in sustainable economic development. Many countries employ the service economy concept to stimulate economic growth. Furthermore, education is a form of investment in human resources. Higher education increases a nation’s gross national income [3]. Regions and organizations accentuate competitiveness in higher education because it enhances welfare and economic performance [4,5]. Organizations, cities, regions, and countries apply different approaches to manage and incorporate intellectual capital; however, the choice of approach is the decisive factor for success [6]. A substantive body of literature indicates that the global movement toward a highly qualified workforce can be a powerful boost, enhancing knowledge transfer, international cooperation, and innovation [7,8]. This influences the reputation, competitiveness, and wealth of countries and encourages them to pay attention to quality of life and contributions to a sustainable and balanced society [9].
Therefore, in the past 20 years, the enrollment scale of universities has been expanding, especially in developing countries. However, empirical research has found that the development of higher education does not necessarily bring about innovation, thus bringing about positive effects on economic growth. The relationships between these three indices are complex. Therefore, the coordinated development among higher education, economic growth, and innovation ability critically determines whether sustainable development in a region is possible.
The sustainability of China’s economic miracle is in question. As is possible for some developing nations, China stands at a critical juncture between its catch-up phase that relies on technological adaptation and the phase that springs from its capacity for knowledge generation and technological innovation [10]. Currently, China’s economic development is undergoing a critical period of reform, and the economy is driven by innovation instead of conventional input and investment. Regional innovation has become a crucial driving force of regional economic growth. Improved innovation relies on developing higher education and requires the support of materials provided by economic growth. Accordingly, economic growth, higher education, and innovation ability are interdependent, and the relationships among these indices have been studied by Chinese researchers.
Jiangsu, a major economic province of China, relies heavily on exports for economic development. With the recent decline in global trade, uncertainty in the external environment of the export-oriented economy of Jiangsu has increased, which inhibits its sustainable development. Therefore, during the 13th Five-Year Plan for the National Economic and Social Development of China, the Jiangsu government decided to implement strategies facilitating innovation and technological and human resource advancement to stimulate sustainable and efficient development through innovation. This study investigates whether interactions between higher education, economic development, and technological innovation were facilitated in Jiangsu, and examines the factors inhibiting sustainable development in the province. In addition, there is a very obvious difference in the level of economic development within this region. Is there any difference in the interactive relationships among the three? Which key factors restrict the sustainable development of this region? These are all the problems that need to be solved in this paper.
The purpose of this paper is to examine the relationships among higher education, economic growth, and the innovation ability in the region. The concepts of coupling and coordination applied in this paper emphasize interactive and dynamic relationships among the three. Meanwhile, this study focuses on significant differences within the research region, aiming to find the factors that restrict the sustainable development of different regions.
To achieve this goal, this paper establishes a coupling coordination evaluation index system, applies the capacitive coupling coefficient model to present a dynamic relation of interdependence and coordinative development under the interaction between the subsystems, and subsequently employs a physics-based capacitive coupling coefficient model to verify the validity of three subsystems, namely higher education, innovation ability, and regional economy. The present study selected Jiangsu—an indicative, economically developed region of China—as the empirical research area. This selection is made so as to provide beneficial advice for solving the problem of sustainable development in Jiangsu. This study also has significant implications for all developed provinces in Eastern China. The data in this paper are collected from official statistical reports and statistics yearbooks.
The remainder of this paper is organized into four sections. Section 2 presents the theoretical background; Section 3 details the study materials and methods; Section 4 discusses the coupling coordination between economic growth, higher education, and innovation ability in Jiangsu’s 13 prefecture-level municipalities; and Section 5 provides conclusions, suggestions for future research, and regional development countermeasures from the coupling coordination analysis. The results of the coupling coordination analysis and evaluation of this study can provide a reference for governments to enhance regional economies.

2. Theoretical Backgrounds

Nowadays, the world is facing more serious environmental, resource, and ecological problems, and human beings have a deeper understanding of economic development. The sustainability of a regional economy refers to the ability of this region to grow continuously by fostering a proper limit of population and economic activities without exhausting resources or degrading the environment [11]. Therefore, the indicators of sustained regional economic growth include economic scale, industrial upgrading, and welfare improvement. For a long time, scholars from various countries have been paying attention to the motive force of sustained regional economic growth. In a knowledge economy, innovation is vital for regional socioeconomic development [12,13,14,15,16,17,18,19,20,21,22,23,24]. According to the innovation theory proposed by Harvard University professor Joseph Alois Schumpeter [25], innovation ability and regional economic development promote and restrain each other.
In the era of the knowledge-based economy, most countries have continuously increased investment in research and development funds to maintain rapid economic growth. In early research, scholars found that areas with sustained economic growth in the United States often have continuous investment in research and development activities [26]. In China, State-level High-tech Industry Development Zones (SHIDZ) are a critical driver of economic growth. Every year, the Chinese government invests a large amount of R&D funds in SHIDZ. From actual observations, continuous government investment in R&D funds can enhance the innovation ability of enterprises in science parks and have a positive impact on regional industrial upgrading [27,28]. Coad et al., have constructed a large number of models to demonstrate the important role of innovation investment in regional sustainable economic growth, corporate competitiveness, and industrial upgrading [29]. Although there is a positive relationship between innovation and sustained economic growth, actual observations show that there is no direct relationship between innovation input and sustained economic growth, and innovation output is more directly related to economic growth. For example, with the same innovation investment, the results of economic growth may be different in different regions. The actual impact of innovation input also depends on the absorptive capacity of different regions for innovation [30]. According to Xiong (2020), the relationships between innovation and economic grown are complex, and social filters play important role in innovation and economic growth in different regions [31]. Some researchers have conducted empirical research based on regional innovation theory. For example, one researcher examined the coupling coordination of innovation ability and economic growth in the Yangtze River Economic Belt and its upstream provinces. The results revealed a strong connection between the region’s innovation ability and economic growth. In most provinces within the Yangtze River Economic Belt, the two indicators were more than marginally coordinated, whereas those in the four upstream provinces exhibited imbalanced development, with two provinces being highly coordinated and the remaining two being slightly coordinated [32,33]. Therefore, this paper contributes to analyze the relationship between innovation and economic growth from the spatial and temporal perspective in order to gain policy implications for different regions. We selected economic scale, economic structure, and quality of the economy as indicators of an economic growth system, and chose innovation input and output as indicators of innovation ability.
In terms of the relationship between higher education and innovation ability, researchers generally consider the two indicators to be related. Higher education provides the two core elements required for reformation: talent and innovation [22,23]. Human capital formation is a fundamental element of economic growth and innovation [13]. Higher education has undertaken the tasks of personnel training and scientific research. Therefore, universities and research centers are a source of innovation information and important providers of innovative talents. In addition, the development of innovative economy has put forward new requirements for talent training. Rusyf Balci (2019), after analyzing the innovation-based development in Turkey, has proposed that the talent training of universities must meet the development requirements of innovation [34]. These institutions must change from rote teaching methods to analytical learning. It is generally believed that there is a positive relationship between the development of higher education and innovation capacity, so almost all countries attach great importance to the development of higher education. But can higher education definitely improve the efficiency of corporate innovation? Kim (2019) studied the innovation efficiency of the Korean logistics industry, and reached a very interesting conclusion: universities and research institutions are not the most critical factor in improving the innovation efficiency of enterprises [35]. However, if it is completely separated from the innovation information of universities and research institutions, the innovation efficiency of enterprises will also decline. It can be seen that the concept of taking the enterprise as the subject of innovation cannot be ignored.
How should higher education be developed to meet the needs of innovative economic growth? According to Urbano (2014), higher education plays a great value role in creating synergies between actors of the innovation ecosystem that strengthen social and economic growth [14]. To achieve economic growth, interactions between participants in the innovation ecosystem are necessary. Factors affecting the establishment of new enterprises include received messages, human resource training by universities and research institutions, funds, markets, clients, and business opportunities relative to clients and suppliers [16]. Through such interactions, an education plan concerning entrepreneurship and the cultivation of creative and innovative professionals supported by research institutes such as universities provide the opportunity to generate knowledge and an economic network [17]. In addition, knowledge transfer between academia and industry is a major driver of innovation and economic growth because it encourages the commercialization of new scientific knowledge within an enterprise [10,12,13,14,15,16,17,18,27,28,36]. Bloedon and Stokes defined the concept of knowledge transfer as a procedure through which the production or knowledge of a useful item within an organizational environment becomes applicable in another organizational environment [19]. Knowledge generation and transfer abilities in academia are crucial factors; in particular, higher education and public research institutes are considered sources of proven science and knowledge [20]. Kruss (2015) also particularly emphasized that universities and research institutions should improve their ability to interact with other participants as a talent supply and engage in research and development activities [37]. It requires a clearer strategy, structures, and mechanism for communicating with firms, sectoral intermediaries, government, and other knowledge producers.
Since the 2000s, most countries accepted the discourse of the global knowledge economy, giving more emphasis to issues of industry-led economy, technological progress, and innovation. In this situation, many countries have increased the enrollment scale of universities, and so is China. But research exploring the relationship between higher education and sustainable economic growth is still very scarce [38]. Regarding higher education and economic development, researchers have proposed theories including the new economic growth theory, endogenous growth theory, human capital theory, and triple helix theory [10]. How much does the development of higher education contribute to sustained economic growth? In response to this problem, Ca (2006) has proposed the opposite view, that the interaction between higher education and economic growth is very limited [39]. To conduct empirical research on the relationship between provincial or national higher education and economic growth, the following methods have been employed in research: a vector autoregression model, the Johansen cointegration test, the Granger causality test, impulse response functions, variance decomposition, and a coupling coordination model. The following are crucial findings: in the short term, higher education investment is not an essential factor of economic growth. However, in the long term, higher education investment in China’s eastern, central, and western regions has a bilateral and causal relationship with economic growth; it has a strong relationship in the eastern regions and a weak one in the central and western regions [21]. Furthermore, investment in higher education and human resources positively influences economic growth, which is a motivator of higher education reforms. Socioeconomic transformation is the premise of higher education transformation, which is in turn a driver and guarantor of socioeconomic transformation.
On the whole, research on higher education, innovation ability, and economic relations has increased considerably; however, in terms of research results, most studies have focused on the relationship between two of the three indicators instead of all three indicators. Few researchers have explored the coupling coordination of higher education, innovation ability, and economic growth. Zhao Ran analyzed these indicators along with spatial evolution [40]. Zhou Yuanyuan applied measurement methods including panel data cointegration analysis and a causality test, and discovered that economic growth in the Pan Yangtze River Delta Region mainly relies on investment. In addition, regional technological innovation, higher education quality, and higher education development are influential factors for boosting economic growth [41]. The two aforementioned studies are useful references for the present study.

3. Materials and Methods
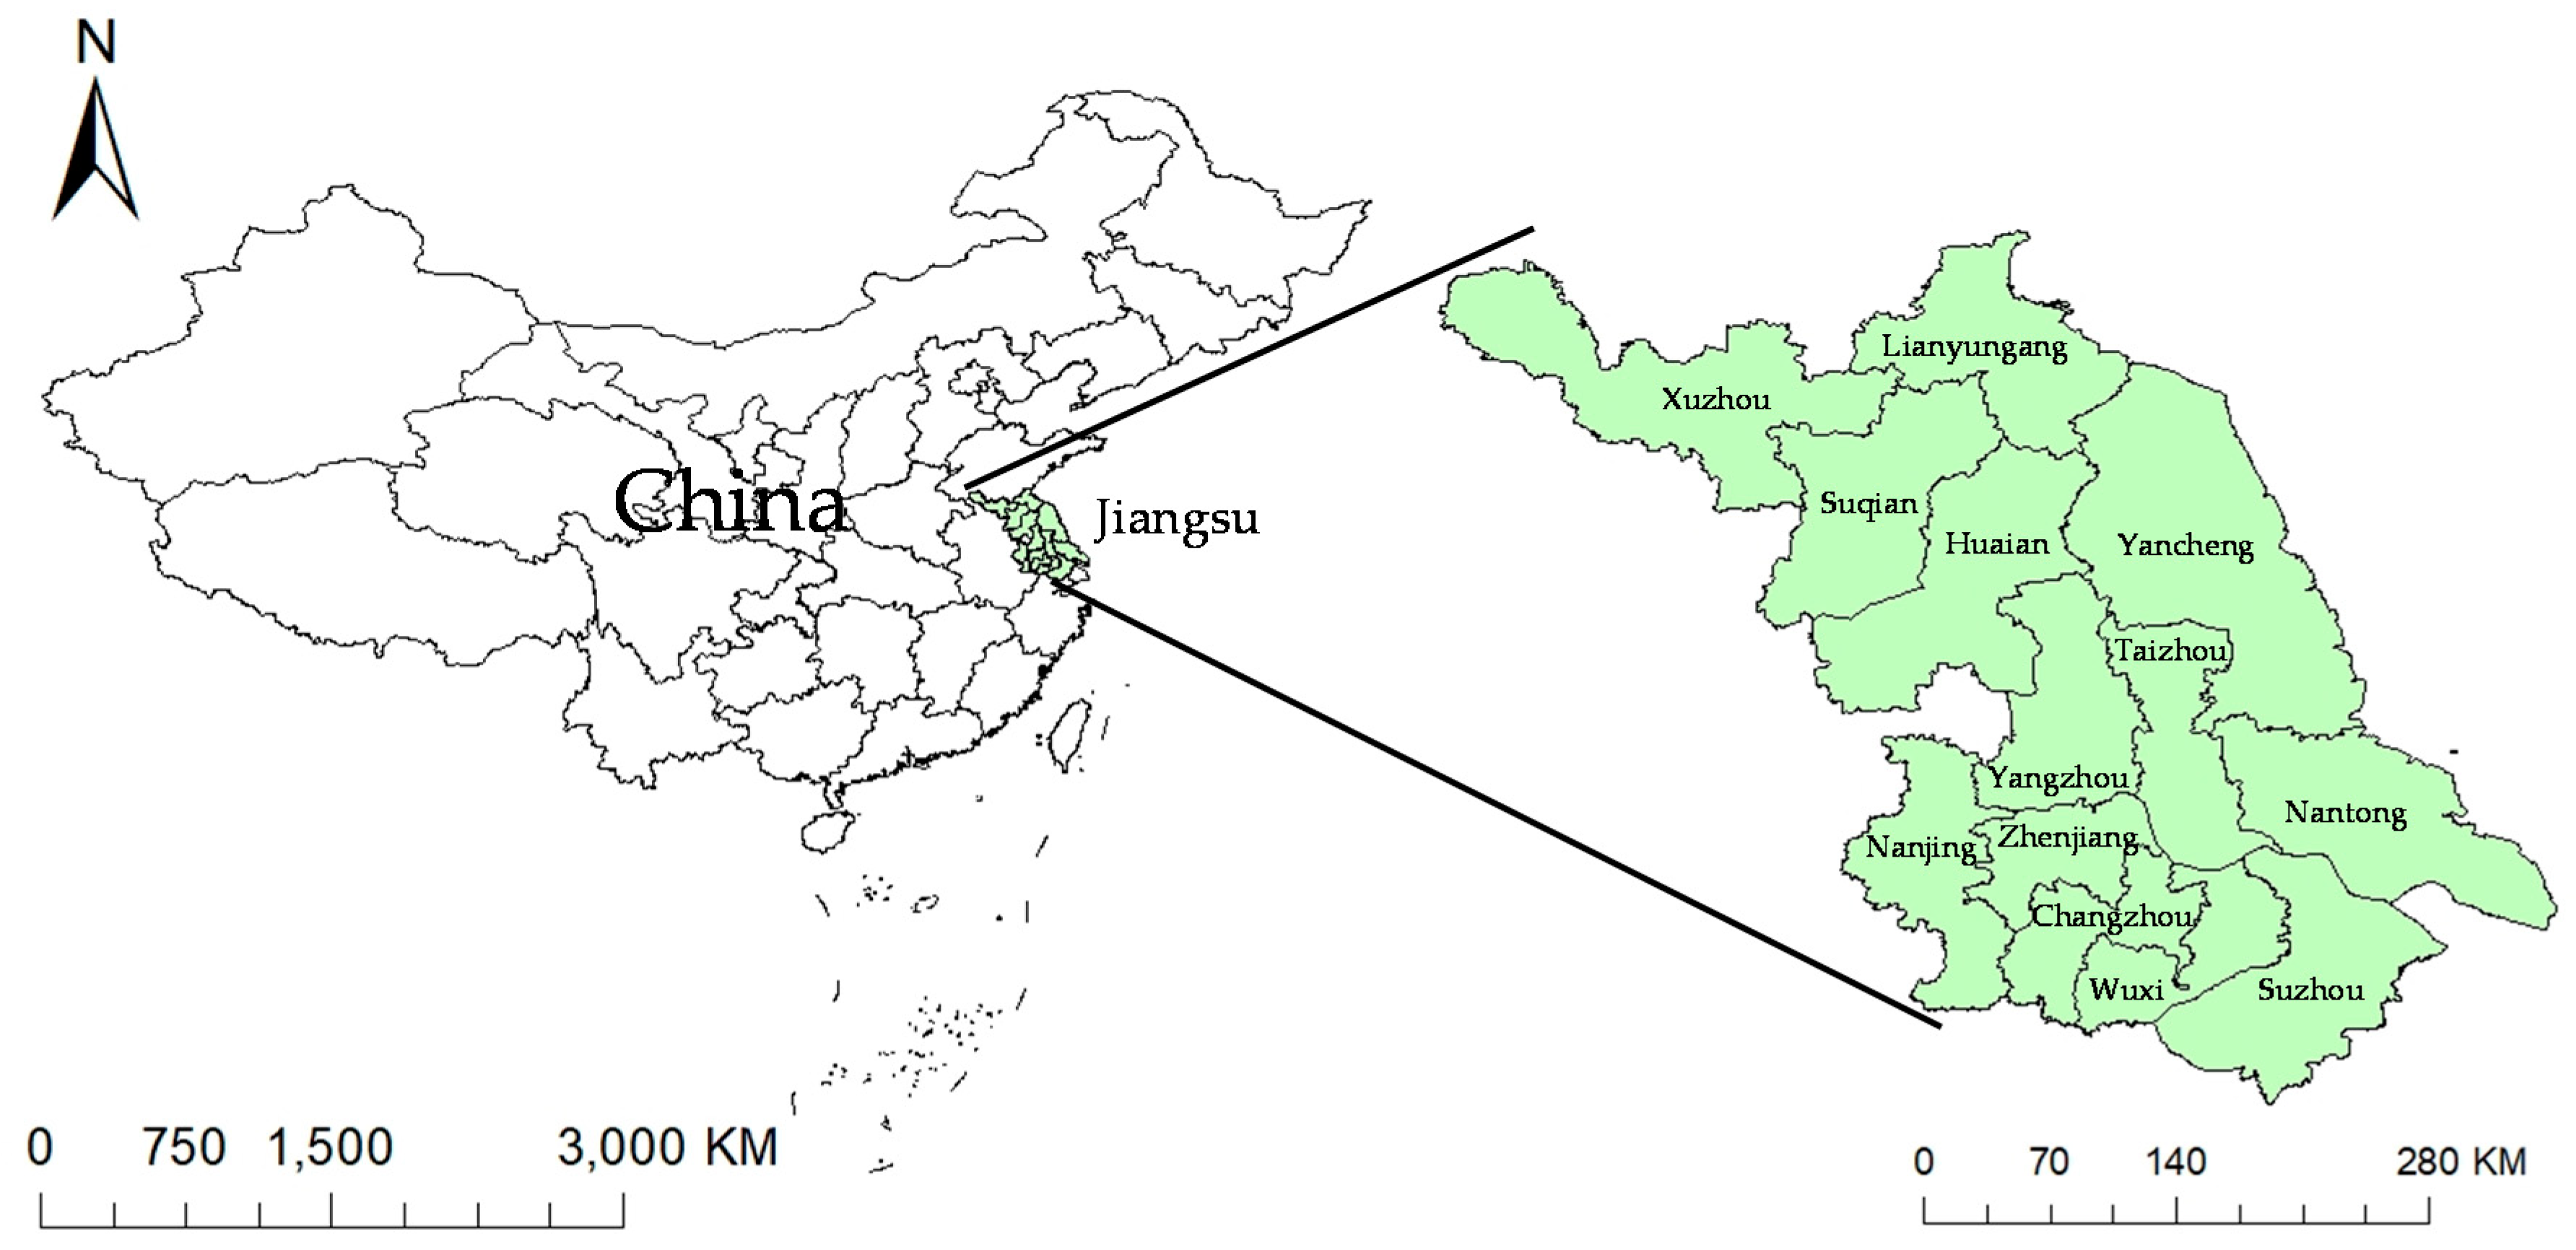
3.1. Study Area

Jiangsu is located in the eastern coastal area of China with 13 prefecture-level cities (Figure 1). Generally, Jiangsu is divided into three districts: Southern Jiangsu (encompassing Nanjing, Zhenjiang, Suzhou, Wuxi, and Changzhou), Central Jiangsu (encompassing Yangzhou, Taizhou, and Nantong), and Northern Jiangsu (encompassing Xuzhou, Huai’an, Lianyungang, Yancheng, and Suqian). Jiangsu has a robust economy. In 2019, Jiangsu achieved a gross regional product of 9963.15 billion Chinese Yuan (CNY) and was the second most economically advanced province in China, second only to Guangdong. However, the three Jiangsu districts have differences in economic development, with Southern Jiangsu being the most economically advanced and the other two districts being relatively disadvantaged in terms of economic development. Coordinated regional development is crucial to sustainable development in Jiangsu. Moreover, Jiangsu has an advanced education system featuring the most general universities of all provinces. Therefore, Jiangsu has an advantage in terms of innovation-based economy.

3.2. Establishment of the Index System and Data Source

Higher education, innovation ability, and economic growth are influenced by various complex factors; therefore, to comprehensively reveal the interaction between them, in the present study, research was conducted in accordance with the features of the three subsystems. Indices were selected to establish for economic growth, higher education, and innovation ability (Table 1) by following the principles of scientific endeavor, representativeness, comparability, and availability.
The index system was divided into three subsystems: economic growth, higher education, and innovation ability. Three first-level indices—economic scale, economic structure, and economic quality—were established in the economic growth subsystem, with six second-level indices defined under them. In the higher education subsystem, two first-level indices—education scale and education quality—were established, and six second-level indices were defined under them. In the innovation ability subsystem, two first-level indices—innovation input and output—were established, with six second-level indices under them.
The data employed in the quantitative analysis were the 18 indices of the 13 prefecture-level cities in Jiangsu, China from 2007 to 2017. Most data were collected from the statistical yearbook of each prefecture-level city and the Jiangsu Statistical Yearbook. Most data in the higher education subsystems were gathered from the China City Statistical Yearbook, and most data on research and development (R&D) expenditure as a percentage of gross domestic product were obtained from the statistical communiqué of each prefecture-level city. An interpolation method based on data from consecutive years was adopted to replace the missing data.

3.3. Index Weight Verification

In the present study, entropy was applied to verify the index weights according to the following procedure. The origin index value of the 18 indices in the coupling coordination system was assumed to be X.
(1)
Index standardization
Data standardization was required before weight verification because of the different units in each index. Let α = max (X) and β = min (X). To simplify the calculation and operation, data were converted into forward pointers. X* is the standardized index value, and its equation is as follows:
X * = [ ( X β ) / ( α β ) ] × 0.9 + 0.1
(2)
The weights (P) of each index were calculated for different prefecture-level cities and years, with α as the total number of prefecture-level cities and β as the number of prefecture-level cities in different years:
P = X * Σ a Σ b X *
(3)
The entropy (e) of each index was calculated using the following equation:
e = Σ a Σ b X * 1 n X * k , k = 1 n ab
(4)
The weight wj of each index was calculated with j as the number of indices and 1 − e as the variation coefficients:
w j = 1 e Σ j ( 1 e )

3.4. Coefficient Model of the Subsystems

Higher education, innovation ability, and economic growth are three different yet mutually interactive subsystems; hence, the contribution of the order parameters in each subsystem could be calculated through the weighted summary method using the following equation:
S λ = Σ j w j X *
where S λ indicates the degree of contributions from each subsystem to the main system; λ = 1, 2, 3, j are the numbers of indices concerning each subsystem; w j suggests the weight value of each order parameter; X* is the standardized value of each index; and S1, S2, and S3 represent economic growth, higher education, and innovation ability subsystems, respectively.

3.5. Coupling Function

The three subsystems were coupled by applying the capacitive coupling coefficient model used in physics to present a dynamic relationship of interdependence and coordinative development from the positive interaction among the subsystems and establish coupling function C x y :
C x y = 2 S x S y S x + S y
where x, y = 1, 2, and 3; x ≠ y. C x y indicates the level of coupling for systems x and y; the level was between 0 and 1. A high C value suggested a high level of coupling between the two subsystems. The levels of coupling were categorized based on C values, and the standards defined by the present study are presented in Table 2.

3.6. Coupling Coordination Model

The coupling function can only determine the level of connection among subsystems but cannot decide their level of coordination; accordingly, the coupling coordination function was employed to examine the level of coordination among subsystems and analyze the level of coordinated development and stages of development for each region. The equations are as follows:
D x y = C x y × T x y
T x y = α S x + β S y
where D x y indicates the level of coupling coordination of systems x and y; T x y reflects the comprehensive evaluation indices of the overall synergy effects concerning systems x and y; and a high D value suggests improved coordination among the subsystems. Furthermore, α and β are coefficients to be determined; thus, α + β = 1, and let α = β = 0.5 because the coordinated development of economic growth, innovation ability, and higher education has equal importance.
Evaluations were conducted from the classification standard of the coupling coordination value proposed by Zhao Ran [10], as displayed in Table 3.

4. Results and Discussion

4.1. Coupling Level Analysis

The level of coupling obtained from Equation (6) was applied to calculate the coupling levels of the following subsystem pairs: economic growth–higher education (C12), higher education–innovation ability (C23), and economic growth–innovation ability (C13). The results are presented in Table 4. In general, these aforementioned systems were all highly coupled (C > 0.8), which implied that economic growth, higher education, and innovation ability were closely related.
Economic growth supports the materials required in higher education development, and higher education cultivates innovative professionals to boost economic growth; furthermore, an enhanced regional innovation ability promotes economic development, and economic development provides regional innovation through funding. Each set of two factors (of the three) could mutually promote and develop mutual prosperity.

4.2. Economic Growth–Higher Education Coupling Coordination Analysis

D (level of coupling coordination) was calculated from Equations (6)–(8), and the results are presented in Table 5. Figure 2 displays temporal changes related to the coupling coordination level of higher education and economic growth. From 2007 to 2017, D exhibited a rising trend. The level of coupling coordination in all 18 prefecture-level cities increased and covered all four stages, from slightly coordinated to extremely coordinated. In 2007, only Nanjing and Suzhou were highly coordinated, whereas the remaining regions were all slightly and moderately coordinated. In 2014, the D for all prefecture-level cities exceeded 0.4 and reached a moderately coordinated level or above. The variation trend of the economic growth–higher education system was stable. For the 13 cities of Jiangsu, Nanjing was in the lead in 2014 in terms of coupling coordination; it reached an extremely coordinated level. In 2017, D for Suqian and Lainyungang remained below 0.5, which indicated no improvement in coupling coordination.
The coupling coordination of economic growth–higher education increased; however, it was unclear which of the two subsystems (economic growth or higher education) dominated. Therefore, the coupling coordination of economic growth–higher education was evaluated from Table 3 (Table 5). In 2007, all regions except for Nanjing and Wuxi had synchronized development in higher education and economic growth. The contribution of higher education to the local economy in Nanjing had yet to improve, whereas higher education in Wuxi did not keep pace with economic growth. A decade later, in 2017, Nanjing had synchronized and stable growth in economic growth–higher education development, and the level of coupling coordination in the other cities notably increased too. However, problems were exposed during development; for example, economic development in Lianyungang was slightly faster than that of higher education; however, the remaining cities had backward higher education, which indicated that improving higher education is key for promoting balanced regional development.

4.3. Economic Growth–Innovation Ability Coupling Coordination Analysis

Through the aforementioned method, a line chart (Figure 3) was created based on the coupling coordination values listed in Table 6, and trend variations in economic growth–innovation ability coupling coordination in Jiangsu from 2007 to 2017 were analyzed. Generally, the coupling coordination values rose continuously, and the coupling coordination in all prefecture-level cities in Jiangsu increased. By 2012, the coupling coordination value of all prefecture-level cities exceeded 0.4, indicating moderate coordination and above. Nanjing ranked first in all years. In 2015, Nanjing and Suzhou reached the level of extreme coordination, followed by Wuxi in 2017.
An in-depth analysis revealed that the development of the innovation ability–economic growth system covered four stages: slightly coordinated to extremely coordinated. In 2007, Nanjing and Suzhou had a highly coordinated innovation ability (underdeveloped), and Wuxi had highly coordinated and synchronized development in terms of innovation ability and economic growth. Xuzhou, Changzhou, Taizhou, Nantong, Zhenjiang, and Yangzhou had moderately coordinated synchronized development in innovation ability and economic growth, and Huaian, Yancheng, Lianyungang, and Suqian had slightly coordinated and synchronized development in innovation ability and economic growth. In 2012, coupling coordination in regions excluding Nanjing, Wuxi, and Suzhou increased; however, underdeveloped innovation ability was noted in many regions, including Nanjing, Changzhou, and Suzhou. By 2017, coupling coordination in all regions improved from the situation in 2007. Suqian had moderately coordinated and synchronized development in higher education and economic growth, whereas the innovation ability of other cities lagged behind the economic development. This indicated that innovation ability is a factor for economic growth, whereas economic growth is not the most crucial factor for innovation ability. Therefore, enhancing innovation ability is a major step for promoting regionally balanced development.

4.4. Higher Education–Innovation Ability Coupling Coordination Analysis

Coupling coordination of higher education–innovation ability increased year-to-year. In 2007, the coupling coordination of the two indicators fluctuated around a certain value; however, Nanjing already had highly coordinated development, with the development of innovation ability being slightly behind that of higher education. Lianyungang, Huaian, Suqian, Yancheng, and Taizhou were slightly coordinated, and the remaining regions were moderately coordinated; in addition, all regions had synchronized development concerning the two indicators. In 2017, coupling coordination in Nanjing was above 0.8; the area underwent extremely coordinated development. Wuxi, Suzhou, Xuzhou, Nantong, and Yangzhou were highly coordinated, and the remaining regions were all moderately coordinated. The accumulation of human resources and technology became the main factors of economic growth, and higher education—through which scientific knowledge is created, integrated, spread, and applied—was highly associated with the two factors. The development of higher education significantly influences the innovation ability of a region and the speed and pattern of regional economic development. Thus, the problem Jiangsu currently faces is imbalanced development in higher education and regional technological innovation ability. Therefore, the present study examined the spatial evolution of higher education–innovation ability coupling coordination in Jiangsu (Table 7).
To examine the spatial evolution of higher education–innovation ability coupling coordination, ArcGIS data visualization was applied to statistically analyze coupling coordination, as displayed in Figure 4. On the basis of the spatial distribution, coupling coordination in Southern Jiangsu was generally higher than that in the northern regions; in addition, the results in Southern, Central, and Northern Jiangsu were distributed in a gradient trend. This indicated that Nanjing had the highest level of coupling coordination and reached the level of extreme coordination in 2012. Nanjing, the administrative center of Jiangsu, possesses a rich culture and long history; furthermore, with several Project 985 and 211 colleges and universities in the region, including Nanjing University, Nanjing Normal University, and Hohai University, outstanding talent is cultivated, and this enhances innovation ability. However, other regions such as Huaian, Lianyungang, and Suqian were not highly coordinated in higher education and innovation ability, because these regions have limited educational resources. Hence, improving the quality of higher education and increasing investment in regional innovation and talent are key to achieving balanced development and industrial transformation.

5. Conclusions and Implications

The coupling coordination evaluation index system established in the present study was divided into three subsystems: economic growth, higher education, and innovation ability. In addition, six first-level and 18 second-level indices were defined. Entropy was applied to verify the index weights, and a coupling function and coupling coordination model were employed to analyze the coupling coordination of the three subsystems in Jiangsu, China to confirm the effectiveness of the evaluation system. From the results, the following conclusions were reached:
  • From 2007 to 2017, the coupling coordination of the 13 prefecture-level cities in Jiangsu increased. This indicated an excellent interaction overall between higher education, economic development, and innovation capacity in Jiangsu, which positively influenced sustainable development in the province.
  • In 2017, economic growth and higher education in Nanjing in 2017 underwent synchronized development and steady increases. The remaining regions also exhibited noticeable increases; however, problems arose during development. The economic growth of Lianyungang fell behind higher education development, and the other regions required improvements in the development of higher education. In summary, higher education resources in Jiangsu are excessively concentrated in the capital, which results in uneven spatial distribution. In particular, higher education resources are insufficient in economically disadvantaged Northern Jiangsu. This impedes innovation-based economic development in the district.
  • In the economic growth–innovation ability system, the coupling coordination of all regions improved in 2017 compared with the situation in 2007. Only Suqian had moderately coordinated synchronized development in higher education and economic development. The remaining regions exhibited imbalanced development in innovation ability and economic growth, with the development of innovation ability falling behind. This revealed that innovation ability influences economic growth; however, economic growth is not the most crucial factor for regional innovation ability. Enhancing innovation ability substantially promotes regional balanced development.
  • In the higher education–innovation ability system, coupling coordination in regions apart from Nanjing required improvement because of their limited higher education resources. Therefore, enhancing the quality of higher education and increasing investment in regional innovation and talent are critical to achieving balanced regional development and industrial transformation.
In summary, Jiangsu is a province with advanced economic and educational development and has notable advantages in terms of innovation-based economy. Overall, the interactions between economic development, higher education, and innovation capacity became increasingly satisfactory, reinforcing the province’s success in sustainable development. However, differences in development were noted between the three Jiangsu districts. Highly coordinated development between economic growth, higher education, and innovation ability was noted in Southern Jiangsu, particularly in Nanjing and Suzhou. By contrast, coordinated development among these systems in Central and Northern Jiangsu was unsatisfactory. Innovation ability and higher education development in these two districts lagged behind economic development, and their higher education development lagged behind their innovation ability.
For future development, stakeholders in Jiangsu should focus on solving the uneven spatial distribution of higher education resources. Capital investment is required to establish additional high-quality universities in Central and Northern Jiangsu to satisfy human resource requirements for innovation. Connotative construction within these universities should be reinforced for human resource development in universities to fulfill the requirements for developing emerging industries in Central and Northern Jiangsu. In addition, support for human resource development in these two districts should be reinforced through policies. Economic disadvantages in Northern Jiangsu critically inhibit its attraction of high-quality personnel. A stable policy that gives preference to human resources should hasten the introduction of high-quality human resources in the district.
The Chinese government should encourage universities to cooperate with enterprises to enhance the positive effect of innovation on economic development. The innovation ability of enterprises should be fully utilized, and R&D investment from enterprises should be reinforced to strengthen their technological innovation and resource integration. Moreover, the government should encourage enterprises to cooperate with universities and research institutes to establish high-level technology centers, engineering technology research centers, and valuable patent development and demonstration centers.
Despite the importance of this study, this study also has disadvantages in that it considers only the interactive relationships among higher education, economic growth, and innovation ability from the perspective of space and time evolution. In future study, we will make an in-depth analysis on the mechanisms of the interaction among the three. In the following study, we will present a richer discussion by data from various firms, universities, and various cases from different regions.

Author Contributions

Conceptualization and research design, H.X.; data curation, H.X. and W.-L.H.; formal analysis, H.X. and W.-L.H.; resources, H.X. and W.-L.H.; visualization, H.X.; writing—original draft, H.X. and J.H.Z., writing—review and editing, H.X. and T.-H.M. All authors have read and agreed to the published version of the manuscript.

Funding

This research was funded by the National Natural Science Foundation of China (grant: 41371136).

Acknowledgments

We are grateful to the editor and anonymous reference for their comments. In addition, we would like to thank Ziwen Feng who studies in Huaiyin Normal University for her great contribution to the typesetting and proofreading of the article.

Conflicts of Interest

The authors declares no conflicts of interest.

References

  1. United Nations. Agenda for Sustainable Development. Resolution Adopted by the General Assembly on 25 September 2015 (A/70/L.1). Available online: http://sustainabledevelopment.un.org/post2015/transformingourworld (accessed on 16 January 2020).
  2. Cebrián, G.; Junyent, M.; Mulà, I. Competencies in Education for Sustainable Development: Emerging Teaching and Research Developments. Sustainability 2020, 12, 579. [Google Scholar] [CrossRef] [Green Version]
  3. Soyer, K.; Ozgit, H.; Rjoub, H. Applying an Evolutionary Growth Theory for Sustainable Economic Development: The Effect of International Students as Tourists. Sustainability 2020, 12, 418. [Google Scholar] [CrossRef] [Green Version]
  4. Januškaitė, V.; Užienė, L. Intellectual Capital as a Factor of Sustainable Regional Competitiveness. Sustainability 2018, 10, 4848. [Google Scholar] [CrossRef] [Green Version]
  5. Gao, W.; Ding, X.; Chen, R.; Min, W. An Empirical Study of the Role of Higher Education in Building a Green Economy. Sustainability 2019, 11, 6823. [Google Scholar] [CrossRef] [Green Version]
  6. Chen, Q.; Li, Y. Mobility, Knowledge Transfer, and Innovation: An Empirical Study on Returned Chinese Academics at Two Research Universities. Sustainability 2019, 11, 6454. [Google Scholar] [CrossRef] [Green Version]
  7. Meyer, J.B. Network approach versus brain drain: Lessons from the diaspora. Int. Migr. 2001, 39, 91–110. [Google Scholar] [CrossRef]
  8. Siekierski, P.; Lima, M.C.; Borini, F.M.; Pereira, R.M. International academic mobility and innovation: A literature review. J. Glob. Mobil. Home Expatr. Manag. Res. 2018, 6, 285–298. [Google Scholar] [CrossRef]
  9. Pedro, E.d.M.; Leitão, J.; Alves, H. Bridging Intellectual Capital, Sustainable Development and Quality of Life in Higher Education Institutions. Sustainability 2020, 12, 479. [Google Scholar] [CrossRef] [Green Version]
  10. Ye, W.; Wang, Y. Exploring the Triple Helix Synergy in Chinese National System of Innovation. Sustainability 2019, 11, 6678. [Google Scholar] [CrossRef] [Green Version]
  11. Liu, Y.; Liang, Y.; Ma, S.; Huang, K. Divergent developmental trajectories and strategic coupling in the Pearl River Delta: Where is a sustainable way of regional economic growth? Sustainability 2017, 9, 1782. [Google Scholar] [CrossRef] [Green Version]
  12. Portuguez Castro, M.; Ross Scheede, C.; Gómez Zermeño, M.G. The Impact of Higher Education on Entrepreneurship and the Innovation Ecosystem: A Case Study in Mexico. Sustainability 2019, 11, 5597. [Google Scholar] [CrossRef] [Green Version]
  13. Levie, J.; Autio, E. Regulatory burden, rule of law, and entry of strategic entrepreneurs: An international panel study. J. Manag. Stud. 2011, 48, 1392–1419. [Google Scholar] [CrossRef]
  14. Urbano, D.; Alvarez, C. Institutional dimensions and entrepreneurial activity: An international study. Small Bus. Econ. 2014, 42, 703–716. [Google Scholar] [CrossRef]
  15. Amorós, J.E.; Poblete, C.; Mandakovic, V. R&D transfer, policy and innovative ambitious entrepreneurship: Evidence from Latin American countries. J. Technol. Transf. 2019, 44, 1396–14155. [Google Scholar]
  16. Van Stel, A.; Suddle, K. The impact of new firm formation on regional development in the Netherlands. Small Bus. Econ. 2008, 30, 31–47. [Google Scholar] [CrossRef] [Green Version]
  17. Florida, R. The creative class and economic development. Econ. Dev. Q. 2014, 28, 196–205. [Google Scholar] [CrossRef]
  18. Mowery, D.C.; Nelson, R.R.; Sampat, B.N.; Ziedonis, A.A. Ivory Tower and Industrial Innovation: University-Industry Technology Transfer Before and After the Bayh-Dole Act; Stanford University Press: Palo Alto, CA, USA, 2015. [Google Scholar]
  19. Bloedon, R.V.; Stokes, D.R. Making university/industry collaborative research succeed. Res. Technol. Manag. 1994, 37, 44–48. [Google Scholar] [CrossRef]
  20. Landry, R.; Amara, N.; Ouimet, M. Determinants of knowledge transfer: Evidence from Canadian university researchers in natural sciences and engineering. J. Technol. Transf. 2007, 32, 561–592. [Google Scholar] [CrossRef]
  21. Xu, A. An Analysis of the Measurement and the Coupling Degree of Higher Education Investmentand Economic Growth—Based on Provincial Panel Data in China. J. Shandong Univ. Financ. 2011, 5, 73–79. [Google Scholar]
  22. Li, C.; Xie, A.; Fan, D.; Liu, Z.; Chen, J.; Xu, C.; Li, J.; Huang, B.; Zhuo, Z. The Group Talks about Construction of Higher Education of Guangdong-Hong Kong-Macao Greater Bay Area. Mod. Educ. J. 2019, 01, 11–13+19-20. (In Chinese) [Google Scholar]
  23. Shi, W.-X. Structure, Pattern and Spirit: A Study on the Construction of the Supply-Side Reform of Higher Education. J. Baoji Univ. Arts Sci. (Soc. Sci.) 2019, 39, 124–128. [Google Scholar]
  24. Leal-González, M.; Parada-Avila, J.; Gómez-Zermeño, M.G.; de la Garza, L.A. A Model for Innovation and Global Competitiveness: The Monterrey International City of Knowledge Program (MICK). In Innovation Support in Latin America and Europe; Routledge: London, UK, 2016; pp. 121–144. [Google Scholar]
  25. Schumpeter, J.A. Business Cycles; McGraw-Hill: New York, NY, USA, 1939; Volume 1. [Google Scholar]
  26. Horowitz, I. The relationship between interstate variations in the growth of R&D and economic activity. IEEE Trans. Eng. Manag. 1967, 135–141. [Google Scholar] [CrossRef]
  27. Wang, Q.; Yang, R.; Zhao, R.; Wang, C. Does State-level Upgrade of High-tech Zones Promote Urban Innovation Efficiency: Evidence from China. Sustainability 2019, 11, 6071. [Google Scholar] [CrossRef] [Green Version]
  28. Guo, D.; Guo, Y.; Jiang, K. Government-subsidized R&D and firm innovation: Evidence from China. Res. Policy 2016, 45, 1129–1144. [Google Scholar]
  29. Coad, A.; Grassano, N.; Hall, B.H.; Moncada-Paternò-Castello, P.; Vezzani, A. Innovation and industrial dynamics. Struct. Chang. Econ. Dyn. 2019, 50, 126–131. [Google Scholar] [CrossRef]
  30. Zeng, J.; Liu, Y.; Wang, R.; Zhan, P. Absorptive capacity and regional innovation in China: An analysis of patent applications, 2000–2015. Appl. Spat. Anal. Policy 2019, 12, 1031–1049. [Google Scholar] [CrossRef]
  31. Xiong, A.; Xia, S.; Ye, Z.P.; Cao, D.; Jing, Y.; Li, H. Can Innovation Really Bring Growth? The Role of Social Filter in China. Struct. Chang. Econ. Dyn. 2020, 53, 50–61. [Google Scholar] [CrossRef]
  32. Tan, H.-Y.; Zhou, X.; Deng, X. Research on the Coupling and Coordinated Relationship between Innovation Capability and Economic Development in the Upper Reaches of the Yangtze River. J. Guizhou Univ. Commer. 2018, 31, 41–47. [Google Scholar]
  33. Peng, D.; Liu, C.; Zhou, Y. Research on the Coordinated Development of Regional Economic Growth and Innovation Ability: An Example of the Yangtze River Economic Belt. Sci. Technol. Manag. Res. 2016, 36, 104–110+121. [Google Scholar]
  34. Balci, Y. Some Critical Issues in Innovation and Economic Development: Lessons from the Recent Turkish Experience. Procedia Comput. Sci. 2019, 158, 609–624. [Google Scholar] [CrossRef]
  35. Kim, C.; Shin, W.S. Does Information from the Higher Education and R&D Institutes Improve the Innovation Efficiency of Logistic Firms? Asian J. Shipp. Logist. 2019, 35, 70–76. [Google Scholar]
  36. Anderson, M.; Edgar, D.; Grant, K.; Halcro, K.; Devis, J.M.R.; Genskowsky, L.G. Innovation Support in Latin America and Europe: Theory, Practice and Policy in Innovation and Innovation Systems; Routledge: London, UK, 2016. [Google Scholar]
  37. Kruss, G.; McGrath, S.; Petersen, I.-H.; Gastrow, M. Higher education and economic development: The importance of building technological capabilities. Int. J. Educ. Dev. 2015, 43, 22–31. [Google Scholar] [CrossRef]
  38. Oketch, M.; McCowan, T.; Schendel, R. The Impact of terTiary Education on Development; University of London: London, UK, 2014. [Google Scholar]
  39. Tran, N.C. Universities as Drivers of the Urban Economies in Asia: The case of Vietnam; The World Bank: Washington, DC, USA, 2006. [Google Scholar]
  40. Zhao, R.; Han, X. On Coordinated Development of Higher Education, Innovation Ability and Economic Growth—A Case Study of Henan Province. Heilongjiang Res. High. Educ. 2019, 37, 23–29. [Google Scholar]
  41. Zhou, Y. An Empirical Study of Higher Education Development and Economic Growth: Based on the Panel Data in Four Provinces and One City of East China. J. Liuzhou Teach. Coll. 2013, 28, 106–109. [Google Scholar]
Figure 1. Location and administrative areas of the study.
Sustainability 12 02515 g001
Figure 2. Variations in economic growth–higher education coupling coordination in Jiangsu, China.
Sustainability 12 02515 g002
Figure 3. Variations in economic growth–innovation ability coupling coordination in Jiangsu, China.
Sustainability 12 02515 g003
Figure 4. Spatial evolution of higher education–innovation ability coupling coordination in Jiangsu, China.
Sustainability 12 02515 g004
Table 1. Coupling coordination evaluation index system concerning economic growth, higher education, and innovation ability.
Coupling SystemFirst-Level IndexSecond-Level IndexUnitWeight
Economic growth subsystem S1Economic scaleGross regional product Hundred million CNY0.2144
Total retail sales of consumer goodsHundred million CNY0.2050
Economic structurePercentage of GDP of the tertiary industry%0.1518
Tertiary industry employees as a percentage of the total employees %0.1134
Quality of economyDisposable income per capita of town residentsCNY0.1372
Regional GDP per capitaCNY/person0.1782
Higher education subsystem S2Education scaleNumbers of colleges and universities---0.1622
Numbers of full-time teachers in colleges
and universities
People0.1948
Numbers of college and university studentsPeople0.2054
Numbers of college and university enrollmentsPeople0.1811
Numbers of college and university graduatesPeople0.1974
Quality of education Teacher–student ratio in colleges and universities%0.0591
Innovation ability subsystem S3Innovation inputNumbers of above-scale industrial enterprises with R&D activities---0.1623
R&D expenditure of above-scale industrial enterprisesTen thousand CNY0.2408
R&D expenditure as a percentage of GDP %0.0674
Number of R&D staffPeople0.1550
Innovation outputPatent applicationsPieces0.1811
Output values of new productsTen thousand CNY0.1934
Table 2. Levels of coupling.
C ValueLevels of Coupling
0 ≤ C ≤ 0.4Uncoupled
0.4 < C ≤ 0.6Slightly coupled
0.6 < C ≤ 0.8Moderately coupled
0.8 < C ≤ 1Highly coupled
Table 3. Levels of coupling coordination for economic growth, higher education, and innovation ability.
Coupling Coordination (D)Levels of CouplingRelationships between S1, S2, and S3Grading
0 < D ≤ 0.4Slightly coordinated CS1−S2 > 0.1Slightly coordinated–higher education backwardness, Ca
S2−S1 > 0.1Slightly coordinated–economic growth backwardness, Cb
0 ≤|S1−S2|≤ 0.1Slightly coordinated–synchronized development in higher education and economic growth, Cc
S1−S3 > 0.1Slightly coordinated–innovation ability backwardness, Cd
S3−S1 > 0.1Slightly coordinated–economic growth backwardness, Ce
0 ≤ |S1−S3| ≤ 0.1Slightly coordinated–synchronized development in innovation ability and economic growth, Cf
S2−S3 > 0.1Slightly coordinated–innovation ability backwardness, Cg
S3−S2 > 0.1Slightly coordinated–higher education backwardness, Ch
0 ≤ |S2−S3| ≤ 0.1Slightly coordinated–synchronized development in higher
education and innovation ability, Ci
0.4 < D ≤ 0.5Moderately coordinated BS1−S2 > 0.1Moderately coordinated–higher education backwardness, Ba
S2−S1 > 0.1Moderately coordinated–economic growth backwardness, Bb
0 ≤ |S1−S2 |≤ 0.1Moderately coordinated–synchronized development in higher education and economic growth, Bc
S1−S3 > 0.1Moderately coordinated–innovation ability backwardness, Bd
S3−S1 > 0.1Moderately coordinated–economic growth backwardness, Be
0 ≤ |S1−S3| ≤ 0.1Moderately coordinated–synchronized development in innovation ability and economic growth, Bf
S2−S3 > 0.1Moderately coordinated–innovation ability backwardness, Bg
S3−S2 > 0.1Moderately coordinated–higher education backwardness, Bh
0 ≤ |S2−S3| ≤ 0.1Moderately coordinated–synchronized development in higher education and innovation ability, Bi
0.5 < D ≤ 0.8Highly coordinated AS1−S2 > 0.1Highly coordinated–higher education backwardness, Aa
S2−S1 > 0.1Highly coordinated–economic growth backwardness, Ab
0 ≤ |S1−S2| ≤ 0.1Highly coordinated–synchronized development in higher
education and economic growth, Ac
S1−S3 > 0.1Highly coordinated–innovation ability backwardness, Ad
S3−S1 > 0.1Highly coordinated–economic growth backwardness, Ae
0 ≤ |S1−S3| ≤ 0.1Highly coordinated–synchronized development in innovation ability and economic growth, Af
S2−S3 > 0.1Highly coordinated–innovation ability backwardness, Ag
S3−S2 > 0.1Highly coordinated–higher education backwardness, Ah
0 ≤ |S2−S3| ≤ 0.1Highly coordinated–synchronized development in higher
education and innovation ability, Ai
0.8 < D < 1Exceedingly coordinated SS1−S2 > 0.1Exceedingly coordinated–higher education backwardness, Sa
S2−S1 > 0.1Exceedingly coordinated–economic growth backwardness, Sb
0 ≤ |S1−S2| ≤ 0.1Exceedingly coordinated–synchronized development in higher education and economic growth, Sc
S1−S3 > 0.1Exceedingly coordinated–innovation ability backwardness, Sd
S3−S1 > 0.1Exceedingly coordinated–economic growth backwardness, Se
0 ≤ |S1−S3| ≤ 0.1Exceedingly coordinated–synchronized development in innovation ability and economic growth, Sf
S2−S3 > 0.1Exceedingly coordinated–innovation ability backwardness, Sg
S3−S2 > 0.1Exceedingly coordinated–higher education backwardness, Sh
0 ≤ |S2−S3| ≤ 0.1Exceedingly coordinated–synchronized development in higher education and innovation ability, Si
Table 4. Level of coupling among economic growth, higher education, and innovation ability in 13 prefecture-level cities in Jiangsu, China.
Region/YearIndex2007 2008 2009 2010 2011 2012 2013 2014 2015 2016 2017
NanjingC120.957 0.953 0.955 0.970 0.973 0.983 0.993 0.996 0.998 1.000 1.000
C230.893 0.873 0.897 0.909 0.923 0.943 0.973 0.975 0.979 0.984 0.984
C130.983 0.976 0.986 0.981 0.985 0.987 0.994 0.992 0.989 0.989 0.988
WuxiC120.964 0.956 0.948 0.933 0.908 0.894 0.883 0.869 0.862 0.841 0.823
C230.991 0.989 0.975 0.959 0.932 0.913 0.893 0.896 0.897 0.884 0.877
C130.991 0.989 0.994 0.996 0.998 0.999 1.000 0.998 0.996 0.995 0.993
XuzhouC120.998 1.000 0.999 0.993 0.989 0.981 0.971 0.960 0.949 0.938 0.927
C230.993 0.994 0.999 1.000 0.998 0.997 0.993 0.995 0.994 0.986 0.990
C130.998 0.995 0.998 0.994 0.997 0.993 0.992 0.982 0.976 0.982 0.968
ChangzhouC121.000 0.997 0.990 0.973 0.954 0.945 0.911 0.903 0.882 0.865 0.872
C230.996 0.999 0.997 0.986 0.982 0.980 0.945 0.940 0.929 0.918 0.943
C130.994 0.993 0.998 0.998 0.993 0.991 0.995 0.995 0.992 0.991 0.982
SuzhouC120.985 0.977 0.972 0.961 0.947 0.928 0.916 0.906 0.898 0.886 0.878
C230.999 1.000 0.999 0.990 0.977 0.974 0.954 0.958 0.959 0.944 0.943
C130.979 0.979 0.983 0.990 0.993 0.987 0.993 0.988 0.984 0.988 0.985
NantongC120.982 0.974 0.967 0.960 0.938 0.919 0.900 0.887 0.872 0.856 0.845
C230.995 0.989 0.984 0.958 0.933 0.939 0.930 0.936 0.927 0.923 0.924
C130.996 0.996 0.997 1.000 1.000 0.998 0.997 0.991 0.990 0.986 0.981
LianyungangC120.985 0.976 0.968 0.961 0.952 0.937 0.925 0.925 0.909 0.897 0.889
C231.000 1.000 0.999 0.997 0.994 0.988 0.983 0.978 0.973 0.966 0.971
C130.985 0.979 0.980 0.979 0.979 0.978 0.977 0.982 0.979 0.978 0.969
HuaianC120.996 0.994 0.991 0.978 0.969 0.957 0.942 0.928 0.915 0.902 0.895
C230.997 0.996 0.997 0.999 1.000 1.000 0.998 0.995 0.989 0.980 0.980
C130.986 0.981 0.979 0.970 0.970 0.964 0.960 0.958 0.963 0.967 0.963
YanchengC120.991 0.988 0.980 0.964 0.953 0.938 0.921 0.912 0.894 0.886 0.874
C230.999 0.999 1.000 1.000 0.998 0.997 0.992 0.990 0.985 0.960 0.960
C130.983 0.978 0.976 0.966 0.969 0.959 0.961 0.958 0.955 0.977 0.972
YangzhouC120.996 0.990 0.980 0.961 0.945 0.930 0.916 0.903 0.884 0.864 0.853
C231.000 0.999 0.995 0.990 0.988 0.982 0.973 0.966 0.947 0.937 0.934
C130.998 0.995 0.995 0.990 0.983 0.981 0.982 0.981 0.985 0.983 0.980
ZhenjiangC120.996 0.991 0.985 0.971 0.950 0.931 0.910 0.901 0.886 0.876 0.871
C231.000 1.000 1.000 0.996 0.990 0.989 0.975 0.944 0.935 0.927 0.957
C130.995 0.994 0.983 0.989 0.984 0.973 0.977 0.993 0.991 0.991 0.972
TaizhouC120.987 0.976 0.971 0.956 0.938 0.919 0.909 0.902 0.886 0.870 0.852
C230.916 0.864 0.827 0.820 0.807 0.836 0.856 0.806 0.846 0.849 0.832
C130.997 0.997 0.998 0.993 0.986 1.000 0.989 0.993 0.991 0.992 0.986
SuqianC120.999 0.993 0.991 0.972 0.960 0.958 0.942 0.981 0.915 0.899 0.885
C231.000 1.000 1.000 0.999 0.998 0.983 0.966 0.993 0.944 0.938 0.952
C130.998 0.994 0.992 0.979 0.975 0.994 0.996 0.997 0.996 0.994 0.983
Table 5. Coupling coordination of economic growth–higher education in Jiangsu, China.
Region/Year20072008200920102011201220132014201520162017
Nanjing0.7200.7600.7860.8240.8570.8740.8810.8940.9130.9300.960
AbAbAbSbSbSbSbSbScScSc
Wuxi0.4960.5140.5270.5430.5560.5680.5780.5890.5980.6090.621
BaAaAaAaAaAaAaAaAaAaAa
Xuzhou0.4310.4490.4640.4820.4980.5140.5290.5420.5550.5690.581
BcBcBcBcBcAaAaAaAaAaAa
Changzhou0.4570.4800.4980.5160.5250.5460.5450.5540.5640.5760.604
BcBcBcAaAaAaAaAaAaAaAa
Suzhou0.5220.5570.5790.6050.6230.6400.6570.6760.6900.7060.724
AcAaAaAaAaAaAaAaAaAaAa
Nantong0.4230.4410.4530.4570.4680.4830.4990.5140.5270.5400.556
BcBcBaBaBaBaBaAaAaAaAa
Lianyungang0.3730.3830.3900.4030.4100.4200.4320.4330.4430.4500.459
CcCcCcBcBcBcBbBbBbBbBb
Huaian0.3990.4140.4280.4390.4470.4590.4680.4770.4880.4980.505
CcBcBcBcBaBaBaBaBaBaAa
Yancheng0.3920.4060.4160.4330.4410.4520.4640.4690.4820.4940.506
CcBcBcBaBaBaBaBaBaBaAa
Yangzhou0.4180.4330.4460.4670.4830.5000.5120.5200.5310.5410.555
BcBcBcBaBaBaAaAaAaAaAa
Zhenjiang0.4210.4380.4510.4710.4910.5050.5130.5220.5330.5440.553
BcBcBcBaBaAaAaAaAaAaAa
Taizhou0.3850.3970.4090.4300.4440.4580.4630.4760.4890.5030.515
CcCcBcBaBaBaBaBaBaAaAa
Suqian0.3330.3440.3550.3670.3790.3780.3860.4340.4030.4110.422
CcCcCcCcCcCcCaBcBaBaBa
Note: Sc, extremely coordinated synchronized development in higher education and economic growth; Sb, extremely coordinated and economic growth lagging; Aa, highly coordinated higher and education development lagging; Ab, highly coordinated and economic growth lagging; Ac, highly coordinated and synchronized development in higher education and economic growth; Ba, moderately coordinated and higher education development lagging; Bb, moderately coordinated and economic growth lagging; Bc, moderately coordinated and synchronized development in higher education and economic growth; Ca, slightly coordinated and higher education development lagging; Cc, slightly coordinated and synchronized development in higher education and economic growth.
Table 6. Innovation ability–economic growth coupling coordination in Jiangsu, China.
Region/Year20072008200920102011201220132014201520162017
Nanjing0.5650.5820.6200.6600.7000.7350.7830.7990.8230.8500.879
AdAdAdAdAdAdAdAdSdSdSd
Wuxi0.5300.5550.5900.6280.6720.7050.7370.7470.7580.7840.807
AfAfAfAfAfAfAfAfAfAdSd
Xuzhou0.4070.4240.4560.4840.5160.5340.5610.5680.5860.6190.623
BfBfBfBfAfAfAfAdAdAdAd
Changzhou0.4370.4710.5160.5620.5780.6040.6460.6620.6850.7100.718
BfBfAfAfAfAdAfAfAdAdAd
Suzhou0.5130.5590.5950.6500.6940.7190.7670.7840.7980.8380.861
AdAdAdAdAdAdAdAdAdSdSd
Nantong0.4440.4750.4950.5300.5650.5780.6050.6180.6420.6610.679
BfBfBfAfAfAfAfAdAdAdAd
Lianyungang0.3730.3860.4000.4190.4340.4530.4740.4810.4990.5130.519
CfCfBfBfBdBdBdAdAdAdAd
Huaian0.3840.3970.4110.4320.4480.4650.4820.5010.5260.5510.558
CfCfBfBfBdBdBdAdAdAdAd
Yancheng0.3810.3950.4110.4360.4550.4690.4940.5030.5260.5700.585
CfCfBfBdBdBdBdAdAdAdAd
Yangzhou0.4230.4430.4690.5020.5220.5490.5760.5930.6260.6490.669
BfBfBfAfAdAdAdAdAdAdAd
Zhenjiang0.4180.4430.4480.4930.5270.5440.5740.6190.6420.6630.642
BfBfBfBfAdAdAdAfAdAdAd
Taizhou0.4020.4250.4460.4710.4900.5570.5370.5650.5880.6170.633
BfBfBfBfBfAfAfAfAfAdAd
Suqian0.3310.3450.3560.3740.3910.4150.4410.4610.4790.4920.495
CfCfCfCfCfBfBfBfBfBfBf
Note: Sd, extremely coordinated and innovation ability lagging; Ad, highly coordinated and innovation ability lagging; Af, highly coordinated synchronized development in innovation ability and economic growth; Bd, moderately coordinated and innovation ability lagging; Bf, moderately coordinated and synchronized development in innovation ability and economic growth; Cf, slightly coordinated and synchronized development of innovation ability and economic growth.
Table 7. Coupling coordination of higher education–innovation ability in Jiangsu, China.
Region/Year20072008200920102011201220132014201520162017
Nanjing0.6560.6800.7220.7470.7860.8060.8330.8380.8470.8630.888
AgAgAgAgAgSgSgSgSgSgSg
Wuxi0.4630.4770.5000.5200.5380.5540.5720.5700.5730.5800.585
BiBiBhAhAhAhAhAhAhAhAh
Xuzhou0.4190.4270.4490.4560.4790.4830.4970.4920.4970.5160.511
BiBiBiBiBiBiBiBiBiAiAi
Changzhou0.4320.4530.4810.5000.4950.5100.5190.5260.5300.5390.549
BiBiBiBiBiAhAhAhAhAhAh
Suzhou0.4710.5020.5280.5640.5870.5910.6200.6260.6300.6520.664
BiAiAiAiAhAhAhAhAhAhAh
Nantong0.4040.4220.4350.4590.4720.4690.4790.4820.4910.4970.504
BiBiBiBhBhBhBhBhBhBhAh
Lianyungang0.3420.3450.3520.3640.3700.3780.3880.3940.4000.4050.405
CiCiCiCiCiCiCiCiCiBiBi
Huaian0.3670.3750.3850.3880.3950.4000.4050.4120.4250.4380.440
CiCiCiCiCiBiBiBiBiBiBi
Yancheng0.3560.3650.3720.3800.3890.3910.4020.4050.4130.4440.449
CiCiCiCiCiCiBiBiBiBhBh
Yangzhou0.4050.4130.4240.4360.4400.4530.4650.4720.4860.4920.501
BiBiBiBiBiBiBhBhBhBhAh
Zhenjiang0.4000.4140.4110.4370.4480.4490.4610.4910.4990.5100.491
BiBiBiBiBiBiBiBhBhAhBh
Taizhou0.3560.3560.3620.3690.3710.3720.3710.3780.3800.3840.385
CiCiCiCiCiChChChChChCh
Suqian0.3230.3260.3330.3310.3380.3580.3700.4180.3860.3890.385
CiCiCiCiCiCiCiBiChChCi
Note: Sg, extremely coordinated and innovation ability lagging; Ag, highly coordinated and innovation ability lagging; Ah, highly coordinated and higher education development lagging; Ai, highly coordinated and synchronized development in higher education and innovation ability; Bh, moderately coordinated and higher education lagging; Bi, moderately coordinated and synchronized development in higher education and innovation ability; Ci, slightly coordinated synchronized development in higher education and innovation ability.

