Quantifying the Use of Forest Ecosystem Services by Local Populations in Southeastern Cameroon

 , , and
Abstract
1. Introduction
2. Materials and Methods
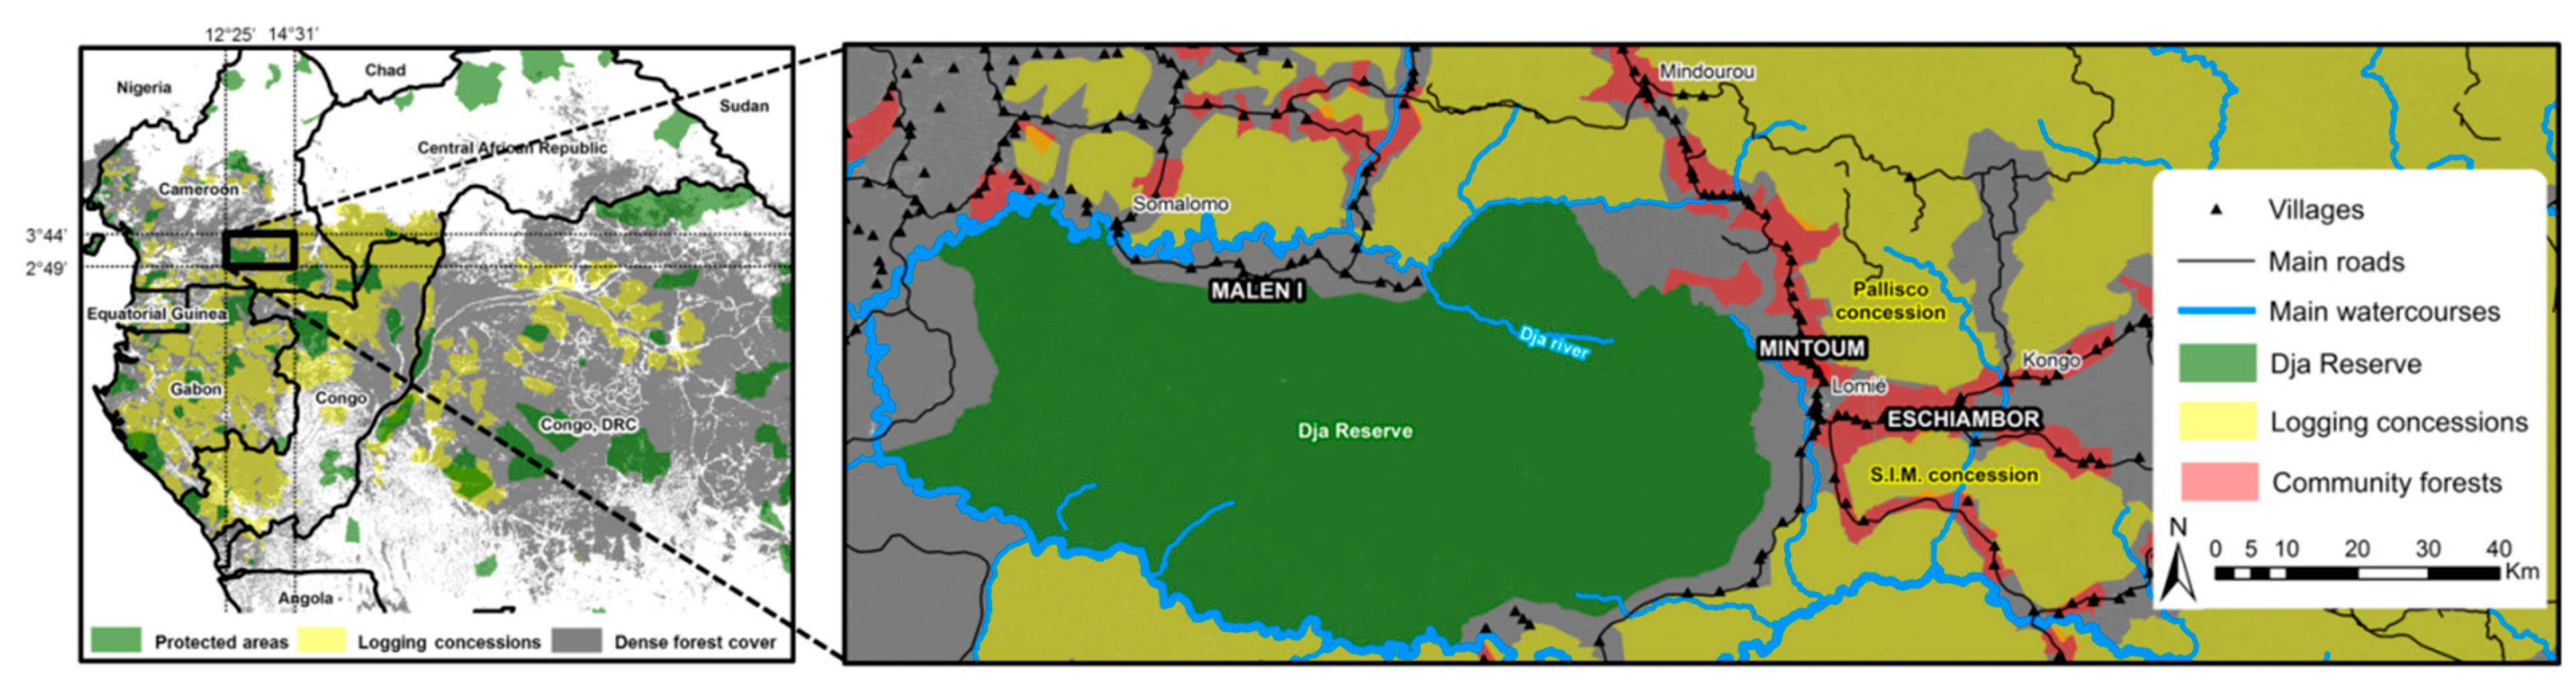
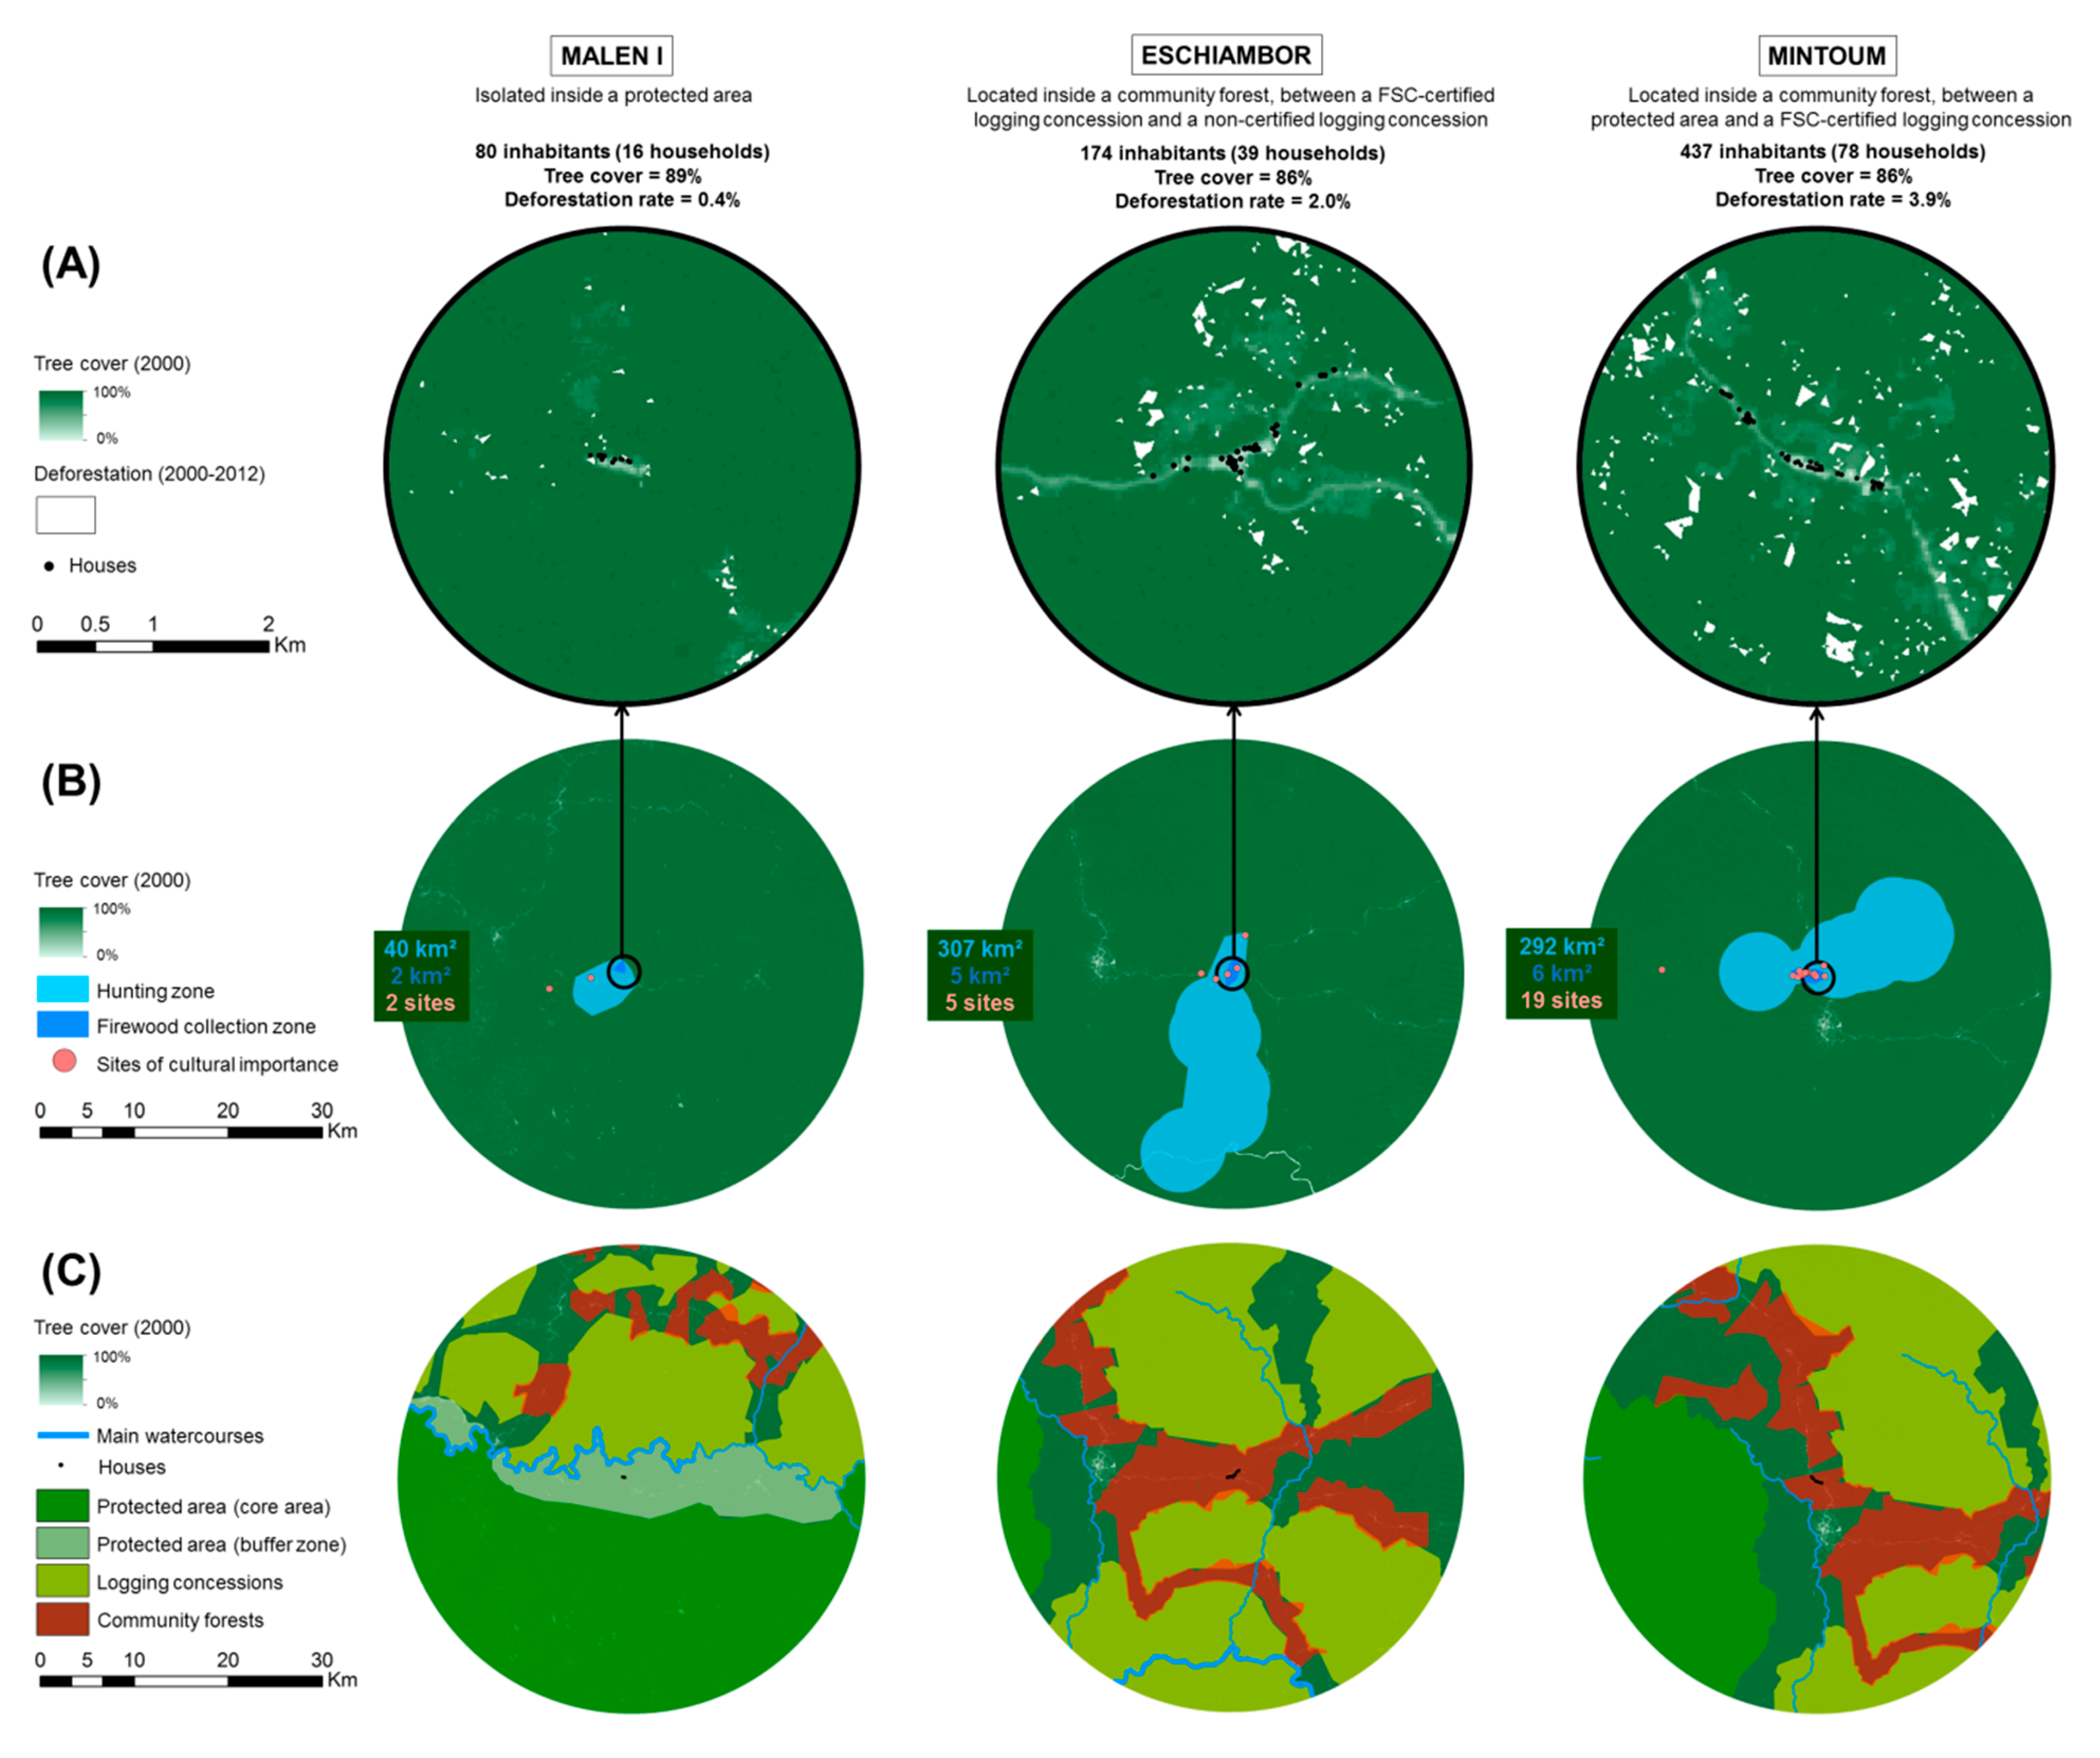
2.1. Study Area
2.2. Data Collection
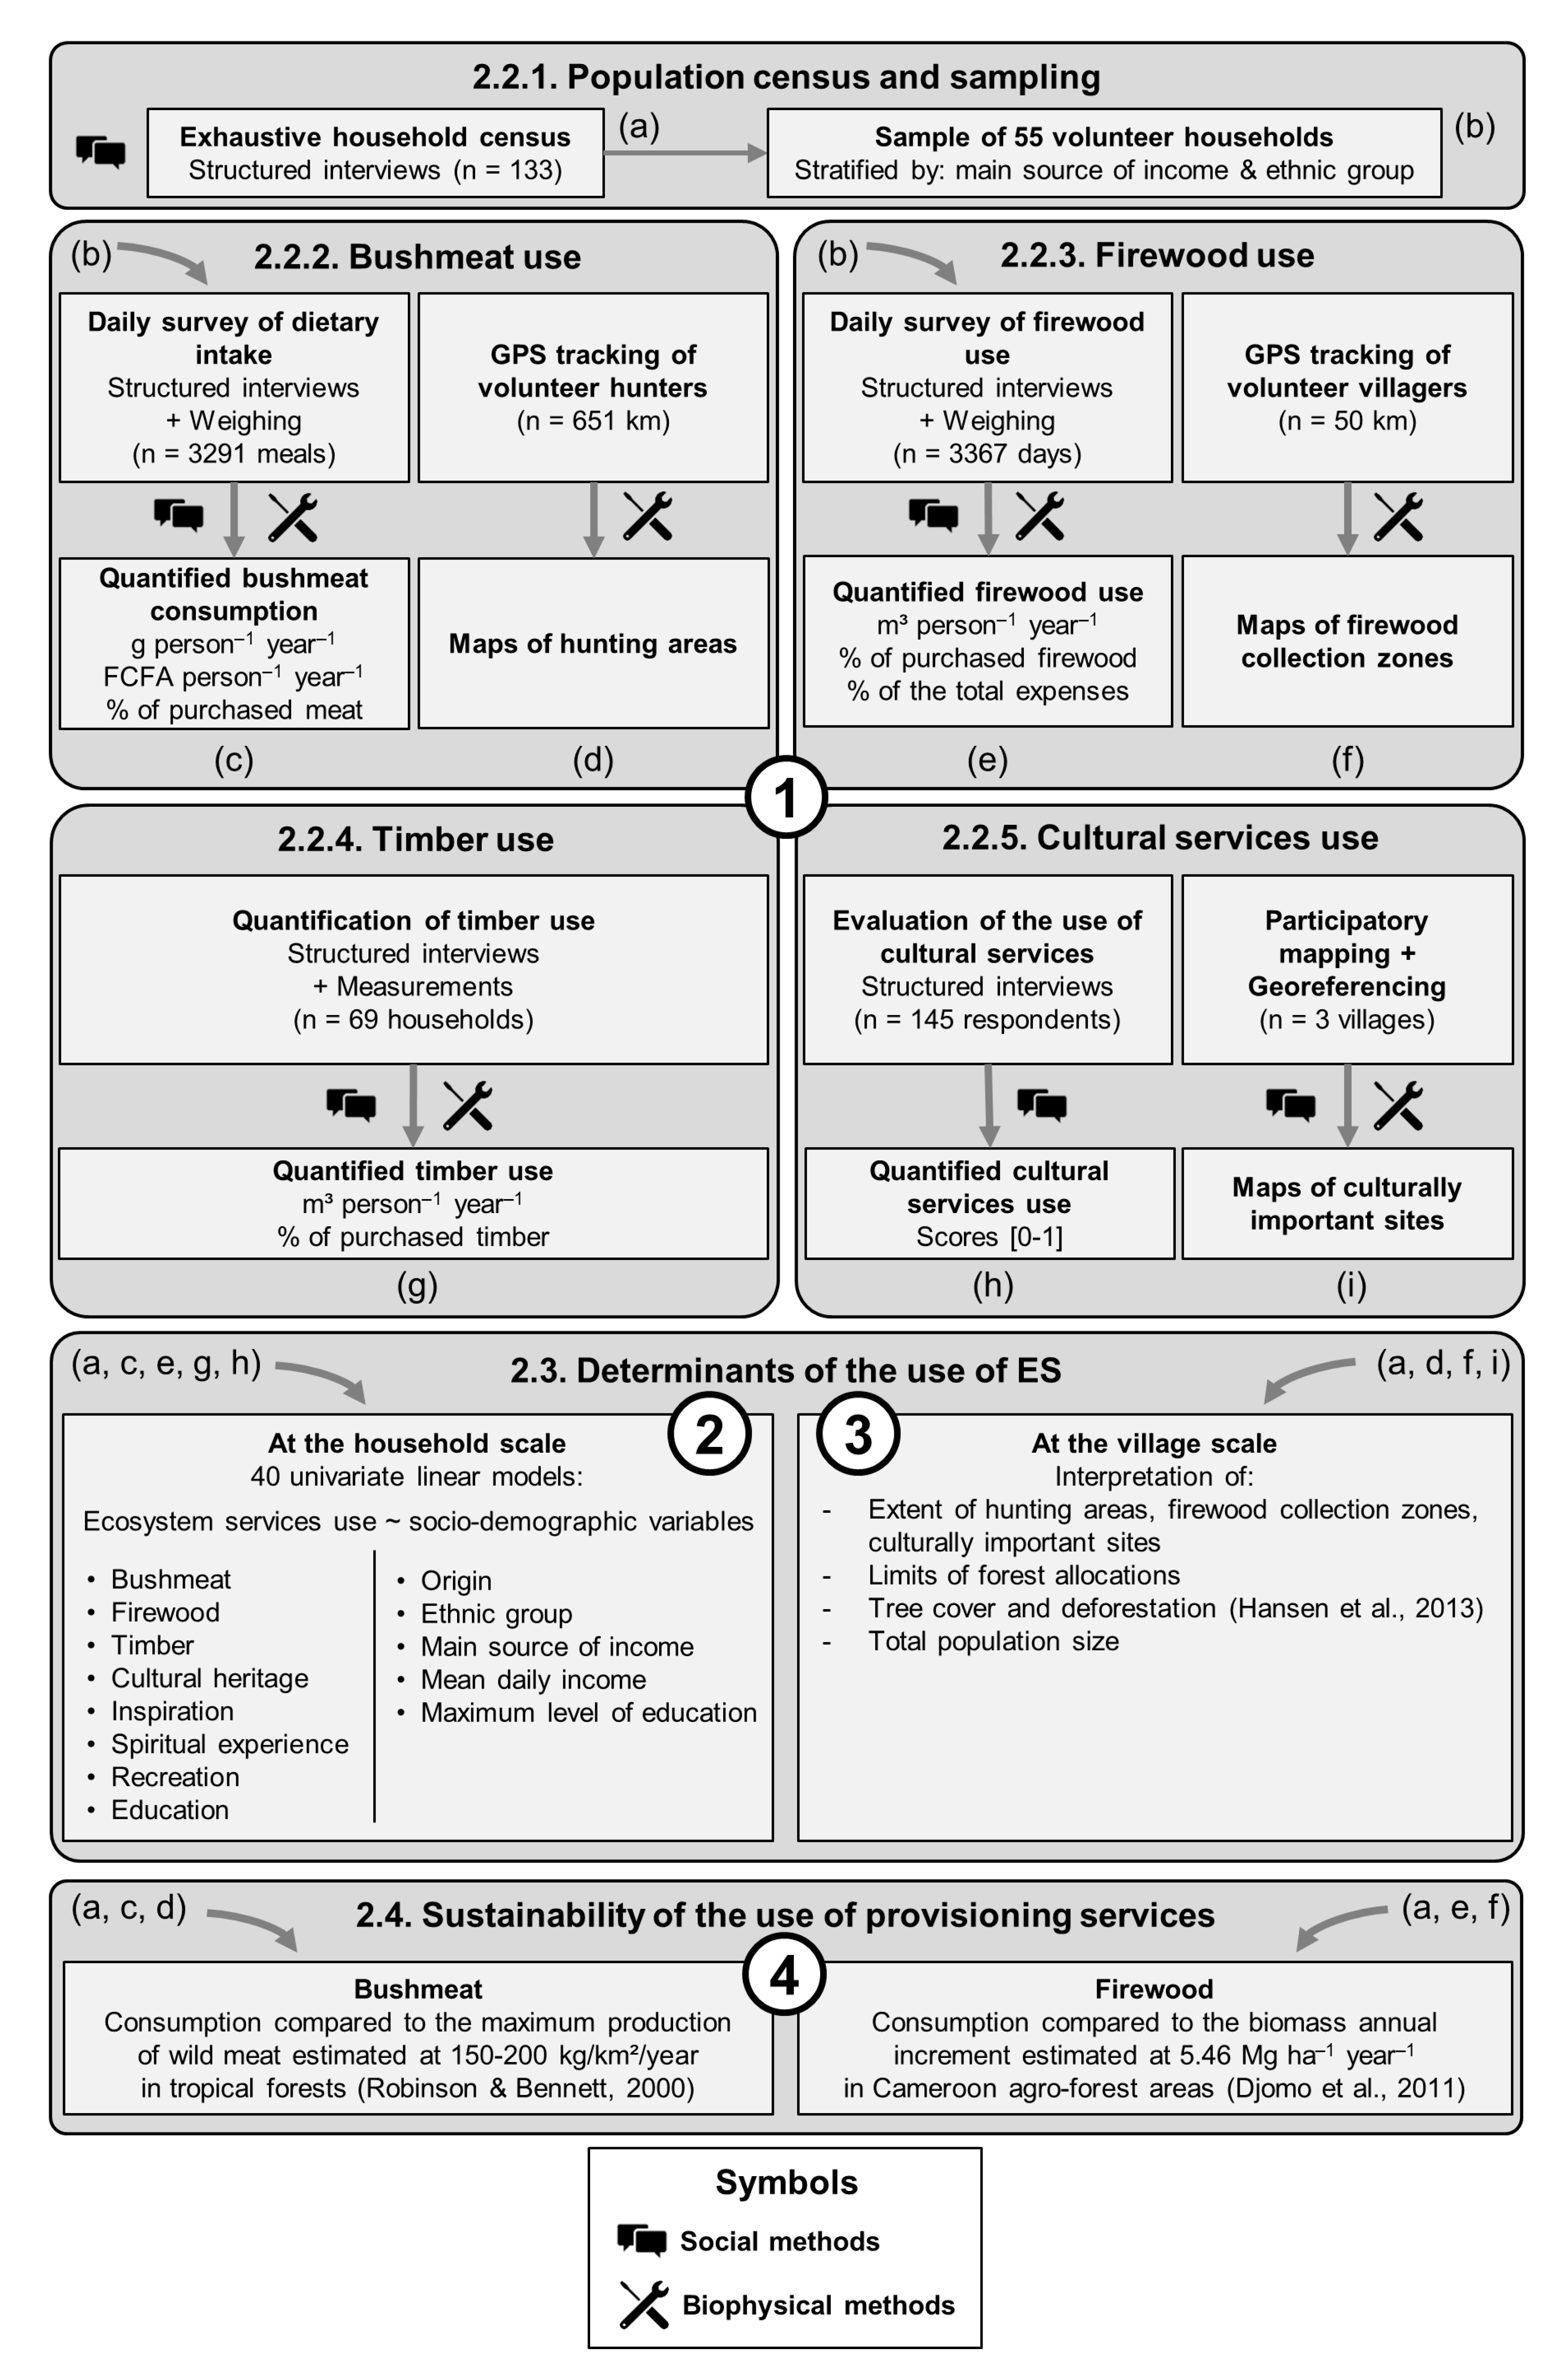
2.2.1. Population Census and Sampling
2.2.2. Bushmeat Use
2.2.3. Firewood Use
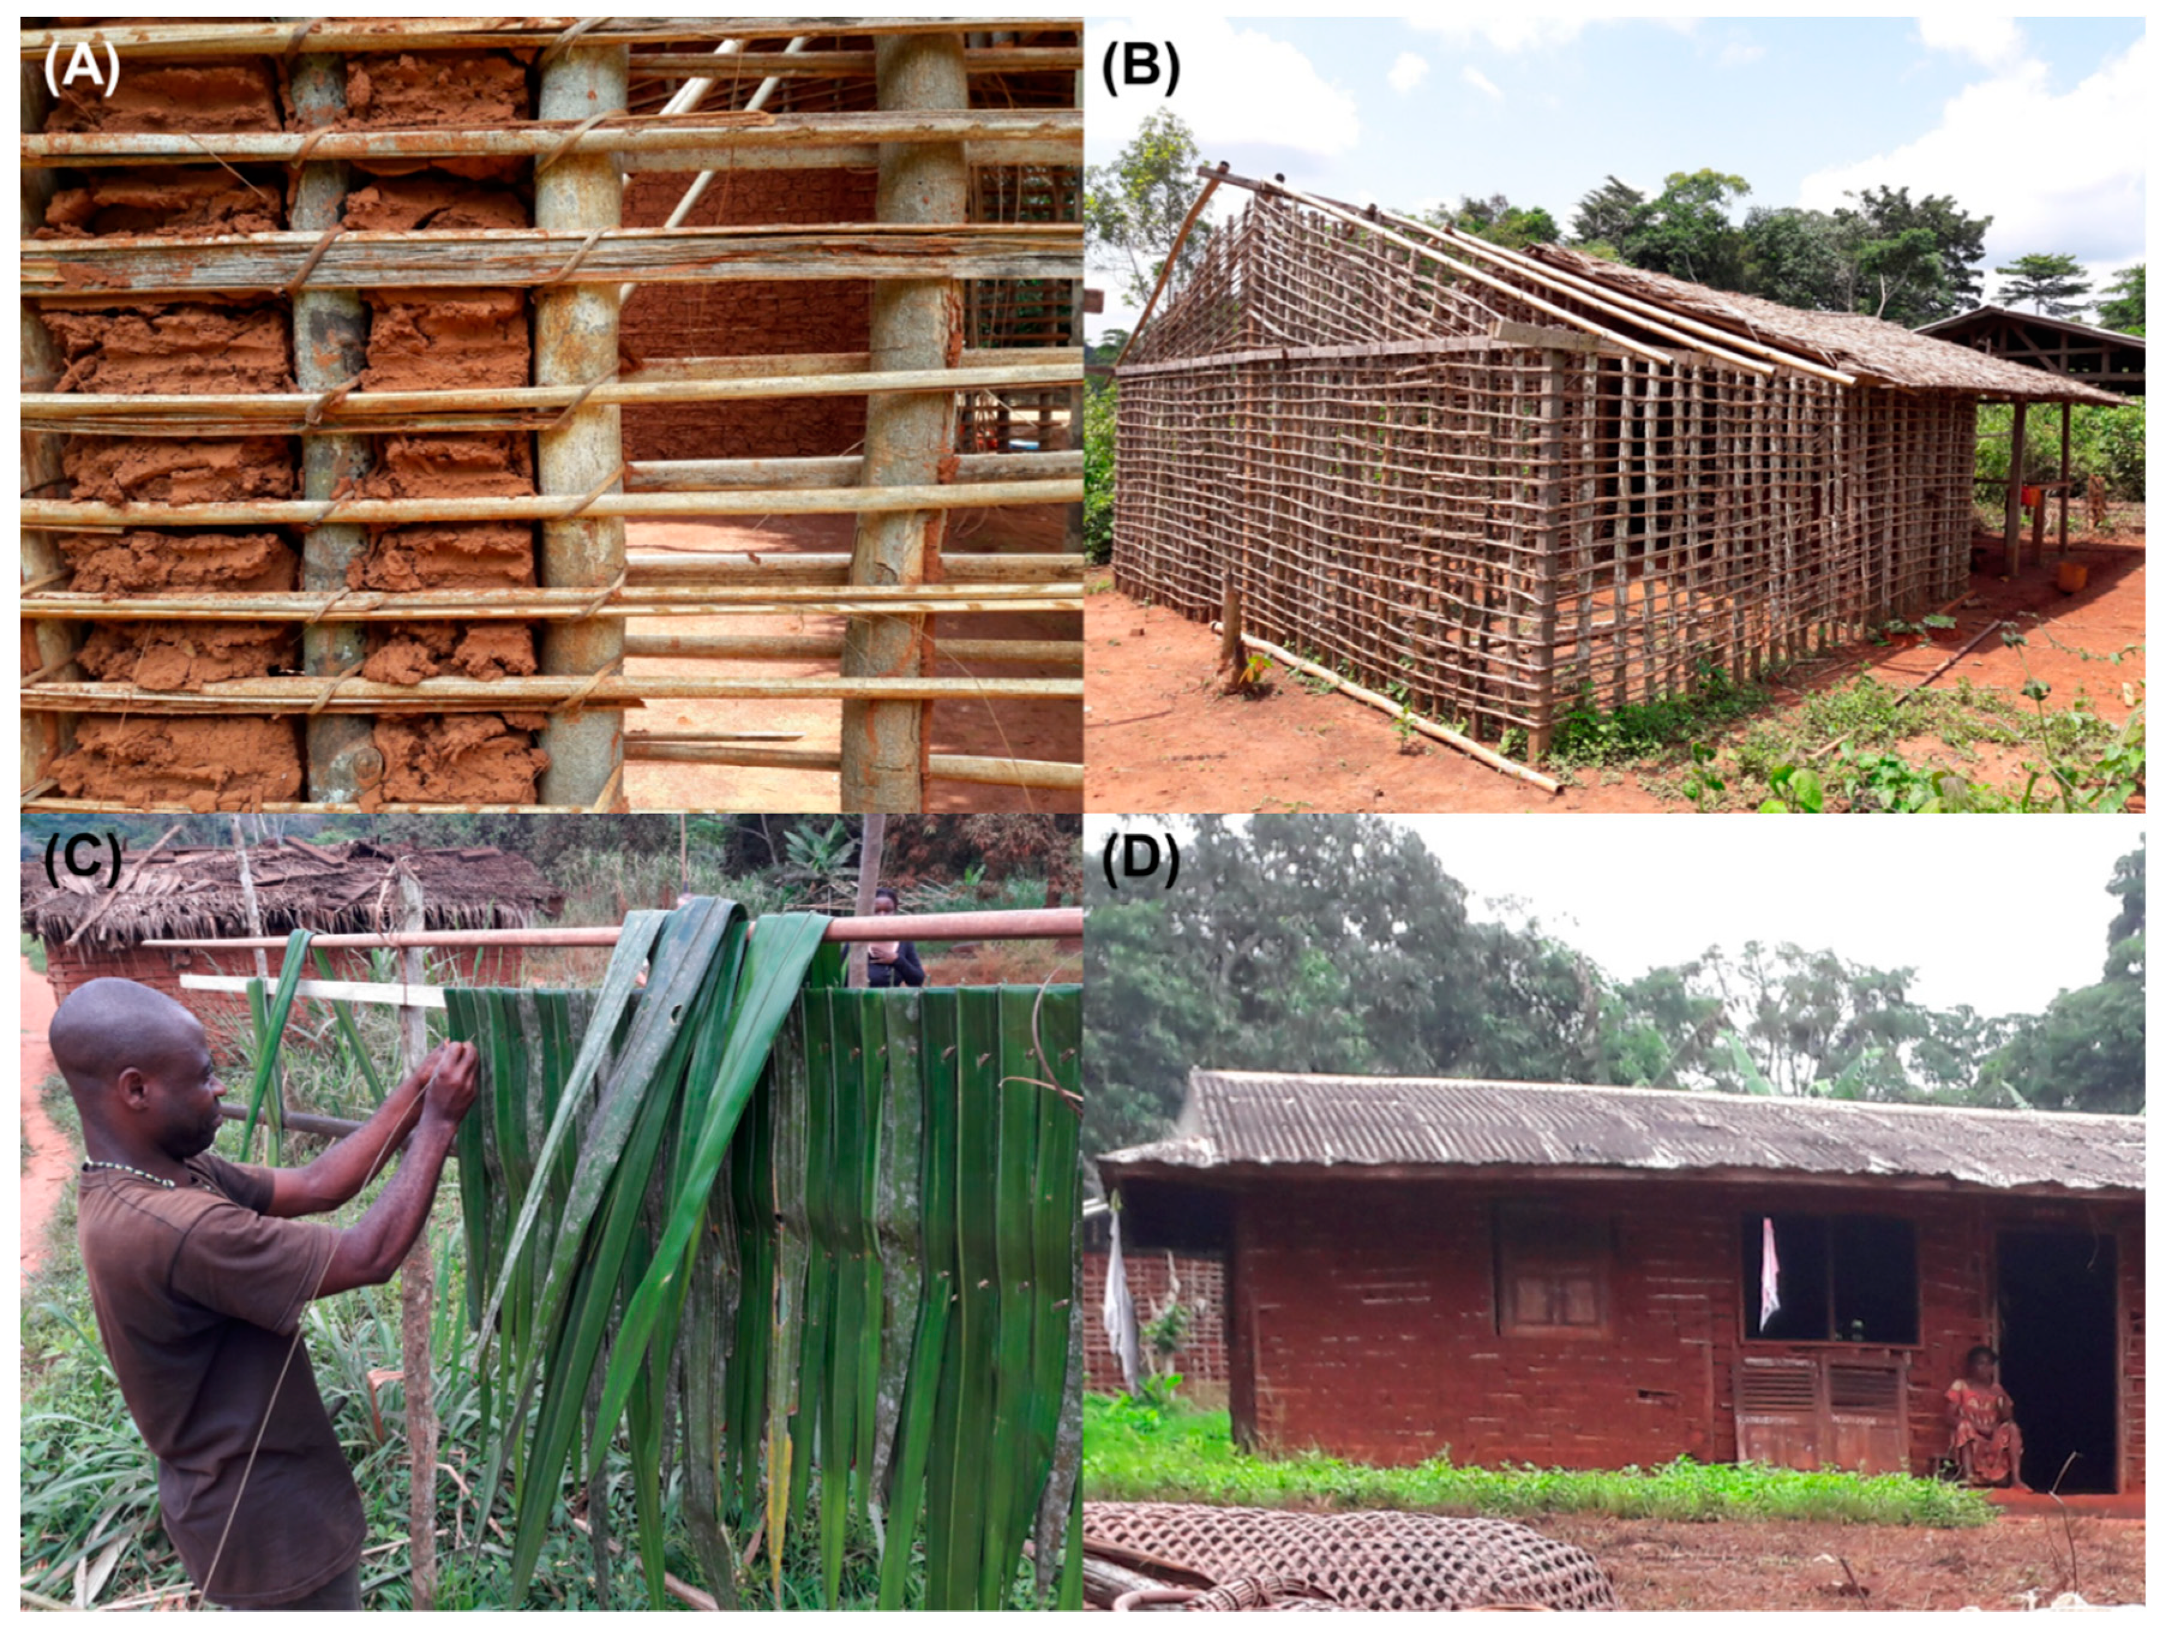
2.2.4. Timber Use
2.2.5. Cultural Services Use
2.3. Determinants of the Use of Ecosystem Services
2.4. Sustainability of the Use of Provisioning Services
3. Results
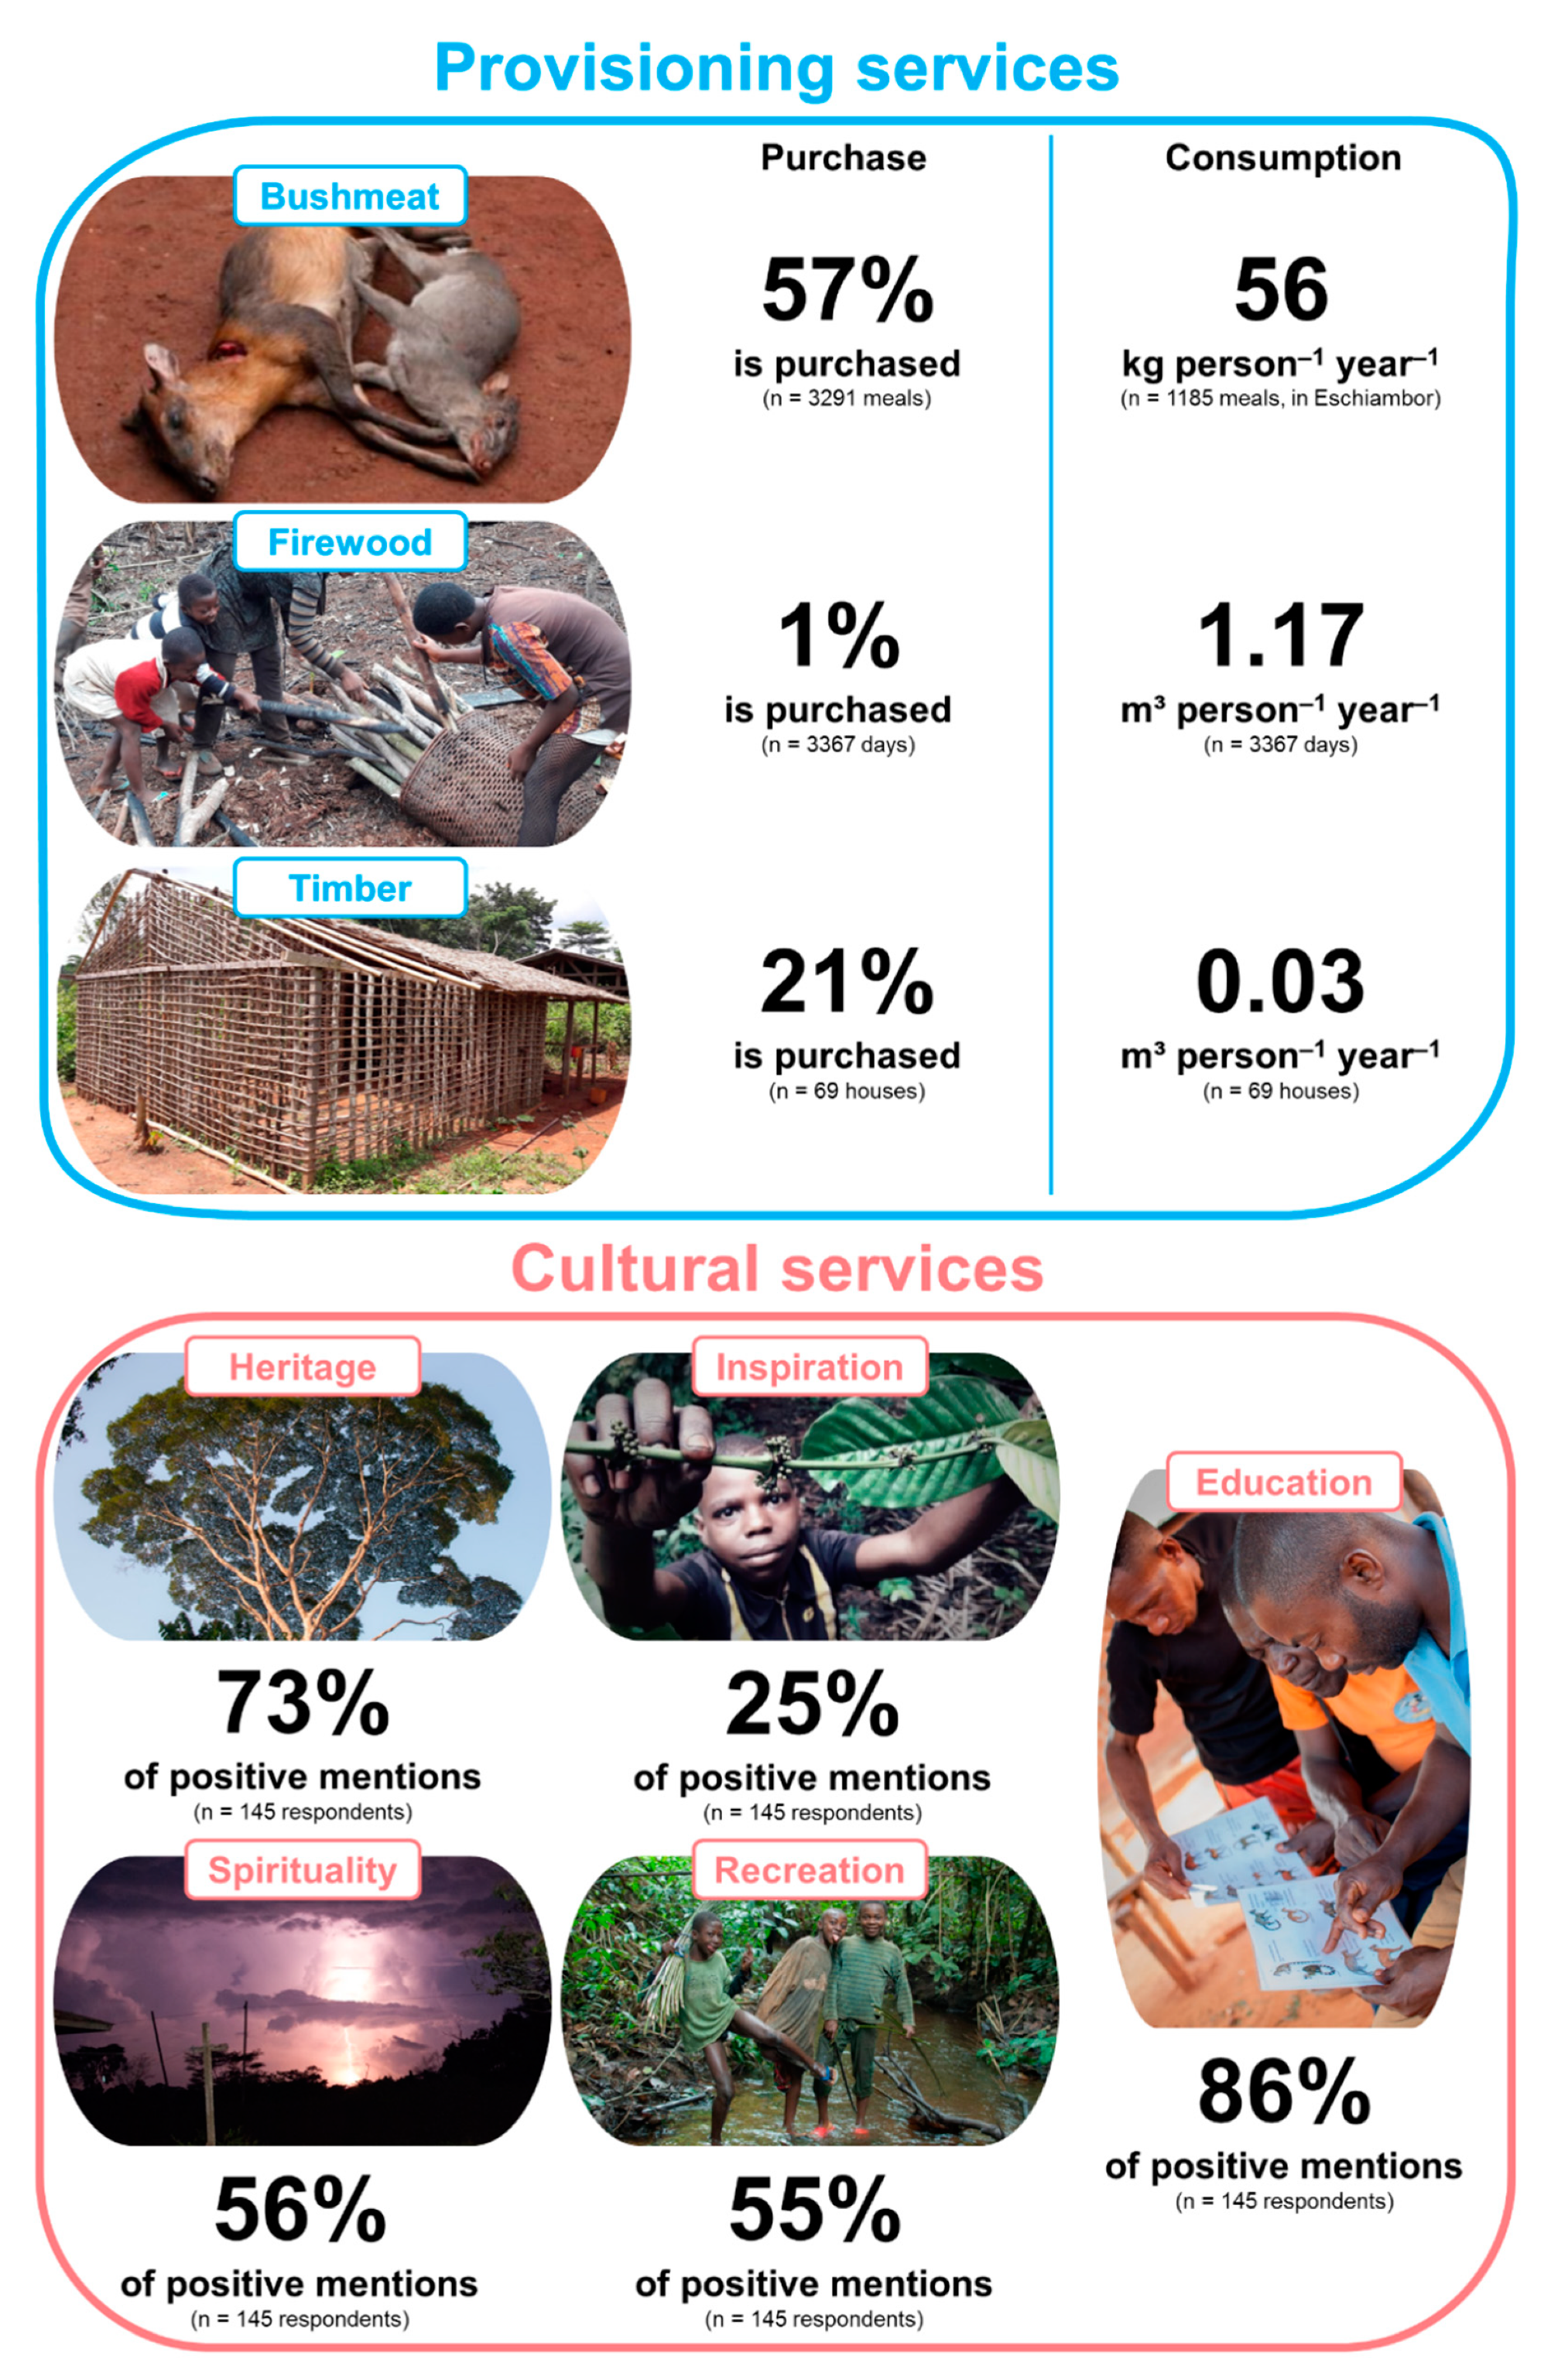
3.1. Quantification of the Use of Ecosystem Services
3.2. Determinants and Mapping of the Use of Ecosystem Services
3.3. Estimated Consumption of Provisioning Services for Discussing Sustainability
4. Discussion
4.1. Bushmeat Consumption
4.2. Firewood and Timber Consumption
4.3. Cultural Services Use
5. Conclusions
Author Contributions
Funding
Acknowledgments
Conflicts of Interest
Appendix A

| Open-Ended Questions | |
|---|---|
| Cultural Heritage and Identity | Does the forest have heritage, cultural, or symbolic value for you? |
| Are there animal or vegetal species to conserve for the future? | |
| Do you know any cemeteries or ancient villages in the forest? | |
| Inspiration for Culture and Art | Are there legends and stories about the forest? |
| Are the craftsmen inspired by the forest? | |
| Spiritual Experience | Do you practice any forest-related rituals or traditions? |
| Are there sacred trees in the forest? | |
| Are there sacred sites in the forest? | |
| Have sacred sites retained the same importance than before? | |
| Recreation | Is it pleasant to go into the forest? |
| Do you ramble in the forest to relax without collecting anything? | |
| Do you sometimes go into the forest to escape the problems of the village? | |
| Education | Is it the forest important for children’s education? |
| Is there practical and useful knowledge about the forest that you wish to pass on? |
Appendix B
| Malen I (n = 16) | Eschiambor (n = 39) | Mintoum (n = 78) | ||
|---|---|---|---|---|
| Total Number of Permanent Residents | 80 | 174 | 437 | |
| Native from the Village | 56% | 65% | 75% | |
| Ethnic Group | Baka | 0% | 0% | 53% |
| Bantu | 100% | 100% | 47% | |
| Maximum Level of Education | Out-of-school | 0% | 0% | 5% |
| Primary school | 38% | 33% | 46% | |
| Secondary school | 56% | 59% | 47% | |
| Graduate school | 6% | 8% | 2% | |
| Main Source of Income | Forest-related activities | 73% | 21% | 53% |
| Agriculture | 7% | 46% | 10% | |
| Salary jobs | 13% | 10% | 23% | |
| Mixed occupation | 7% | 23% | 14% | |
References
- Lewis, S.L.; Maslin, M.A. Defining the Anthropocene. Nature 2015, 519, 171–180. [Google Scholar] [CrossRef]
- Ceballos, G.; Ehrlich, P.R.; Barnosky, A.D.; García, A.; Pringle, R.M.; Palmer, T.M. Accelerated modern human–induced species losses: Entering the sixth mass extinction. Sci. Adv. 2015, 1, e1400253. [Google Scholar] [CrossRef] [PubMed]
- Millennium Ecosystem Assessment. Ecosystems and Human Well-Being: Synthesis; Island Press: Washington, DC, USA, 2005. [Google Scholar]
- Burkhard, B.; de Groot, R.; Costanza, R.; Seppelt, R.; Jørgensen, S.E.; Potschin, M. Solutions for sustaining natural capital and ecosystem services. Ecol. Indic. 2012, 21, 1–6. [Google Scholar] [CrossRef]
- de Groot, R.S.; Alkemade, R.; Braat, L.; Hein, L.; Willemen, L. Challenges in integrating the concept of ecosystem services and values in landscape planning, management and decision making. Ecol. Complex. 2010, 7, 260–272. [Google Scholar] [CrossRef]
- Fagerholm, N.; Kaeyhko, N.; Ndumbaro, F.; Khamis, M. Community stakeholders’ knowledge in landscape assessments- Mapping indicators for landscape services. Ecol. Indic. 2012, 18, 421–433. [Google Scholar] [CrossRef]
- Lhoest, S.; Dufrêne, M.; Vermeulen, C.; Oszwald, J.; Doucet, J.-L.; Fayolle, A. Perceptions of ecosystem services provided by tropical forests to local populations in Cameroon. Ecosyst. Serv. 2019, 38, 100956. [Google Scholar] [CrossRef]
- The Forests of the Congo Basin—Forests and Climate Change; de Wasseige, C., Tadoum, M., Atyi, E., Doumenge, C., Eds.; Weyrich SA: Neufchâteau, Belgium, 2015. [Google Scholar]
- Abernethy, K.; Maisels, F.; White, L.J.T. Environmental Issues in Central Africa. Annu. Rev. Environ. Resour. 2016, 41, 1–33. [Google Scholar] [CrossRef]
- Kleinschroth, F.; Laporte, N.; Laurance, W.F.; Goetz, S.J.; Ghazoul, J. Road expansion and persistence in forests of the Congo Basin. Nat. Sustain. 2019, 2, 628–634. [Google Scholar] [CrossRef]
- Achard, F.; Beuchle, R.; Mayaux, P.; Stibig, H.-J.; Bodart, C.; Brink, A.; Carboni, S.; Desclée, B.; Donnay, F.; Eva, H.D.; et al. Determination of tropical deforestation rates and related carbon losses from 1990 to 2010. Glob. Chang. Biol. 2014, 20, 2540–2554. [Google Scholar] [CrossRef]
- Igu, N.I.; Marchant, R. Freshwater swamp forest use in the Niger Delta: Perception and insights. J. For. Res. 2017, 22, 44–52. [Google Scholar] [CrossRef]
- Egoh, B.N.; O’Farrell, P.J.; Charef, A.; Josephine Gurney, L.; Koellner, T.; Nibam Abi, H.; Egoh, M.; Willemen, L. An African account of ecosystem service provision: Use, threats and policy options for sustainable livelihoods. Ecosyst. Serv. 2012, 2, 71–81. [Google Scholar] [CrossRef]
- Ingram, V.; Ndoye, O.; Iponga, D.M.; Tieguhong, J.C.; Nasi, R. Les produits forestiers non ligneux: Contribution aux economies nationales et strategies pour une gestion durable. In Les forêts du bassin du Congo—État des forêts 2010; de Wasseige, C., de Marcken, P., Bayol, N., Hiol Hiol, F., Mayaux, P.H., Desclée, B., Nasi, R., Billand, A., Defourny, P., Eba’a Atyi, R., Eds.; EU publications: Luxembourg, 2012; p. 276. ISBN 978-92-79-22717-2. [Google Scholar]
- Fa, J.E.; Peres, C.A.; Meeuwig, J. Bushmeat Exploitation in Tropical Forests: An Intercontinental Comparison. Conserv. Biol. 2002, 16, 232–237. [Google Scholar] [CrossRef]
- Nasi, R.; Taber, A.; Van Vliet, N. Empty forests, empty stomachs? Bushmeat and livelihoods in the Congo and Amazon Basins. Int. For. Rev. 2011, 13, 355–368. [Google Scholar] [CrossRef]
- Fa, J.E.; Olivero, J.; Real, R.; Farfán, M.A.; Márquez, A.L.; Vargas, J.M.; Ziegler, S.; Wegmann, M.; Brown, D.; Margetts, B.; et al. Disentangling the relative effects of bushmeat availability on human nutrition in central Africa. Sci. Rep. 2015, 5, 8168. [Google Scholar] [CrossRef]
- Lescuyer, G.; Nasi, R. Financial and economic values of bushmeat in rural and urban livelihoods in Cameroon: Inputs to the development of public policy. Int. For. Rev. 2016, 18, 93–107. [Google Scholar] [CrossRef]
- Sola, P.; Cerutti, P.O.; Zhou, W.; Gautier, D.; Iiyama, M.; Schure, J.; Chenevoy, A.; Yila, J.; Dufe, V.; Nasi, R.; et al. The environmental, socioeconomic, and health impacts of woodfuel value chains in Sub-Saharan Africa: A systematic map. Environ. Evid. 2017, 6, 4. [Google Scholar] [CrossRef]
- Eba’a Atyi, R.; Ngouhouo Poufoun, J.; Mvondo Awono, J.-P.; Ngoungoure Manjeli, A.; Sufo Kankeu, R. Economic and social importance of fuelwood in Cameroon. Int. For. Rev. 2016, 18, 52–65. [Google Scholar] [CrossRef]
- Sola, P.; Schure, J.; Eba’a Atyi, R.; Gumbo, D.; Okeyo, I. Woodfuel policies and practices in selected countries in Sub-Saharan Africa—A critical review. Bois et Forêts des Tropiques 2019, 340, 5–19. [Google Scholar]
- FRMi. FAC-2030—Vision Stratégique et Industrialisation de la Filière Bois en Afrique Centrale—Horizon 2030; Développement intégré et durable de la filière bois dans le Bassin du Congo: Opportunités, défis et recommandations opérationnelles—Plan de travail issu de la mission de cadrage; Rapport Pays Cameroun: Montpellier, France, 2018. [Google Scholar]
- Lescuyer, G.; Cerutti, P.O.; Tsanga, R. Contributions of community and individual small-scale logging to sustainable timber management in Cameroon. Int. For. Rev. 2016, 18, 40–51. [Google Scholar] [CrossRef]
- Wangai, P.W.; Burkhard, B.; Müller, F. A review of studies on ecosystem services in Africa. Int. J. Sustain. Built Environ. 2016, 5, 225–245. [Google Scholar] [CrossRef]
- Cheng, X.; Van Damme, S.; Li, L.; Uyttenhove, P. Evaluation of cultural ecosystem services: A review of methods. Ecosyst. Serv. 2019, 37, 100925. [Google Scholar] [CrossRef]
- Jaligot, R.; Kemajou, A.; Chenal, J. Cultural ecosystem services provision in response to urbanization in Cameroon. Land Use Policy 2018, 79, 641–649. [Google Scholar] [CrossRef]
- Plieninger, T.; Bieling, C.; Fagerholm, N.; Byg, A.; Hartel, T.; Hurley, P.; López-Santiago, C.A.; Nagabhatla, N.; Oteros-Rozas, E.; Raymond, C.M.; et al. The role of cultural ecosystem services in landscape management and planning. Curr. Opin. Environ. Sustain. 2015, 14, 28–33. [Google Scholar] [CrossRef]
- Raymond, C.M.; Singh, G.G.; Benessaiah, K.; Bernhardt, J.R.; Levine, J.; Nelson, H.; Turner, N.J.; Norton, B.; Tam, J.; Chan, K.M.A. Ecosystem Services and Beyond: Using Multiple Metaphors to Understand Human–Environment Relationships. BioScience 2013, 63, 536–546. [Google Scholar] [CrossRef]
- Chan, K.M.A.; Guerry, A.D.; Balvanera, P.; Klain, S.; Satterfield, T.; Basurto, X.; Bostrom, A.; Chuenpagdee, R.; Gould, R.; Halpern, B.S.; et al. Where are Cultural and Social in Ecosystem Services? A Framework for Constructive Engagement. BioScience 2012, 62, 744–756. [Google Scholar] [CrossRef]
- Daïnou, K.; Bracke, C.; Vermeulen, C.; Haurez, B.; De Vleeschouwer, J.-Y.; Fayolle, A.; Doucet, J.-L. Hautes Valeurs de Conservation (HVC) dans les Unités Forestières d’Aménagement du Cameroun: Concepts, Choix et Pratiques; Les Presses Agronomiques de Gembloux: Gembloux, Belgium, 2016; ISBN 9782870161463. [Google Scholar]
- Jacobs, S.; Dendoncker, N.; Martin-Lopez, B.; Barton, D.N.; Gomez-Baggethun, E.; Boeraeve, F.; McGrath, F.; Vierikko, K.; Geneletti, D.; Katharina, S.J.; et al. A new valuation school: Integrating diverse values of nature in resource and land use decisions. Ecosyst. Serv. 2016, 22, 213–220. [Google Scholar] [CrossRef]
- Burkhard, B.; Petrosillo, I.; Costanza, R. Ecosystem services—Bridging ecology, economy and social sciences. Ecol. Complex. 2010, 7, 257–259. [Google Scholar] [CrossRef]
- Felipe-Lucia, M.R.; Comín, F.A.; Escalera-Reyes, J. A framework for the social valuation of ecosystem services. AMBIO 2015, 44, 308–318. [Google Scholar] [CrossRef]
- Boeraeve, F.; Dendoncker, N.; Jacobs, S.; Gómez-Baggethun, E.-B.; Dufrêne, M. (first) How (not) to perform ecosystem service valuations: Pricing gorillas in the mist. Biodivers. Conserv. 2015, 24, 187–197. [Google Scholar] [CrossRef]
- de Groot, R.S.; Wilson, M.A.; Boumans, R.M. A typology for the classification, description and valuation of ecosystem functions, goods and services. Ecol. Econ. 2002, 41, 393–408. [Google Scholar] [CrossRef]
- Martín-López, B.; Iniesta-Arandia, I.; García-Llorente, M.; Palomo, I.; Casado-Arzuaga, I.; Amo, D.G.D.; Gómez-Baggethun, E.; Oteros-Rozas, E.; Palacios-Agundez, I.; Willaarts, B.; et al. Uncovering Ecosystem Service Bundles through Social Preferences. PLoS ONE 2012, 7, e38970. [Google Scholar] [CrossRef]
- Wilson, M.A.; Carpenter, S.R. Economic Valuation of Freshwater Ecosystem Services in the United States: 1971–1997. Ecol. Appl. 1999, 9, 772. [Google Scholar]
- Burkhard, B.; Maes, J. Mapping Ecosystem Services; Pensoft Publishers: Sofia, Bulgaria, 2017. [Google Scholar]
- Mengist, W.; Soromessa, T. Assessment of forest ecosystem service research trends and methodological approaches at global level: A meta-analysis. Environ. Syst. Res. 2019, 8, 22. [Google Scholar] [CrossRef]
- Ryan, C.M.; Pritchard, R.; McNicol, I.; Owen, M.; Fisher, J.A.; Lehmann, C. Ecosystem services from southern African woodlands and their future under global change. Phil. Trans. R. Soc. B 2016, 371. [Google Scholar] [CrossRef]
- Pritchard, R.; Grundy, I.M.; van der Horst, D.; Ryan, C.M. Environmental incomes sustained as provisioning ecosystem service availability declines along a woodland resource gradient in Zimbabwe. World Dev. 2019, 122, 325–338. [Google Scholar] [CrossRef]
- Rincón-Ruiz, A.; Arias-Arévalo, P.; Núñez Hernández, J.M.; Cotler, H.; Aguado Caso, M.; Meli, P.; Tauro, A.; Ávila Akerberg, V.D.; Avila-Foucat, V.S.; Cardenas, J.P.; et al. Applying integrated valuation of ecosystem services in Latin America: Insights from 21 case studies. Ecosyst. Serv. 2019, 36, 100901. [Google Scholar] [CrossRef]
- Reyes-García, V.; Powell, B.; Díaz-Reviriego, I.; Fernández-Llamazares, Á.; Gallois, S.; Gueze, M. Dietary transitions among three contemporary hunter-gatherers across the tropics. Food Sec. 2019, 11, 109–122. [Google Scholar] [CrossRef]
- Gillet, P.; Vermeulen, C.; Doucet, J.-L.; Codina, E.; Lehnebach, C.; Feintrenie, L. What Are the Impacts of Deforestation on the Harvest of Non-Timber Forest Products in Central Africa? Forests 2016, 7, 106. [Google Scholar] [CrossRef]
- Wilkie, D.S.; Wieland, M.; Poulsen, J.R. Unsustainable vs. Sustainable Hunting for Food in Gabon: Modeling Short- and Long-Term Gains and Losses. Front. Ecol. Evol. 2019, 7, 357. [Google Scholar] [CrossRef]
- Hartter, J.; Solomon, J.; Ryan, S.J.; Jacobson, S.K.; Goldman, A. Contrasting perceptions of ecosystem services of an African forest park. Environ. Conserv. 2014, 41, 330–340. [Google Scholar] [CrossRef]
- Quintas-Soriano, C.; Castro, A.J.; Castro, H.; García-Llorente, M. Impacts of land use change on ecosystem services and implications for human well-being in Spanish drylands. Land Use Policy 2016, 54, 534–548. [Google Scholar] [CrossRef]
- Carpenter, S.R.; DeFries, R.; Dietz, T.; Mooney, H.A.; Polasky, S.; Reid, W.V.; Scholes, R.J. Millennium Ecosystem Assessment: Research Needs. Science 2006, 314, 257–258. [Google Scholar] [CrossRef]
- Zhang, W.; Kato, E.; Bhandary, P.; Nkonya, E.; Ibrahim, H.I.; Agbonlahor, M.; Ibrahim, H.Y.; Cox, C. Awareness and perceptions of ecosystem services in relation to land use types: Evidence from rural communities in Nigeria. Ecosyst. Serv. 2016, 22, 150–160. [Google Scholar] [CrossRef]
- Brondizio, E.S.; Tourneau, F.-M.L. Environmental governance for all. Science 2016, 352, 1272–1273. [Google Scholar] [CrossRef]
- Brown, G.; Weber, D. Public Participation GIS: A new method for national park planning. Landsc. Urban Plan. 2011, 102, 1–15. [Google Scholar] [CrossRef]
- de Groot, R.S.; Fisher, B.; Christie, M.; Aronson, J.; Braat, L.; Haines-Young, R.; Gowdy, J.; Maltby, E.; Neuville, A.; Polasky, S.; et al. Integrating the ecological and economic dimensions in biodiversity and ecosystem service valuation. In The Economics of Ecosystems and Biodiversity (TEEB): Ecological and Economic Foundations; Earthscan: London, UK; Washington, DC, USA, 2010. [Google Scholar]
- Droissart, V.; Dauby, G.; Hardy, O.J.; Deblauwe, V.; Harris, D.J.; Janssens, S.; Mackinder, B.A.; Blach-Overgaard, A.; Sonké, B.; Sosef, M.S.M.; et al. Beyond trees: Biogeographical regionalization of tropical Africa. J. Biogeogr. 2018, 45, 1153–1167. [Google Scholar] [CrossRef]
- White, F. The Vegetation of Africa, a Descriptive Memoir to Accompany the UNESCO/AETFAT/UNSO Vegetation Map of Africa; ORSTOM-UNESCO: Paris, France, 1983. [Google Scholar]
- Fayolle, A.; Swaine, M.D.; Bastin, J.-F.; Bourland, N.; Comiskey, J.A.; Dauby, G.; Doucet, J.-L.; Gillet, J.-F.; Gourlet-Fleury, S.; Hardy, O.J.; et al. Patterns of tree species composition across tropical African forests. J. Biogeogr. 2014, 41, 2320–2331. [Google Scholar] [CrossRef]
- Hijmans, R.J.; Cameron, S.E.; Parra, J.L.; Jones, P.G.; Jarvis, A. Very high resolution interpolated climate surfaces for global land areas. Int. J. Climatol. 2005, 25, 1965–1978. [Google Scholar] [CrossRef]
- Cellule Aménagement Pallisco; Nature+. Résumé des plans d’aménagement et des directives FSC pour les UFA 10-030, 10-031, 10-039, 10-041, 10-042 et 10-044 exploitées par la société Pallisco et ses partenaires. 2015. Available online: http://www.pallisco-cifm.com/index.php/fr/amenagement (accessed on 2 September 2019).
- Vermeulen, C. Le Facteur Humain Dans l’aménagement des Espaces-ressources en Afrique Centrale Forestière: Application aux Badjoué de l’Est Cameroun. Ph.D. Dissertation, Faculté Universitaire des Sciences Agronomiques, Gembloux, Belgium, 2000. [Google Scholar]
- Winterbottom, R. Tropical forestry actions plans and indigenous people: The case of Cameroon. In Conservation of West and Central African Rainforest; Cleaver, K., Munasinghe, M., Dyson, N., Egli, A., Peuker, F., Wencelius, F., Eds.; The World Bank Edition: Washington, DC, USA, 1992; pp. 123–125. [Google Scholar]
- Guthrie, M. The Classification of the Bantu Languages; Routledge: London, UK, 1948. [Google Scholar]
- World Resources Institute. Interactive Forest Atlas of Cameroon: Version 3.0; Overview Report: Washington, DC, USA, 2012; ISBN 978-1-56973-789-7. [Google Scholar]
- Forest Stewardship Council. Forest Stewardship Standard for the Republic of Cameroon; FSC International Center GmbH: Bonn, Germany, 2012. [Google Scholar]
- Karsenty, A. Certification of tropical forests: A private instrument of public interest? A focus on the Congo Basin. For. Policy Econ. 2019, 106, 101974. [Google Scholar] [CrossRef]
- Mayaux, P.; Bartholomé, E.; Fritz, S.; Belward, A. A new land-cover map of Africa for the year 2000. J. Biogeogr. 2004, 31, 861–877. [Google Scholar] [CrossRef]
- Collins, D. Pretesting survey instruments: An overview of cognitive methods. Qual. Life Res. 2003, 12, 229–238. [Google Scholar] [CrossRef] [PubMed]
- Incomes from the Forest: Methods for the Development and Conservation of Forest Products for Local Communities; Wollenberg, E., Ingles, A., Eds.; Center for International Forestry Research: Bogor, Indonesia, 1998; ISBN 979-8764-19-6. [Google Scholar]
- Ngabinzeke, J.S.; Masamba, J.B.; M’Vubu, R.N.; Vermeulen, C. Consommation de produits d’origine animale dans la concession forestière 039/11 de la SODEFOR à Oshwe (R.D. Congo). Tropicultura 2014, 32, 147–155. [Google Scholar]
- Rastoin, J.-L.; Ghersi, G. Tendances et déterminants de la consommation alimentaire. In Le Système Alimentaire Mondial: Concepts et Méthodes, Analyses et Dynamiques; Quae: Plouzané, France, 2010. [Google Scholar]
- Rist, J.; Milner-Gulland, E.J.; Cowlishaw, G.; Rowcliffe, M. Hunter Reporting of Catch per Unit Effort as a Monitoring Tool in a Bushmeat-Harvesting System. Conserv. Biol. 2010, 24, 489–499. [Google Scholar] [CrossRef]
- Hayashi, K. Hunting activities in forest camps among the Baka hunter-gatherers of southeastern Cameroon. Afr. Study Monogr. 2008, 29, 73–92. [Google Scholar]
- Fox, J. Firewood consumption in a Nepali village. Environ. Manag. 1984, 8, 243–250. [Google Scholar] [CrossRef]
- Fearnside, P.M. Wood density for estimating forest biomass in Brazilian Amazonia. For. Ecol. Manag. 1997, 90, 59–87. [Google Scholar] [CrossRef]
- Kalibo, H.W.; Medley, K.E. Participatory resource mapping for adaptive collaborative management at Mt. Kasigau, Kenya. Landsc. Urban Plan. 2007, 82, 145–158. [Google Scholar] [CrossRef]
- Larzillière, A.; Vermeulen, C.; Dubiez, E.; Yamba Yamba, T.; Diowo, S.; Mumbere, G. La maquette interactive, un outil novateur de participation. Bois et Forêts des Tropiques 2013, 315, 21–28. [Google Scholar]
- Hansen, M.C.; Potapov, P.V.; Moore, R.; Hancher, M.; Turubanova, S.A.; Tyukavina, A.; Thau, D.; Stehman, S.V.; Goetz, S.J.; Loveland, T.R.; et al. High-Resolution Global Maps of 21st-Century Forest Cover Change. Science 2013, 342, 850–853. [Google Scholar] [CrossRef]
- Robinson, J.G.; Bennett, E.L. Hunting for Sustainability in Tropical Forests; Columbia University Press: New York, NY, USA, 2000. [Google Scholar]
- Djomo, A.N.; Knohl, A.; Gravenhorst, G. Estimations of total ecosystem carbon pools distribution and carbon biomass current annual increment of a moist tropical forest. For. Ecol. Manag. 2011, 261, 1448–1459. [Google Scholar] [CrossRef]
- Delvingt, W.; Dethier, M.; Auzel, P.; Jeanmart, P. La chasse villageoise Badjoué, gestion coutumière durable ou pillage de la ressource gibier? In La Forêt des Hommes: Terroirs Villageois en Forêt Tropicale Africaine; Les Presses Agronomiques de Gembloux: Gembloux, Belgique, 2001; pp. 65–92. [Google Scholar]
- Vermeulen, C.; Karsenty, A. Place et légitimité des terroirs villageois dans la conservation. In La Forêt des Hommes: Terroirs Villageois en Forêt Tropical Africaine; Les Presses Agronomiques de Gembloux: Gembloux, Belgique, 2001; pp. 217–234. [Google Scholar]
- Lescuyer, G. Sustainable Forest Management at the Local Scale: A Comparative Analysis of Community Forests and Domestic Forests in Cameroon. Small Scale For. 2013, 12, 51–66. [Google Scholar] [CrossRef]
- Auzel, P. Les villes en forêt: Impact de l’exploitation forestière sur la gestion coutumière des ressources naturelles. In La Forêt des Hommes: Terroirs Villageois en Forêt Tropicale Africaine; Les Presses Agronomiques de Gembloux: Gembloux, Belgique, 2001; pp. 235–251. [Google Scholar]
- Gillet, P.; Vermeulen, C.; Lehnebach, C.; Codina Llavinia, E. What do humans eat when forests disappear? Nat. Faune 2016, 29. [Google Scholar]
- Dethier, M. Analyse de la chasse villageoise en accord avec les superficies accordées par la législation sur les forêts communautaires: Cas du village de Kompia (Périphérie Nord de la réserve de Faune du Dja); Avenir des Peuples des Forêts Tropicales; Faculté des Sciences Agronomiques de Gembloux: Gembloux, Belgique, 1998; p. 13. [Google Scholar]
- Willett, W.; Rockström, J.; Loken, B.; Springmann, M.; Lang, T.; Vermeulen, S.; Garnett, T.; Tilman, D.; DeClerck, F.; Wood, A.; et al. Food in the Anthropocene: The EAT–Lancet Commission on healthy diets from sustainable food systems. Lancet 2019, 393, 447–492. [Google Scholar] [CrossRef]
- Speedy, A.W. Global Production and Consumption of Animal Source Foods. J. Nutr. 2003, 133, 4048S–4053S. [Google Scholar] [CrossRef]
- Reynolds, C.; Buckley, J.; Weinstein, P.; Boland, J. Are the Dietary Guidelines for Meat, Fat, Fruit and Vegetable Consumption Appropriate for Environmental Sustainability? A Review of the Literature. Nutrients 2014, 6, 2251–2265. [Google Scholar] [CrossRef] [PubMed]
- Lhoest, S.; Fonteyn, D.; Daïnou, K.; Delbeke, L.; Doucet, J.-L.; Dufrêne, M.; Josso, J.-F.; Ligot, G.; Oszwald, J.; Rivault, E.; et al. Conservation value of tropical forests: Distance to human settlements matters more than management in Central Africa. Biol. Conserv. 2020, 241C, 108351. [Google Scholar] [CrossRef]
- Koerner, S.E.; Poulsen, J.R.; Blanchard, E.J.; Okouyi, J.; Clark, C.J. Vertebrate community composition and diversity declines along a defaunation gradient radiating from rural villages in Gabon. J. Appl. Ecol. 2017, 54, 805–814. [Google Scholar] [CrossRef]
- Poulsen, J.R.; Clark, C.J.; Bolker, B.M. Decoupling the effects of logging and hunting on an Afrotropical animal community. Ecol. Appl. 2011, 21, 1819–1836. [Google Scholar] [CrossRef]
- Fa, J.E.; Brown, D. Impacts of hunting on mammals in African tropical moist forests: A review and synthesis. Mammal Rev. 2009, 39, 231–264. [Google Scholar] [CrossRef]
- Fa, J.E.; Currie, D.; Meeuwig, J. Bushmeat and food security in the Congo Basin: Linkages between wildlife and people’s future. Environ. Conserv. 2003, 30, 71–78. [Google Scholar] [CrossRef]
- Vermeulen, C.; Julve, C.; Doucet, J.-L.; Monticelli, D. Community hunting in logging concessions: Towards a management model for Cameroon’s dense forests. Biodivers. Conserv. 2009, 18, 2705–2718. [Google Scholar] [CrossRef]
- Taylor, G.; Scharlemann, J.P.W.; Rowcliffe, M.; Kümpel, N.; Harfoot, M.B.J.; Fa, J.E.; Melisch, R.; Milner-Gulland, E.J.; Bhagwat, S.; Abernethy, K.A.; et al. Synthesising bushmeat research effort in West and Central Africa: A new regional database. Biol. Conserv. 2015, 181, 199–205. [Google Scholar] [CrossRef]
- Pesche, D.; Losch, B.; Imbernon, J. Une nouvelle ruralité émergente: Regards croisés sur les transformations rurales africaines; Atlas pour le Programme Rural Futures du NEPAS; Cirad, NEPAD: Montpellier, France, 2016. [Google Scholar]
- Charpin, M.; Richter, F. L’énergie Renouvelable—Vers une Modernisation de la Filière Bois-énergie; Vision 2035; Eco-Consulting Group: Oberaula, Germany, 2012. [Google Scholar]
- MINFOF. Stratégie de modernisation de la chaine de valeur bois-énergie dans l’Extrême-Nord Cameroun; GIZ: Meroua, Tunisia, 2017. [Google Scholar]
- Gazull, L.; Gautier, D. Les grands modes de gestion du bois-énergie. In Mémento du Forestier Tropical; Quae: Versailles, France, 2015; pp. 646–657. [Google Scholar]
- de Wachter, P. Économie et impact de l’agriculture itinérante Badjoué [sud-Cameroun]; Civilisations; Université Libre de Bruxelles: Brussels, Belgium, 1997; pp. 62–93. [Google Scholar]
- Gallois, S.; Duda, R.; Hewlett, B.; Reyes-García, V. Children’s daily activities and knowledge acquisition: A case study among the Baka from southeastern Cameroon. J. Ethnobiol. Ethnomed. 2015, 11, 86. [Google Scholar] [CrossRef] [PubMed]
- Oishi, T. Aspects of Interactions between Baka Hunter-Gatherers and Migrant Merchants in Southeastern Cameroon. Senri Ethnol. Stud. 2016, 94, 157–175. [Google Scholar]
- Joiris, D.V. La chasse, la chance, le chant: Aspects du système rituel des Baka du Cameroun; Université Libre de Bruxelles: Brussels, Belgiums, 1998. [Google Scholar]
- Leclerc, C. L’adoption de l’agriculture chez les Pygmées Baka du Cameroun. Dynamique Sociale et Continuité Structurale; Quae: Versailles, France, 2012. [Google Scholar]
- Porro, R.; Tiani, A.M.; Tchikangwa, B.; Sardjono, M.A.; Salim, A.; Colfer, C.J.P.; Brocklesby, M.A. Access to Resources in Forest-Rich and Forest-Poor Contexts. In People Managing Forest: The Links between Human well being and Sustainability; Resources for the Future and CIFOR: Washington, DC, USA, 2001; pp. 250–273. [Google Scholar]
- Pröpper, M.; Haupts, F. The culturality of ecosystem services. Emphasizing process and transformation. Ecol. Econ. 2014, 108, 28–35. [Google Scholar] [CrossRef]
- Scholte, S.S.K.; van Teeffelen, A.J.A.; Verburg, P.H. Integrating socio-cultural perspectives into ecosystem service valuation: A review of concepts and methods. Ecol. Econ. 2015, 114, 67–78. [Google Scholar] [CrossRef]
- Díaz, S.; Pascual, U.; Stenseke, M.; Martín-López, B.; Watson, R.T.; Molnár, Z.; Hill, R.; Chan, K.M.A.; Baste, I.A.; Brauman, K.A.; et al. Assessing nature’s contributions to people. Science 2018, 359, 270–272. [Google Scholar] [CrossRef]
- Milcu, A.I.; Hanspach, J.; Abson, D.; Fischer, J. Cultural ecosystem services: A literature review and prospects for future research. Ecol. Soc. 2013, 18, 44. [Google Scholar] [CrossRef]
- Pascual, U.; Balvanera, P.; Díaz, S.; Pataki, G.; Roth, E.; Stenseke, M.; Watson, R.T.; Dessane, E.B.; Islar, M.; Kelemen, E.; et al. Valuing nature’s contributions to people: The IPBES approach. Curr. Opin. Environ. Sustain. 2017, 26, 7–16. [Google Scholar] [CrossRef]


| Ecosystem Services | Number of Households | Origin | Ethnic Group | Main Source of Income | Mean Daily Income | Maximum Level of Education |
|---|---|---|---|---|---|---|
| Bushmeat Consumption | 13 | 0.306 | - | 0.195 | 0.992 | 0.551 |
| Firewood Consumption | 47 | 0.145 | 0.125 | 0.735 | 0.232 | 0.054 |
| Timber Consumption | 32 | 0.499 | 0.387 | 0.334 | 0.463 | 0.304 |
| Cultural Heritage and Identity | 43 | 0.838 | 0.025 * | 0.882 | 0.795 | 0.927 |
| Inspiration for Culture and Art | 43 | 0.236 | 0.115 | 0.127 | 0.645 | 0.584 |
| Spiritual Experience | 43 | 0.424 | 0.044 * | 0.585 | 0.096 | 0.448 |
| Recreation | 43 | 0.992 | 0.558 | 0.802 | 0.583 | 0.076 |
| Education | 43 | 0.873 | 0.156 | 0.579 | 0.434 | 0.856 |
© 2020 by the authors. Licensee MDPI, Basel, Switzerland. This article is an open access article distributed under the terms and conditions of the Creative Commons Attribution (CC BY) license (http://creativecommons.org/licenses/by/4.0/).
Share and Cite
Lhoest, S.; Vermeulen, C.; Fayolle, A.; Jamar, P.; Hette, S.; Nkodo, A.; Maréchal, K.; Dufrêne, M.; Meyfroidt, P. Quantifying the Use of Forest Ecosystem Services by Local Populations in Southeastern Cameroon. Sustainability 2020, 12, 2505. https://doi.org/10.3390/su12062505
Lhoest S, Vermeulen C, Fayolle A, Jamar P, Hette S, Nkodo A, Maréchal K, Dufrêne M, Meyfroidt P. Quantifying the Use of Forest Ecosystem Services by Local Populations in Southeastern Cameroon. Sustainability. 2020; 12(6):2505. https://doi.org/10.3390/su12062505
Chicago/Turabian StyleLhoest, Simon, Cédric Vermeulen, Adeline Fayolle, Pierre Jamar, Samuel Hette, Arielle Nkodo, Kevin Maréchal, Marc Dufrêne, and Patrick Meyfroidt. 2020. "Quantifying the Use of Forest Ecosystem Services by Local Populations in Southeastern Cameroon" Sustainability 12, no. 6: 2505. https://doi.org/10.3390/su12062505
APA StyleLhoest, S., Vermeulen, C., Fayolle, A., Jamar, P., Hette, S., Nkodo, A., Maréchal, K., Dufrêne, M., & Meyfroidt, P. (2020). Quantifying the Use of Forest Ecosystem Services by Local Populations in Southeastern Cameroon. Sustainability, 12(6), 2505. https://doi.org/10.3390/su12062505