Article

An Introduction to Neighborhood Sustainability Assessment Tool (NSAT) Study for China from Comprehensive Analysis of Eight Asian Tools

1
Department of Architecture and Built Environment, the University of Nottingham Ningbo China, Ningbo 315100, China
2
Centre for Sustainable Energy Technologies, the University of Nottingham Ningbo China, Ningbo 315100, China
*
Author to whom correspondence should be addressed.
Sustainability 2020, 12(6), 2462; https://doi.org/10.3390/su12062462
Submission received: 3 January 2020 / Revised: 14 March 2020 / Accepted: 18 March 2020 / Published: 20 March 2020

Abstract

:
In comparison to city-level and building-level sustainability research, neighborhood-level sustainable urban development is less studied. One of the ways of achieving sustainability at this level is the use of the Neighborhood Sustainability Assessment Tool (NSAT), which focuses on the sustainable urban development of districts, communities, and neighborhoods. NSAT is comprised of urban sustainable indicators and associated points ascribed towards achieving specific urban agendas, called headline sustainability indicators (HSIs) and themes. In China, neighborhood-level sustainability agenda has just been recently established in 2017. Hence, there is an immediate need for NSAT development of multiple cities responding to specific regions of different climate zones in China. As an example, this study utilizes the case of Ningbo City, located in east China, for such NSAT development. This paper provides a comprehensive analytical and comparison study of eight Asian NSATs to highlight compatibilities and extract specific indicators for a new NSAT development for China. The results from this comparative and analytical study, developed through a multidimensional approach of sustainable pathway model (SPM) inform a new NSAT development in a new context. This novel contribution is significant in a context where neighborhood sustainability measures are recently developed. This study serves as the starting point for future research of NSATs in China and other countries.

1. Introduction

1.1. The Significance of Neighborhood Sustainability Assessment Tools (NSATs)

The concept of ‘sustainable development’ has been increasingly popularized in our daily life due to a myriad of reasons, such as climate change (global warming) and resource shortages (fossil fuel consumption and depletion); these issues are all environmental issues that are related to the negative impacts of human activity, and have attracted the attention of local communities, experts, and government agencies. “Seeking to meet the needs and aspirations of the present without compromising the ability to meet those of the future” [1]; and to satisfy this definition, the word ‘sustainability’ emerged. Though the definition is widely contested due to its anthropocentric focus by many eco-centric and neutrals, it does not take away from the fact that the Brundtland Report (where this definition was first coined) has raised awareness towards the general agenda of survival of all species and associated resources. With this development, sustainability has expanded and is being applied in many aspects, including architecture, environment, community, and other terms. This has led to the emergence of urban sustainability and sustainable urban development. Urban sustainability simply implies the final state at which the urban environment attains a balance between environmental protection and integration, economic development and regeneration, and social equity and justice within cities. Furthermore, sustainable urban development simply refers to the process in which urban sustainability can be achieved, supported by an urban development strategy.
In general, there is no definite definition of sustainability due to its contested, philosophical, broad, and multifaceted nature [2]. Depending on the aspect or theology a society (inclusive of experts, decision makers, government) stands on, this tends to shape the interpretation of sustainability which may take anthropogenic origins, eco-centric origins, or somewhere in between. Anthropogenism is the ideology that the welfare of humans is the ultimate drive to defining environmental policies and ideas, and in this case sustainability. Eco-centrism views the intrinsic value of nature as equal to that of man’s, with no duality between the two. The impact of these theologies is far reaching as it determines the shape and form sustainability will take and ultimately the tools (i.e., indicators, policies, assessment tools, and frameworks) used to reach urban sustainability. The boom of the topic of sustainability fully emerged in the early 2000s, which was termed in sustainable science. The term means:
the cultivation, integration, and application of knowledge about Earth systems gained especially from the holistic and historical sciences…coordinated with knowledge about human interrelationships gained from the social sciences and humanities, in order to evaluate, mitigate, and minimize the consequences…of human impacts on planetary systems and on societies across the globe and into the future”.
[3]
All these have led to more practical approaches to sustainable urban development. In the urban arena, sustainability is not just achieving parity between all three classical dimensions of sustainability (DoS) (i.e., economic, social, environment), but it is doing so considering the physical urban form. This concept has led to the emergence or branding of certain approaches to achieving urban sustainability, i.e., sustainable cities, low-carbon cities, eco cities, smart cities, etc. Not forgetting that this study is in the context of China, the three popular sustainable city typologies that China has invested majorly in are ‘sustainable,’ ‘eco,’ and ‘smart’ cities. Development and research into these types of cities have been practiced over the past two decade with various levels of success, such as Tianjin eco-city and many other examples across the country. The concept of smart cities has become the recent branding agenda that governments have followed with the overarching ideology that the three DoS can be enhanced with smart technology and practical accumulation and use of digital information.
Another popular tool in the sustainability science arena, though not fully practiced in China but practiced in most developed countries, is the use of neighborhood sustainability assessment tools (NSATs) or NSA toolkits. NSATs focus on the sustainable urban development of districts, communities, and neighborhoods. Urban sustainable indicators and associated points are ascribed towards achieving specific urban agendas, called headline sustainability indicators (HSIs) and themes. These points are then accumulated and the neighborhood is given a sustainability value and brand to indicate and demarcate lower and stronger realization of urban sustainability. This approach is viewed as highly subjective due to the selection of the HSI, associated indicators, and points allocated to the HSI. Also, a majority of these principles are governed by the anthropogenic origins of sustainable urban development. Yet, it is a concept that this study subscribes to and utilizes in determining the sustainability performance of the currently developed Asian tools and how they can help to inform the development of such a tool in China. The reason for focusing on China is because no such urban tool has been developed for any region and this is perplexing due to the immense urbanization challenges, environmental and climate change issues, and other socio-economic difficulties that China currently face. However, a small number of Building Research Establishment Environmental Assessment Method (BREEAM)- and Leadership in Energy and Environmental Design (LEED)-based neighborhood projects have been executed in regions of China. NSATs are in a position to mitigate current urban development challenges, as the tools are known to nudge the planning organization to define and use sustainability targets early in the process; the systems can highlight environmental and other sustainability issues that would otherwise be overlooked during urban planning; evaluate an area against a number of pre-defined sustainability criteria; provide the means to compare best sustainability practices within cities by issuing certificates. Due to the sheer size of China where cites are the size of countries in land mass and population, the city of Ningbo is used as a case to determine how NSATs could be developed in the Chinese region.

1.2. Aims and Objectives

To determine how Chinese cities can start the development process of NSATs, the following aims need to be achieved. First, there is a need to analyze Asian NSATs to obtain their similarities and differences. This is important to have a better overview of NSATs in contexts closer and similar to China. Second, by analyzing the dimensions and procedural, feature, performance categorization of the HSI in the Asian tools, it is possible to then determine their levels of sustainability and applicability in the practice of sustainable urban development, specifically at the neighborhood level. Third, by doing the first two steps, it is then feasible to identify and select common and uncommon indicators in these Asian NSATs, and analyze their feasibility in Ningbo or other cities in China. And last, this leads to further discussion on the integration of NSATs with local institutions and local codes to predict the development prospect of NSATs in the contexts of Ningbo (as a city) and China (as a country). By addressing the above, an introductory procedure to aid the preliminary development of Chinese based NSAT can proceed.

2. Literature Review

2.1. The Historical Development of NSATs

NSATs, which is short for ‘Neighborhood Sustainability Assessment Tools,’ represent the methods to assess the extent of sustainability of an urban environment. Since ancient times, cities have been separated into districts and neighborhoods. Furthermore, neighborhoods are described as building blocks of cites, often with their own cultural, economic, and social style. Therefore, the measures of assessing neighborhood and community to improve the quality of life should be traceable. In the 1960s, some environmental problems came out due to the unrestricted economic issues during the Second World War. This caught the attention of many specialists, especially in the United States. Therefore, in the late 1960s, the USA became the first country in the world to regard environmental assessment as a mandatory project for urban planning. Then, in the 1980s, the International Association for Impact Assessment (IAIA) was established to promote the evaluation of the environment and related issues [4].
With the evolution of this, NSATs emerged gradually due to the approval of sustainability as a concept, which was a milestone during the development. It started from the appearance of Building Research Establishment Environmental Assessment Method (BREEAM) communities, the NSAT of the UK, in the 1990s [4]. BREEAM is an environmental assessment method for new building and community design, which considers the three dimensions of sustainability: Environment, economy, society [5]. After this, a series of NSATs for different countries in the world has been published to attain urban sustainability through sustainable urban development, such as Leadership in Energy and Environmental Design (LEED) neighborhood development (the US) and Comprehensive Assessment System for Built Environment Efficiency (CASBEE) urban development (Japan). More recently, there has been a boom of such tools in the Asian regions (including but not limited to: Green Mark for Districts; Green Building Index (GBI); Global Sustainability Assessment System (GSAS): District; The Pearl Community; Green Township, etc.). This partly occurs due to the Asian countries’ increased socio-economic development, and partly due to the global fight for climate change in which affects are more severe in developing countries and those with already harsh climates and unique topology. Whichever the case may be, the assessment tools exist in several Asian regions except China, which is intriguing due to China’s current environmental issues, infrastructural expansion, and population boom. This notion is now the precursor to this study, due to the advantages that NSATs possess (see Section 1) and the local and context specific advantage NSATs possess over more city wide tools.

2.2. The Gaps and Disadvantages of NSATs

Despite the history of NSATs being short, it has received considerable attention around the world. However, there are still some gaps during the development. First, these NSATs are developed and revised by specialist and scientists for private or government organizations, given the tool’s severely top-down approach, which generally lacks local content, and participatory decision making. The pitfall to this is that indicators used to measure these issues would come from generalized views and possibly ill-informed perspectives. This is mainly due to the lack of local experience that experts may have in the region the tool is being developed in [5]. Also, when considering the HSI that deal with the problems in urban development, due to lack of citizen participation there can be a disconnect between theory and reality [5,6]. If the simulation and development of indicators are made considering the locale populace, the tools would be approximated more to the reality of the urban environment where they reside, and play a better role in sustainability indicators and standards [6]. NSATs operate under a weighting system, which is expert led, and preference of all parties are not considered well. However, inclusion of residents’ opinions in assessment process could improve current NSATs. Berardi [7] argues that citizen-based systems are more successful in measuring individual happiness with local areas.
Secondly, a few countries tend to establish their own NSAT for urban development. However, they may use the established tools for reference and take their criterion directly without considering whether it is suitable for their own countries. This often leads to some unfeasible results because some of the indicators may not be suitable or have some slight deviations when applied in a different context [4]. Therefore, revising the tools according to local features is significant. Sharifi and Murayama [4] and Dawodu et al. [5] suggest that it is more ideal that every country develop its own assessment tool, therefore, adaptation and locality should be considered into adopted tools [5]. Local adaptability, which is related to context and development type, are significant for achieving ‘consideration of local values’ in assessment, which represent the social aspects of sustainability that revolve around equity and justice.
Furthermore, NSATs were developed on the premise of the three DoS, yet the institutional dimension has an essential role in guiding human interactions [8]. However, NSATs have failed to address institutional aspects of sustainability. A large number of tools have no mechanism for assessment of the performance of governmental and non-governmental institutions in the neighborhood [4]. Further to this study, Dawodu et al. [5] revaluate NSATs from a multidimensional perspective and make similar claims to the lack of institutional dimensions. In the same study, Dawodu et al. [5] utilize the four DoS and postulate that all the indicators in the tools can be categorized into a specific dimension (environmental, social, economic, and institutional), or a combination of them to form linear or phase model. However, it is difficult to achieve a combination of all four dimensions in one indicator [5]. Accordingly, their research on four NSATs (BREEAM communities, LEED ND, GBI, and Indian Green Building Council (IGBC) illustrated that most of the indicators belong to point (i.e., one dimension of sustainability) or linear model (i.e., two dimensions of sustainability) [5]. It also validated Sharifi and Murayama’s [4] and Komeily and Srinivasan’s [9] claim through the use of the multidimensional approach of the sustainable pathway model (SPM) that the predominant focus of these NSATs are mainly environmental. This argument was further supported by Murgante et al. [10] who argue that there is a lack of balance between different sustainability dimensions. The study also championed the notion that HSI needs to consider multiple dimensions as a way of improving the strength of sustainability when an HSI is practically executed, but achieving more dimensions will also be more difficult to achieve and may consume more resources and manpower. However, this state of parity between four DoS is what all NSATs should strive to achieve [2,11].
Furthermore, sustainability cannot be limited to a certain period dimension since it is about present and future generations [9]. Therefore, it is also essential that NSATs have a lifetime approach toward projects. Nevertheless, current tools failed to focus on this dimension. In fact, this problem will test NSATs’ ability to adapt to changes in neighborhoods over time. In other words, neighborhoods may change with time, and NSATs need to introduce mechanisms to have a continuous assessment. The abovementioned examples have addressed gaps observed in NSATs over the last few decades in various global regions. Hence, some key reasons are estimated to exist that could hinder NSATs from attaining full potential in China. It is worth noting that the governance in China is quite different from western countries, mainly focusing on the national level rather than neighborhood. This also creates a possibility for many national-level initiatives that later transform into neighborhood level for implementation. According to Agenda 21 [12], institutional DoS has gradually become the fourth dimension, which replaced the traditional three DoS concept. Therefore, in terms of institutional aspects, it is important to identify and assess the relative context that would influence sustainable neighborhood planning in China.
Here, we highlight four main institutional problems NSATs need to consider before it could work well in China:
(1) Policy design and legal support is insufficient.
Neighborhood planning was involved in China formally in 2017, which is very late compared to other countries. Besides, there are only a few cases following predetermined nationwide practices due to lack of definition about role of ‘neighborhood planning’ in China. Furthermore, the legal system is not well established and needs to be updated. For different stages of neighborhood planning, a main accountable leader is needed to make clear responsibilities of all departments.
(2) Local governance and planning context is inappropriate.
Similar to many developing countries, in China, there is a lack of support in both financial and social aspects. This occurs often in the rapid process of urbanization that focuses more on economic development and economic growth. This is essentially the case in China, considering its five-year plan framework that has focused primarily on economic development.
(3) Sense of community and participation in planning is weak.
Community decision making has not been practiced widely in China due to historical and social reasons. Hence, there is still a lack of broad participation at the local level and by the civil society [13]. Furthermore, nowadays in China both the public and authorities are more concerned about final outcomes rather than procedure to achieve sustainability. This goes against the value behind the systematic and strategic process in planning. From a sustainability standpoint, it is far more valuable for a community to play a part in decision making processes. Therefore, this should be adapted in a process of understanding the NSATs’ applicability.
(4) Lack of sustainable infrastructure and deteriorating environment
For the first problem, selective urban development modes in China are widely regarded as unsustainable. There are examples of many high-rise compounds, which are dependent on high usage of private cars, larger walkable catchment areas, and creation of super-sized urban blocks. Therefore, such a development pattern makes densely populated areas, which consume large quantities of natural resources beyond normal capacity [14]. Apart from some successful compact development models, there are also large scale high-rise development patterns that are not necessarily compact. This development pattern has led to destruction of forests and farms, as well as many green field areas and rural areas of the municipalities. Besides, most provinces in China cannot promise green and efficient transportation industry, and efficiency is usually 50% lower than the target level [15]. Furthermore, urban energy systems in China are currently thought to be neither effective nor eco-friendly [16]. While the capacity to increase the efficiencies are rapidly growing, there are still deficiencies in the overall energy systems, such as source of energy, issues of national grid, and lack of adaptive measures in planning. There is indeed rapid progress in China, but there are still gaps between research and practice, particularly at the neighborhood scale. Undoubtedly, ecologically-designed infrastructure is of great importance to sustainable cities and neighborhoods. For example, Schneider [17] stated the strong links between transportation systems and residents’ travel behaviors, which means a proper design of local transportation system can lead to green commuting in local neighborhoods. This means China needs a better development plan that could include more urban infrastructure. This has also been the focus of China’s current five-year plan and a major transition has already started more than five years ago.

3. Methodology

This study utilizes eight NSATs (see Table 1) with a specific emphasis or selection of Asian-based NSATs and their associated HSI. Several qualitative comparisons are used to determine the characteristics of the existing Asian NSATs to inform the development or selection of HSI for the city of Ningbo, China. The breakdown of the eight Asian tools and associated HSI can be seen in Appendix A.
This study utilizes these eight Asian NSATs to first conduct a theme-based comparison, allowing for an overall understanding of those studied NSATs. This is then supported by a dimensional analysis of those NSATs that suggest the primary and secondary derivatives for HSI. The other two comparative studies include the study of mandatory indicators, and the analysis of procedural, feature, and performance categorization. The following sub-sections describe these four comparison studies essential for the evaluation of eight Asian NSATs.

3.1. Theme-Based Comparison

Wangel et al. [6] describes theme-based comparison as a rearrangement of issues, indicators, or, in this case, HSI into a common framework or category. This redistribution of HSI also implies the redistribution of the associate credits or weights. Hence, in this study of eight Asian NSATs, similar HSI are collated together under one terminology, where an overall HSI categorization is established.

3.2. Dimensional Analysis

A content analysis via the qualitative review of each HSI is done for the eight Asian tools to identify which DoS is possessed by the HSI under investigation [5]. Invariably, each HSI is placed under a specific identified DoS or its combination. The DoS refers to environment (E), social (S), economic (E), and institution (I). Identifying these dimensions and their combinations was done via a review of all in the HSIs and the associated guidelines, aims, intent, and assessment criteria of the eight Asian tools. It is important to note that these aims, intent, and assessment criteria can be qualitative, quantitative, or both. The strategies used to identify dimensions of each HSI followed two instructions termed primary and secondary directives.
(1) The primary derivatives: Implies the identification of explicitly stated or obvious dimension(s) of sustainability that is directly shown within the text of the HSI. It should be noted that the primary directive could include two or three interrelationships, i.e., E-S-EC or E-I or E-S, etc.
(2) The secondary derivatives: This is an extraneous sustainability metric to the development of the sustainability indicators (SI), by being only indirectly linked to the motivation of the HSI under analysis. The following are the dimensions given based on four pillars of sustainability and their relationship: ‘E, S, I, EC’ relationships are known as point aspects, those with two interrelationships such as ‘E-S-EC, E-S-I, EC-S-I, E-EC-I’ are known as linear aspects, and those with three interrelationships ‘E-EC, E-S, E-I, EC-S, EC-I, S-I’ are defined as planar aspects.
Applying the above techniques on the eight assessment tools, Supplementary Table S1 provides an example of the procedure of ascribing dimensions to a given HSI. In this case the management theme under BERDE (Building for Ecologically Responsive Design Excellence) in Appendix A used. Showing all dimensions would simply be too large for this paper.

3.3. Mandatory Indicators

The mandatory indicators represent required indicators that are necessary for the HSI and usually without credits, which means that these indicators must be considered and achieved in the implementation phase of development in order to qualify to be rated. To investigate whether there should be mandatory indicators in Ningbo, we reviewed all mandatory indicators in these eight Asian NSATs. Supplementary Table S1 has examples of mandatory indicators used and analyzed in this study.

3.4. Procedural, Feature, and Performance Categorization

According to Wangel et al. [6], performance indicators focus on estimating the real performance of development area considering environmental and social influences. Absolute levels of performance and words like ‘minimize,’ ‘optimize,’ and ‘make efficient’ usually refer to this type of indicator. As for procedure-based indicators, however, they are regarded as indicators aiming at improving environmental or social performance. It contains regulations on how the process should be carried out. On the other hand, feature indicators imply the assumption of sustainability based on the feature to be implemented. This assumption is usually based on trial or tested approaches and technologies that have yielded positive sustainability results. For example, under GSAS, ‘material reuse’ would be classified as a performance-based indicator. Material reuse focuses on reducing demand for materials and is assessed by percentage levels. While for feature-based, this would be regarded as an energy-based indicator. Table 2 displays this aspect.
Next comes ‘Construction Plan’ and ‘Management Plan’ which are two procedure-based indicators. ‘Construction Plan’ encourages planning to minimize adverse environmental impacts during the construction process, while ‘Management Plan’ encourages management planning of the development during the design phase to ensure continued sustainability during the operation of the district. The results of the methodology are shown in the next section which is followed by discussion of the result with respect to its impact on Asian tools in attaining sustainability, their trend and characteristics, and also with respect to how Ningbo can begin the process of developing its own tool.

4. Results and Discussion

4.1. Type of Indicator and Performance

From Figure 1, it can be seen that performance-based indicators take up the highest part in Building Environmental Assessment Methods (BEAM) (50%), while this is the least in Pearl Community Rating System (PCRS) (8%). For Building Construction Authority (BCA) and GSAS, the proportion of performance-based indicators are both below 20%. In terms of procedure, this weighting becomes different. BCA‘s procedure-based indicators are of the greatest percentage among the eight NSATs (66%). For the other NSATs, the proportion is between 30% and 50%. When it comes to feature-based indicators, PCRS is the highest. It is interesting that the proportion of BCA and BEAM in terms of feature-based indicators are exactly the same (21%), which are the least among the eight studied tools. This illustrates lack of focus on feature-based indicators.
However, when referring to Figure 2, it is about total percentage of performance-, procedure-, feature-based indicators. It could be seen that the proportion of three different criteria do not vary much (36%, 33%, 31%). Feature-based indicators take up the most part (36%), while percentage for performance is the least (31%). Since feature-based indicators are about evaluating whether specific solutions or equipment are prepared, many countries such as UAE and Qatar pay more attention to it. However, as for performance-based indicators, they are not regarded to be as important as feature-based ones. Performance-based indicators generally concentrate on the real performance of a development area considering environmental and social influences. However, it is quite difficult to ensure this in developing countries. For example, in China, projects are more goal driven (performance-based) and place less emphasis on procedures. Though procedures are used especially in environmental impact assessment of specific projects, China lays more emphasis on the result of the impact assessment and how the environmental issues raised can be mitigated. The argument would be that Ningbo would need to move from the more feature-based approach that dominates Asian NSATs to more performance-based NSATs. The reason is that the installation of a feature does not guarantee satisfactory performance. For example, installing solar panels under the renewable energy HIS may seem forward thinking, but several issues from overheating to wrong positioning of panels may affect its energy output. Rather, what would be ideal would be to place a performance target which the solar panels have to meet. This has led to the suggestion of post evaluation monitoring which monitors the performance of feature-based indicators. Also, for NSATs, a lot of procedure-based indicators deal with participation of people, plan development, or utilizing an assessment technique for points to be given. This also represents an intrinsic part of sustainability, which is meant to be systematic and progressive over time. The reality is that in terms of land use, urbanization, and city planning, the government takes a top down approach, which often lacks people participation in decision making. However, it is not unconstitutional for people to be involved in the planning process. Hence, in terms of Ningbo, there is merit in ascribing certain values to procedure-based HSIs but this should develop in a transition; i.e., procedure indicators should be linked to performance indicators, which creates a pseudo system). This would mean that points should only be given after both procedure and performance -based criterion have been verified and achieved.

4.2. Multidimensional Analysis of Eight Asian NSATs Using the Sustainable Pathway Model (SPM)

As part of the results, 
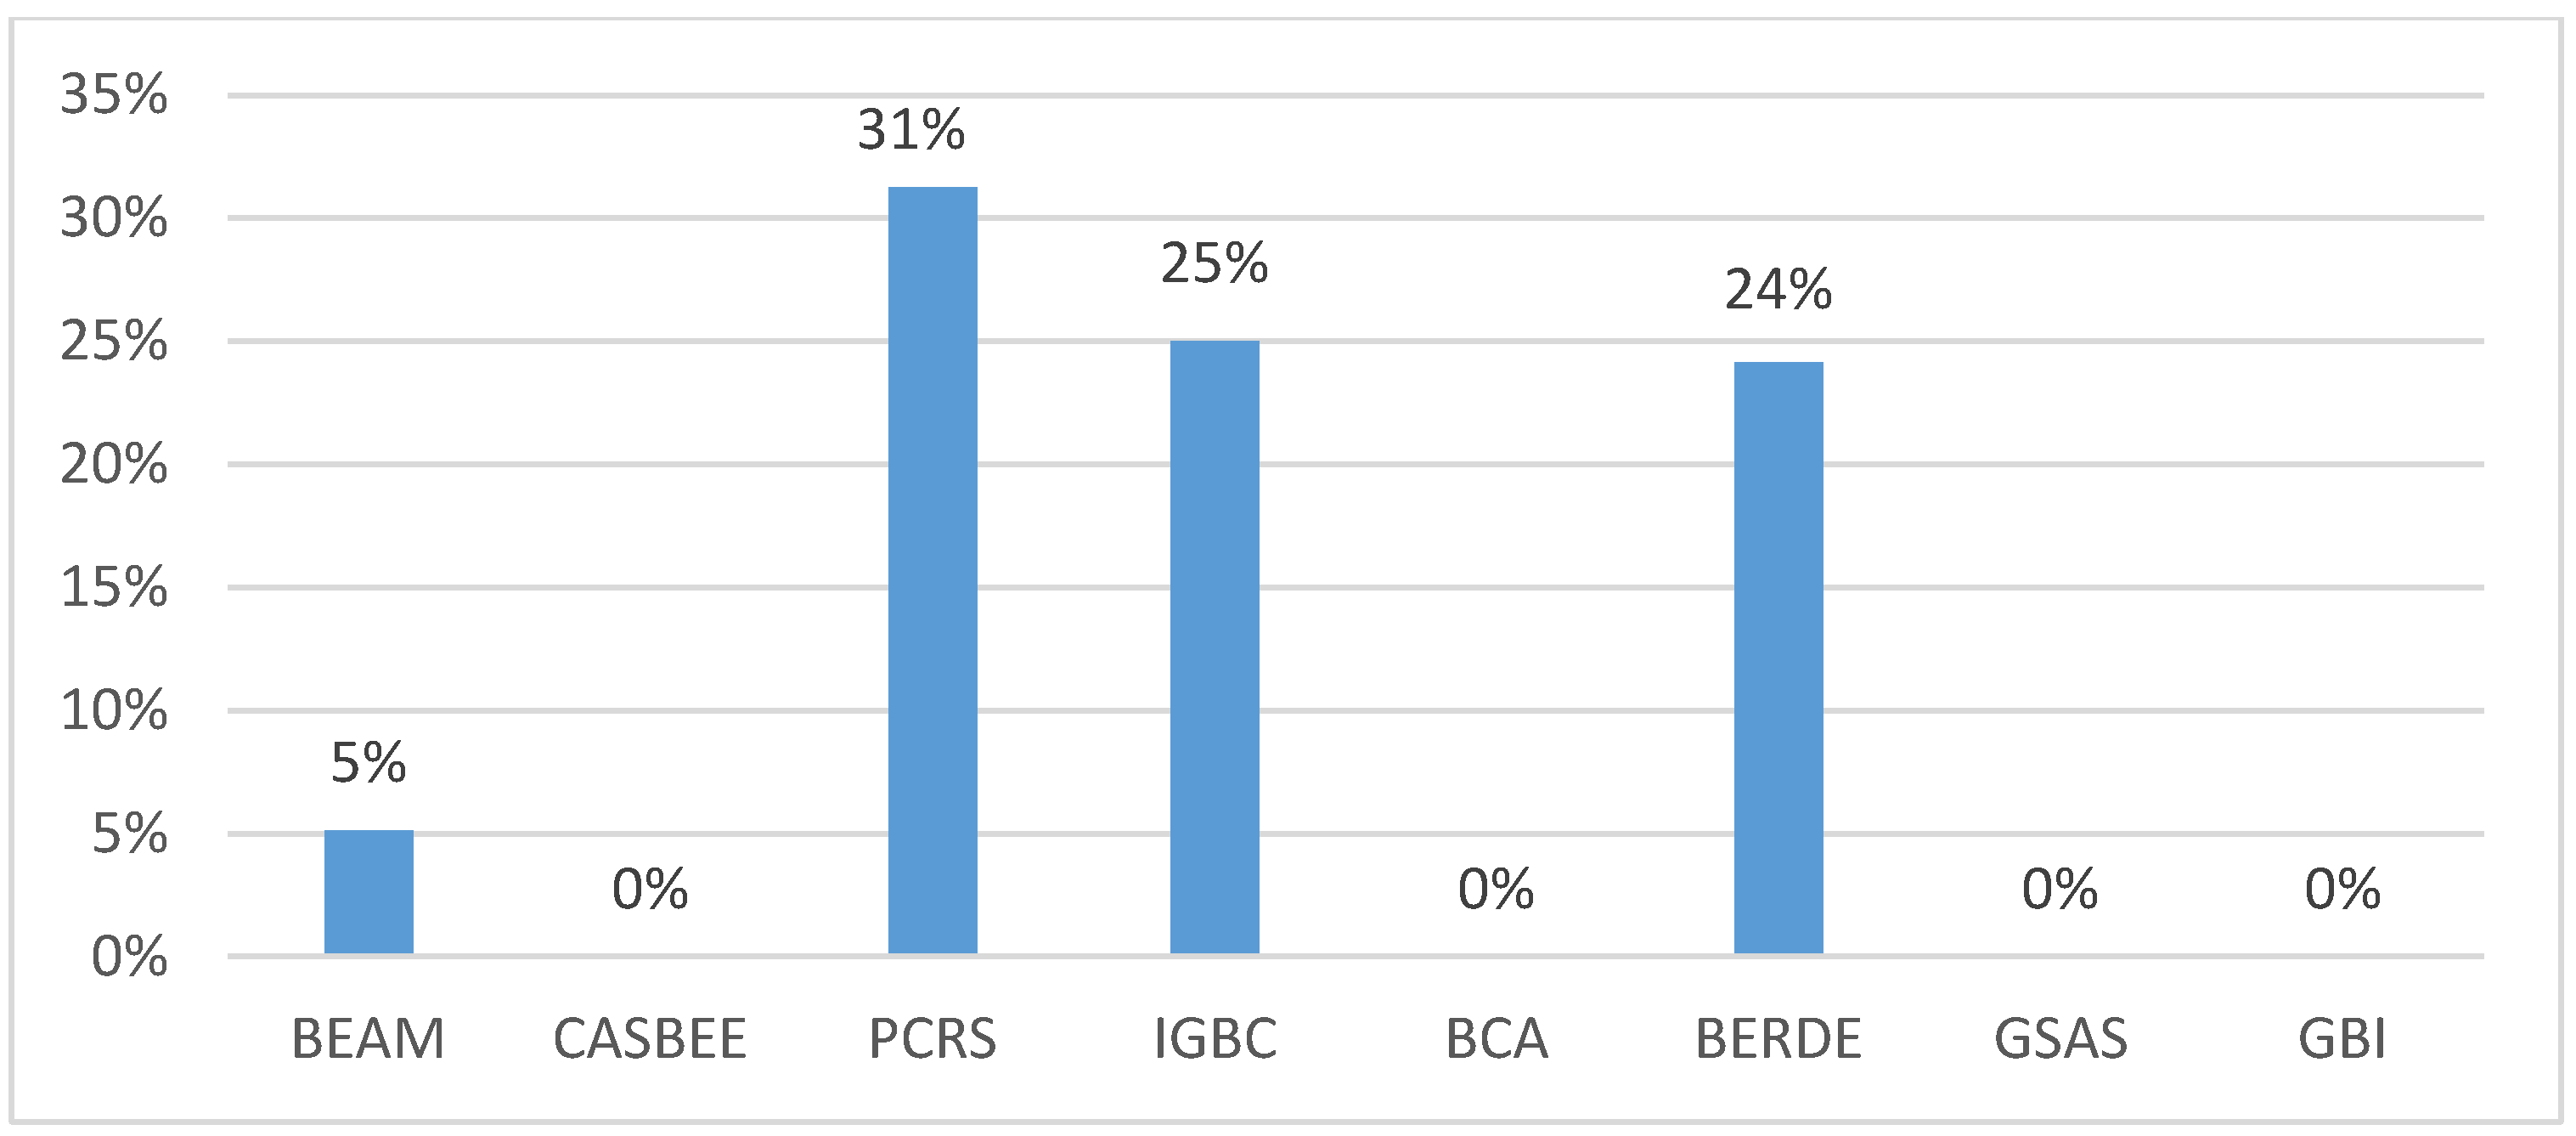
Figure 3 illustrates the SPM of all Asian tools and their averages. As demonstrated here, all tools except for BEAM and BERDE maintain a strong unilateral environmental focus. This does not indicate that these two do not focus environmentally, but they do so in combination with other DoS. For instance, BEAM has the strongest social and institutional characteristics. Also BEAM, BERDE, CASBEE, BCA, and PCRS all emphasize environmental and institutional dimensions (E-I) above 20%. Hence, it can be argued that all tools are actually focused on the environmental aspects of sustainability, however the newer tools (BEAM, BERDE, BCA, PCRS) support environmental based indicators with institutional support. GBI and BEAM are the tools with highest percentage of three dimensions (E-S-I). This indicates their strong stance towards sustainability. In total, when all dimensions are reviewed via the average, the Asian NSATs show an environmental focus.
As shown in 
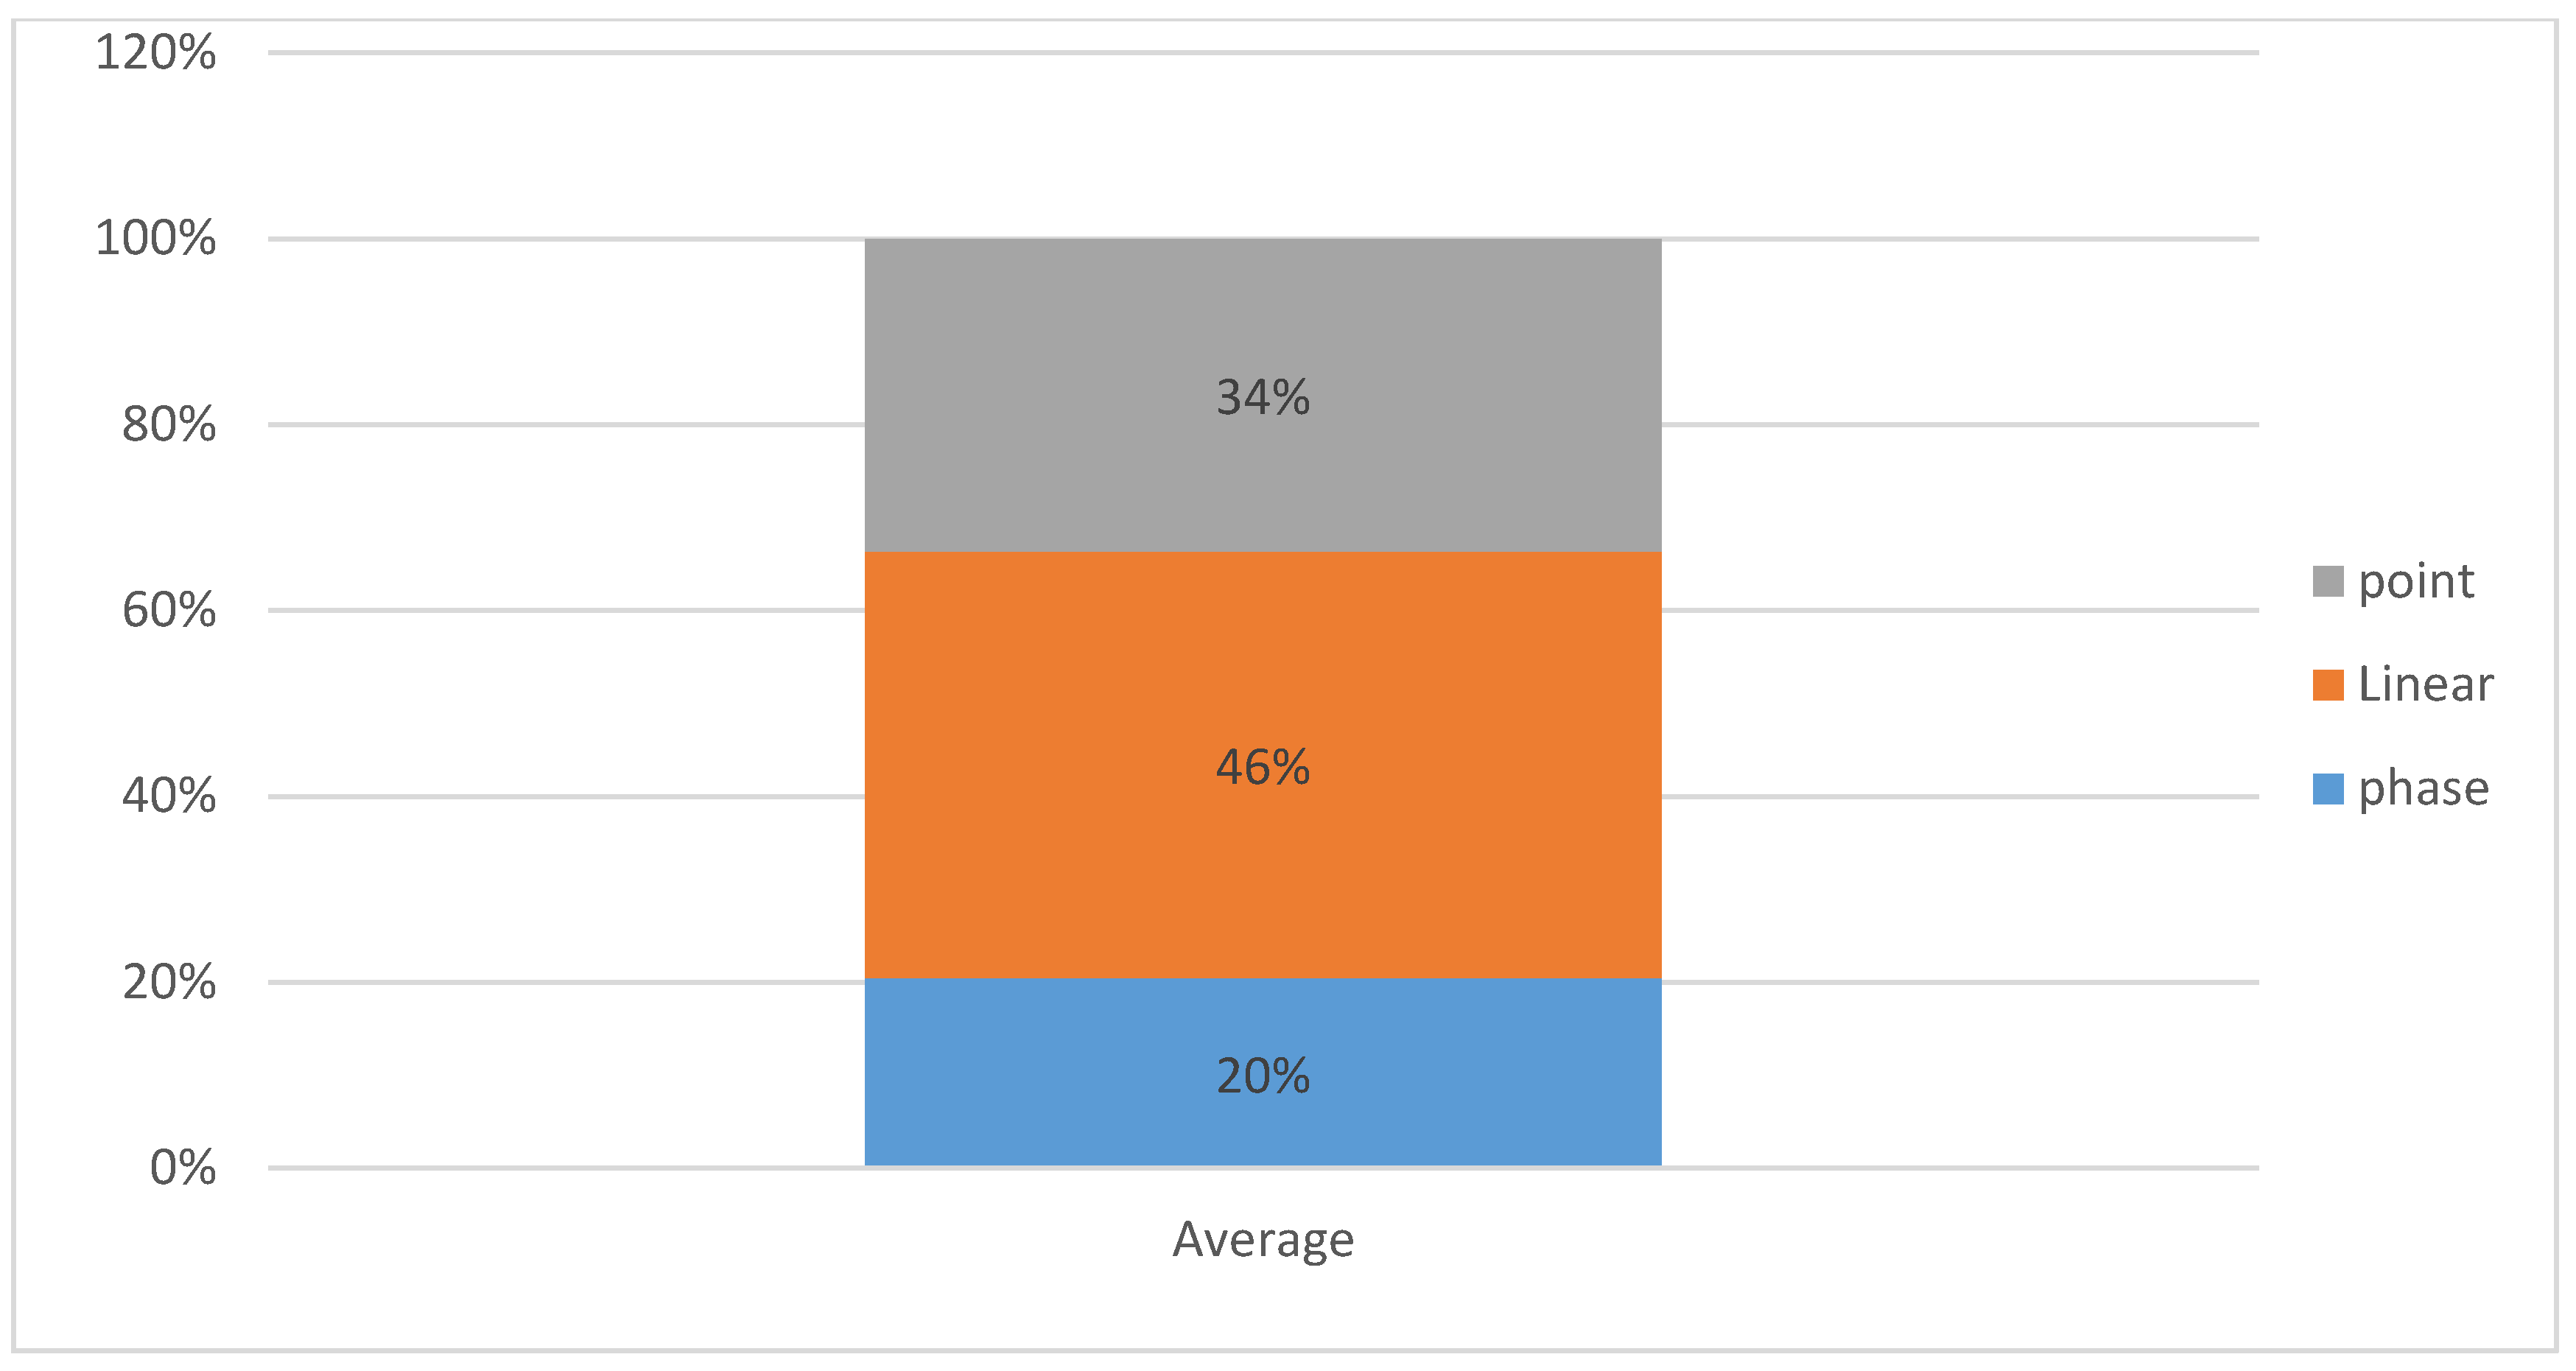
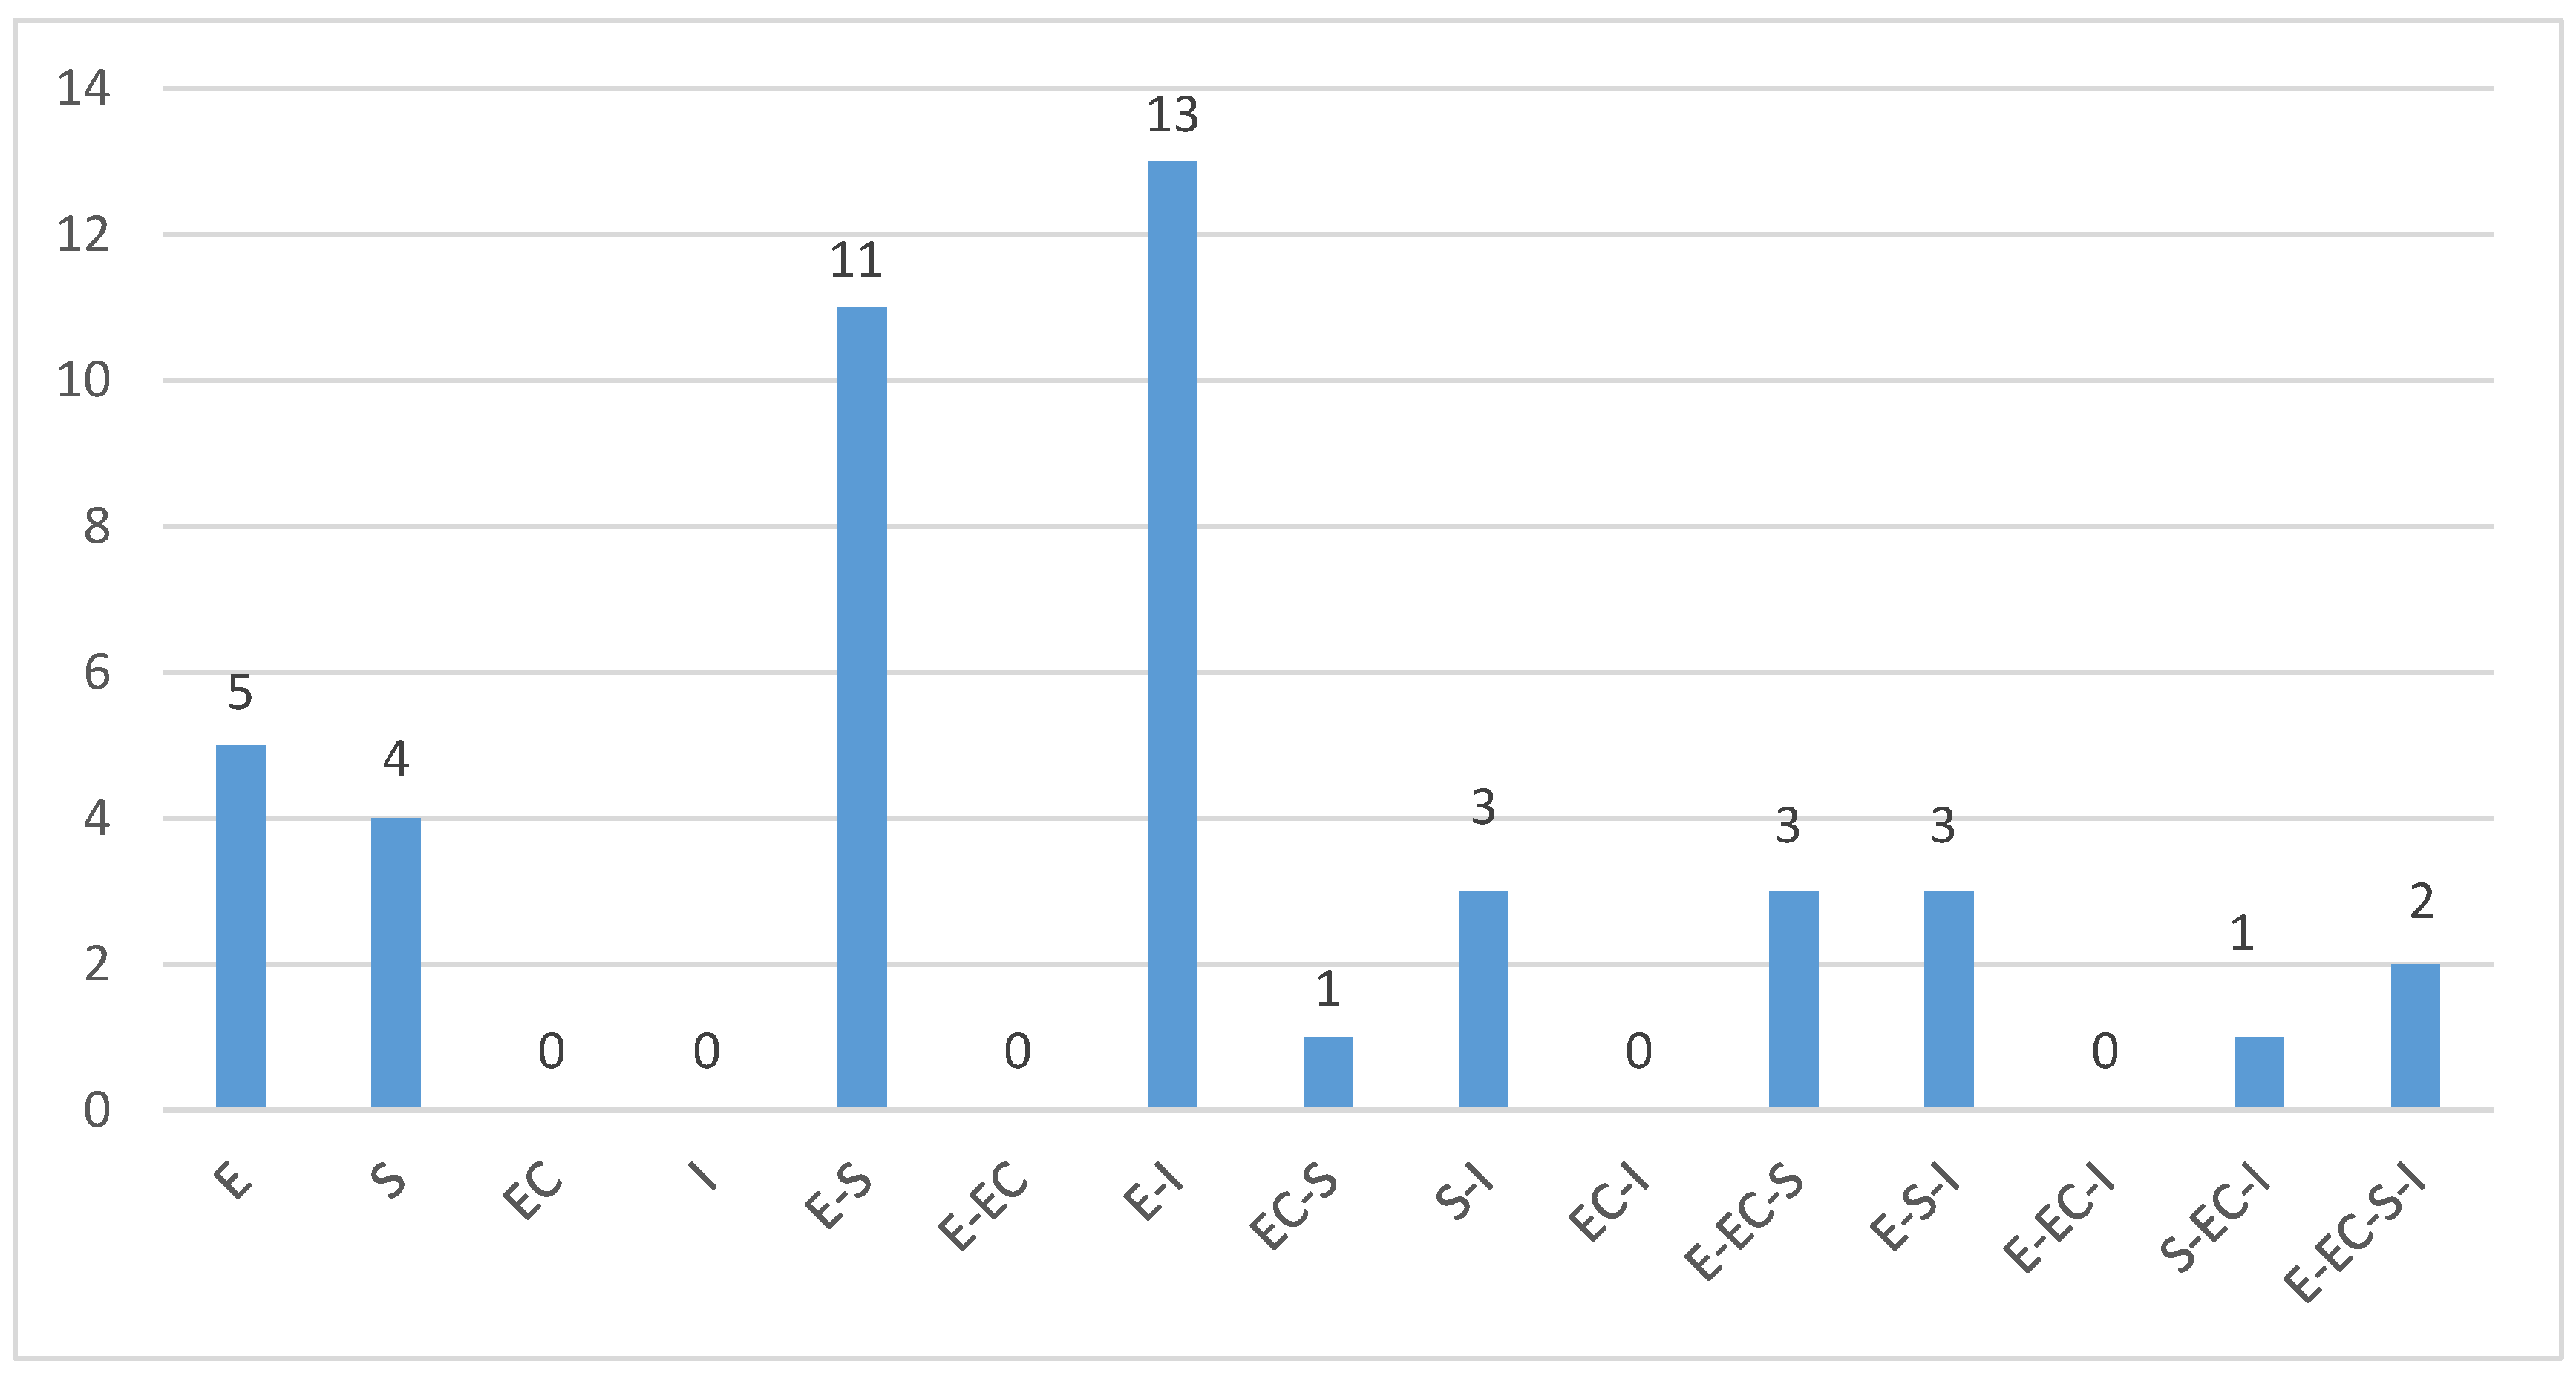
Figure 4, in terms of urban sustainability GBI, BEAM, and PCRS would be estimated to be the best tools in this comparison. More importantly, they would be ideal for a Chinese city like Ningbo to emulate in terms of DoS. This is based on the balance that can be seen between DoS as well as point, linear, and phase systems to inform and achieve urban sustainability in practice. Moreover, indicators about land reuse occur most of the time, with higher dimensions E, E-I. It could be explained by the fact that existing studies in sustainability research focus mainly on subject categories of environmental sciences, green and sustainable science technology, civil engineering, as well as construction and building technology [18]. As a result, these terms of indicators are explored more and occur as higher valued dimensions, indicating higher ability to achieve sustainability.
In terms of phase, linear, and point systems, it could be found that linear model is about half of all models (46%), while phase model is only 20% as the least model on average. In addition, the point model takes up to 34% of all HSI. A possible reason why linear model occurs the most is that, on an intrinsic level, urban issues are usually multifaceted and multi-dimensional and they deal with humans and the environment, which then suggest solutions to specific urban issues. It also makes sense that it becomes ever more difficult to consider more dimensions due to economies of scale, cost, and time associated with this endeavor. While more dimensions might mean a higher ability to reach sustainability, it is not easily attainable as further explained by the TRAC system (tractability, relationality, adaptability, contextuality), where point aspect shows very high characterization in tractability and adaptability, linear aspect shows very high characterization in contextuality, and phase aspect reveals very high characterization in relationality [5]. Also, compared to an earlier study executed by Dawodu et al. [5], which showed NSATs focusing more on a point based approach (only one dimension), more recent Asian tools as shown in Figure 4 seemingly understand the fact that the higher the combination of dimensions and interlinkages the greater the impact on achieving urban sustainability.
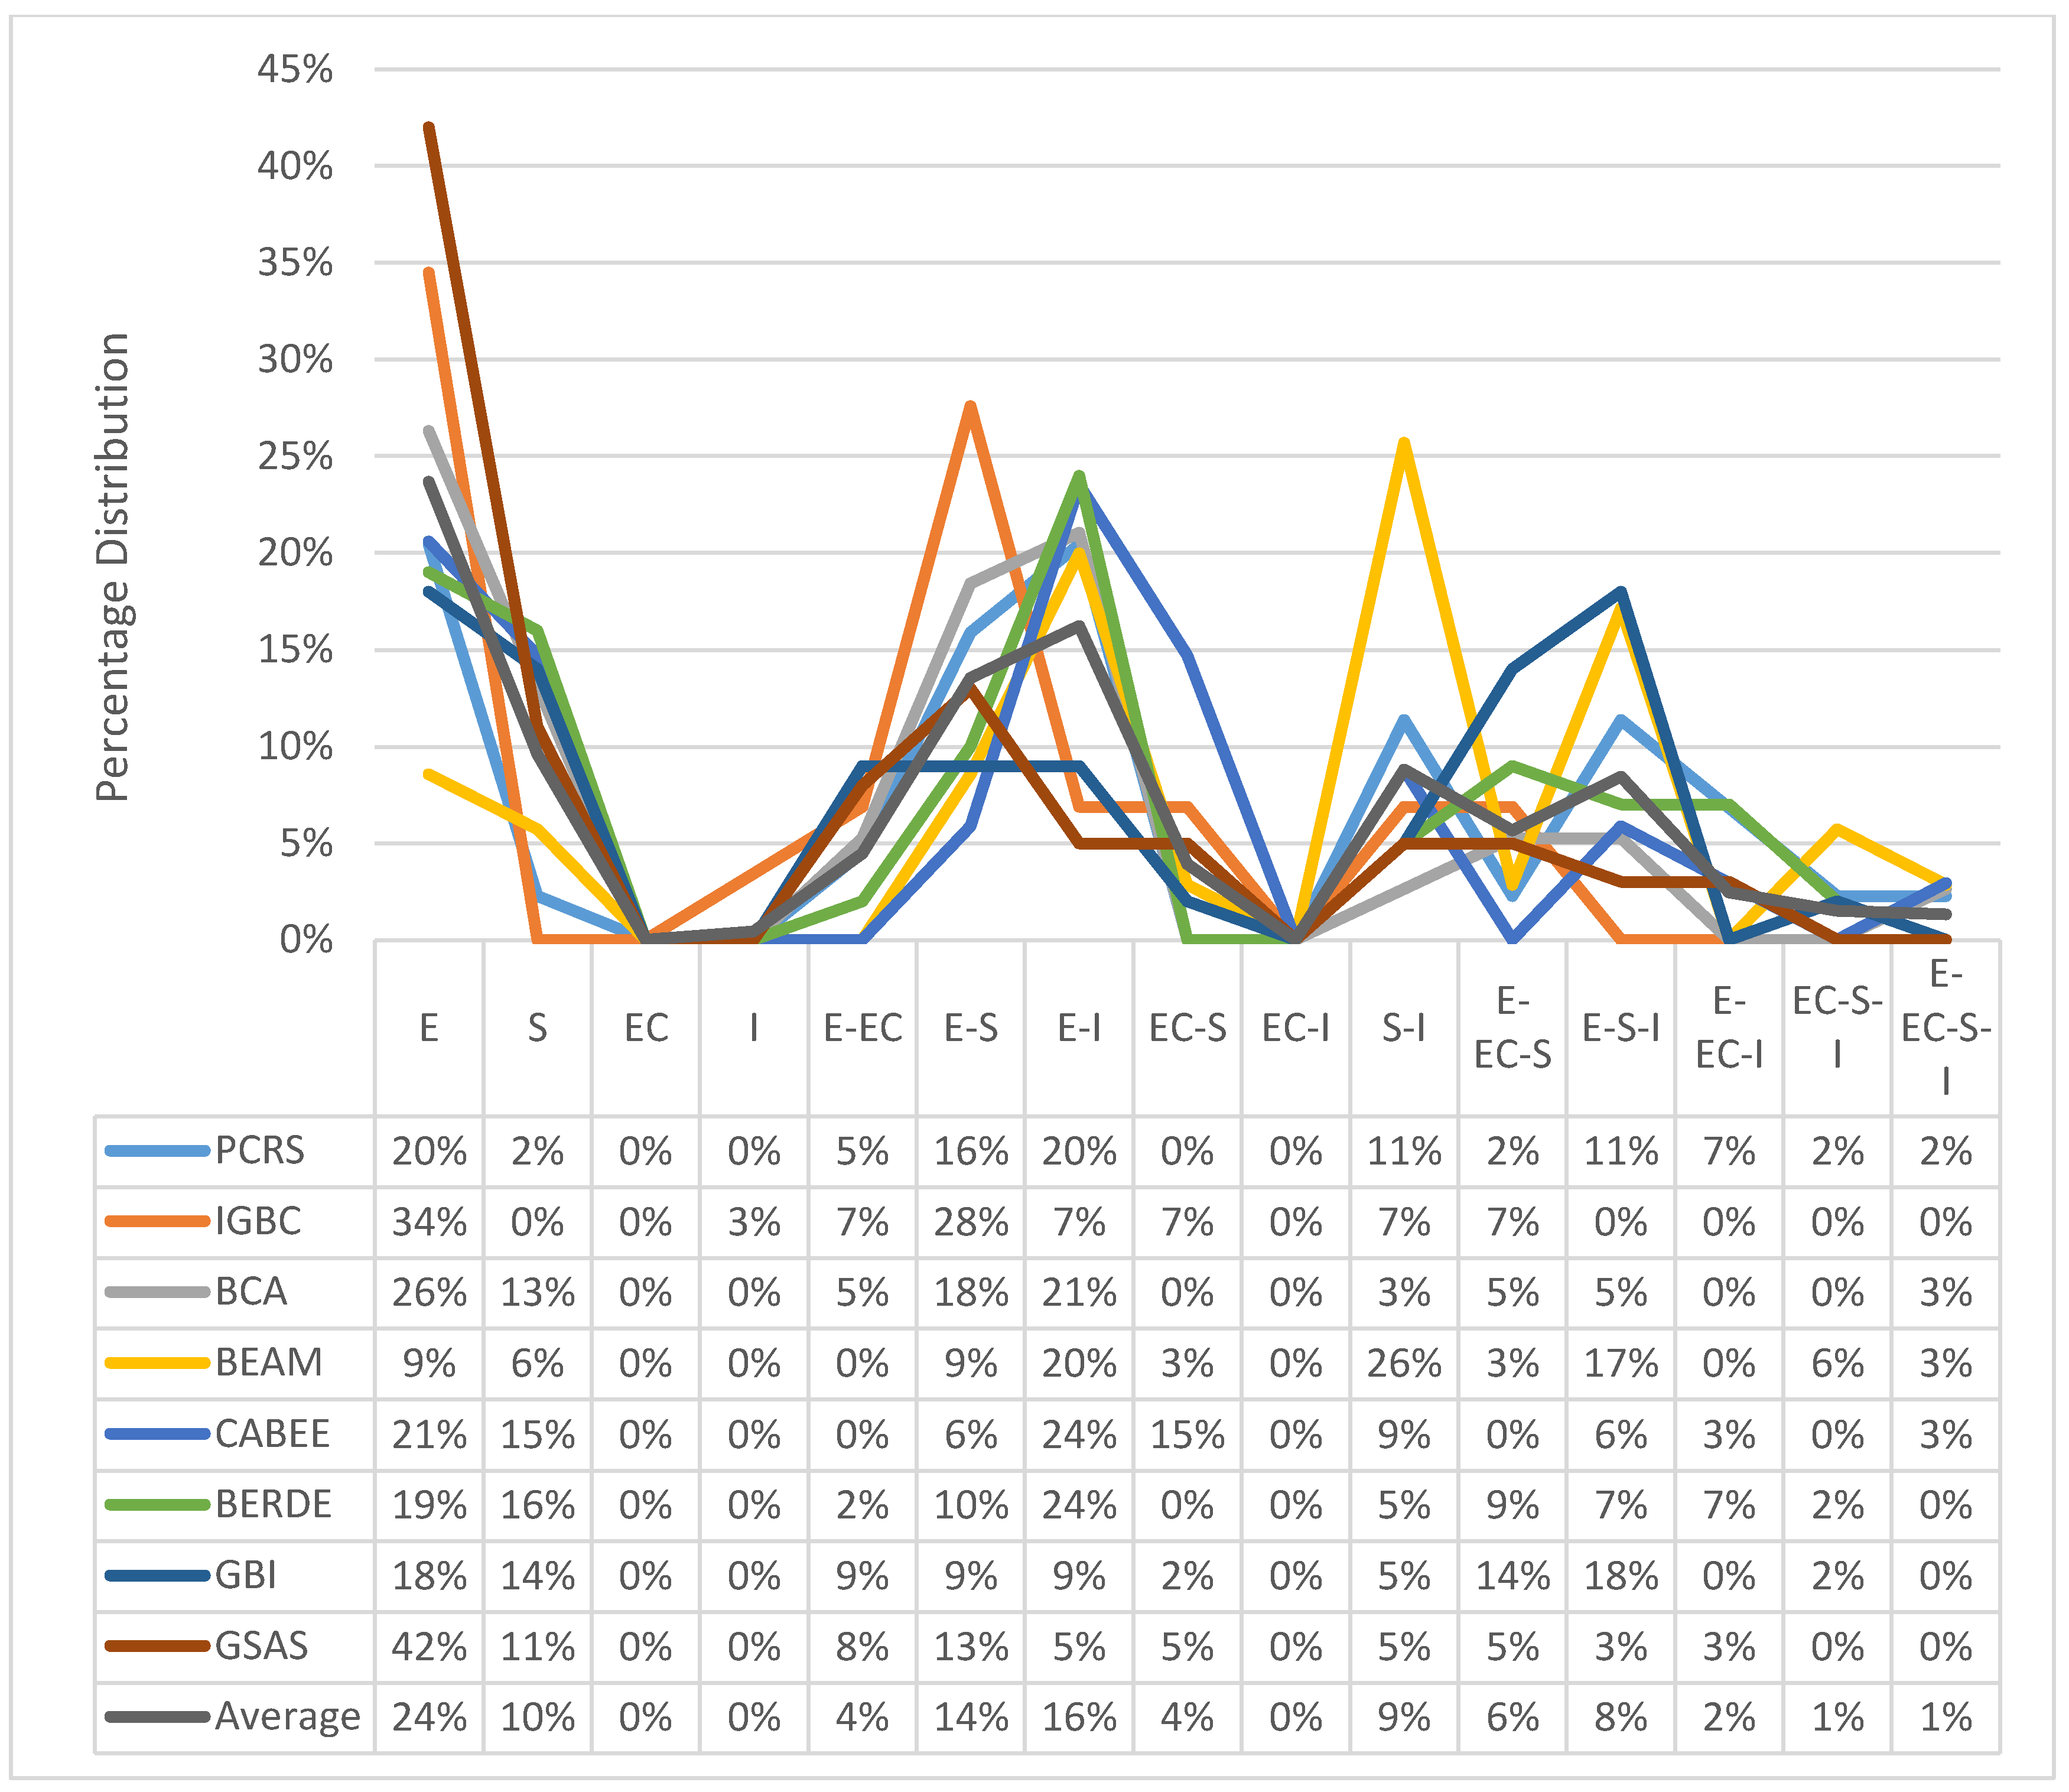
Specifically, with regard to the SPM diagram of Figure 5, it could be found that in terms of point model, criteria about environment takes up the most, while no criteria focuses on the institutional dimension [11]. In addition, E-S, E-S-I occur the most on average in the linear model and phase model, respectively. It could be concluded that most of indicators are related to environmental and social dimensions or both of them. A reasonable explanation stems from the fact that these tools were first and foremost made to combat climate change and environmental challenges. This is why previous studies have attributed NSATs to being too environmentally focused. In a bid to remedy this, more recent tools have paid more attention to the three or four DoS. This is due to the anthropocentric nature that guides NSATs, as NSATs are fundamentally made to achieve a symbiotic relationship between humans and the environment within a specific built environment [19].
Furthermore, it is argued that quantification of the suitable sustainability indicators is required to measure progress of sustainable development [
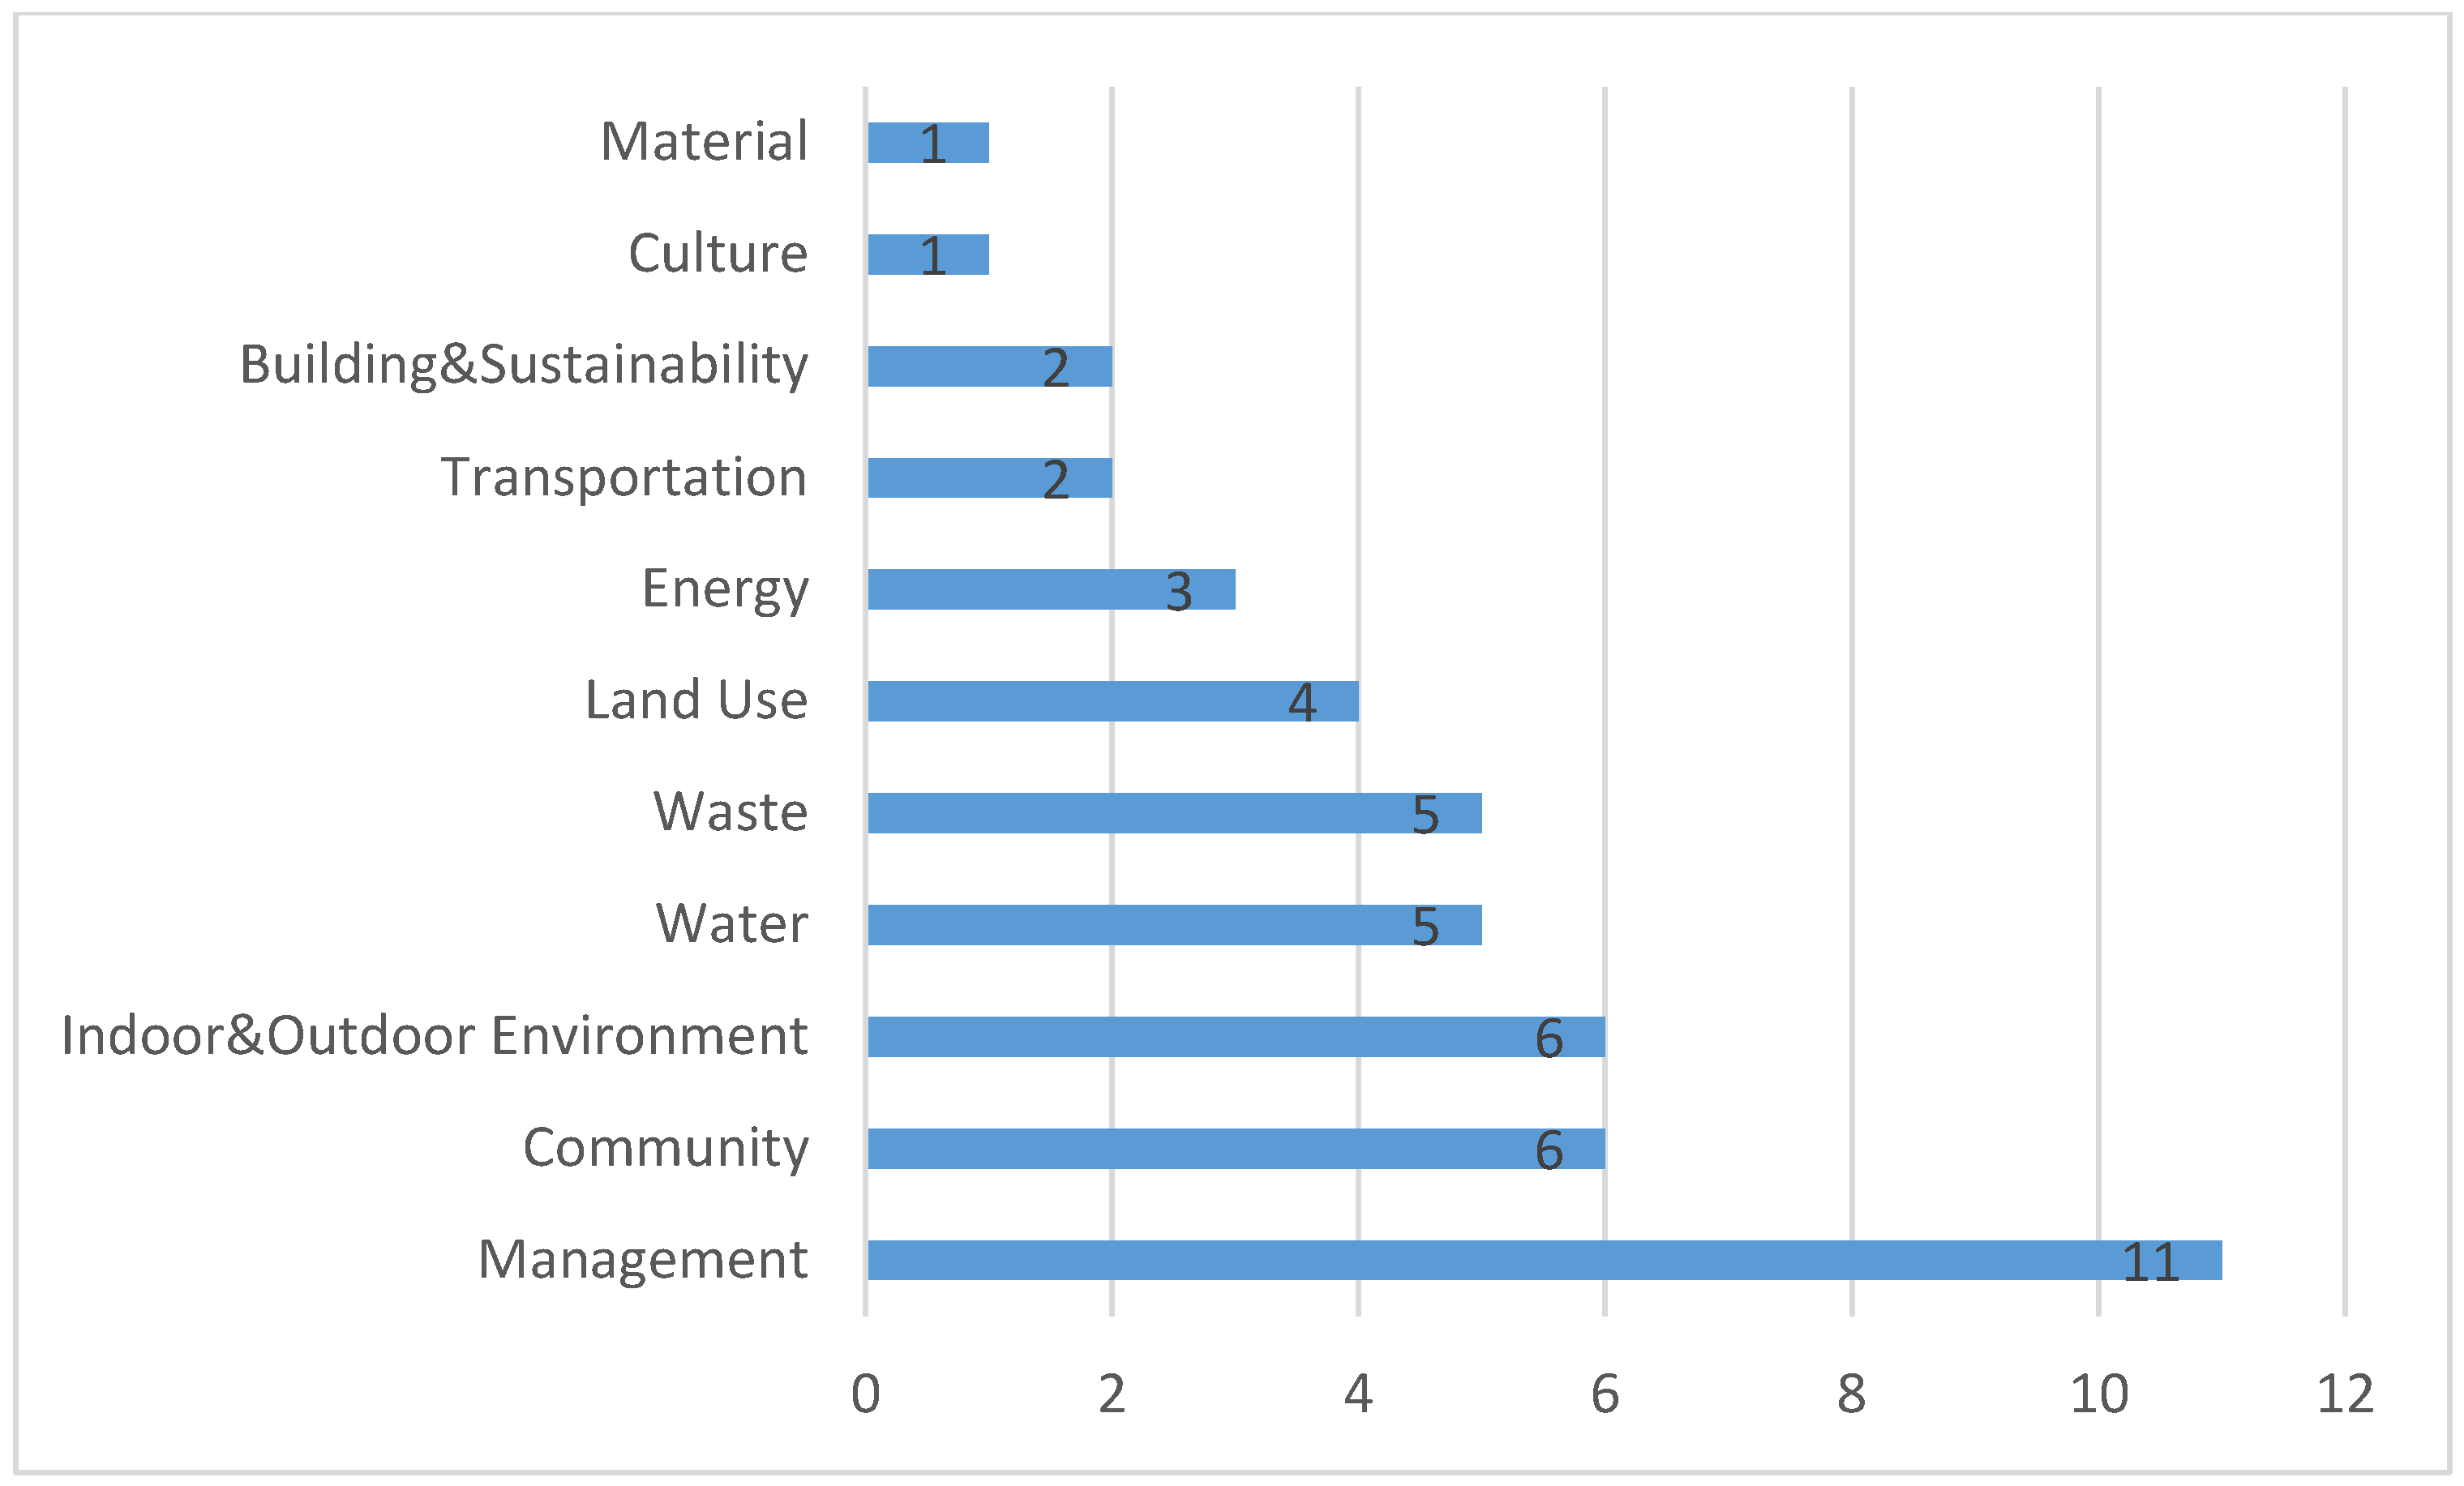
20]. Hence, it is necessary to find out indicators that occurred multiple times as well as their most prevalent dimensions. To achieve this within the eight Asian NSATs, HSI of similar aims and objectives were collated together under a combined name. For instance, in Table 3 under management, the HSI of construction plan occurs four times. When this is broken down, it means construction management system (BERDE), construction plan (GSAS), area management (CASBEE), and construction environmental management (PCRS) have similar aims and targets and have been grouped under construction plan (Appendix B gives an example of the process). Table 3 illustrates all of the highest occurring indicators and highest dimensions. The reason is to show the sustainability issues most common to the Asian region and that would most likely be important to China. However, this is not to say that these HSIs are immediately transferable, but it shows that on a surface level they would have significant bearing to Ningbo or any other Chinese city, which can then undergo further context-specific investigation to determine true relevance. Hence, aside from the top HSI under each theme, specific attention should be given to mixed use, land protection, heat island effect, and sustainable buildings. This also means that in terms of their DoS, Ningbo should not develop indicators with lower interlinkages than the maximum identified for each indicator.
However, in Ningbo, some certain indicators would not be able to get higher level of dimensions as a result of the nature of the indicator and the context to which the indicator is applied. Specifically, some point aspect indicator such as ‘reuse of land (E),’ ‘energy efficiency in infrastructural equipment (E),’ ‘rainwater harvesting (E),’ ‘basic disaster prevention performance (S),’ ‘bicycle rider amenities (S),’ are not able to have more dimensions as a result of the limitation of context due to context of the city or society it is developed for. However, these dimensions can be changed when analyzed in Ningbo.

4.3. Mandatory Indicators

The following content is the identification of indicators and the analysis of their feasibility for the context of Ningbo. Furthermore, from the analysis the trend in mandatory indicators can be obtained for the eight Asian tools. In the following content, there are only four tools that have mandatory indicators (based on the NSAT manual analysis).

4.3.1. The Analysis of Percentage and Dimensions of Indicators

Figure 6 indicates the percentage of mandatory indicators in each tool. In these tools, four of them have mandatory indicators, and four are without them. PCRS (UAE) takes the highest percentage at 31%.
Figure 7 demonstrates the appearing frequency of mandatory indicators when distributed in different dimensions and their combinations. Amongst them, E-I has the highest frequency with 13 times and E-S appears 11 times as well. EC, I, E-EC, EC-I, and E-EC-I have not appeared at all. This indicates that the mandatory indicators are led by some institutions and focus on some restriction on the environment before and during the development. With regards to E-S, this means that these indicators respond to environmental issues to improve the life quality for the citizens that then promotes the comfort level.
According to Figure 8, the mandatory indicators themed in ‘management’ occupies the highest occurrence at 11 times, which shows that management of the project is significant to ensure the accuracy of each step in the urban development.
Considering Ningbo, the application of management is that when a project is presented there will be specialists in the planning bureau, design institute; via meetings to complete the assessment, analysis, and consultation of the planning development site. For indoor and outdoor environment there will be appropriate provisions in some codes and standards established by the government agencies to restrict the condition with detailed data.

4.3.2. Impact of Mandatory Indicators

We take Hong Kong NSAT as an example, which is the closest to the conditions of mainland China. For BEAM applied in Hong Kong, there are two mandatory indicators. As observed from Table 4, for the first HSI ‘minimum neighborhood amenities,’ it is about stipulating minimum numbers of amenities and distance from facilities to major occupied building in assessment area [21]. According to BEAM, regulations of infrastructure such as restaurants, shops, and laundry facilities certainly improve efficiency and benefit the local residents. Furthermore, open space is significant to psychological and physical well-being of individuals [22]. Besides, it could unite the community and contributes to residents’ life quality and well-being. For example, residents could do exercise and enjoy scenery in outdoor spaces and improve both mental and physical health. This indicates a positive health impact for the society. From institutions in Hong Kong, the design and layout of facilities should be of good quality and environmental standard to meet demands of users [21]. For the second mandatory indicator, ‘minimum functional uses,’ it refers to how it demonstrates the provision of minimum different functional uses such as office, retail, and residential within an assessment area. Modes of transport that are sustainable and environmentally-friendly, such as walking and cycling, would be frequently used if different uses of amenities are closer to each other or if planned in a mixed-use urban layout. This also directly impacts micro-level economic benefits and community characteristics would be strengthened by applying diverse uses [21].
For the above two indicators, both of them might be mandatory in Ningbo. The former one is about basic facility while the latter one is concentrated on mixed-use of amenities. For Ningbo, unlike many western cities, the basic unit replacing community would be ‘Shequ,’ where all amenities mentioned above should be included in order to make sure that community living is convenient and of high quality. It is assumed to provide almost all civil services as well as administrative, such as property services, housing, health insurance, etc. [23]. Therefore, although basic unit is different, these two indicators would still be mandatory in Ningbo.
Hong Kong is one of the most urbanized and densest cities in the world, and 24% of the total land is of urban form. Due to compact development, Hong Kong needs to face several challenges. For instance, lack of open space and green space, noise pollution, quality of life. Thus, a plan specially designed for Hong Kong’s densely populated and high-rise development is needed. According to [21], provision of basic services in immediate vicinity of a building increases efficiency and quality of life. For example, shops and restaurants need to be within a minimum of 500 m walking distance from buildings. And maximum points would be given if at least two different recreational facilities and five basic services are placed in this proximity. They also have some economic benefits. Recreation and open space are required by Hong Kong Green Building Council (HKGBC). For example, places for ball games, swimming pools, and sports facilities. It is also required that the design and layouts should be of a quality and environmental standard to meet the users’ needs.
In terms of UAE, it could be found from Table 5 that materials, water, and energy are more valued. How to achieve sustainable outcomes that benefit both people and nature is a central challenge facing humanity [24]; as a result, it is necessary to concentrate on criteria about natural systems. It is essential to develop strategies for the water sector in an integrated manner [25]. UAE Plan 2030 marks that sustainability becomes the major consideration of UAE policy in city planning and development [26]. Precious water should be mentioned in mandatory criteria. Besides, some mandatory criteria about resourceful energy are considered due to the increasing pressure from energy price and environmental directive, which have forced machinery manufacturers to operate energy efficiency monitoring and management to improve economic benefits and environmental performance [27]. According to wide use of timber, chromated copper arsenate (CCA) treated timber elimination with the aim to minimize toxic effects of chromate copper arsenate treated timber on people and the environment is designed.
Energy has a great effect on the development of UAE generally. It is recorded that the improvement of energy efficiency of the building stock in UAE can provide cost-effective reductions in electricity consumption, peak power demand, and carbon emissions while creating a sizable number of employment opportunities [28]. It makes great sense to the sustainability in UAE. In addition, as it is shown that the most influential sustainable indicator was revealed as ‘potential for recycling and reuse,’ suitable sustainable indicators were selected for selecting the best sustainable construction materials [29]. Similarly, water recycling is also related to the recycling and reuse potential. As a result, the selection of materials and the dispose of water recycling are important indicators for further consideration.
With regard to India, four topics are focused on, as shown in Table 6. It is shown that the development of land considering ecological suitability makes sense to reduce the negative impacts of development on environment [30]. In consequence, the mandatory criteria concentrating on site selection and land use planning is a necessity. In addition, transportation brings common and critical problems in humanitarian response; hence, there is a need for better planning and prioritization of vehicles to transport humanitarian aid to affected communities [31]. As the interface between the socio-economic activities and natural resources environment, urban infrastructure is critical to sustainable resource management at urban scale [32]. Therefore, in terms of rainwater harvesting and segregation of waste, management of infrastructure resource is an indispensable topic in sustainability research.
Above all, the mandatory indicators are tending to the aspects of communities’ convenience, management of waste as well as utilization of resources for each place. The importance of indicators related to transport and land use planning investigated in India is quite significant.
In India, it is revealed that vehicular emissions and GDP growth rate are positively correlated by statistical analysis, due to the fact that better economic conditions favor increase in vehicle numbers. As a result, some Indian states like Maharashtra, Gujarat, Uttar Pradesh, and Andhra Pradesh contributed maximum emissions from vehicles in the estimated pollutants in India. These states constitute about 64% of the total geographical area of India [33]. A huge area of India with great vehicle emissions means that problems regarding transport have to be analyzed specifically. Meanwhile, India is subjected to severe anthropogenic interference, despite its status as reserve forest, it is shown by statistics that there has been a considerable decrease in forest cover from 1990 to 2015; as seen from 2017 data, huge urban expansions and development activities were observed. This increase is related to the growth in population; accordingly, it is indeed necessary to consume land available [34]. According to the development state of India, land use planning for India should be designed reasonably.
In BERDE, there are 14 mandatory indicators (see Table 7), and half of them are related to ‘management,’ which are mainly focused on preparation work before construction. This aims to formulate detailed schemes of earlier stages, such as establishing an appropriate project team, a technical site assessment, and basis of design. These are in regard to establishing a team and carrying out a meeting to ensure every aspect related to construction [35]. These should obey some regulations and white papers published by government agencies to ensure every aspect of the development is favoring and obeying the law [35]. Other mandatory indicators are related to some demands as well that to ensure safety during the urban development process. With regards to other mandatory indicators, they are related to the indoor and outdoor environments. For instance, ‘waste management’ aims to achieve better garbage classification then improve the environmental quality. Furthermore, ‘lighting levels’ and ‘thermal levels’ are criterion for thermal comfort, which means creating a comfortable relationship between ourselves and our environment [35]. With regard to the Philippines, 49% of the land is categorized as forest and 34% is for agricultural use. The occurrence rate of natural disaster has increased over time, which will lead to environmental degradation [36]. Therefore, it is significant when selecting the area for development and making an assessment to ensure the feasibility, safety, and protection of biodiversity, avoiding floods. Furthermore, the Philippines consists of several islands and is a coastal and marine country with specific hydrological characteristics [36]. So, keeping the quality of water resources should be determined as a mandatory aim, as well as reduction of water pollution.
For Ningbo, the above mandatory indicators are all suitable as well. In China, when implementing an urban development project, the first technological process is analyzing the site selection and its related environmental, social, and economic issues within a team, which is the same as the ‘management’ part in BERDE. Furthermore, such indicators as ‘reduce pollution,’ ‘lighting and thermal levels,’ ‘waste management,’ and ‘culture conservation’ are common issues that need to be considered in optimizing the urbanization of daily life. These can be applied in Ningbo as well as other cities in China. Therefore, the indicators above can be used in Ningbo urban planning as well as NSAT development for the neighborhood planning level. However, this study reveals that different tools have different context-specific requirements which ultimately determine the selection of indicators that an NSAT would require. It could be argued that all indicators investigated would be useful in China or Ningbo as the case may be. However, results from this section illustrate that mandatory indicators are closely linked to context-specific requirements of where the tool is being developed. This does not mean that more general indicators cannot be made mandatory. The next section illustrates examples of selected indicators that are important but may or may not be useful in another context. The city of Ningbo is used to buttress this point

4.4. Some Headline Sustainability Indicators (HSIs) and Their Application to Ningbo

In terms of whether the indicators in eight tools will be effective in Ningbo (or any city in China) or not, context-specific investigation of the all HSIs under eight Asian tools need to be conducted. However, for efficacy, the top occurring tools can be initially selected and validated, where additional indicators can be investigated based on the qualitative and quantitative evidence provided by planners and scientists and also the experience of those that live in Ningbo. The latter requires extensive use of survey methodology which is not the aim of this study. Hence, a few examples of indicators that would work and would not work are analyzed in the following. This enables us to take out specific HSIs that are relevant and compatible to the context of Ningbo and for its NSAT development.
BEAM (Hong Kong):
Indicators that would work:
1. Pedestrian-Oriented and Low Carbon Transport (E-S):
It aims to create a safe and appealing environment by encouraging pedestrian-oriented and low carbon transport [21]. It can be seen that Ningbo has adopted a series of environment-friendly strategies. For instance, application of Ofo, Mobike, and other bike sharing systems [37]. Such systems have existed in most major Chinese cities for several years now. Shared bikes change users’ habits and replace polluting modes of transportation and 55.4% of users prefer to use shared bikes instead of taking a taxi [37]. Furthermore, some of the traditional buses that burn fossil fuels have been replaced by trolley buses. In 2016, trolley buses were provided to Ningbo and Tangshan by Zhejiang CRRC Trolleybus Company [38]. This type of bus is powered by super capacitor and can be recharged in ten seconds. Their efficiency could be increased in regards to a transportation mode that reduces carbon dioxide and protects the environment. As a consequence, ‘pedestrian-oriented and low carbon transport’ is compatible to the context of Ningbo.
2. Renewable Energy (E-I):
It is used to encourage wider application of district renewable energy sources in neighborhood development. There are many types of renewable energy, such as hydropower, wind power, solar power, and bio-power [39]. Taking solar power as an example, the BYD Ningbo PV research and development (R&D) Center has been built and is to be used for research and testing on the production process of crystalline silicon solar cells [40]. This means Ningbo is gradually focusing more on development of renewable energy; and the starting point is solar power, which could help to reduce consumption of energy that is not recyclable. Furthermore, over 30 million households in China have biogas digesters that could convert wastes into clean-burning fuel [41], which means biogas is quite widespread in China. What is important is that this situation helps reduce use of fossil fuels and emission of carbon dioxide declines as a result. Ningbo is a big city located on the east coastline of China, and it is usually regarded as one of the main signs of China [42,43,44]. Thus, it is suitable to apply ‘renewable energy’ to Ningbo.
Indicators that would not work:
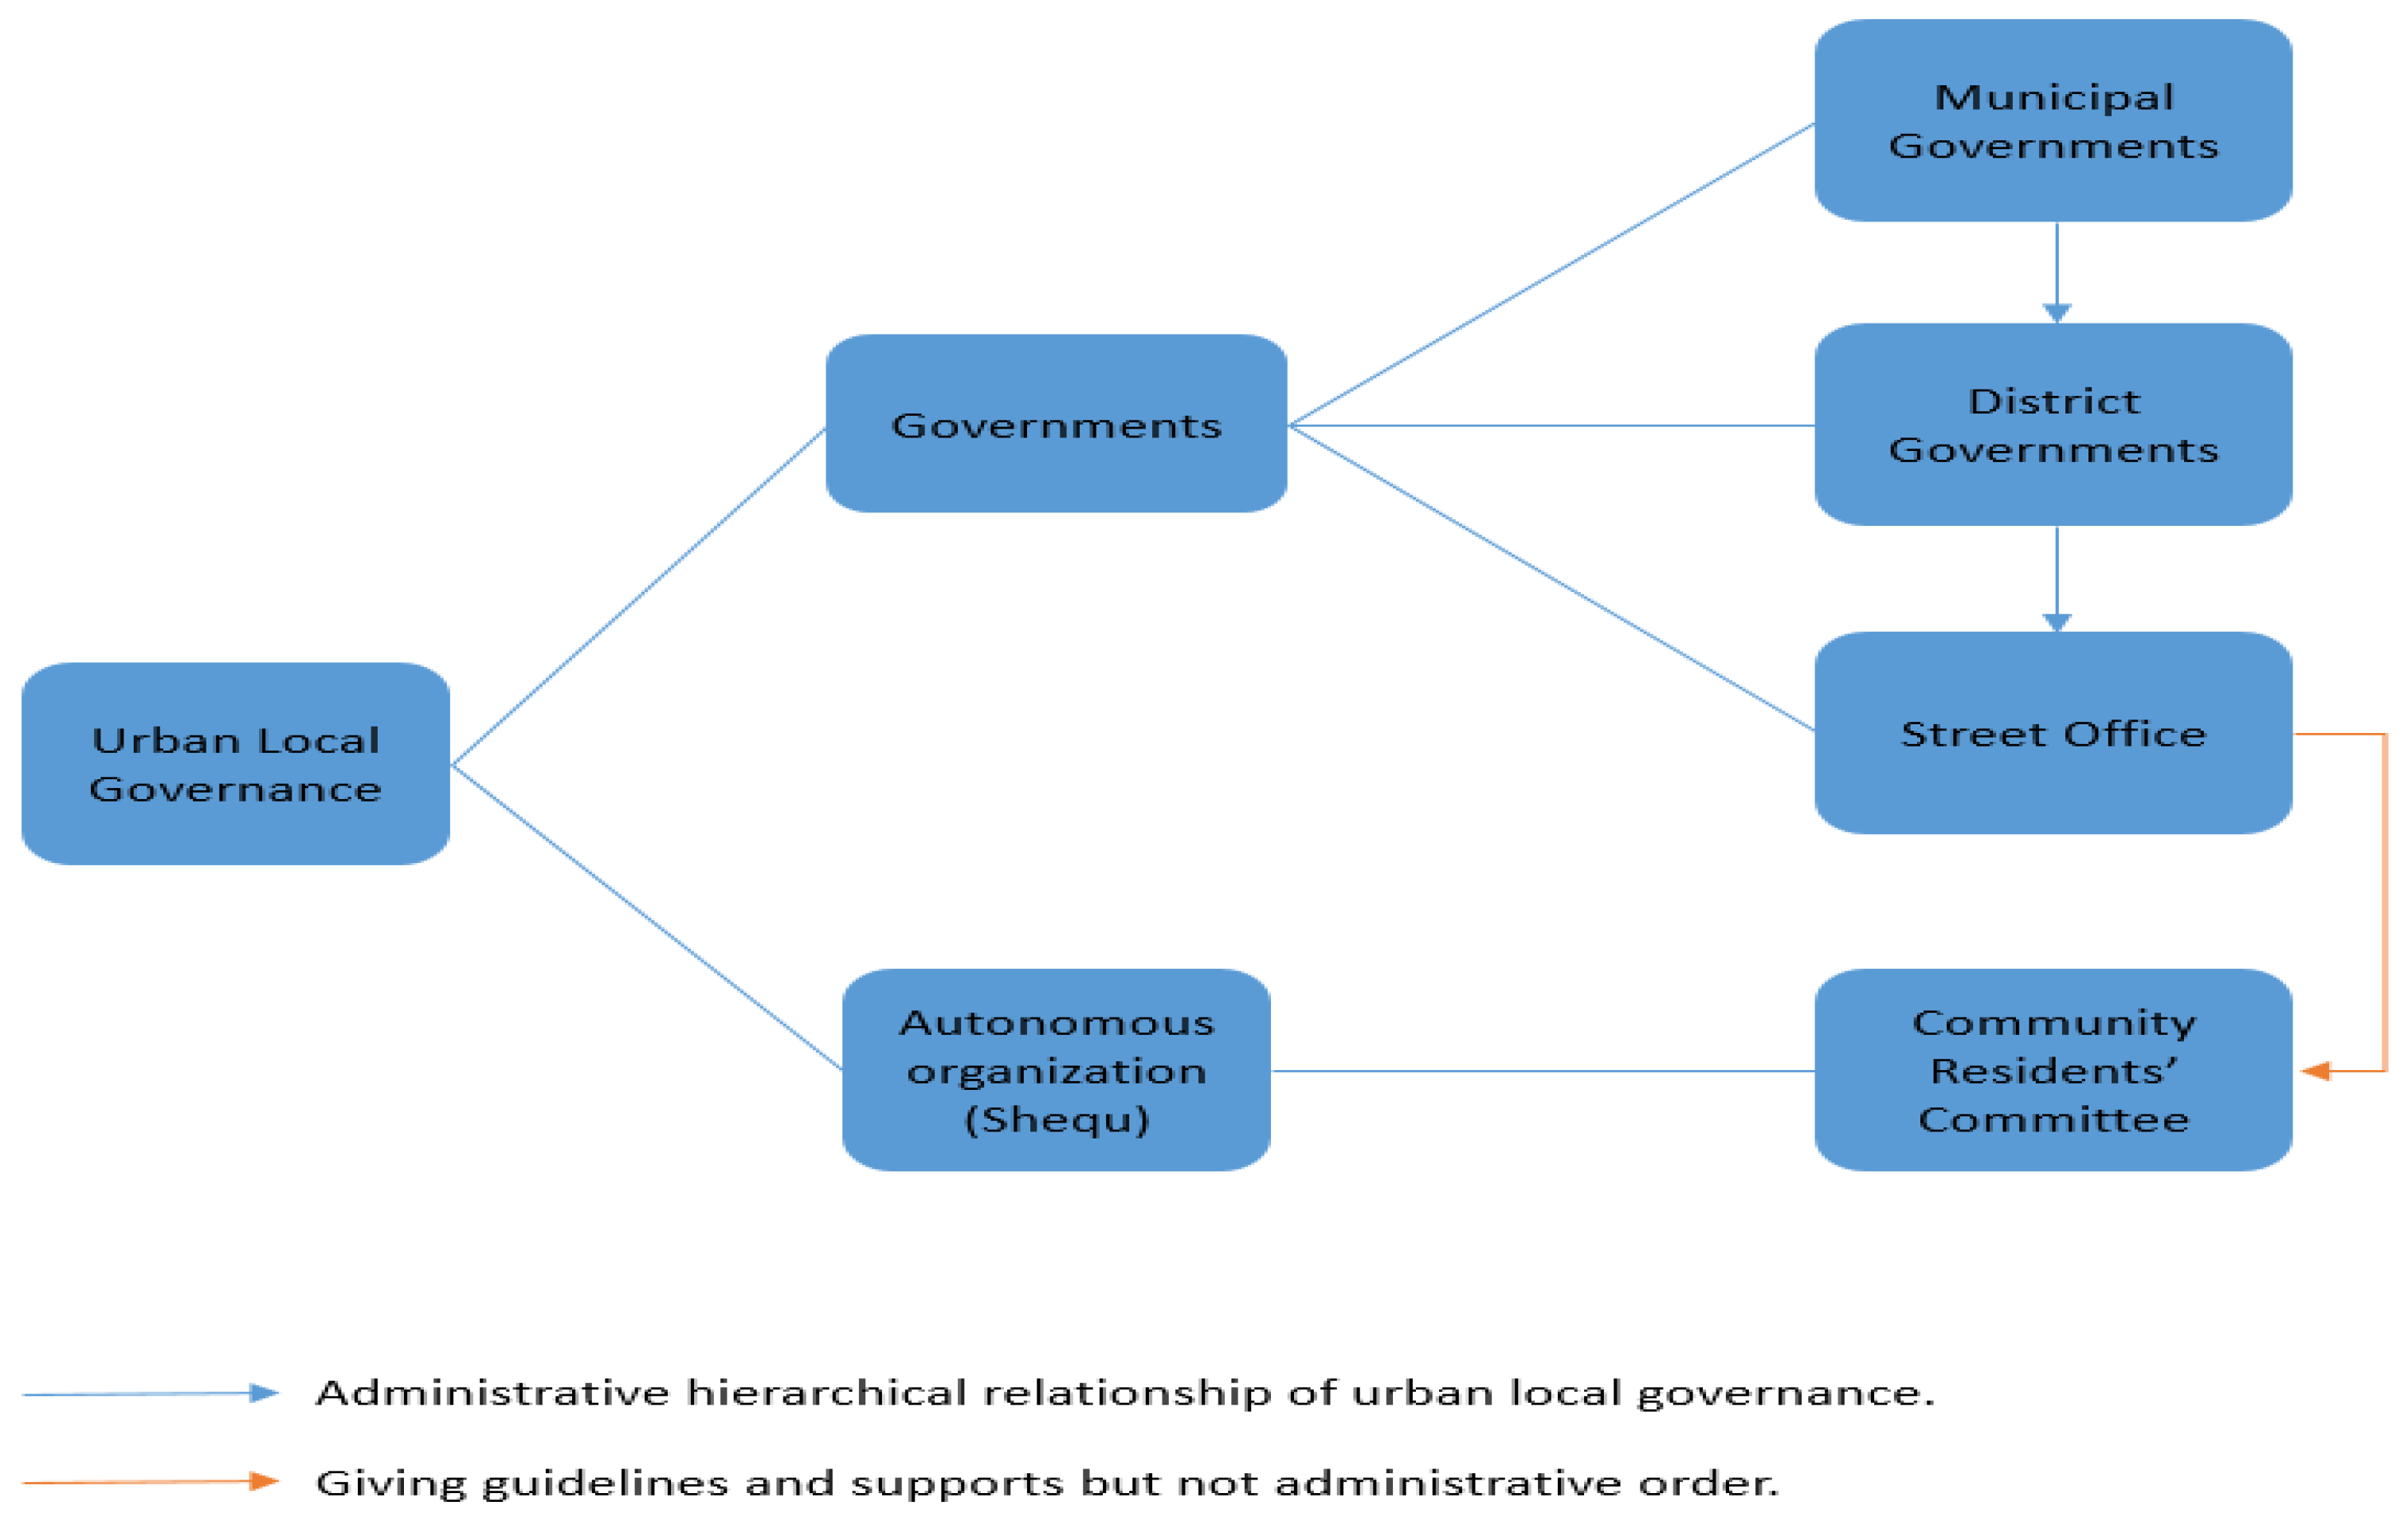
1. Community Engagement (S):
It is known that governance in China is different from many countries that already have NSATs [45], and there is a complex system when considering urban local governance. ‘Shequ’ and ‘street office’ (under control of governments) is connected to the municipal government. Usually ‘shequ’ would collect feedback from residents and pass to higher level of governance. Thus, residents are not able to be involved in neighborhood planning until the multi-layered governances becomes an essential subject in neighborhood planning (see Figure 9) [45].
2. Sustainable Lifestyle (E-S):
It encourages and recognizes good planning and design efforts to promote sustainable lifestyles [21]. However, the provision for waste reduction and recycling in China is relatively recent. Previously, people were not aware of garbage classification even though there was regulation for it [46]. However, this has changed over the past two years with more emphasis by the government. In other words, coordination among various departments used to be insufficient, which is now gradually changing. However, there is still another problem to achieving ‘sustainable lifestyle’: People do not know how to classify large amounts of hazardous waste [46]. In Ningbo the lifestyle is similar to traditional Chinese style, hence, there is still a long road before ‘sustainable lifestyle’ could be applied. This remains as a national challenge, particularly for those transitions from rural to urban lifestyles, which are generally more unsustainable.
IGBC (India):
Indicators that would work:
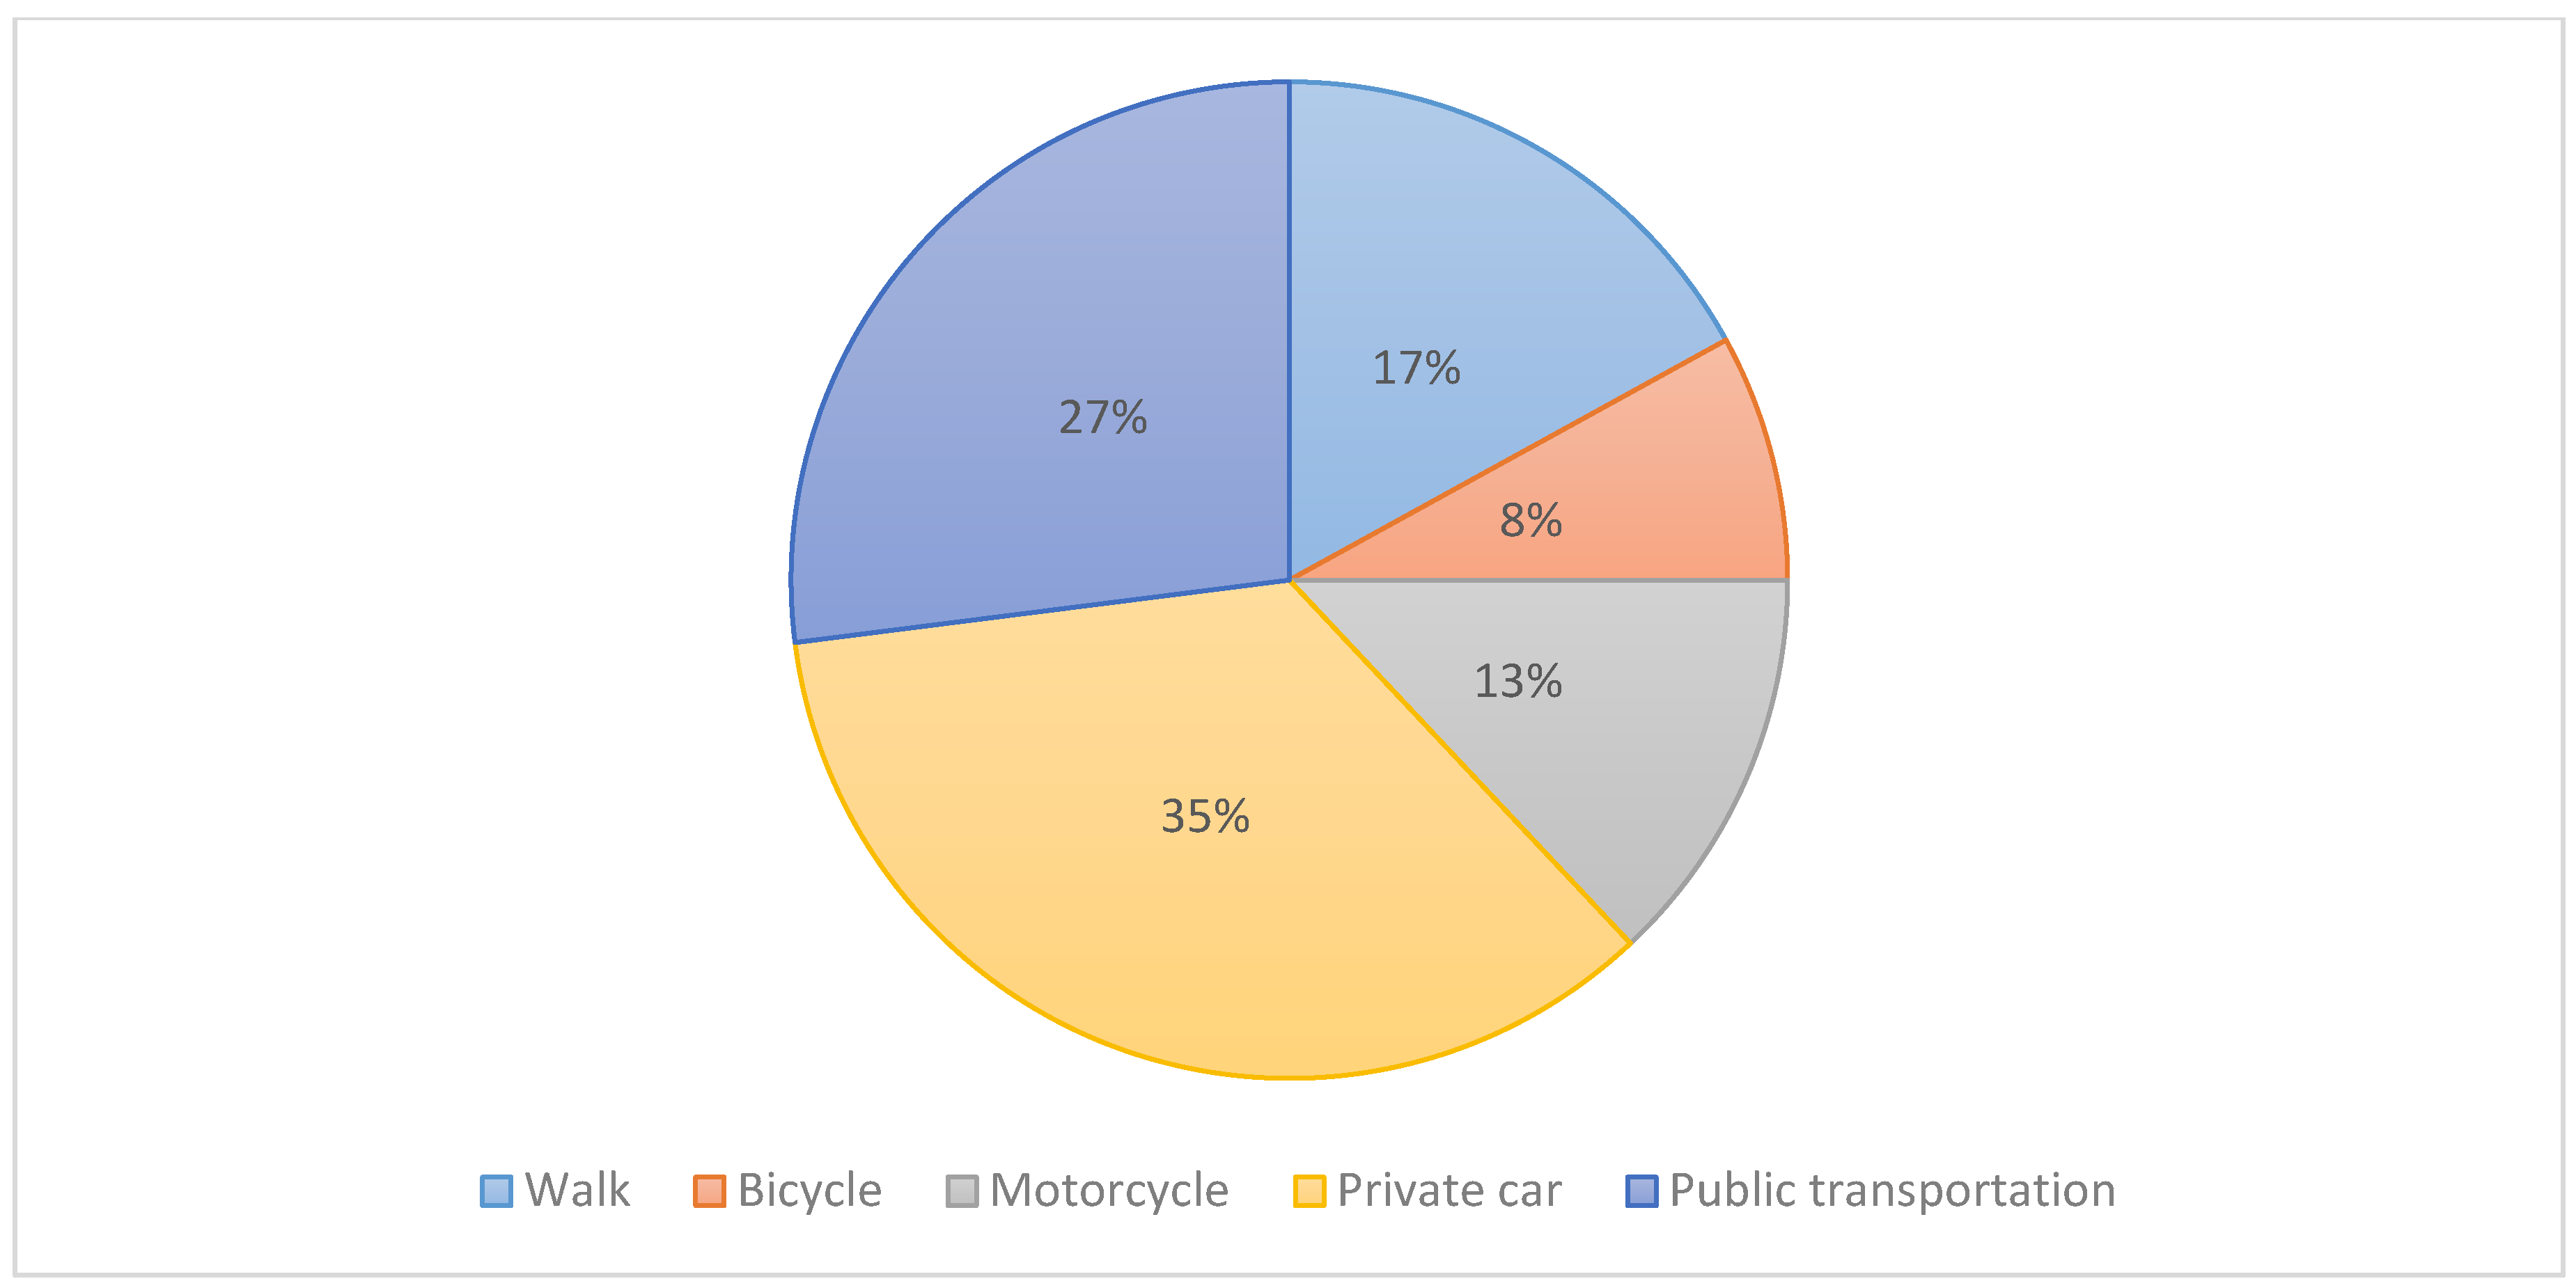
1. Public transportation facilities (E-S):
It can be found from Figure 10 below that private car is the main transportation mean for residents of Ningbo [47,48], while less than 10% of residents choose bicycle and around 15% choose to walk. This signifies a need to shift means of transportation from private use to more public use, creating the opportunities for other modes too.
As a result, it is important to design an indicator to decrease environmental problems caused by transportation by encouraging the use of public transportation to reduce fossil fuel consumption and vehicular emissions.
2. Rainwater harvesting (E):
It is necessary to ensure a way to deal with rainwater appropriately. A large number of Chinese cities have been seriously influenced by waterlogging in recent years, which is mainly caused by low-efficiency rainwater drainage [49]. The emergence of the sponge city program (SCP) was meant to reduce those flooding issues and help to better manage the water systems of the city. Also, food and water shortage is tipped to be the next issue facing urbanization in China; hence, indicators that can harvest water for various socio-environmental purposes such as flushing public toilets, irrigation, and watering green infrastructure would undoubtedly help minimize potable water use and improve water availability.
Indicators that would not work:
1. Employment Opportunities (EC-S):
It is supposed to provide opportunities of employment within the township to reduce long distance travel, however, it is recorded that through the steady migration of jobs to the suburbs over the past decade, many suburban residents commute farther than ever due to a series of social problems [50]. As a result, more employment opportunities may not reduce long distance travel efficiently. Therefore, it is not suggested to use ‘employment opportunities’ as the main indicator for Ningbo’s NSAT development.
PCRS (UAE):
Indicators that would work:
1. Sustainability awareness (E-S):
With the aim to promote the efficient operation of the community by enabling site residents, workers, and visitors to appreciate, understand, and therefore contribute to responsible resource use in communities. Increase of sustainability awareness could have a huge effect on sustainability of Ningbo.
Indicators that would not work:
1. Food systems (EC-S-I):
It is supposed to create a district approach to food with sustainable food production; however, in growing cities like Ningbo, there is a lack of knowledge about sustainable food production. It is evidenced that less people are willing to pay for sustainable food [51]. Hence, food systems cannot be transmitted to neighborhood planning level, and would preferably remain at the municipal or regional levels for the time being.
BCA (Singapore):
Indicators that would work:
1. Site selection (E-S):
Due to the geographical position of Ningbo (20 km inland from the Hangzhou estuary and the gateway), it is now facing an increasing risk of coastal flooding caused by increase in urban area and predicted sea-level rise [52]. Therefore, it is necessary to ensure no defenseless buildings are used in the flood plain area. ‘Site selection’ can be a relatively easy indicator to be adapted for the context of Ningbo and its NSAT.
2. Green and Blue Spaces for the public (E-S):
Based on the fact that the reduced distribution of open, and in particular green and blue, spaces is one of major threats experienced by cities [53]. It would be a great criterion to use in Ningbo to promote sustainability with the purpose of providing sufficient green and blue spaces for residents and occupants. The current planning already includes this in neighborhood planning of urban blocks, with minimized surface coverage of buildings and allocation of open spaces for green and blue uses. Hence, this can be a major indicator that fits with the local context and local planning practices.
Indicators that would not work:
1. Green lease (E-EC):
The road map for green leases and other environmental initiatives are still uncertain [54]. As a result, it is not a precise enough criterion to be applied in Ningbo.
GSAS (Qatar):
Indicators that would work:
1. Mixed Use (E-Ec-S):
In reality, ‘mixed use’ is an HSI that can be used in all planning design, which aims to maximize the number of major uses within the development in order to reduce the need for transport. With regard to Ningbo, as now a pilot first-tier city in China [55], nearly each urban district needs amenities and services to gather all daily requirements within 500 m from the residential area. It is a kind of convenience for people to promote the micro economy development in one specific area.
Indicators that would not work:
1. Desertification (E):
GSAS is for Qatar, and the climate of Qatar is tropical desert climate, which means that it is hot for most of the year. This kind of climate is likely to cause sandstorms [56] then desertification. Thus, it is no use in Ningbo due to its tropical monsoon climate [51], where the possibility of desertification in Ningbo is negligible. It is confirmed this indicator is not suitable for Ningbo.
GBI (Malaysia):
Indicators that could work:
1. Flood Management and Avoidance (S-E-EC):
Ningbo is located to the south of Yangtze River in China, which has a long rainy season leading to a large precipitation in summer [51]. Furthermore, Ningbo is a coastal city that is liable to be influenced by typhoon that causes thunderstorm and strong winds. Therefore, it may have floods in summer in Ningbo, which needs to be avoided. A strong flood management at neighborhood planning level would be very beneficial to Ningbo.
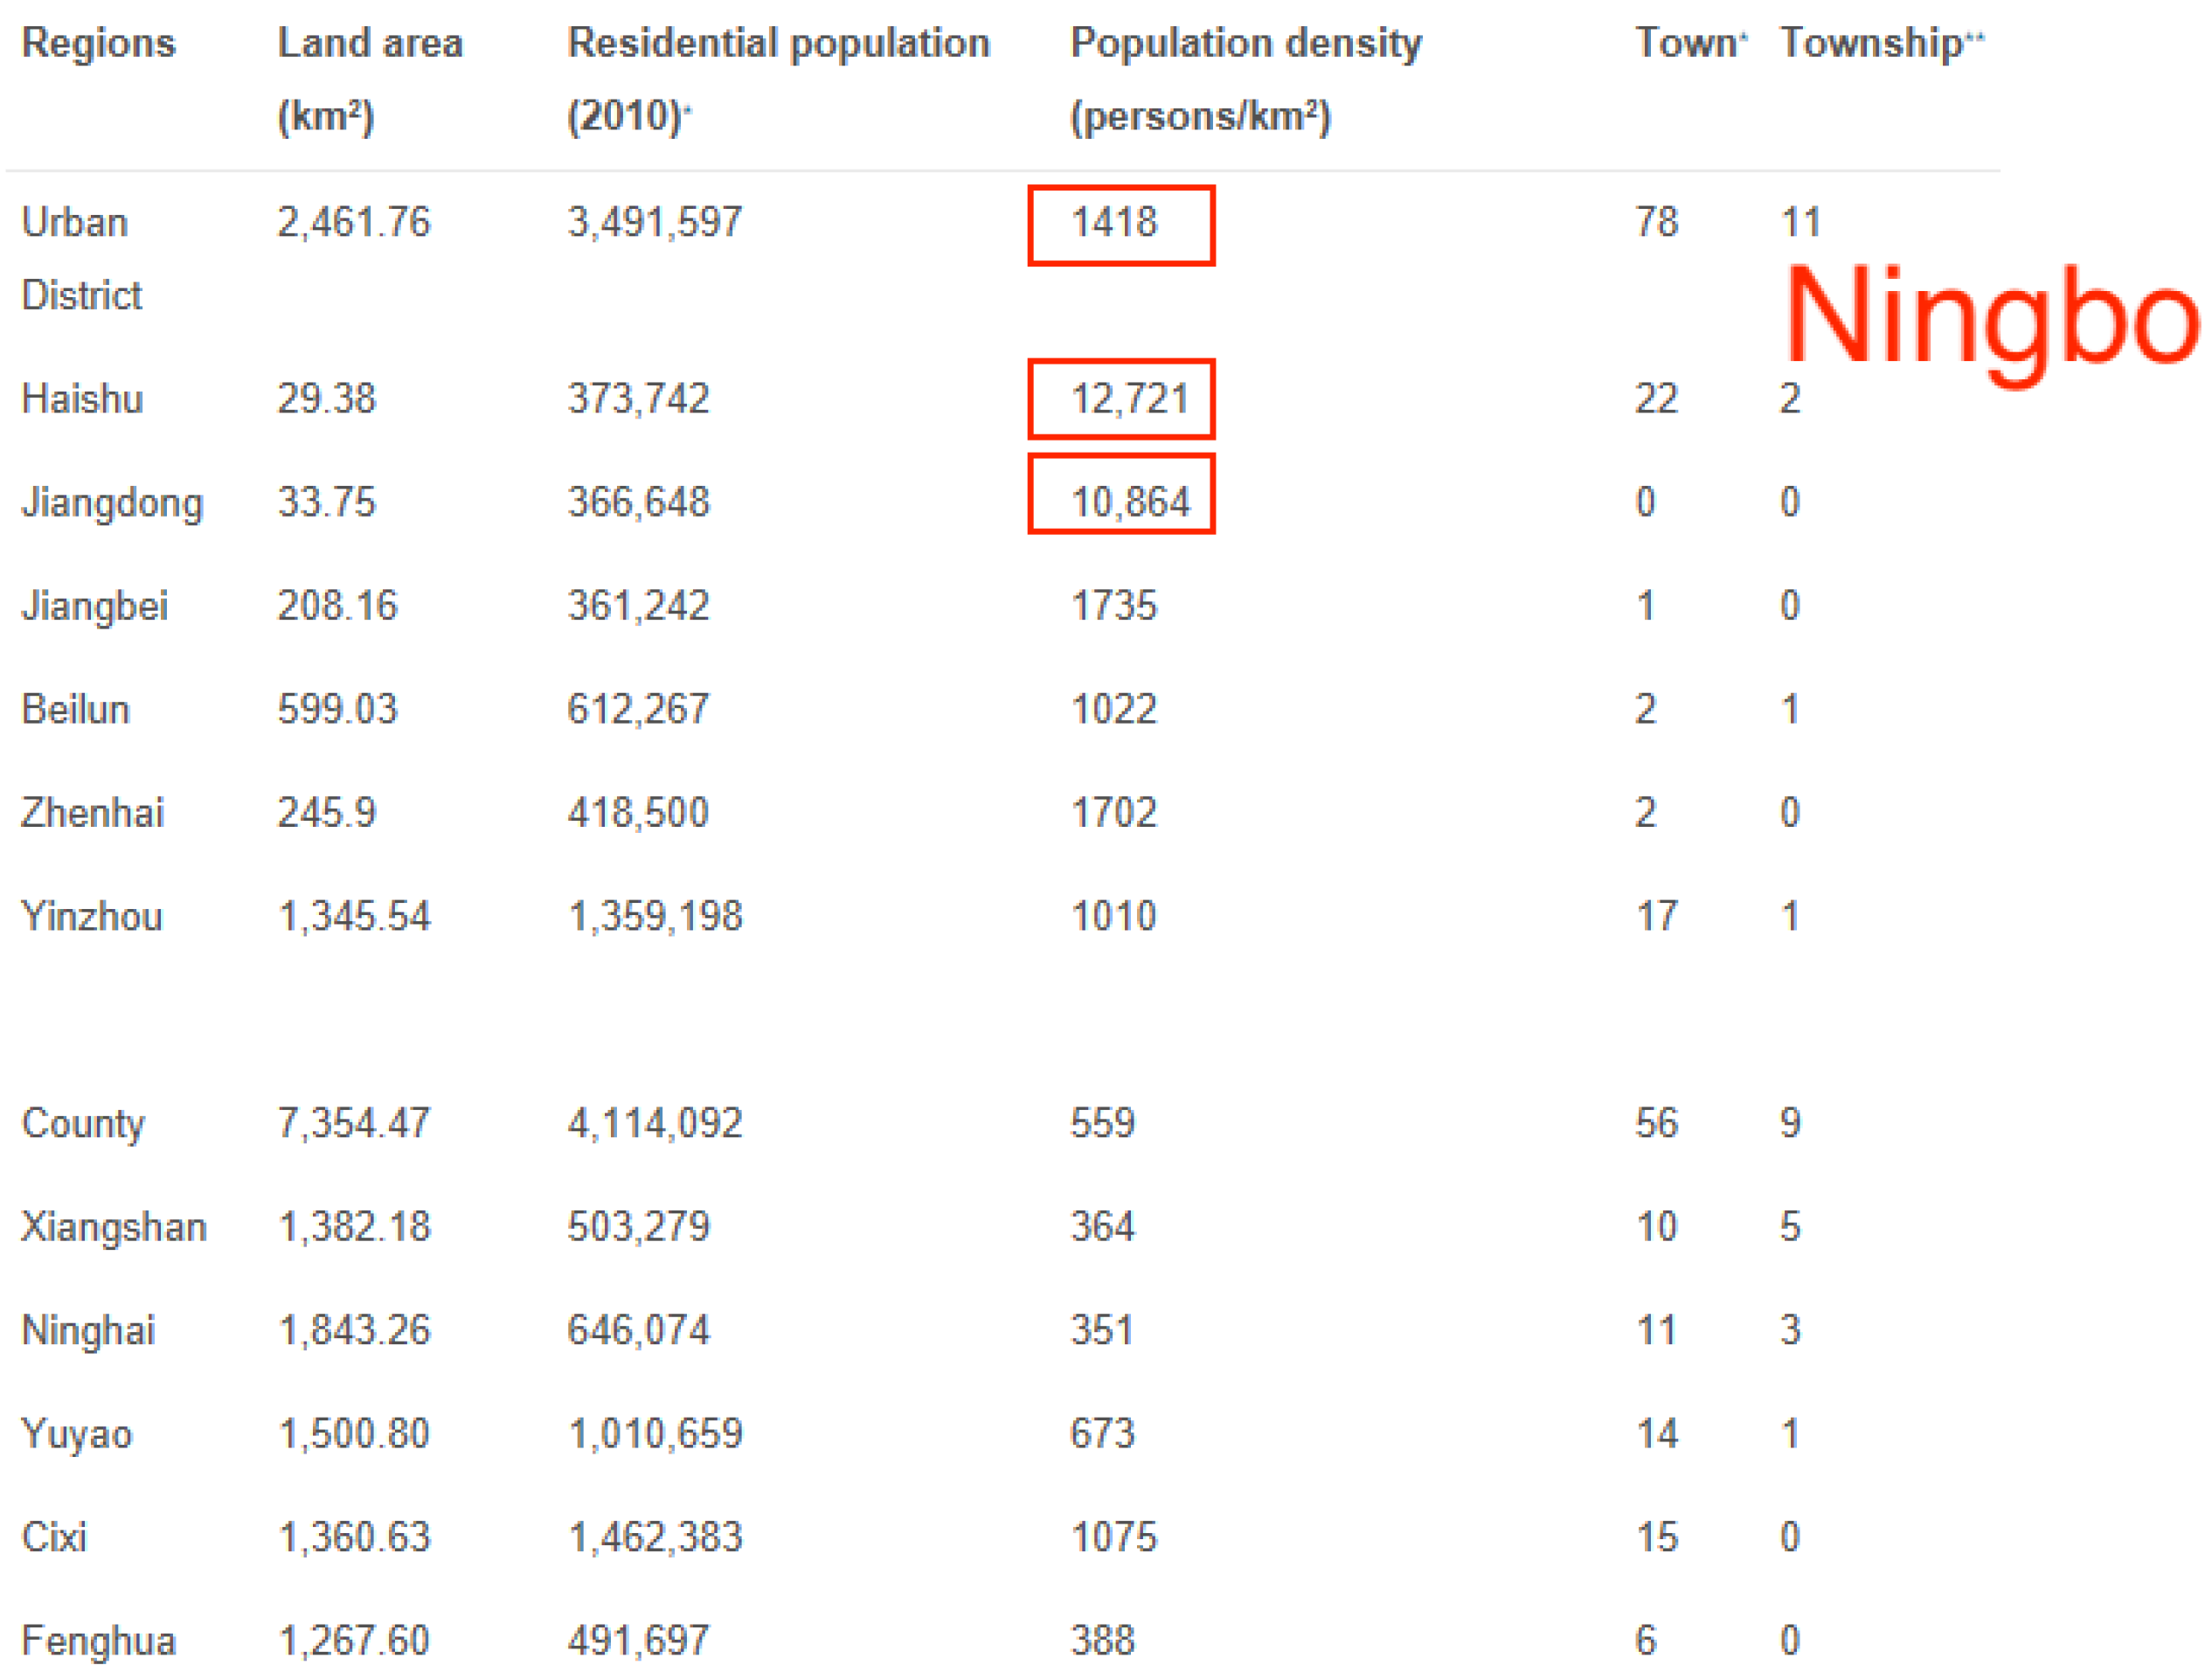
2. Compact Development (E-S-I):
According to Figure 11, all districts of Ningbo have an average density greater than 100, with 1416 p/km2 in urban area, and over 10,000 p/km2 population density in the two main districts. Therefore, due to the necessity of compact development in Malaysia, it may also be needed in Ningbo, as already indicated in its highly-developed urban areas as shown below.
Indicators that would not work: No specific indicators that would not work.
BERDE (Philippines):
Indicators that would work:
1. Bicycle Rider Amenities (S):
Ningbo as a pilot first-tier city in China [55] has popularized shared-bikes nearly everywhere in the city, starting with 500 stations in 2015. The appearing of bike sharing facilities and growing locations and stations across the cities directly increase the frequency of bicycle use by the general public [56], which is an alternative transportation to fossil fuel use. Therefore, the construction of more bicycle lanes with shade and direct access to storage facilities is necessary. At the neighborhood planning level, this can be encouraged even further and can be part of the overall design strategy of those urban blocks.
2. Energy Efficient Equipment (E-I):
The temperature in summer in Ningbo is above 30 degrees and at its highest is more than 40 degrees. Furthermore, the temperature in winter sometimes go below 0 degree [47] but without emitters and central heating radiators/systems. Therefore, there will be a high frequency usage of air-conditioning in Ningbo in these two seasons to achieve thermal comfort. To take this situation into consideration, installing energy-efficient air-conditioning appliances is in line with national guidelines and can be regarded as a better choice. As a result, energy efficient equipment can be regarded as a major indicator for Ningbo’s NSAT development.
Indicators that would not work: No specific indicators that would not work.
The aforementioned examples illustrate a desktop-based procedure based on available information about Ningbo that would be needed to vet the relevance of selected indicators. Other additional and more stringent procedures could also be introduced in the form of surveys of both the general public and experts within the area. This would provide a more locally relevant and integrated method that considers context and time in determining HSI that Ningbo needs to consider in developing their total list of indicators. This study has provided insight in the steps that Ningbo, or any city in China, could potentially take in the initial process of developing Asian based NSATs. The procedure here ensures that relevant HSI are not missed out and makes the HSI context-relevant while adhering to the standard DoS. 
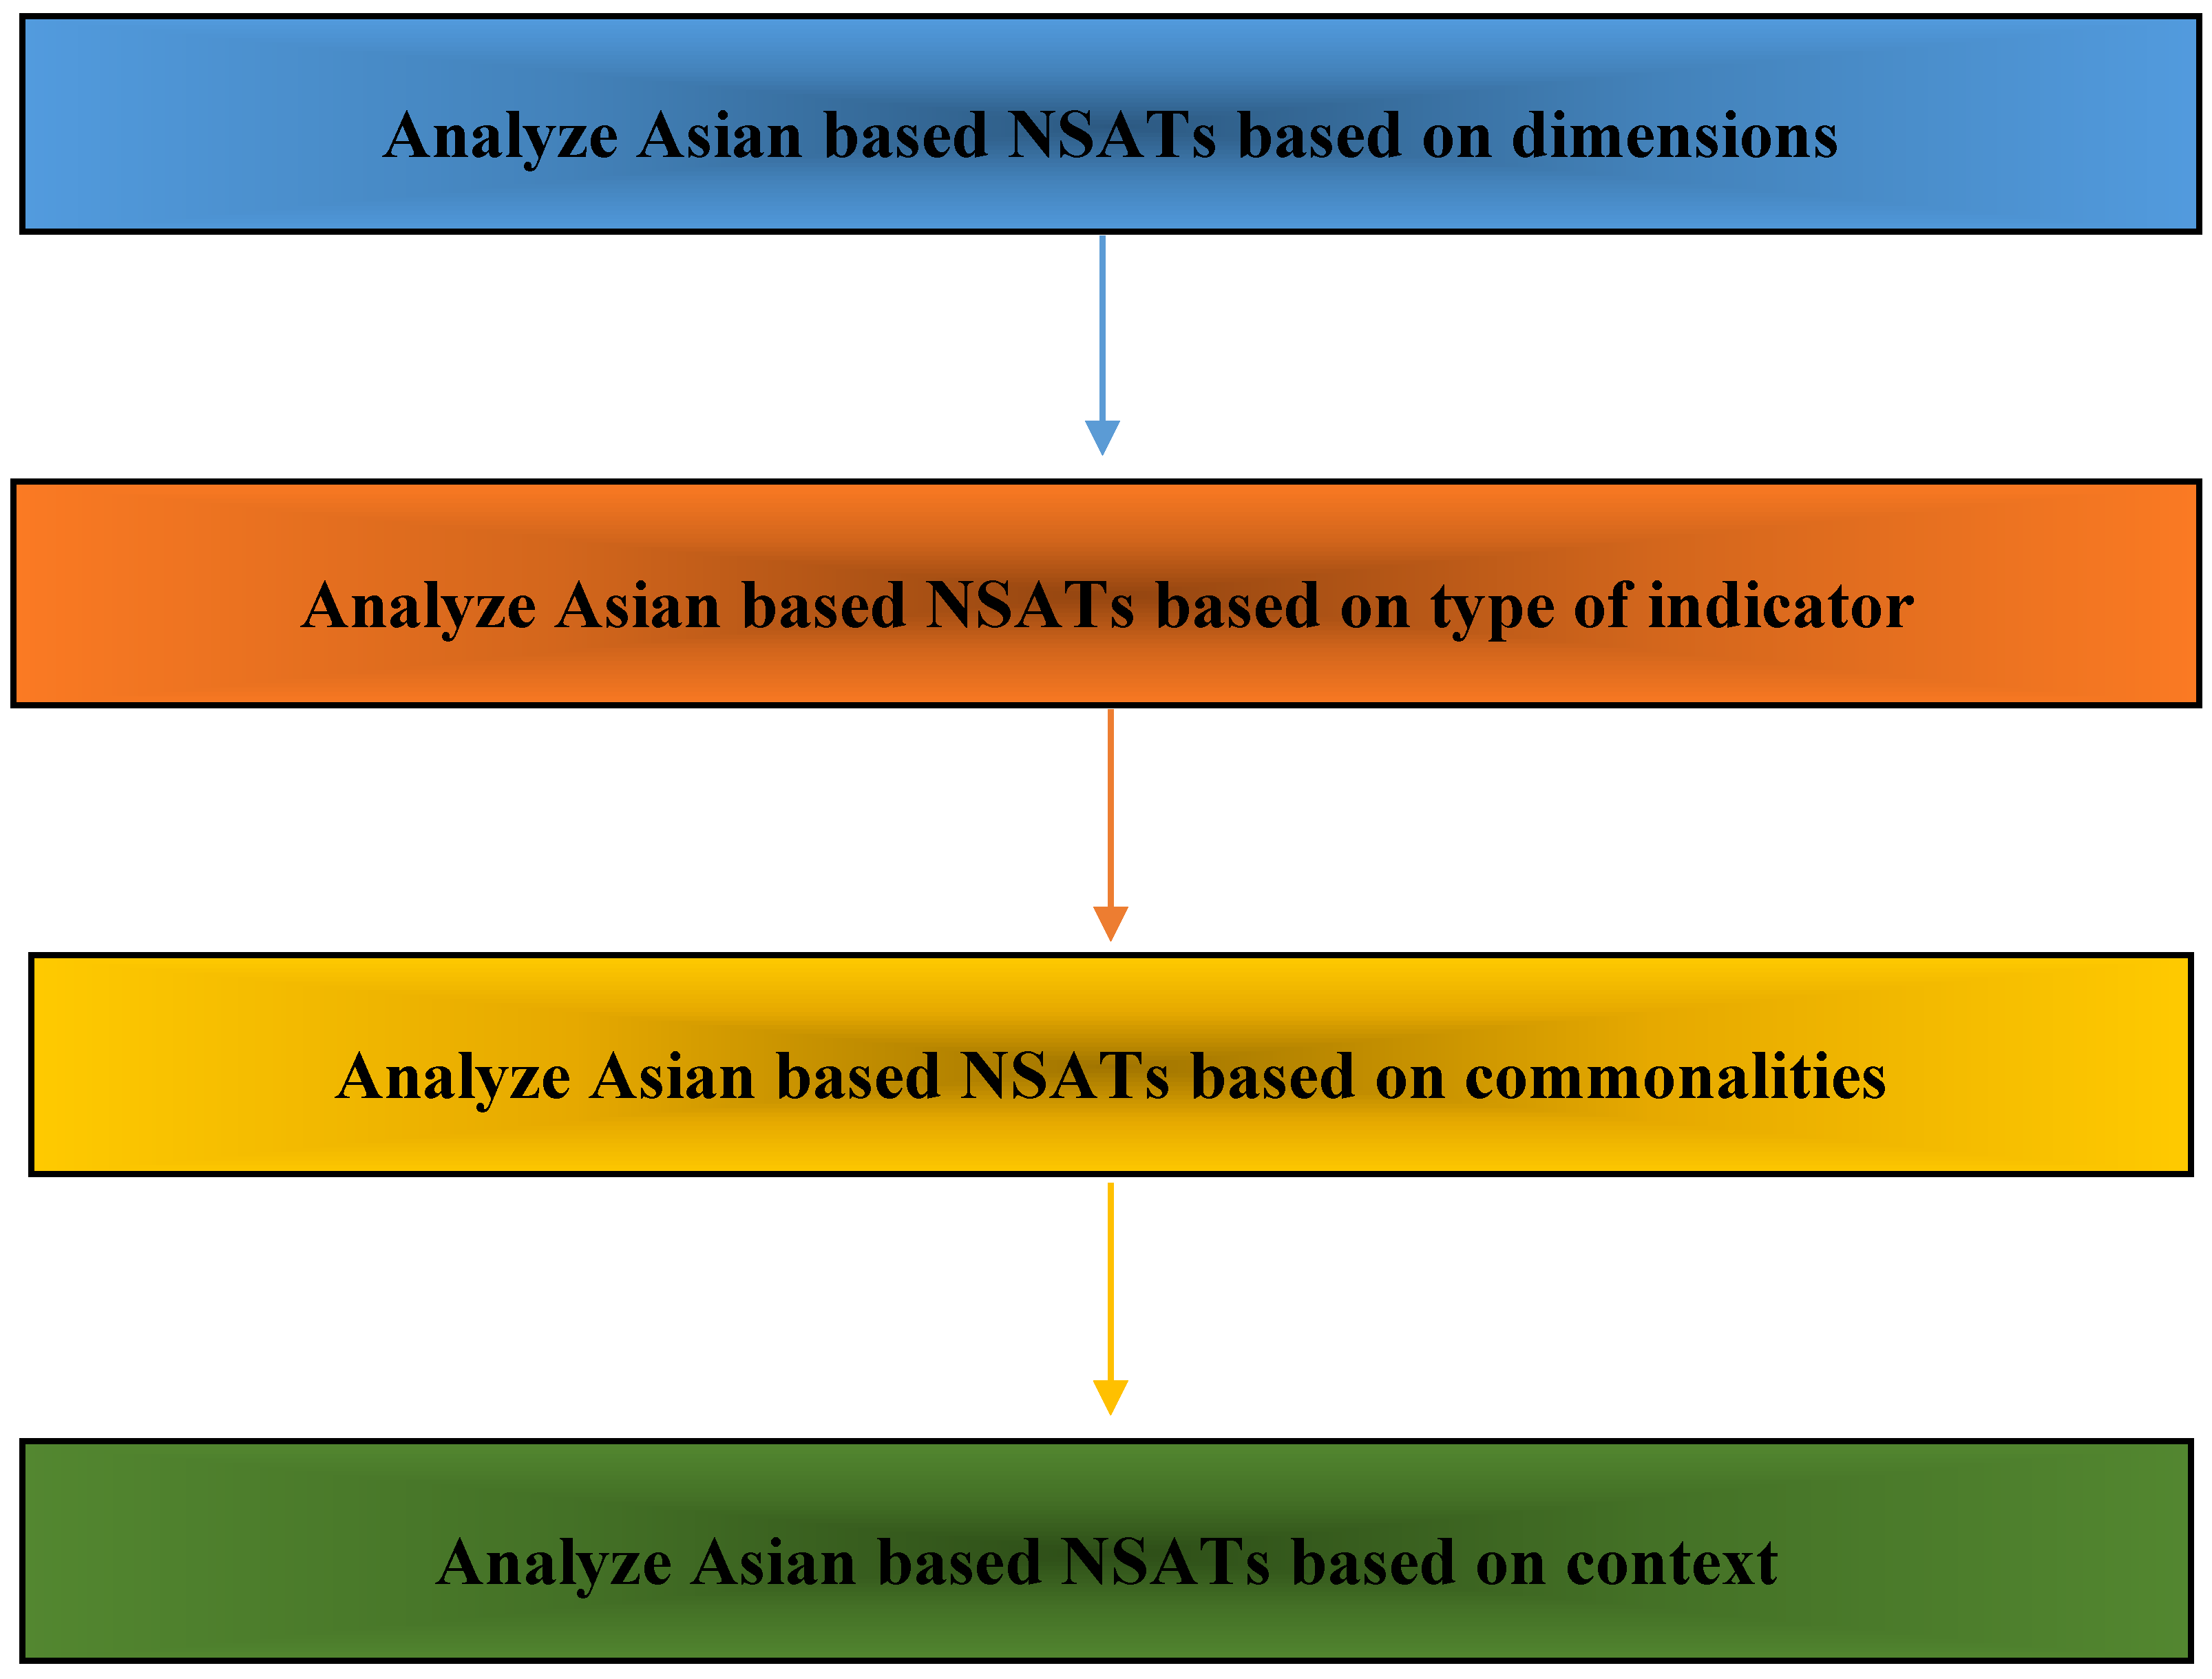
Figure 12 breaks down the steps required for cities like Ningbo in order to start the selection of their indicator from an Asiatic region perspective.
Analyze Asian based NSATs based on dimensions > The analysis should be based on the dimensions of sustainability (DoS), in order to understand the dimensional focus of existing tools and gaps. This will help in understanding and selecting what dimensions to focus on when developing an indicator. For example, results in this study show that a two-dimensional focus is the norm. Hence, selected HSI should ideally be developed with at least two dimensions in mind. The next step should then be trying to improve on the DoS of a relevant HSI. This means that in Ningbo, urban ‘heat island’ is identified as a popular HSI via the existing NSAT and is observed to possess only two dimensions. If deemed relevant, the challenge would be to raise the dimensional coverage to three DoS.
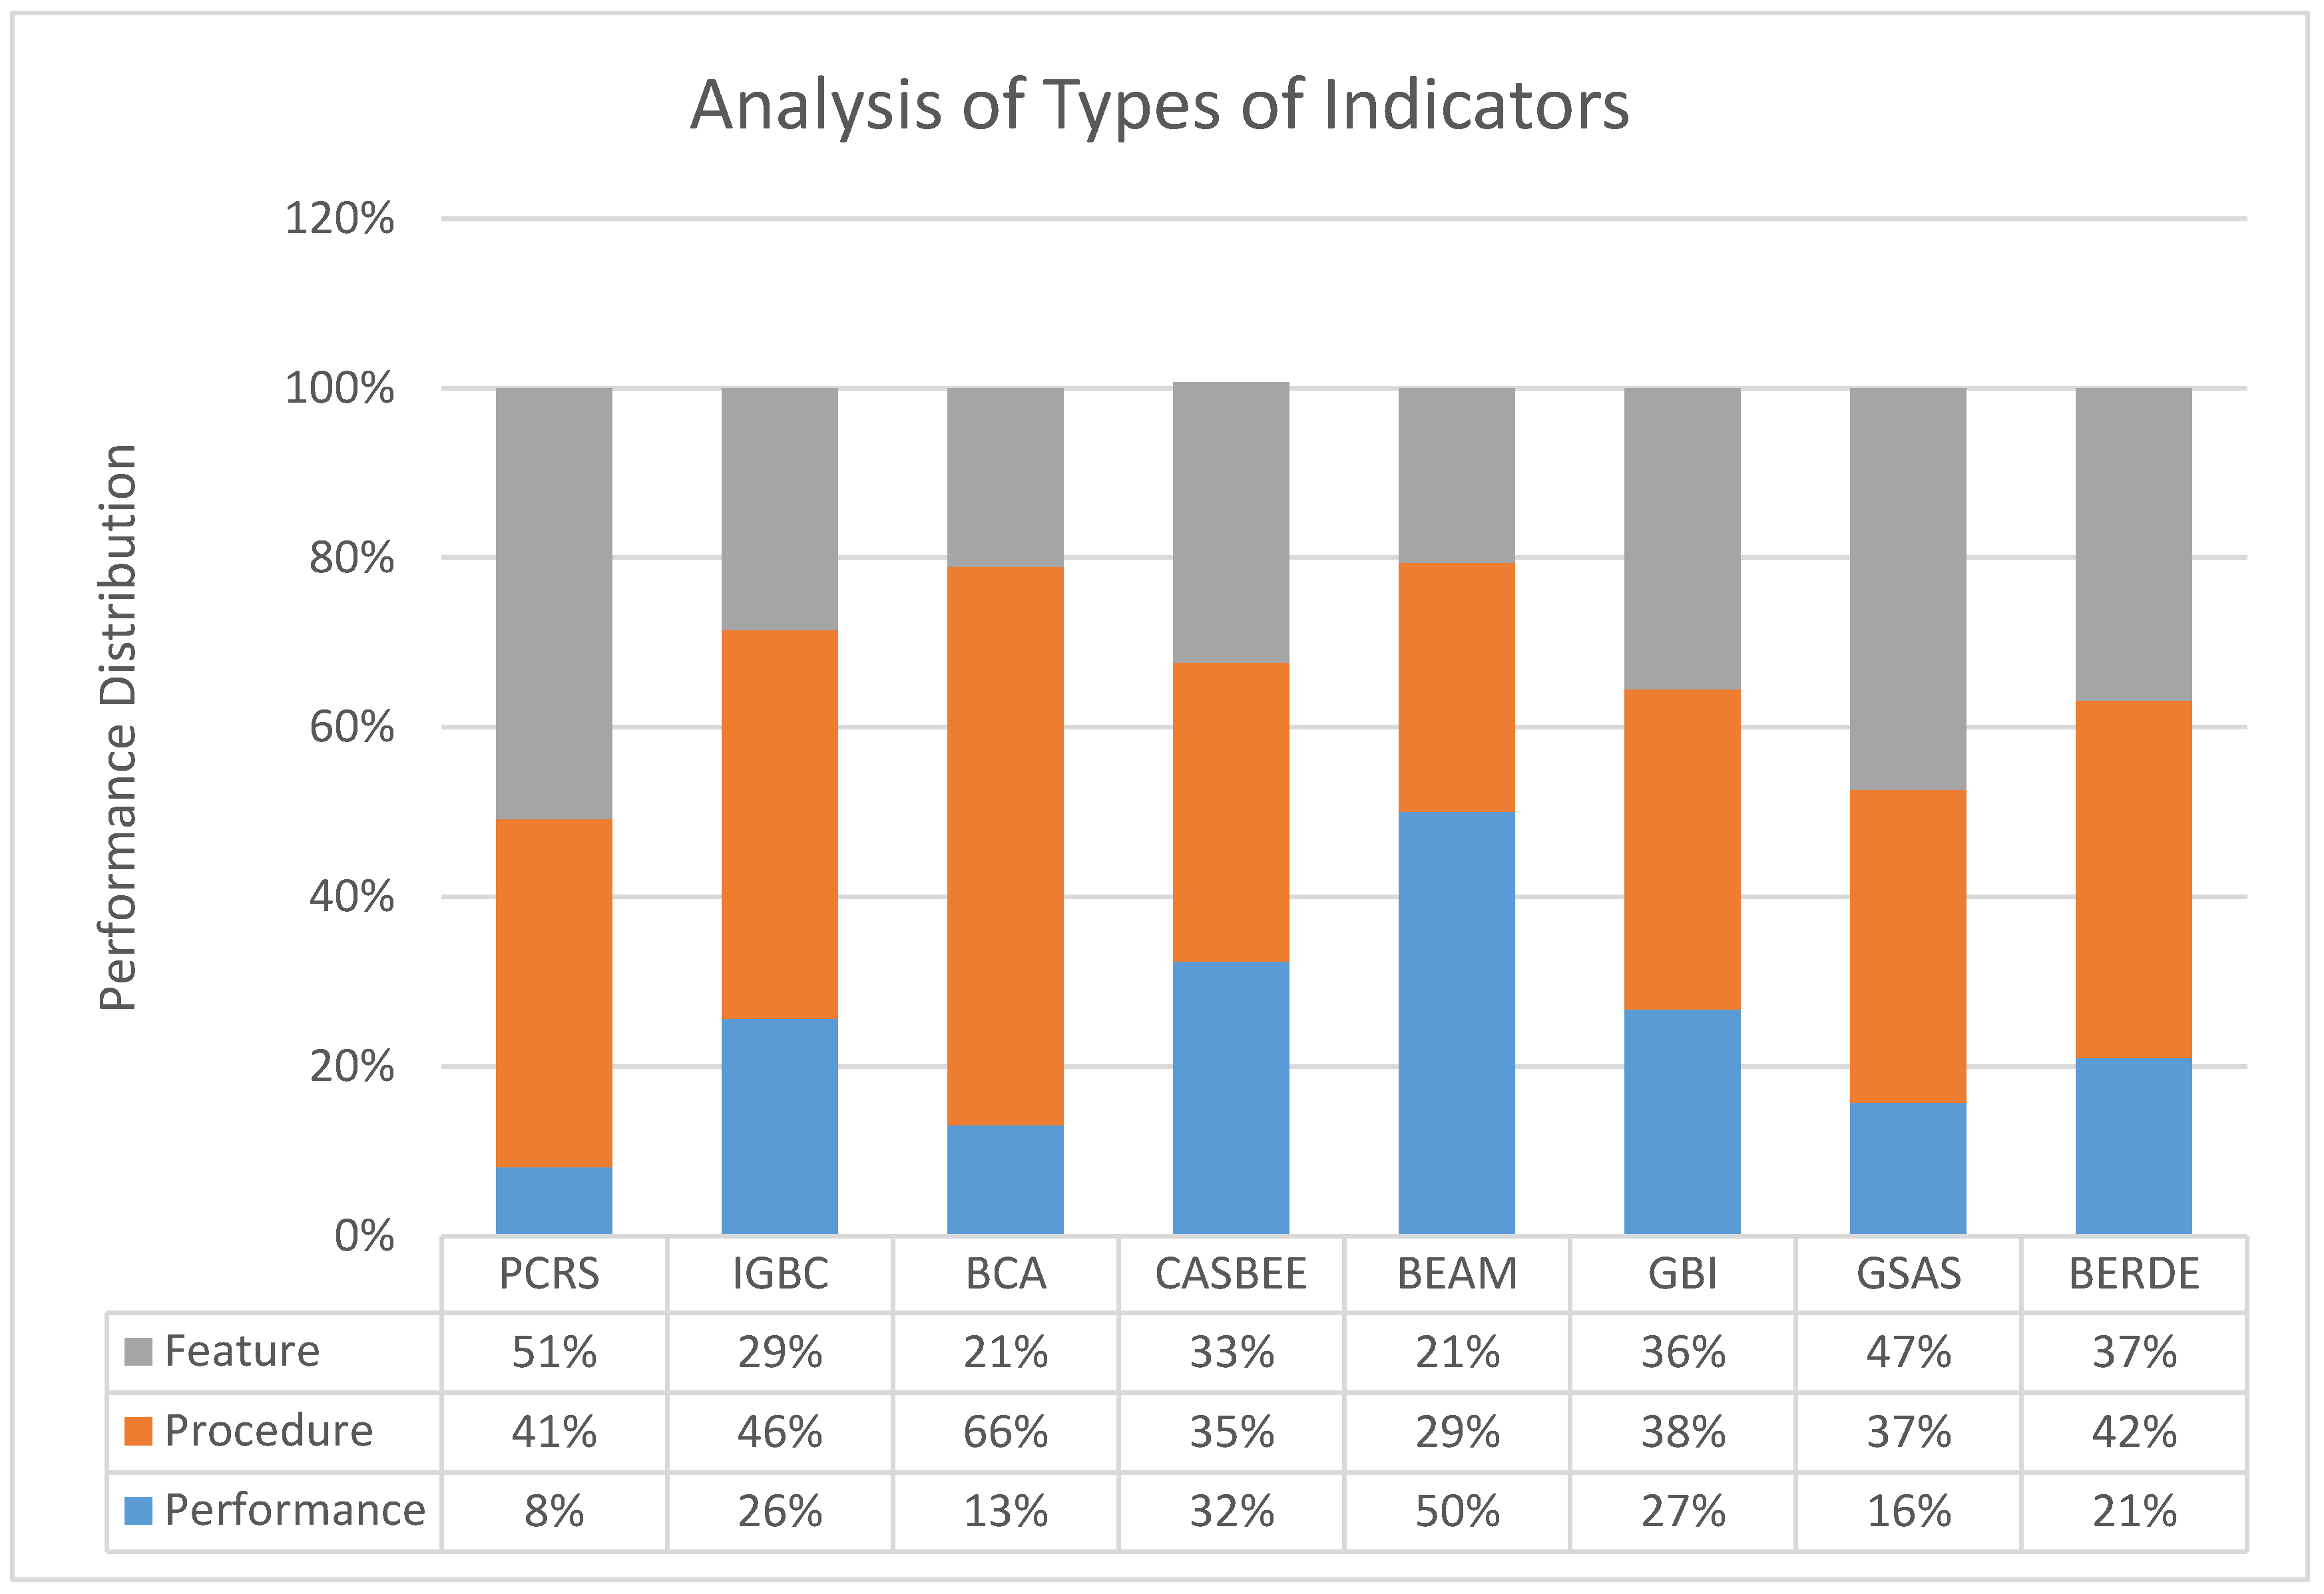
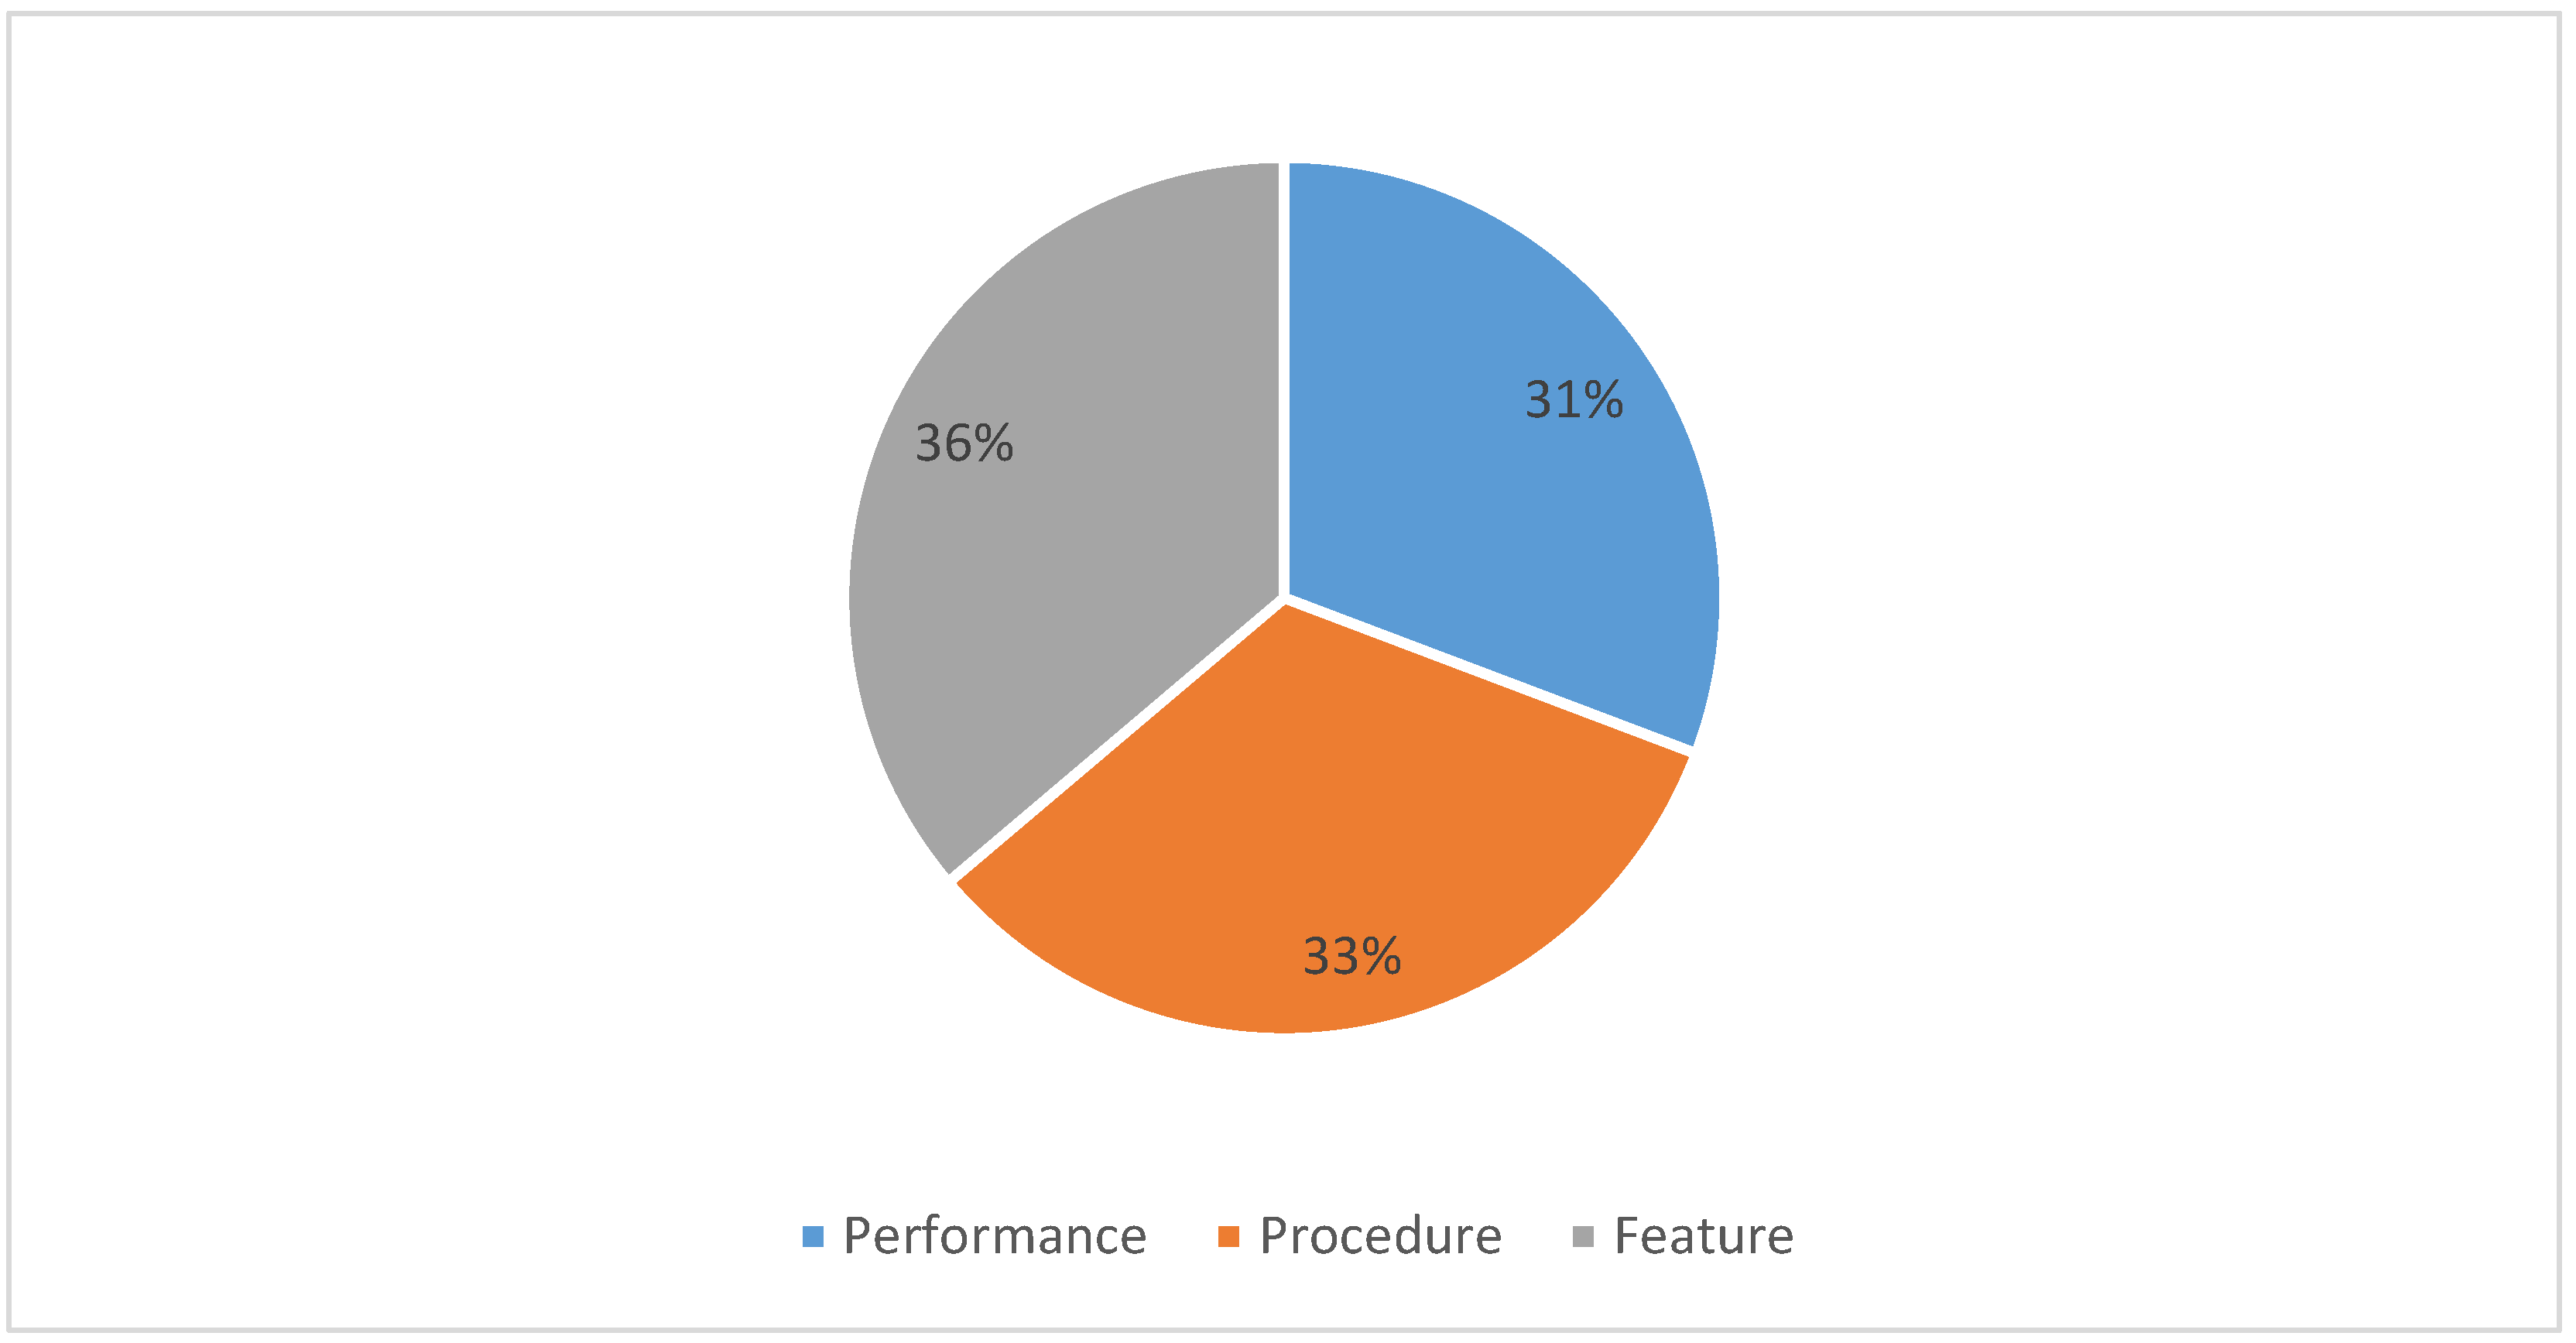
Analyze Asian based NSATs based on type of indicator > this analysis should focus on the type of indicators used. For starters, results show that indicators need to shift away from feature-based approach to performance-based indicators, in order to determine the real performance of the system. Results also argue that for management-based indicators, or indicators that deal with processes and procedures, then procedure-based indicators should be combined with performance-based indicators to guarantee a quantifiable and comparable result that leads to success.
Analyze Asian based NSATs based on commonalities > this analysis should focus on the selection of relevant indicators. The study shows that common indicators can be selected based on popularity. Meaning that, as more Asian tools deem a specific HSI important, it occurs in various tools. This narrows down the spectrum of indicators that needs to be investigated and allows the procedure in Section 4.4 to be executed. This procedure allows for indicators short listed to be vetted for relevance based on current geographical, statistical, demographic, economic, and climate information to name a few. Essentially, the context of the region comes into play by cross examining popular Asian HSIs.
Analyze Asian based NSATs based on context > focusing on the mandatory indicators. The results show that some tools utilize mandatory indicators, and some do not. It has been argued that mandatory indicators ensure that basic standards and issues of sustainability within a region are addressed. The conundrum is that those key sustainability issues would vary from region to region. Hence, even though certain mandatory indicators may be similar in numerous tools, Section 4.3 shows that making HSI mandatory is really down to the societal needs of a specific neighborhood or region at that point. These societal needs are issues that cannot be negotiated or made optional, hence their mandatory status.

5. Conclusions: A More Suitable Tool for Ningbo

In this study, SPM methods were used to analyze eight Asian NSATs. The results conducted from this analytical and comparative analysis emphasize that, in spite of large differences across this broad category, there are some common social, cultural, economic, and political conditions in these countries, which differentiate them from so-called developed countries [54]. Consequently, by analyzing the currently existing eight Asian tools, a strong argument is made for context.
In recent years, Ningbo has covered many of the common criterion or HSI addressed in the aforementioned sections, which indicates a gradual development of Ningbo’s sustainability agenda. This would essentially nullify the need for addressing certain sustainability issues. It is on this premise that the analysis of the eight Asian tools is important. By condensing the HSI into common indicators (see Table 3), it allows more efficient analysis of the indicators that would thrive in Ningbo or not, as Section 4.4 points out. This procedure can be replicated in any Chinese city with the likelihood of validating completely different indictors to that of Ningbo. The procedure summed up in Figure 12 illustrates that this process adds context to an already generic set of indicators. Also, by considering the dimensions of sustainability in selecting indicators, it becomes possible to enhance the performance of already tested indicators. For instance, if an HSI that is useful to Ningbo is elected but operates on two DoS, the goal would be to raise the dimensional coverage to three DoS. Indeed, this might be more difficult, however, it optimizes the coverage of the sustainability principles thereby enhancing the efficacy of sustainable development in the given location.
Furthermore, analyzing the existing tools allowed further understanding of what Chinese cities like Ningbo need, when considering the type of indicators. It was observed that a combined approach of procedural- and performance-based indictors would be beneficial especially in measuring the actual performance of a project and not just the installed performance. Additionally, the importance of context in the form of mandatory indicators showed that indicators, common or mandatory, need to still be vetted locally to ensure that they are indeed relevant in addressing the sustainability issues within a given location.
As mentioned throughout this study, this investigation is introductory and further research would be needed to develop a totally holistic approach. This would ideally involve an integrated approach where all HSIs would be vetted through surveys (one-on-one interviews or questionnaires), combining both the top-down approach with the bottom-up approach in order to determine, within a specific Chinese neighborhood or city, how relevant selected HSIs are going to be. This can then be combined with various desktop approaches to optimize the selection of both optional and mandatory HSIs. What this study has done is illustrate the process of how Chinese cities would go about developing their own NSATs. It takes the lessons learned from the previous tools (i.e., the eight Asian NSATs) and provides mitigation strategies based on examples given in the aforementioned discussion section.
Through an analytical study, this study has developed the pathway for development of NSAT in Ningbo, as well as laying a foundation for other Chinese cities. The study highlights multiple criteria selection for such NSAT development. It also addresses the relevance of Asian NSATs that are similar to the context of China. As a major national initiative now, there is scope for more future research on NSAT development and analysis in the context of China. Future research should expect to overcome some of these deficiencies in the current research by elaborating more on new NSAT development, their applications, and their optimization when needed. This paper serves to be the starting point or introductory research in illustrating the first steps required in the development of NSATs as well as associated future research in China.

Supplementary Materials

The following are available online at https://www.mdpi.com/2071-1050/12/6/2462/s1, Table S1: Example of how the NSATs were assigned dimensions (BERDE).

Author Contributions

Formal analysis, A.D., W.S., and Y.W.; investigation, A.C., A.D., W.S., and Y.S.; methodology, A.C.; project administration, A.C.; resources, A.C.; validation, Y.S.; writing—original draft, A.C., A.D., and Y.W.; writing—review and editing, A.C. All authors have read and agreed to the published version of the manuscript.

Funding

This research was funded by Ningbo Science and Technology Bureau, grant number 2017A10072 and National Natural Science Foundation of China (NSFC) grant number 71850410544.

Conflicts of Interest

The authors declare no conflict of interest.

Appendix A

Table A1. List of eight Asian Tools.
Asian NSA ToolFull TerminologyFirst VersionLast VersionCountryInstitutionNos of Indices (HSI)
BERDE (Clustered Development)Building for Ecologically Responsive Design Excellence20132013PhilippinesPhilippines Green Building Council, Department of Energy (DOE)58
BCA (Green Mark for District)Building and Construction Authority20092013SingaporeBuilding and Construction Authority38
GBI (Township)Green Building Index20112011Malaysia 45
Green Townships (IGBC)Indian Green Building Council20102015IndiaIndian Green Building Council36
QSAS/GSASQatar/Global Sustainability Assessment System20132013QatarGulf Organization for Research and Development38
PCRSPearl Community Rating System20102010United Arab EmiratesAbu Dhabi Urban Planning Council 64
BEAM Plus NeighborhoodBuilding Environmental Assessment Method 2016Hong KongHong Kong Green Building Council Limited37
CASBEE (Urban Development)Comprehensive Assessment System for Building Environmental Efficiency20062014JapanJapan Sustainable Building Consortium, Institute for Building Environment and Energy Conservation34

Appendix B

Table A2. Example of how HSI are collated under one combined HSI Title.
BERDE GSASGBIBEAMCASBEEIGBCPCRSSingapore (BCA)Combined NamesFrequency
BERDE Consultant (S-I) GBI Facilitator (S) Consultant2
Stakeholder Consultation (S-I) Community Engagement (S) Stakeholder Consultation2
Design Charrette (E-EC-S) Design Charrette1
Establish Basis of Design (E-S) Site Design Appraisal (S)/S-I Integrated Development Strategy (S) Integrated Development Strategy3
Sustainability Commitment (E-S) Sustainable Building Guidelines (S-I) Sustainability Commitment2
Construction Management System (E-EC-S)Construction Plan (E-S-I) Area management (S)/E-S Construction Environmental Management (E-I) Construction Plan4
Management Plan (E-S) Environmental Management System (E-I)Management Plan2

References

  1. Brundtland, G.H. Report of the World Commission on Environment and Development: Our Common Future; United Nations: New York, NY, USA, 1987. [Google Scholar]
  2. Karol, E.; Brunner, J. Tools for Measuring Progress towards Sustainable Neighborhood Environments. Sustainability 2009, 1, 612–627. [Google Scholar] [CrossRef] [Green Version]
  3. Fox, N.; Aiken, J.; Barnett, J.J.; Briottet, X.; Carvell, R.; Frohlich, C.; Lean, J.; Groom, S.B.; Hagolle, O.; Haigh, J.D.; et al. Traceable radiometry underpinning terrestrial- and helio-studies (TRUTHS). Adv. Space Res. 2003, 32, 2253–2261. [Google Scholar] [CrossRef]
  4. Sharifi, A.; Murayama, A. A critical review of seven selected neighborhood sustainability assessment tools. Environ. Impact Assess. Rev. 2013, 38, 73–87. [Google Scholar] [CrossRef]
  5. Dawodu, A.; Akinwolemiwa, B.; Cheshmehzangi, A. A conceptual re-visualization of the adoption and utilization of the Pillars of Sustainability in the development of Neighborhood Sustainability Assessment Tools. Sustain. Cities Soc. 2017, 28, 398–410. [Google Scholar] [CrossRef]
  6. Wangel, J.; Wallhagen, M.; Malmqvist, T.; Finnveden, G. Certification systems for sustainable neighborhoods: What do they really certify? Environ. Impact Assess. Rev. 2016, 56, 200–213. [Google Scholar] [CrossRef]
  7. Berardi, U. Sustainability assessment of urban communities through rating systems. Environ. Dev. Sustain. 2013, 15, 1573–1591. [Google Scholar] [CrossRef]
  8. Valentin, A.; Spangenberg, J.H. A guide to community sustainability indicators. Environ. Impact Asses. Rev. 2000, 20, 381–392. [Google Scholar] [CrossRef]
  9. Komeily, A.; Srinivasan, R.S. A need for balanced approach to neighborhood sustainability assessments: A critical review and analysis. Sustain. Cities Soc. 2015, 18, 32–43. [Google Scholar] [CrossRef]
  10. Murgante, B.; Borruso, G.; Lapucci, A. Sustainable development: Concepts and methods for its application in urban and environmental planning. In Geocomputation, Sustainability and Environmental Planning; Murgante, B., Borruso, G., Lapucci, A., Eds.; Springer: Berlin/Heidelberg, Germany, 2011; pp. 1–15. [Google Scholar]
  11. Cheshmehzangi, A.; Dawodu, A. Sustainable Urban Development in the Age of Climate Change—People: The Cure or Curse; Palgrave Macmillan: Singapore, 2018. [Google Scholar]
  12. Spangenberg, J.H.; Pfahl, S.; Deller, K. Towards indicators for institutional sustainability: Lessons from an analysis of Agenda 21. Ecol. Indic. 2002, 2, 61–77. [Google Scholar] [CrossRef]
  13. Liu, H.; Zhou, G.; Wennersten, R.; Frostell, B. Analysis of sustainable urban development approaches in China. Habitat Int. 2014, 41, 24–32. [Google Scholar] [CrossRef]
  14. Shi, Q.; Yu, T.; Zuo, J.; Lai, X. Reprint of: Challenges of developing sustainable neighborhoods in China. J. Clean. Prod. 2017, 163, S42–S53. [Google Scholar] [CrossRef]
  15. Chang, Y.T.; Zhang, N.; Danao, D.; Zhang, N. Environmental efficiency analysis of transportation system in China: A non-radial DEA approach. Energy Policy 2013, 58, 277–283. [Google Scholar] [CrossRef]
  16. Zhang, N.; Choi, Y. Environmental energy efficiency of China’s regional economies: A non-oriented slacks-based measure analysis. Soc. Sci. J. 2013, 50, 225–234. [Google Scholar] [CrossRef]
  17. Schneider, R.J. Theory of routine mode choice decisions: An operational framework to increase sustainable transportation. Transp. Policy 2013, 25, 128–137. [Google Scholar] [CrossRef]
  18. Timothy, O.O.; Chan, D.W.M. A scientometric review of global research on sustainability and sustainable development. J. Clean. Prod. 2018, 183, 231–250. [Google Scholar]
  19. Ochoa, J.J.; Tan, Y.; Qian, Q.K.; Shen, L.; Moreno, E.L. Learning from best practices in sustainable urbanization. Habitat Int. 2018, 78, 83–95. [Google Scholar] [CrossRef]
  20. Raghubanshi, A.S. Urban sustainability indicators: Challenges and opportunities. Ecol. Indic. 2018, 93, 282–291. [Google Scholar] [CrossRef]
  21. HKGBC (Hong Kong Green Building Council). BEAM Plus Neighborhood Version 1.0; HKGBC: Kowloon Tong, Hong Kong, China, 2016. [Google Scholar]
  22. Planning Department. Chapter 4: Recreation, Open Space and Greening, Hong Kong Planning Standards and Guidelines. 2010. Available online: https://www.pland.gov.hk/pland_en/tech_doc/hkpsg/sum/pdf/sum_ch4_en.pdf (accessed on 21 August 2018).
  23. Zhang, Q.; Yung, E.H.K.; Chan, E.H.W. Towards sustainable neighborhoods: Challenges and opportunities for neighborhood planning in transitional urban China. Sustainability 2018, 10, 406. [Google Scholar] [CrossRef] [Green Version]
  24. Wang, S.; Fu, B.; Zhao, W.; Liu, Y.; Wei, F. Structure, function, and dynamic mechanisms of coupled human–natural systems. Curr. Opin. Environ. Sustain. 2018, 33, 87–97. [Google Scholar] [CrossRef]
  25. El-Gafy, I.K.E.D. The water poverty index as an assistant tool for drawing strategies of the Egyptian water sector. Ain Shams Eng. J. 2018, 9, 173–186. [Google Scholar] [CrossRef] [Green Version]
  26. Naima. 2013. Available online: https://www.sciencedirect.com/science/article/pii/S1877042813043139 (accessed on 22 August 2018).
  27. Chen, X.; Li, C.; Tang, Y.; Xiao, Q. An Internet of Things based energy efficiency monitoring and management system for machining workshop. J. Clean. Prod. 2018, 199, 957–968. [Google Scholar] [CrossRef]
  28. Krarti, M.; Dubey, K. Review analysis of economic and environmental benefits of improving energy efficiency for UAE building stock. Renew. Sustain. Energy Rev. 2018, 82, 14–24. [Google Scholar] [CrossRef]
  29. Govindan, K.; Shankar, K.M.; Kannan, D. Sustainable material selection for construction industry—A hybrid multi criteria decision making approach. Renew. Sustain. Energy Rev. 2016, 55, 1274–1288. [Google Scholar] [CrossRef]
  30. Mehri, A.; Salmanmahiny, A.; Tabrizi, A.R.M.; Mirkarimi, S.H.; Sadoddin, A. Investigation of likely effects of land use planning on reduction of soil erosion rate in river basins: Case study of the Gharesoo River Basin. Catena 2018, 167, 116–129. [Google Scholar] [CrossRef]
  31. Gralla, E.; Goentzel, J. Humanitarian transportation planning: Evaluation of practice-based heuristics and recommendations for improvement. Eur. J. Oper. Res. 2018, 269, 436–450. [Google Scholar] [CrossRef]
  32. Dong, L.; Wang, Y.; Scipioni, A.; Park, H.S.; Ren, J. Recent progress on innovative urban infrastructures system towards sustainable resource management. Resour. Conserv. Recycl. 2018, 128, 355–359. [Google Scholar] [CrossRef]
  33. Singh, R.; Sharma, C.; Agrawal, M. Emission inventory of trace gases from road transport in India. Transp. Res. Part D Transp. Environ. 2017, 52, 64–72. [Google Scholar] [CrossRef]
  34. Salghuna, N.N.; Prasad, P.R.C.; Kumari, J.A. Assessing the impact of land use and land cover changes on the remnant patches of Kondapalli reserve forest of the Eastern Ghats, Andhra Pradesh, India. Egypt. J. Remote Sens. Space Sci. 2018, 21, 419–429. [Google Scholar] [CrossRef]
  35. Philippine Green Building Council. BERDE for New Construction Version 1.1.0; Philippine Green Building Council: Metro Manila, Philippines, 2013. [Google Scholar]
  36. Tarradell, M. Philippines Case Study: Analysis of National Strategies for Sustainable Development. 2004. Available online: https://pdfs.semanticscholar.org/63bf/d9b505f7e58edca957ab5a4100ef39438934.pdf (accessed on 22 August 2018).
  37. Graziani, T. Shared Bikes in China: A Look at the Market after 1 Year. 2017. Available online: https://walkthechat.com/shared-bikes-china-look-market-1-year/ (accessed on 1 August 2018).
  38. Daisy. 2016. Available online: http://www.chinabuses.org/news/2016/0617/article_9492.html (accessed on 1 August 2018).
  39. Gupta, A. The World’s Most Used Renewable Power Sources. 2014. Available online: https://www.power-technology.com/features/featurethe-worlds-most-used-renewable-power-sources-4160168/ (accessed on 1 August 2018).
  40. BYD. BYD Established PV R&D Center in Ningbo. 2018. Available online: http://www.sunwindenergy.com/news/byd-established-pv-rd-center-ningbo (accessed on 1 August 2018).
  41. Gregory, R. China-Biogas. 2010. Available online: http://www.ecotippingpoints.org/our-stories/indepth/china-biogas.html (accessed on 1 August 2018).
  42. Encyclopaedia Britannica. Ningbo CHINA. 1998. Available online: https://www.britannica.com/place/Ningbo (accessed on 1 August 2018).
  43. Market, Garbage Classification in China. 2011. Available online: http://www.wastemanagementworld.com/china-garbage-classification/ (accessed on 1 August 2018).
  44. Yang, S.; Shi, L. Public perception of smog: A case study in Ningbo City, China. J. Air Waste Manag. Assoc. 2017, 67, 219–230. [Google Scholar] [CrossRef]
  45. Cheshmehzangi, A. The changing landscape of Chinese cities: Positive and negative impacts of urban design controls on contemporary urban housing. Sustainability 2018, 10, 2839. [Google Scholar] [CrossRef] [Green Version]
  46. Ning, Developmental Application of Roof Greening against the Background of Sponge City: A Case Study of Ningbo City. 2016. Available online: https://search.proquest.com/docview/1820271471/fulltext/EA69BDFCC20349B7PQ/1?accountid=16676 (accessed on 20 August 2018).
  47. Cervero, R. Jobs-Housing Balancing and Regional Mobility. J. Am. Plan. Assoc. 1989, 55, 136–150. [Google Scholar] [CrossRef]
  48. Gao, Z.; Li, C.; Bai, J.; Fu, J. Chinese consumer quality perception and preference of sustainable milk. China Econ. Rev. 2016, 59, 100939. [Google Scholar] [CrossRef]
  49. Tang, Y.T.; Chan, F.K.S.; Griffiths, J. City profile: Ningbo. Cities 2015, 42, 97–108. [Google Scholar] [CrossRef]
  50. Iojă, I.C.; Osaci-Costache, G.; Breuste, J.; Hossu, C.A.; Grădinaru, S.R.; Onose, D.A.; Nită, M.R.; Skokanová, H. Integrating urban blue and green areas based on historical evidence. Urban For. Urban Green. 2018, 34, 217–225. [Google Scholar] [CrossRef]
  51. Collins, D.; Junghans, A. Sustainable Facilities Management and Green Leasing: The Company Strategic Approach. Procedia Econ. Financ. 2015, 21, 128–136. [Google Scholar] [CrossRef] [Green Version]
  52. China Daily. Top 15 New First-Tier Cities in China. 2017. Available online: http://www.chinadaily.com.cn/bizchina/2017top10/2017-05/15/content_29343927_14.htm (accessed on 31 July 2018).
  53. Chen, Z.; Kubiak, P.; Lopez, C.M.; Belharouak, I. Demonstration study of hybrid solar power generation/storage micro-grid system under Qatar climate conditions. Sol. Energy Mater. Sol. Cells 2018, 180, 280–288. [Google Scholar] [CrossRef]
  54. Lu, X.; Ke, S. Evaluating the effectiveness of sustainable urban land use in China from the perspective of sustainable urbanization. Habitat Int. 2018, 77, 90–98. [Google Scholar] [CrossRef]
  55. Ningbo. 2018. Available online: https://en.wikipedia.org/wiki/Ningbo (accessed on 2 August 2018).
  56. Hansen, U.E.; Nygaard, I.; Romijn, H.; Wieczorek, A.; Kamp, L.M.; Klerkx, L. Sustainability transitions in developing countries: Stocktaking, new contributions and a research agenda. Environ. Sci. Policy 2018, 84, 198–203. [Google Scholar] [CrossRef]
Figure 1. Analysis of feature-, procedure-, and performance-based indicators.
Sustainability 12 02462 g001
Figure 2. Percentage distribution of feature-, procedure-, and performance-based indicators of eight NSATs.
Sustainability 12 02462 g002
Figure 3. Sustainable pathway models (SPM) of eight Asian NSATs.
Sustainability 12 02462 g003
Figure 4. Point, linear, and phase model of NSATs.
Sustainability 12 02462 g004
Figure 5. Average SPM of eight Asian tools.
Sustainability 12 02462 g005
Figure 6. Percentage of mandatory indicators for each tool.
Sustainability 12 02462 g006
Figure 7. Distribution of mandatory indicators in different dimensions for the eight tools.
Sustainability 12 02462 g007
Figure 8. Distribution of mandatory indicators in different category for the eight tools.
Sustainability 12 02462 g008
Figure 9. Structure and hierarchy of urban local governance.
Sustainability 12 02462 g009
Figure 10. Residents’ choice of travel mode.
Sustainability 12 02462 g010
Figure 11. Population density of Ningbo.
Sustainability 12 02462 g011
Figure 12. Initial procedure for the selection of Chinese HSI from existing Asian tools.
Sustainability 12 02462 g012
Table 1. Neighborhood sustainability assessment tools (NSATs) and region of development in Asia.
Neighborhood Sustainability Assessment Tools
Comprehensive Assessment System for Build Environment Efficiency (CASBEE) UD (Japan)Green Building Index Township (Malaysia)Green Mark for Districts (Singapore)Indian Green Building Council (IGBC) Green Township (India)
Building for Ecologically Responsive Design Excellence (BERDE) Clustered Development (Philippines)Global Sustainability Assessment System (GSAS) District (Qatar)Building Environmental Assessment Methods (BEAM) Plus Neighborhood (Hong Kong)The Pearl Community (UAE)
Table 2. GSAS Material reuse.
Score% of Materials Reuse (X)
−1X < 5%
05% < X < 10%
110% < X < 15%
215% < X < 20%
320% < X
Table 3. Highest occurring indicators and highest dimensions.
CategoryIndicatorsOccurrence TimeHigher Dimensions
ManagementConstruction Plan 4E-EC-S or E-S-I
TransportationWalkability (Pedestrian Networks)4E-S-I
Bikeability (Cycling Networks) (Bicycle Rider Amenities)4E-S
Land use and EcologyLand Protection (Land Reuse)8E-EC-I
EnergyEnergy Efficiency Equipment6E-I
MaterialsRecycled Materials (Low Impact Material-Buildings and Structures and Infrastructure)7E-Ec, E-I
Indoor and Outdoor EnvironmentHeat Island Effect (Heat Island Design Principles) (Building Roof and Non-Roof)8E-S-I
CommunityMixed Use (Amenities for Communities) (Proximity to Key Establishments)8E-S-EC, E-S-I
CultureHeritage and Cultural Identity (Heritage Feature Protection and Promotion)6S-I
Business and EconomySupport of National Economy3EC-S-I
Sustainable BuildingsCertified Building8E-I
Table 4. BEAM (HK) mandatory indicators.
Mandatory IndicatorsDimension
CommunityMinimum Neighborhood AmenitiesEC-S-I
Minimum Functional UsesEC-S
Table 5. PCRS (UAE) Mandatory indicators.
Mandatory IndicatorsDimension
Integrated Development ProcessIntegrated Development StrategyS
Sustainable Building GuidelinesS-I
Community-dedicated Infrastructure Basic CommissionE-S
Natural systemNatural Systems AssessmentE-I
Natural Systems ProtectionE-I
Natural Systems Design and Management StrategyE-I
Livable CommunitiesPlan 2030E-EC-S-I
Urban Systems AssessmentE-EC-S-I
Provision of Amenities and Facilities S-I
Outdoor Thermal Comfort Strategy E-S-I
Minimum Pearl Rated Buildings Within CommunitiesE-I
Precious WaterCommunity Water Strategy E
Building Water GuidelinesE-S
Water Monitoring and Leak DetectionE-S
Resourceful EnergyCommunity Energy strategy E
Building Energy Guidelines E-S
Energy Monitoring and ReportingE-S
Stewarding Materials CCA Treated Timber Elimination E-S
Basic Construction Waste Management E-S
Basic Operational Waste ManagementE-S
Table 6. IGBC (INDIA) Mandatory indicators.
Mandatory IndicatorsDimension
Site Selection and PlanningLocal RegulationsE-I
Avoid Development of Inappropriate SitesE-I
Soil Erosion Control Plan E-I
Land Use PlanningLand Use OptimizationE-I
Basic Amenities within the CommunityE-EC-S
Basic Facilities for Construction WorkforceS-I
Transportation PlanningLong Term Transportation PlanE-S
Design for Differently-abledS
Infrastructure Resource Management Rainwater Harvesting, 50%E
Segregation of WasteE-S
Table 7. BERDE (Philippines) mandatory indicators.
Mandatory IndicatorsDimension
ManagementCommitmentE-I
Project TeamE-EC-S
Technical Site AssessmentE-S-I
Establish Basis of DesignE-S-I
Design Management SystemS
Construction Management SystemE-EC-S
Coordinated Commissioning SystemS
Land Use and EcologyConstruction Activity Pollution ControlE
WaterEffluent Quantity and Quality MonitoringE-I
Indoor Environment QualityLighting LevelsE-I
Thermal LevelsE-I
WasteWaste Management PlanE-I
Waste Management During ConstructionE
Heritage ConservationConservation AssessmentE-S

