Abstract
Rice husk gasification slag (RS) is a type of biochar that is one of the main by-products generated from the production of biomass power with rice husk as the feed. This study aimed to explore the short-term effect of the application of RS on the movement and transformation of fertilizer P in two different soil types through an incubation experiment. The results showed that the RS addition had a significant influence on the diffusive movement of P in soil microsites close to fertilizer placements both in latosolic red soil and fluvo-aquic soil. After 50 d of incubation, most of the WE-P (water-extractable P), AE-P (acid-extractable P), and Olsen-P (available P) were concentrated within 0–5 mm from the fertilization site. WE-P, Olsen-P, and the movement amount of the P in the 0–5 mm soil section were significantly increased at all levels of the RS application in the fertilizer P both in the two soil types. The application of the RS reduced the sorption and precipitation of the fertilizer P in the soil and improved the efficiency of the fertilizer P. The findings presented in this study may be used as references in developing RS applications that reduce losses of fertilizer P and reduce environmental risks.
1. Introduction
Due to the sorption, precipitation, and microbial immobilization of soil, most fertilizer P is quickly turned into plant-unavailable forms after application [1,2,3]. In agricultural soils worldwide, the bound P is abundant, but the plant-available form is limited. It is estimated that approximately 40% of the crop productivity of agricultural soils worldwide is limited by P availability, and P deficiency is a common problem [4]. The high P-fixation capacity of most soils and the low P-use efficiency (approximately 10–15%) of most plants means that large quantities of fertilizers are put into the soil continuously and that surplus P accumulates in soils [5]. However, rock-phosphate resources are limited. Some studies claim that at the current rates of extraction, the world’s commercial phosphate reserves will run out in 50–100 years [6]. Moreover, additional P inputs (mineral P fertilizer, atmospheric deposition, and weathering) and phosphate loss (surface runoff, subsurface flow, leaching, etc.) may result in freshwater and marine resource eutrophication [6,7,8].
Biochar has many excellent properties, such as favorable porosity, a large specific surface area, favorable water-holding capacity, strong adsorption capacity, and favorable ion-exchange capacity. It plays a large role in soil improvement and fertilization, waste biomass utilization, environmental restoration, fertilizer innovation, and greenhouse gas emission reduction [9,10,11]. The results of the effects of biochar on P availability are different. Chathurika et al. [12] reported that biochar application was observed to increase P availability in some soils, while in others, P availability was not affected or was observed to decrease, mainly due to increased P sorption. Biochar can induce changes in the soil ion exchange capacity, which can compete with Al and Fe oxides for the sorption of soluble P, similar to that observed for humic acids and fulvic acids [13]. Biochar may also delay P adsorption or precipitation in the soil through the sorption of chelating organic molecules that can directly adsorb cations such as Al3+, Fe3+, and Ca2+, as phenolic acids, amino acids, and complex proteins or carbohydrates [14,15].
Biomass power is an important way to utilize rice husks, which are one of the most common agricultural wastes generated in rice-producing countries. Rice husk gasification slag (referred to as RS) is a type of biochar that is one of the main byproducts generated from the production of biomass power with rice husk as the feed. RS can be used as soil amendments to mitigate greenhouse gas emissions and improve the soil health, and the Si present in rice husk ash has an important effect on plant resistance to multiple biotic and abiotic stresses [16]. Salequeet al. [17] showed that rice husk ash had a controlled release effect on P and K in the soil, which could reduce the application amount of the chemical fertilizer. RS is a low cost and sustainable resource, and there is great potential to reduce fertilizer consumption, greenhouse gas emissions, and nutrient losses [18].
To date, however, there is a lack of studies evaluating the short-term effect of RS on the diffusive movement of P and the availability of P in soil microsites close to fertilizer placements when applied with fertilizer P as a carrier of slow-release fertilizer in the soil. In this study, laboratory-scale studies were combined to investigate the diffusive movement of P in soil microsites after co-application with RS in two soil types.
2. Materials and Methods
2.1. Rice Husk Gasification Slag and Soil Preparation
The RS was produced by Bebo Bioenergy Science and Technology Co. Ltd, Hefei, China (Figure 1). It was made from rice husks at approximately 550 °C in a biogasification power cogeneration system (downdraft fixed-bed gasifier). The RS had 53.71% C, 25.35% Si, 8.71% K, 8.68% O, 1.41% Cl, 0.86% Ca, 0.68% P, 0.37% S, and 0.23% Mg. The specific surface area of the RS was 49.48 m2·g−1, and the pH value was 10.31. After being ground to pass through a 0.18 mm sieve, the RS was washed with 1.0 mol·L−1 HCl and rinsed with deionized distilled water several times [19]. Then, the acid-washed RS was oven-dried at 65 °C in an air oven.
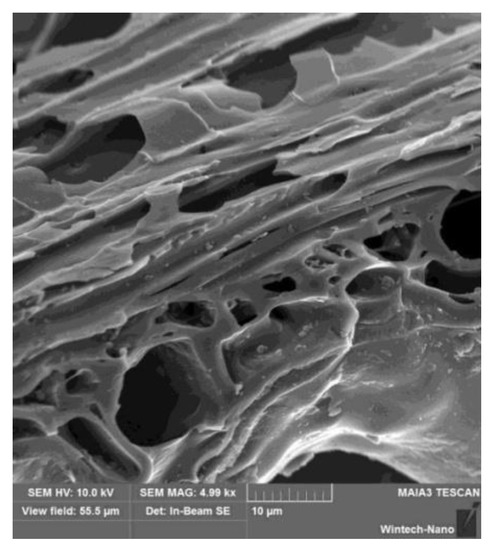
Figure 1.
Scanning electron micrograph (SEM) images of the rice husk gasification slag (RS).
Two kinds of Chinese arable soils were taken from the field plow layer at a depth of 0–20 cm, air-dried at room temperature, and passed through a 2 mm sieve. One was a latosolic red soil (pH = 5.45) according to the soil classification system in China and was a haplic ferralsol according to the FAO (Food and Agriculture Organization) soil classification system [20] from Shenzhen (22°46′ N, 113°52′ E, 22-m altitude), Guangdong Province. The other soil was a fluvo-aquic soil (pH = 8.48) or a haplic luvisol [20] from Liaocheng (36°52′ N, 116°14′ E, 29-m altitude), Shandong Province. The latosolic red soil consisted of 10.0% clay (<0.01 mm), 16.2% silt (0.01–0.05 mm), and 73.8% sand (>0.05 mm), while the fluvo-aquic soil consisted of 47.0% clay, 16.8% silt, and 36.2% sand. The physical and chemical characteristics of these soils are shown in Table 1.

Table 1.
Physiochemical properties of the soils used in this study. Olsen-P, WE-P and AE-P represent available P, water-extractable P and acid-extractable P, respectively.
2.2. Incubation Experimentsand Measurements
The containers for the soil incubation were wax columns at 120 mm in height with a cylindrical cavity having an internal diameter of 40 mm. The wax cylinders were prepared using the same method as Du et al. [21], modified from Khasawneh and Soileau [22]. The wax was closed at the bottom with a set of two pieces of filter paper. Then, a 180 g mass of the soil sample was put into the wax column. The latosolic red soil and fluvo-aquic soil samples’ height in the columns were 104 mm and 98 mm, respectively, and the bulk densities were 1.38 g·cm−3 and 1.46 g·cm−3, respectively. The wax cylinders were then placed on quartz sand. The quartz sand was watered and the soil was wetted by capillary action to the saturation moisture content. Then, the wax cylinders were allowed to equilibrate for 24 h on dry quartz sand to remove the gravity water. The final moisture contents of the latosolic red soil and fluvo-aquic soil were 270 g·kg−1 and 235 g·kg−1, respectively.
The incubation experiments included six treatments. The fertilizer treatments were 0.216 g monoammonium phosphate (referred to as MAP, containing 0.048 g P) alone or in combination with 0.016 g RS (RS/P = 1/3, w/w), 0.024 g RS (RS/P = 1/2, w/w), 0.048 g RS (RS/P = 1/1, w/w), and 0.096 g RS (RS/P = 2/1, w/w); hereafter, these treatments are referred to as MAP, MAP + 1/3RS, MAP + 1/2RS, MAP + RS, and MAP + 2RS, respectively. A control treatment without fertilizer and RS was also established (CK). Each treatment was replicated three times. The MAP mixed uniformly with the RS and was ground to pass through a 0.15 mm sieve. Avoiding the spaces between the soils and wax columns, the fertilizers on the surface of the soil columns were applied as evenly as possible. The filter papers covering the bottoms were then discarded, and the tops and bottoms of the wax columns were covered with parafilm to prevent moisture loss [23]. The soil columns were then incubated vertically at 25 °C in a constant humidity chamber.
After incubation for 50 d, the wax columns were horizontally sectioned, starting from the top of the soil site, into several slices of 5 mm thickness each using a sharp stainless-steel knife. After separating the wax from soil, the soil samples from each slice were analyzed for the chemical composition. The chemical analysis involved several steps using techniques similar to Hao et al. [24]. First, 1.0 g of oven-dried soil from each slice was weighed into a 50 mL conical centrifuge tube, and 30 mL of distilled water was added to the soil and centrifuged at 5000 rpm for 10 min at room temperature and then filtered. The filtrate was termed the “water-extractable fraction” (WE-P). Second, the same sample was then successively extracted with 30 mL of 1.0 mol·L−1 HCl as described in the second step, and the filtrate was termed the “acid-extractable fraction” (AE-P). Water was used as the extractant to provide information on P in the mobile phase, while the acid extractant was used to approximate the P in the immobile or exchangeable (sorbed) phase [21,24,25]. Third, another 1.0 g of oven-dried soil was weighed into a 50 mL conical plastic bottle; 50.0 mL of 0.5 mol·L−1 NaHCO3 extractant was added, and the mixtures were shaken for 30 min and then filtered. The filtrate was termed “the available P” (Olsen-P) [26]. The P concentrations in the extracted solutions were determined by the colorimetric blue method [27].
2.3. Analyses
The amounts of P in the soil columns receiving fertilizer MAP above the amount for the unfertilized soil (CK, unfertilized soil) were assumed to be from the addition of fertilizer MAP [23]. Therefore, the diffusive movement of WE-P, AE-P, and Olsen-P in each soil slice were determined to be the differences in values between the observed values and the background values (CK, unfertilized soil). The diffusive movement of P in each slice was determined according to the following equation:
where WE-P, AE-P, and Olsen-P are the diffusive movement of WE-P, AE-P, and Olsen-P, respectively, in each soil slice; WE-PObserved, AE-PObserved, and Olsen-PObserved are the observed values of WE-P, AE-P, and Olsen-P, respectively, in each soil slice; WE-PCK, AE-PCK, and Olsen-PCK are the background values; QMovement (mg) is the moved P in each slice, and m is the mass of soil slice (kg).
WE-P = WE-PObserved − WE-PCK
AE-P = AE-PObserved − AE-PCK
Olsen-P = Olsen-PObserved − Olsen-PCK
QMovement = (WE-P + AE-P) × m
The distributions of the WE-P, AE-P, and Olsen-P in the latosolic red soil and fluvo-aquic soil within the distances from the fertilizer site are described by the following first-order decaying exponential function:
where y represents the WE-P, AE-P, and Olsen-P concentrations (mg·kg−1); x is the distance from the fertilizer site (mm) in the soils.
The quantitative relationship among WE-P, AE-P, and Olsen-P in the latosolic red soil and fluvo-aquic soil is described by the following linear regression equation:
where y is the WE-P and AE-P concentrations (mg·kg−1).
y = a·Olsen-P + b
2.4. Statistical Analysis
Mrosoft Excel (Microsoft Corporation, USA) and SPSS windows version 16.0 (SPSS Inc., Chicago, IL, USA) packages were used for the statistical analysis of data. The least significant difference (LSD at p = 0.05) was calculated to determine whether the means significantly differed among the different treatments. Unless otherwise stated, the level of significance referred to p < 0.05.
3. Results and Discussion
3.1. The Diffusive Movement of WE-P in Soils
The MAP has good water solubility. After entering the soil, the phosphate groups quickly adsorbed and precipitated with the mineral particles and clay particles, and the most phosphate groups were adsorbed or precipitated into non-water-soluble states [28]. The water-soluble phosphorus is low in the soil, but it is the most important form of plant absorption and utilization of phosphorus.
The WE-P concentrations contained in the soil sections at the different distances from the fertilizer site are shown in Figure 2. The WE-P concentrations were the highest in the 0–5 mm soil section from the fertilizer site and decreased significantly with soil depth in either of the two soil types. Additionally, there was a significant effect from the addition of the RS on the distribution of the WE-P concentration within the column. In detail, the WE-P concentrations in the 0–5 mm soil section were 291.95–390.48 mg·kg–1 in the latosolic red soil, and the fertilizer treatments that added the RS were higher than those in which only the MAP was added. The WE-P concentration in the 0–5 mm soil section increased with the RS addition and was highest at RS/P = 2/1. However, in the 5–10 and 10–15 mm soil sections, the WE-P concentrations were 137.78–168.43 mg·kg−1 and 74.49–80.77 mg·kg−1, respectively, and the MAP treatment concentrations were the highest. In the fluvo-aquic soil, the WE-P concentrations of MAP + 1/3RS, MAP + 1/2RS, MAP + RS, and MAP + 2RS within the 0–5 mm soil section were 367.50, 399.15, 372.18, and 362.98 mg·kg−1, respectively, which were significantly higher than those obtained using only the MAP treatment. In the 5–10 and 10–15 mm soil sections, the WE-P concentrations of the MAP treatment were 62.41 and 34.72, respectively, and lower than those of the other treatments. The WE-P concentrations of each treatment in the two soil types were similar in the 15–20, 20–25, and 25–30 mm soil sections, and the diffusive movement of the WE-P concentration was very limited in the 25–30 mm soil section.
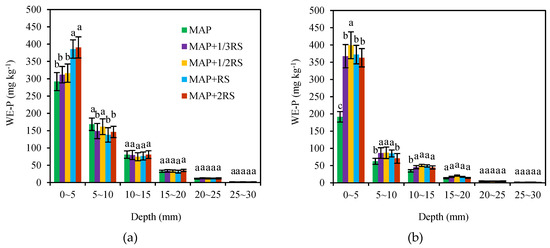
Figure 2.
Diffusive movement of the WE-P in the latosolicred soil (a) and fluvo-aquic soil (b) with different RS addition levels. MAP, MAP + 1/3RS, MAP + 1/2RS, MAP + RS and MAP + 2RS represent treatments monoammonium phosphate alone or in combination with 0.016 g RS, 0.024 g RS, 0.048 g RS and 0.096 g RS, respectively. The different lowercase letters indicate the significant differences in the WE-P concentrationamong the different RS addition levels in each soil section (p < 0.05).
The distributions of the WE-P in the latosolic red soil and fluvo-aquic soil within the distances from the fertilizer site can be described by a first-order decaying exponential function, with determination coefficient R2 in the range of 0.942–0.952 in the latosolic red soil and 0.982–0.995 in the fluvo-aquic soil (Table 2).
Table 2.
Regression analysis (y = b0eb1x) of the relationship of the WE-P concentration (y, mg·kg−1) with the distance from the fertilizer site (x, mm) in the soils. MAP, MAP + 1/3RS, MAP + 1/2RS, MAP + RS and MAP + 2RS represent treatments monoammonium phosphate alone or in combination with 0.016 g RS, 0.024 g RS, 0.048 g RS and 0.096 g RS, respectively.
3.2. The Diffusive Movement of AE-P in the Soils
In this experiment, AE-P was assumed to represent the fraction of P that had been precipitated as the amorphous state, but not yet converted to the acid-insoluble crystalline form. The precipitation of P, rather than the adsorption processes, would dominate the process due to the very high initial P concentration [24]. Therefore, the acid-soluble phosphorus reflected the state of the phosphorus in the solid phase of the soil.
The maximum values of AE-P also occurred at the 0–5 mm soil section in either of the two soil types (Figure 3). Within a distance of 0–5 mm from the fertilizer site, the AE-P concentration was much higher than that in the other distances. With increasing distance from the fertilization site, the AE-P content decreased rapidly. This result indicated that the applied phosphorus was severely precipitated within 5 mm of the fertilizer site. In detail, the AE-P concentrations within the 0–5 mm soil section were 575.47–678.18 mg·kg–1 in the latosolic red soil, and the MAP + 1/2RS concentration was the highest. However, the AE-P concentrations decreased to 258.41–288.79, 113.88–125.98, 42.41–51.71, 13.97–19.76, and 3.02–4.43 mg·kg−1 in the 5–10, 10–15, 15–20, 20–25, and 25–30 mm soil sections, respectively. In the fluvo-aquic soil, the AE-P contents in the 0–5 mm soil sections was 1221.18–1364.91 mg·kg−1. The AE-P value of the MAP treatment was much higher than those of the other treatments with the addition of the RS, while the WE-P concentration was much lower. In the 0–5, 5–10, and 10–15 mm soil sections, the AE-P values of the MAP were 8.30–11.77%, 10.61–16.36%, and 4.39–18.98% higher than those of the other treatments, respectively.
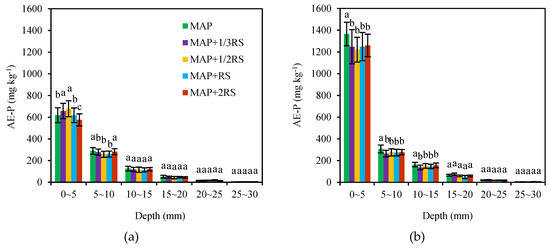
Figure 3.
Distribution of the AE-P in the latosolic red soil (a) and fluvo-aquic soil (b) with the different addition levels of RS. MAP, MAP + 1/3RS, MAP + 1/2RS, MAP + RS and MAP + 2RS represent treatments monoammonium phosphate alone or in combination with 0.016 g RS, 0.024 g RS, 0.048 g RS and 0.096 g RS, respectively. The different lowercase letters indicate significant differences in AE-P concentration among the different RS addition levels in each soil section (p < 0.05).
The distributions of AE-P in the latosolic red soil and fluvo-aquic soil with the distances from the fertilizer site can be described by a first-order decaying exponential function, with the determination coefficient R2 in the range of 0.978–0.991 in the latosolic red soil and 0.974–0.990 in the fluvo-aquic soil (Table 3).
Table 3.
Regression analysis (y = b0eb1x) of the relationship of AE-P (y, mg·kg−1) with the distance from the fertilizer site (x, mm) in the soils. MAP, MAP + 1/3RS, MAP + 1/2RS, MAP + RS and MAP + 2RS represent treatments monoammonium phosphate alone or in combination with 0.016 g RS, 0.024 g RS, 0.048 g RS and 0.096 g RS, respectively.
Xu et al. [15] showed that soil pH value had a significant influence on the P sorption of biochar application. Biochar application altered the P availability by changing the P sorptionand desorption capacities of the soils, and these biochar effects were dependent on soil acidity. The study showed that as the rate of the biochar application increased, the P sorption increased in the acidic soil but slightly decreased in the alkaline soil. At the same time, the biochar addition sharply increased the Ca-bound P and slightly enhanced the Al-retained P but decreased the Fe-bound P. These changes suggest that the increase in the P sorption with the biochar addition is attributed to the Ca-induced P sorption or the precipitation and is less affected by the Fe and Al oxides [29]. In this study, according to the WE-P concentrations in each treatment, we speculated that the P sorption and desorption capacities of the 0–5 mm soils increased at all levels of RS application in the fertilizer P. In addition, RS application also decreased the acid-insoluble P contents, especially in the fluvo-aquic soil.
3.3. Amount of P from the Fertilizer into the Soils
To compare the amount and distribution of the fertilizer phosphorus diffused into the soils, the weight of the WE-P and AE-P in the soil sections was calculated (the mass of soil slice showed in Table 4). The amount of the diffusive movement of P extracted from 0–30 mm soil sections (the sum ofthe diffusive movement of WE-P and AE-P in each soil section) was taken as the total amount of extractable P from the fertilizer. As shown in Figure 4, the movement of the P from the fertilizer was 14.75–15.09 mg in the latosolic red soil and 19.97–20.59 mg in the fluvo-aquic soil after 50 d of incubation, accounting for 30.74–31.43% and 41.60–42.90% of the total P application, respectively. The diffusive movement of P was very limited. Most P was mainly concentrated in the 0–5 mm soil section from the fertilizer site. In detail, the P movement within the 0–5 mm soil section in the latosolic red soil was 7.94–8.82 mg, which accounted for 16.54–18.38% ofthe total P application. Moreover, the P movement in the 0–5 mm soil section of the RS addition treatments was 5.92–11.08% higher than the MAP treatment, and the maximum value occurred in the MAP + RS treatment. In the fluvo-aquic soil, the P movement within the 0–5 mm soil section was 13.87–14.64 mg and accounted for 28.89–30.50% of the total P application, and it increased with the increasing of the RS addition. With increasing distance from the fertilizer site, the P movement decreased rapidly in the 5–30 mm soil sections both in the latosolic red soil and fluvo-aquic soil. The P movement in the MAP treatment in the 5–10 mm soil sections was 6.91–15.18% higher than in the other treatments in the latosolic red soil and 2.14–6.03% higher in the fluvo-aquic soil. The addition of RS reduced the initial P concentration and decreased the movement of the P to the further distance. The P movement in the 25–30 mm soil section accounted for only 0.09–0.11% of the total P application in the latosolic red soil and only 0.09–0.12% in the fluvo-aquic soil. The distance of P diffusion was 30 mm in the latosolic red soil and fluvo-aquic soil after 50 d of incubation.
Table 4.
The mass of soil slice (g). MAP, MAP + 1/3RS, MAP + 1/2RS, MAP + RS and MAP + 2RS represent treatments monoammonium phosphate alone or in combination with 0.016 g RS, 0.024 g RS, 0.048 g RS and 0.096 g RS, respectively.
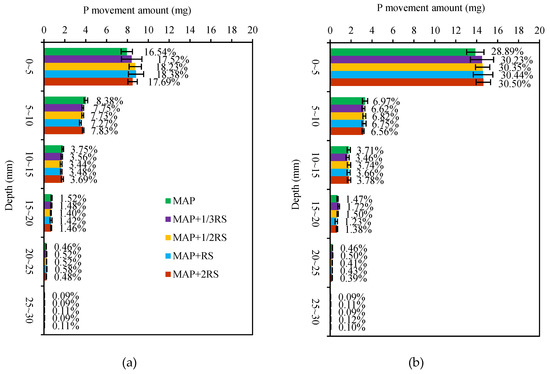
Figure 4.
Movement of P from fertilizer in the latosolic red soil (a) and fluvo-aquic soil (b) with different RS addition levels. The different percentages indicate the percentage between the P movement in each soil section and the total fertilizer P. MAP, MAP + 1/3RS, MAP + 1/2RS, MAP + RS and MAP + 2RS represent treatments monoammonium phosphate alone or in combination with 0.016 g RS, 0.024 g RS, 0.048 g RS and 0.096 g RS, respectively.
The P moves in soil through both diffusion and mass flow, and diffusion is the most important mechanism involved in the movement of the fertilizer P to the absorbing roots [30]. Due to the sorption and precipitation of the soil, the diffusive movement of the P was very limited in the soil. This suggests that we should reasonably choose the P fertilization time, and it is not suitable to apply it too early. In this study, the P movements within the 0–5 mm soil section at all levels of the RS application in the fertilizer P were higher than that of the MAP treatment, and less P diffused to the deeper soil sections. Surface run off/erosion is a main pathway of P diffusion from agricultural soils to water bodies, and the leaching of subsurface P is also an important pathway [31,32], RS may have the potential to play a role in reducing the fertilizer P input and decreasing the transfer of the P from the land to the water.
3.4. The Diffusive Movement of Olsen-P in the Soil
Similar to WE-P, the Olsen-P distribution in the columns was affected by amount of RS added and the distance from the fertilizer site (Figure 5). The maximum Olsen-P concentration occurred in the 0–5 mm soil section from the fertilizer site both in the latosolic red soil and fluvo-aquic soil. With increasing distance from the fertilization site, the content of Olsen-P decreased rapidly. The Olsen-P concentrations were 464.16–589.03 mg·kg−1 in the 0–5 mm soil section in the latosolic red soil and increased with the increasing of RS addition. However, in the 5–10 mm soil section, the Olsen-P concentration of the MAP treatment was the highest. In the fluvo-aquic soil, the Olsen-P concentrations of the treatments that were added RS were significantly higher than that of the MAP treatment, and the maximum value occurred in the MAP + 1/2RS. The diffusive movement of Olsen-P in the 10–30 mm soil section was very limited and did not change much with the amount of RS added.
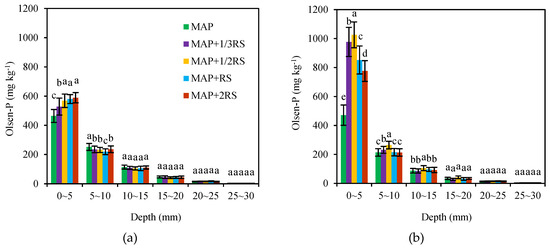
Figure 5.
Distribution of Olsen-P in the latosolic red soil (a) and fluvo-aquic soil (b) with the different RS addition levels. MAP, MAP + 1/3RS, MAP + 1/2RS, MAP + RS and MAP + 2RS represent treatments monoammonium phosphate alone or in combination with 0.016 g RS, 0.024 g RS, 0.048 g RS and 0.096 g RS, respectively. The different lowercase letters indicate significant differences in the Olsen-P concentration among the different RS addition levels in each soil section (p< 0.05).
Biochar used as a soil amendment can be attributed to an increase in the soil fertility, pH value in acidic soils, soil cation exchange capacity, and improved soil microbial activity and nutrient retention [18,33]. The P in biomass is basically retained in the pyrolysis process, and most of it exists in the Pi form [34]. Biochar not only can supply nutrients (such as N, P and K) to the soil directly and increases the soil fertility, but also can reduce the nutrient losses by increasing the ability of the soil to retain nutrients [35]. An important way that biochar affects the P availability in the soil is by changing the adsorption and desorption of P by the soil. However, the current research conclusions are different as to whether the biochar can adsorb the P directly. Yao et al. [36] tested the sorption capacity to P of 13 biochars, and the results showed that the biochars had little to no ability to adsorb the phosphate. The difference is that Chintala et al. [37] found that the biochar could adsorb P. In this study, the Olsen-P contained in the 0–5 mm soil sections of MAP + 1/3RS, MAP + 1/2RS, MAP + RS, and MAP + 2RS were significantly higher than those of MAP. The addition of RS was likely to affect the adsorption and desorption of P in the soil by changing the surface soil pH and the CEC (cation exchange capacity) after being applied with the fertilizer P to the soil.
The distributions of the Olsen-P in the latosolic red soil and fluvo-aquic soil with the distances from the fertilizer site can be described by a first-order decaying exponential function, with the determination coefficient R2 in the range of 0.974–0.985 in the latosolic red soil and 0.990–0.994 in the fluvo-aquic soil (Table 5).
Table 5.
Regression analysis (y = b0eb1x) of the relationship of Olsen-P (y, mg·kg−1) with the distance from the fertilizer site (x, mm) in the soils. MAP, MAP + 1/3RS, MAP + 1/2RS, MAP + RS and MAP + 2RS represent treatments monoammonium phosphate alone or in combination with 0.016 g RS, 0.024 g RS, 0.048 g RS and 0.096 g RS, respectively.
3.5. The Relationship among WE-P, AE-P and Olsen-P
Olsen-P includes WE-P and a portion of the bioavailable precipitated and adsorbed P. In this experiment, a part of the Olsen-P came from the soil solid phase, because the precipitated and adsorbed phosphorus had not been converted into a crystalline state that was difficult to utilize by crops in a short amount of time, and the newly formed amorphous compound still had certain effectiveness for crops. However, as the incubation time increased, its effectiveness was significantly reduced. As shown in Figure 6, the WE-P, AE-P, and Olsen-P in the 0–30 mm soil section in the latosolic red soil accounted for 10.67–12.20%, 19.08–20.45%, and 16.24–18.26% of the total P from the fertilizer, respectively. The Olsen-P contained 10.67–12.20% WE-P and 5.57–6.70% AE-P. However, the fluvo-aquic soil was different. There were 5.75–10.56% WE-P and 32.35–35.85% AE-P in the 0–30 mm soil section from the fertilizer and 5.75–10.56% and 9.62–16.70% for the Olsen-P, respectively. The fluvo-aquic soil was rich in clay particles (47.0%), and there was a large amount of calcium ions in the soil solution. After the fertilizer P diffused into the soil, only a very small amount existed in a water-soluble state, and most of it was adsorbed and precipitated by the soil.
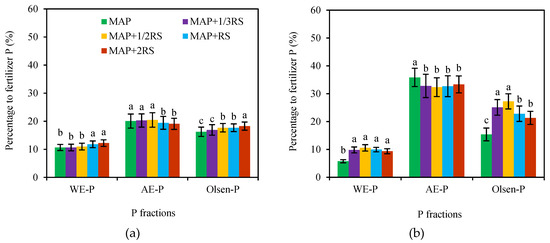
Figure 6.
Proportions of the various P fractions moved from the total P from the fertilizer in the latosolic red soil (a) and fluvo-aquic soil (b). The values indicate the percentage between the total movements of the P fractions in the 0–30 mm soil section and the total fertilizer P. MAP, MAP + 1/3RS, MAP + 1/2RS, MAP + RS and MAP + 2RS represent treatments monoammonium phosphate alone or in combination with 0.016 g RS, 0.024 g RS, 0.048 g RS and 0.096 g RS, respectively.
The WE-P and AE-P results showed a significant and positive linear correlation with the Olsen-P (p < 0.001) (Table 6). The slopes of the linear regressions among the WE-P, AE-P, and Olsen-P were 0.56–0.66 and 0.99–1.32 in the latosolic red soil, and 0.37–0.47 and 1.18–2.82 in the fluvo-aquic soil, respectively. The relationship among the WE-P, AE-P, and Olsen-P was due to the available P mainly coming from the WE-P and AE-P, and the WE-P and AE-P mainly came from the fertilizer P.
Table 6.
Quantitative relationship among WE-P, AE-P, and Olsen-P (y = a·Olsen-P + b). MAP, MAP + 1/3RS, MAP + 1/2RS, MAP + RS and MAP + 2RS represent treatments monoammonium phosphate alone or in combination with 0.016 g RS, 0.024 g RS, 0.048 g RS and 0.096 g RS, respectively.
4. Conclusions
In conclusion, the addition of the RS had a significant influence on the diffusive movement of P in soil microsites close to fertilizer placements in the two soil types. After 50 d of incubation, the diffusive movement of P was very limited and was mainly concentrated within 30 mm from the fertilization site in the two soil types. The acid-insoluble P accounted for 68.57–69.26% and 57.10–58.40% of the total P application in the latosolic red soil and fluvo-aquic soil, respectively. Most of the WE-P, AE-P, and Olsen-P were concentrated within 0–5 mm from the fertilization site. WE-P, Olsen-P, and the amount of P movement in the 0–5 mm soil section were significantly increased at all levels of RS application in the fertilizer P both in the latosolic red soil and fluvo-aquic soil. RS application reduced the sorption and precipitation of the fertilizer P in the soil and improved the efficiency of the fertilizer P, especially decreasing the content of acid-insoluble P in the fluvo-aquic soil. The RS may be used as a slow release carrier of fertilizer P to increase the fertilizer P availability and reduce the fertilizer P input.
Author Contributions
Conceptualization, Y.B. and D.W.; Investigation, J.Z., B.D., and H.S.; Methodology, Y.B.; Resources, Z.W., D.H., and J.D.; Writing—original draft, Y.B.; Writing—review and editing, D.W. All authors have read and agreed to the published version of the manuscript.
Funding
This research was funded by the National Key Research and Development Program of China (No. 2016YFD0200402).
Conflicts of Interest
The authors declare no conflict of interest.
References
- Zhu, J.; Li, M.; Whelan, M. Phosphorus activators contribute to legacy phosphorus availability in agricultural soils: A review. Sci. Total Environ. 2018, 612, 522–537. [Google Scholar] [CrossRef] [PubMed]
- Gustafsson, J.P.; Mwamila, L.B.; Kergoat, K. The pH dependence of phosphate sorption and desorption in Swedish agricultural soils. Geoderma 2012, 189–190, 304–311. [Google Scholar] [CrossRef]
- Roberts, T.L.; Johnston, A.E. Phosphorus use efficiency and management in agriculture. Resour. Conserv. Recycl. 2015, 105, 275–281. [Google Scholar] [CrossRef]
- Balemi, T.; Negisho, K. Management of soil phosphorus and plant adaptation mechanisms to phosphorus stress for sustainable crop production: A review. J.Soil Sci. Plant Nutr. 2012, 12, 547–562. [Google Scholar] [CrossRef]
- Withers, P.J.A.; Edwards, A.C.; Foy, R.H. Phosphorus cycling in UK agriculture and implications for phosphorus loss from soil. Soil Use Manag. 2001, 17, 139–149. [Google Scholar]
- Sattari, S.Z.; Bouwman, A.F.; Giller, K.E.; van Ittersum, M.K. Residual soil phosphorus as the missing piece in the global phosphorus crisis puzzle. Proc. Natl. Acad. Sci. USA 2012, 109, 6348–6353. [Google Scholar] [CrossRef]
- Havens, K.E.; James, R.T. The Phosphorus Mass Balance of Lake Okeechobee, Florida: Implications for Eutrophication Management. Lake Reserv. Manag. 2005, 21, 139–148. [Google Scholar] [CrossRef]
- Tilman, D.; Fargione, J.; Wolff, B.; D′Antonio, C.; Dobson, A.; Howarth, R.; Schindler, D.; Schlesinger, W.H.; Simberloff, D.; Swackhamer, D. Forecasting Agriculturally Driven Global Environmental Change. Science 2001, 292, 281–284. [Google Scholar] [CrossRef]
- Antal, M.J.; Grønli, M. The Art, Science, and Technology of Charcoal Production. Ind. Eng. Chem. Res. 2003, 42, 1619–1640. [Google Scholar] [CrossRef]
- Van Zwieten, L.; Kimber, S.; Morris, S.; Chan, K.Y.; Downie, A.; Rust, J.; Joseph, S.; Cowie, A. Effects of biochar from slow pyrolysis of papermill waste on agronomic performance and soil fertility. Plant Soil 2010, 327, 235–246. [Google Scholar] [CrossRef]
- Kizito, S.; Luo, H.; Lu, J.; Bah, H.; Dong, R.; Wu, S. Role of Nutrient-Enriched Biochar as a Soil Amendment during Maize Growth: Exploring Practical Alternatives to Recycle Agricultural Residuals and to Reduce Chemical Fertilizer Demand. Sustainability 2019, 11, 3211. [Google Scholar] [CrossRef]
- Chathurika, J.A.S.; Kumaragamage, D.; Zvomuya, F.; Akinremi, O.O.; Flaten, D.N.; Indraratne, S.P.; Dandeniya, W.S. Woodchip biochar with or without synthetic fertilizers affects soil properties and available phosphorus in two alkaline, chernozemic soils. Can. J. Soil Sci. 2016, 96, 472–484. [Google Scholar] [CrossRef]
- Hunt, J.F.; Ohno, T.; He, Z.; Honeycutt, C.W.; Dail, D.B. Inhibition of phosphorus sorption to goethite, gibbsite, and kaolin by fresh and decomposed organic matter. Biol. Fertil. Soils 2007, 44, 277–288. [Google Scholar] [CrossRef]
- Joseph, S.D.; Camps-Arbestain, M.; Lin, Y.; Munroe, P.; Chia, C.H.; Hook, J.; van Zwieten, L.; Kimber, S.; Cowie, A.; Singh, B.P.; et al. An investigation into the reactions of biochar in soil. Soil Res. 2010, 48, 501–515. [Google Scholar] [CrossRef]
- Xu, G.; Sun, J.; Shao, H.; Chang, S.X. Biochar had effects on phosphorus sorption and desorption in three soils with differing acidity. Ecol. Eng. 2014, 62, 54–60. [Google Scholar] [CrossRef]
- Kuhn, F.; Berghahn, E.; Sperotto, R.A.; Granada, C.E. Use of biotechnological approaches to add value to rice hulls. Biotechnol. Prog. 2019, 35, e2861. [Google Scholar] [CrossRef]
- Saleque, M.A.; Abedin, M.J.; Bhuiyan, N.I.; Zaman, S.K.; Panaullah, G.M. Long-Term effects of inorganic and organic fertilizer sources on yield and nutrient accumulation of lowland rice. Field Crops Res. 2004, 86, 53–65. [Google Scholar] [CrossRef]
- Lehmann, J.; Rillig, M.C.; Thies, J.; Masiello, C.A.; Hockaday, W.C.; Crowley, D. Biochar effects on soil biota—A review. Soil Biol. Biochem. 2011, 43, 1812–1836. [Google Scholar] [CrossRef]
- Chun, Y.; Sheng, G.; Chiou, C.T.; Xing, B. Compositions and Sorptive Properties of Crop Residue-Derived Chars. Environ. Sci. Technol. 2004, 38, 4649–4655. [Google Scholar] [CrossRef]
- FAO. In World Reference Base for Soil Resources 2006: AFramework for International Classification, Correlation and Communication; Food and Agriculture Organization of the United Nations: Rome, Italy, 2006. [Google Scholar]
- Du, Z.; Zhou, J.; Wang, H.; Du, C.; Chen, X. Effect of Nitrogen Fertilizers on Movement and Transformation of Phosphorus in an Acid Soil. Pedosphere 2005, 15, 424–431. [Google Scholar]
- Khasawneh, F.E.; Soileau, J.M. Soil Preparation and Sampling Techniques for Studying Ion Movement1. Soil Sci. Soc. Am. J. 1969, 33, 476–477. [Google Scholar] [CrossRef]
- Fan, M.X.; MacKenzie, A.F. Interaction of urea with triple superphosphate in a simulated fertilizer band. Fertil. Res. 1993, 36, 35–44. [Google Scholar] [CrossRef]
- Hao, X.; Cho, C.M.; Racz, G.J.; Chang, C. Chemical retardation of phosphate diffusion in an acid soil as affected by liming. Nutr. Cycl. Agroecosystems 2004, 64, 213–224. [Google Scholar] [CrossRef]
- Akinremi, O.O.; Cho, C.M. Phosphate Transport in Calcium-Saturated Systems: II. Experimental Results in a Model System. Soil Sci. Soc. Am. J. 1991, 55, 1282–1287. [Google Scholar] [CrossRef]
- Lu, R. Soil Agrochemistry Analysis Protocols; China Agriculture Science Press: Beijing, China, 1999. [Google Scholar]
- Murphy, J.; Riley, J.P. A modified single solution method for the determination of phosphate in natural waters. Anal. Chim. Acta 1962, 27, 31–36. [Google Scholar] [CrossRef]
- Lin, C.; Busscher, W.J.; Douglas, L.A. Multifactor Kinetics of Phosphate Reactions with Minerals in Acidic Soils: I. Modeling and Simulation1. Soil Sci. Soc. Am. J. 1983, 47, 1097–1103. [Google Scholar] [CrossRef]
- Xu, G.; Wei, L.L.; Sun, J.N.; Shao, H.B.; Chang, S.X. What is more important for enhancing nutrient bioavailability with biochar application into a sandy soil: Direct or indirect mechanism? Ecol. Eng. 2013, 52, 119–124. [Google Scholar] [CrossRef]
- Barber, S.A.; Walker, J.M.; Vasey, E.H. Mechanisms for Movement of Plant Nutrients from Soil and Fertilizer to Plant Root. J. Agric. Food Chem. 1963, 11, 204–207. [Google Scholar] [CrossRef]
- Sharpley, A.N.; Daniel, T.C.; Edwards, D.R. Phosphorus Movement in the Landscape. J. Prod. Agric. 1993, 6, 492–500. [Google Scholar] [CrossRef]
- Kleinman, P.J.; Church, C.; Saporito, L.S.; McGrath, J.M.; Reiter, M.S.; Allen, A.L.; Tingle, S.; Binford, G.D.; Han, K.; Joern, B.C. Phosphorus leaching from agricultural soils of the delmarva peninsula, USA. J. Environ. Qual. 2015, 44, 524–534. [Google Scholar] [CrossRef]
- Kookana, R.S.; Sarmah, A.K.; Van Zwieten, L.; Krull, E.; Singh, B. Chapter three-Biochar Application to Soil: Agronomic and Environmental Benefits and Unintended Consequences. Adv. Agron. 2011, 112, 103–143. [Google Scholar] [CrossRef]
- Angst, T.E.; Sohi, S.P. Establishing release dynamics for plant nutrients from biochar. GCB Bioenergy 2013, 5, 221–226. [Google Scholar] [CrossRef]
- Sohi, S.P.; Krull, E.; Lopez-Capel, E.; Bol, R. Chapter 2-A Review of Biochar and Its Use and Function in Soil. Adv. Agron. 2010, 105, 47–82. [Google Scholar] [CrossRef]
- Yao, Y.; Gao, B.; Zhang, M.; Inyang, M.; Zimmerman, A.R. Effect of biochar amendment on sorption and leaching of nitrate, ammonium, and phosphate in a sandy soil. Chemosphere 2012, 89, 1467–1471. [Google Scholar] [CrossRef]
- Chintala, R.; Schumacher, T.E.; McDonald, L.M.; Clay, D.E.; Malo, D.D.; Papiernik, S.K.; Clay, S.A.; Julson, J.L. Phosphorus Sorption and Availability from Biochars and Soil/Biochar Mixtures. CLEAN–Soil Air Water 2014, 42, 626–634. [Google Scholar] [CrossRef]
© 2020 by the authors. Licensee MDPI, Basel, Switzerland. This article is an open access article distributed under the terms and conditions of the Creative Commons Attribution (CC BY) license (http://creativecommons.org/licenses/by/4.0/).