Article

Pathways to Carbon-Neutral Cities Prior to a National Policy

1
Department of Built Environment, School of Engineering, Aalto University, 00076 Aalto, Finland
2
Faculty of Civil and Environmental Engineering, University of Iceland, 107 Reykjavik, Iceland
*
Author to whom correspondence should be addressed.
Sustainability 2020, 12(6), 2445; https://doi.org/10.3390/su12062445
Submission received: 24 February 2020 / Revised: 17 March 2020 / Accepted: 19 March 2020 / Published: 20 March 2020

Abstract

:
Some cities have set carbon neutrality targets prior to national or state-wide neutrality targets, which makes the shift to carbon neutrality more difficult, as the surrounding system does not support this. The purpose of this paper was to evaluate different options for a progressive city to reach carbon neutrality in energy prior to the surrounding system. The study followed the C40 Cities definition of a carbon-neutral city and used the City of Vantaa in Finland as a progressive case aiming for carbon neutrality by 2030, five years before the national target for carbon neutrality. The study mapped the carbon neutrality process based on City documents and national statistics, and validated it through process-owner interviews. It was identified that most of the measures in the carbon neutrality process were actually outside the jurisdiction of the City, which outsources the responsibility for the majority of carbon neutrality actions to either private properties or national actors with broader boundaries. The only major measure in the City’s direct control was the removal of carbon emissions from municipal district heat production, which potentially represent 30% of the City’s reported carbon emissions and 58% of its energy-related carbon emissions. Interestingly, the City owns electricity production capacity within and beyond the city borders, but it doesn’t allocate it for itself. Allocation would significantly increase the control over the City’s own actions regarding carbon neutrality. Thus, it is proposed that cities aiming for carbon neutrality should promote and advance allocable carbon-free energy production, regardless of geographical location, as one of the central methods of achieving carbon neutrality.

1. Introduction

Seventy percent of global greenhouse gas (GHG) emissions are accounted for by cities [1], where the energy supply sector is the largest contributor of these emissions [2]. As presented by Sperling et al. [3] and Nilsson and Mårtensson [4], for instance, some cities can have highly positive attitudes towards ambitious energy policies.
Although these studies found positive willingness by cities to follow national energy policies, they also found some major weaknesses. Sperling et al. [3] identified the need for central coordination, and Nilsson and Mårtensson [4] found local energy plans often to be vague. Similarly, from an urban development perspective, several previous studies have exemplified how energy planning needs to be integrated more into urban planning and urban development processes in order to execute low carbon development effectively [5,6,7,8,9,10,11,12]. Additionally, it has been questioned whether an integrated approach to land-use and transport planning brings about the carbon emission savings often expected from the municipalities in the transport sector [13].
Despite the limitations in GHG reduction capability, numerous cities have committed to reaching carbon neutrality within a certain time, and sometimes before national carbon neutrality targets. Carbon neutrality targets have been set by New York—2050 [14], Stockholm—2040 [15], Berlin—2050 [16], London—2050 [17], and Copenhagen—2025 [18], for instance. Copenhagen’s target was set prior to the national carbon neutrality target. Other cities are relying on the carbon neutrality of the energy supplied by the national grid until the target year. Due to the importance of the matter, consortiums such as Cites40 [19], Covenant of Mayors [20], and ICLEI [21] have been organized to advance the goal of carbon neutrality and general carbon reduction actions in their member cities. Cities40 is a coalition of 94 of the world’s largest cities. Covenant of Mayors is an EU-established initiative implementing climate objectives in nearly 10,000 local government organizations. ICLEI is a global initiative including more than 1750 local government organizations committed to sustainable urban development, from which more than 100 have committed to carbon neutrality. Several papers have studied the efficiency of municipal energy planning and the need to integrate it more into urban planning and urban development processes. Still, research on the capability of municipalities to create actual carbon neutral cities is lacking.
In such research, the scope of choice from which the emissions that the city directly or indirectly causes are included in their assessment is of high importance. One widely recognized scope system is that of the GHG Protocol [22]. They have defined three different levels: Scope 1 refers to GHG emissions from sources located within the city boundaries; Scope 2 refers to GHG emissions occurring as a consequence of the use of grid-supplied electricity, heat, steam, and/or cooling within the city boundaries; and Scope 3 refers to all other GHG emissions that occur outside the city boundaries as a result of activities taking place within the city boundaries.
C40 Cities’ definition of a carbon-neutral city [23] states four criteria for the carbon-neutral city: 1. Net-zero greenhouse gas emissions (annual emissions are completely cancelled out through carbon offsetting, or removed through carbon dioxide removal or emissions removal measures) from fuel use in buildings, transport, and industry (Scope 1), 2. Net-zero greenhouse gas emissions from the use of grid-supplied energy (Scope 2), 3. Net-zero greenhouse gas emissions from the treatment of waste generated within the city boundaries (Scope 1 and 3), and 4. Where a city accounts for additional sectoral emissions in their GHG accounting boundary, net-zero greenhouse gas emissions from all additional sectors in the GHG accounting boundary. C40 Cities also propose an alternative consumption-based approach, but the first production-based approach has been widely adopted, and is used as a definition of a carbon-neutral city in this study as well. The definition is widely used and thus justified to be used in this research. Figure 1 explains the scope definition as described by GHG Protocol [22].
In Finland, all major cities have made carbon neutrality commitments; the capital city Helsinki has committed to be carbon neutral by 2035 [24], Espoo by 2030 [25], Vantaa by 2030 [26], Tampere by 2030 [27], Turku by 2029 [28], and Oulu by 2040 [29]. The national target of carbon neutrality is set for 2035 [30], so Espoo, Vantaa, Tampere, and Turku are following the example of Copenhagen by introducing more ambitious city-level targets.
This paper’s aim is to evaluate how carbon-neutral city status can be achieved when the surrounding national or state-wide system does not yet support the neutrality. The study focuses on the energy sector’s GHG emissions. The research utilizes a case study of the City of Vantaa due to the availability of high-quality research material. It is conducted based on a process document review together with interviews of the key personnel who are guiding the work toward the carbon neutrality goal.
It will be shown that the City under assessment outsources the majority of the actions needed to secure the status of a carbon-neutral city to the state and the private sector. In addition, it does not allocate its electricity generation from Scope 1 or 2 to itself, thus limiting its capability to reach the carbon neutrality target. When justifying such scope allocation, the potential for carbon neutrality increases dramatically and allows carbon compensation actions, for instance, to be made for other sectors as well. The paper also discusses whether cities should invest in Scope 3 energy production in order to achieve further reductions in their carbon footprint.

2. Materials and Methods

2.1. Case Setting

The case study was conducted in the third biggest city in Finland, Vantaa, which is in Southern Finland. Vantaa has 228,000 residents and 17 million gross square meters of building stock, of which 10 million is residential buildings [31]. The City’s electricity consumption is 1913 GWh, and heat consumption is 1724 GWh [32]. It aims to achieve carbon neutrality by 2030 by decreasing GHG emissions by at least 80% from 1990 levels and compensate for the remainder with carbon sinks and funding carbon reduction measures elsewhere, for instance [33]. Table 1 presents a description of the City’s carbon neutrality scenarios and emissions as accounted for by the City [33]. BAU is a business-as-usual scenario, describing the outcome without any additional actions, and CN describes a carbon-neutral scenario with required actions.
As the study’s focus is on the energy sector, the sub-sectors of district heating, oil-based heating, electricity-based heating, and residential electricity are within the context and are thus evaluated. Transportation, industry and machinery, waste disposal, and agriculture include emissions from sector-specific emissions sources not related to electricity or heat supply, but to land use and fuel use. The City’s approach to decreasing energy sector-based GHG emissions is to eliminate oil, coal, natural gas, peat, and plastic waste from district heat production, and to decrease the consumption of electricity together while relying on national GHG reduction actions within electricity production. A more detailed action plan is described later in chapter 3. Although district heating represents a significant amount of the City’s GHG emissions and is within the City’s jurisdiction, oil-based heating, electricity consumption, and national-level electricity production are out-of-jurisdiction matters, and thus the plan can be considered weak as such. In addition, and as suggested by the City [33], the importance of electricity will also increase within the remaining sectors, such as transportation and industry, which are not currently within the energy sector. Table 2 and Table 3 present detailed information about the energy sector’s systems to which the City is connected.

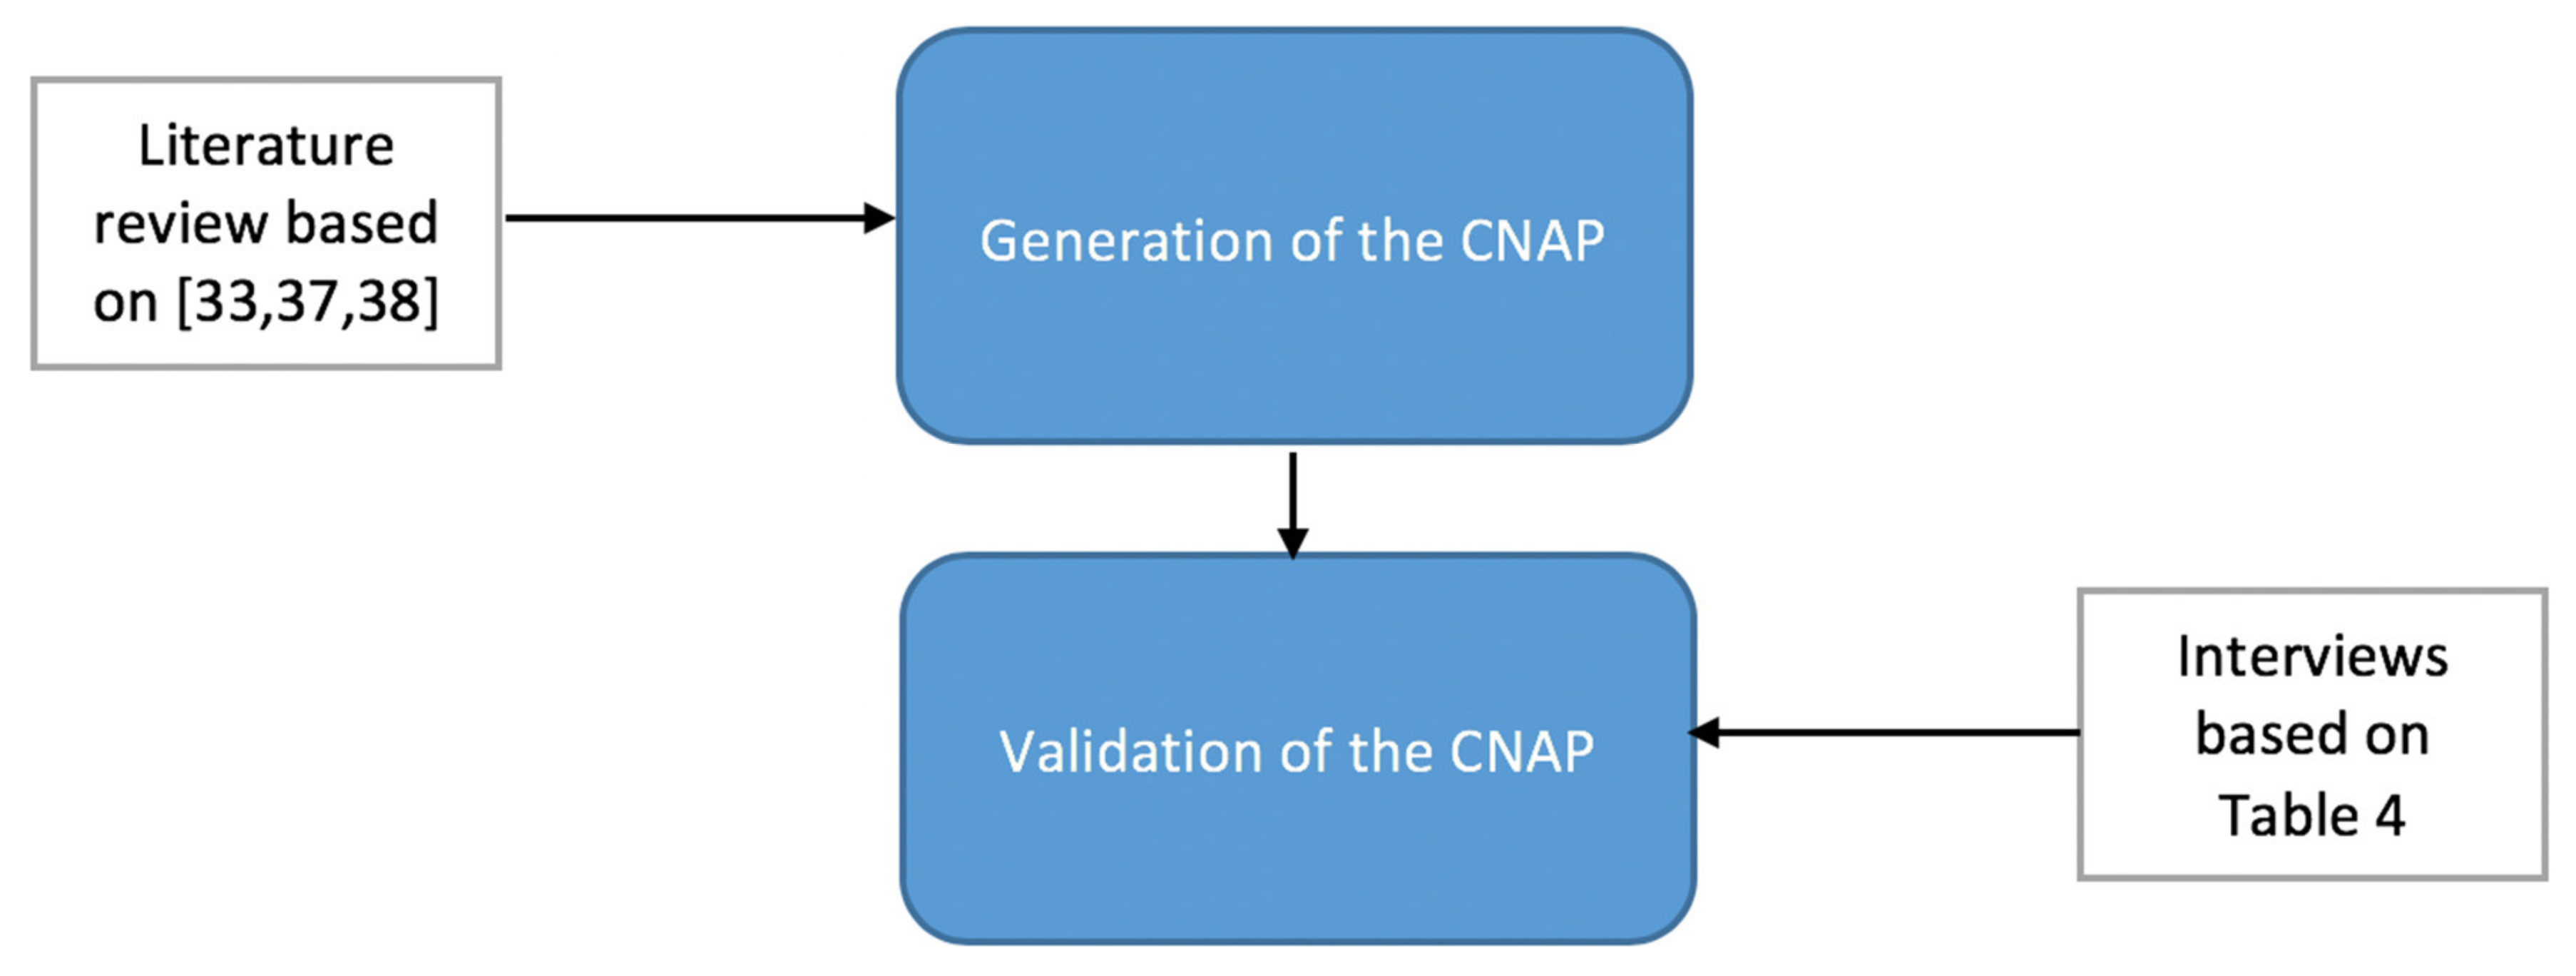
2.2. Research Process

The research process was twofold. The first phase was to generate the Carbon Neutrality Action Plan (CNAP) of the City’s actions and process owners aiming to reach carbon-neutral city status. All of the City’s direct actions are within the field of land use, buildings, and the environment [37,38]. The generation of the CNAP was performed through a review of the City’s process description literature. The second phase was to validate the actions which are or were to be utilized, that were included in the CNAP. This was done by interviewing the process owners. Validation of the generated CNAP is crucial, as the literature may not represent the actual and practical processes that the City and its organizations are utilizing. Figure 2 presents the research process:

2.3. Generation of the Carbon Neutral Action Plan

The CNAP is combined from data produced by national and municipal organizations. A document prepared by the City of Vantaa describing the required actions to achieve city-level carbon neutrality [33] has been used to describe the required technical measures. For city-level actions and process owners, a general roadmap document [37] is used for city-level process description and more detailed process description [38] for the land use, buildings, and environment sectors.

2.4. Validation of the Carbon Neutral Action Plan

Interviews were based on semi-structured approach and were initiated by presenting the generated CNAP, followed by discussions. The interviews focused on individuals, but were arranged in group sessions. The sessions are specified in Table 4. This may have had an impact on the responses in terms of restricting individuals to speak openly, but on the other hand, it provided support for individuals by their co-workers. In CNAP, required actions [33] are linked with processes and process owners [38]. In discussions, interviewees were asked to confirm which of these connections were correct, which weren’t, and what was missing. Table 5 presents the CNAP as it was presented to the interviewees. Interviewees were presented with grand tour questions [39,40] on each numbered and required action, and were asked to explain if this was how they saw this action being managed by the City’s indirect and direct processes, as described below. Planned prompts [39,41] were utilized to focus the discussion on carbon neutrality processes when explanations started to shift toward covering general city planning and development. All the interviews were recorded, transcribed, and analyzed.
A general roadmap document [37] of the City described the process owners’ response to creating a carbon-neutral city. These process owners were the City’s sub-organizations. Interviewees were selected by contacting these sub-organizations and identifying the correct responsible persons. Interviewees were process owners of the municipal carbon neutrality generation process: The head of City planning (process owner of land use, buildings, and the environment), the head of the Environment Center (process owner of the complete carbon-neutral city and the environment), the environment manager (supporting the process owner of the complete carbon-neutral city and the environment), the manager of the Municipal Buildings Center (the process owner of the Municipal Buildings Center), the head of the City Plan, the head of the Master Plan and development personnel at the local municipal energy company. Table 4 presents a summary of interviewees.

3. Results

It was identified that most of the carbon neutrality actions are outside of the City’s jurisdiction, limiting its capability to ensure the achievement of a carbon-neutral city. The approach currently followed by the City can potentially ensure 30% of complete GHG reductions and 58% of energy sector-related GHG emissions by eliminating GHG emissions from local district heat production. The rest of the GHG emission reductions are outsourced to the private sector or the state. The City does not allocate its own electricity production within scopes 1 or 2 for itself, thus limiting its capability to take responsibility for achieving carbon-neutral city status. The detailed results presented in this chapter are separated into two parts. First, the generated CNAP is presented, followed by validation results of the generated CNAP.

3.1. Generated CNAP

Based on the process description and the carbon neutral generation literature, a CNAP with actions, processes, and process owners was created, as presented in Table 5. The required actions for carbon neutrality are listed on top, with process owners together with direct processes in relation to required actions identified below. These could be stated as mandatory processes. Next are indirect processes and process owners, respectively. These are rather suggestive processes, and are not mandatory. This is followed by general indirect processes and process owners, which do not have any direct link to the required actions, but may have some influence over them.

3.2. Validation Results

Interviewees raised the notifications as presented in Table 6 for each action.
In addition, the following general comments were raised:
  • Large-scale energy efficiency improvements in the existing building stock are hard, although in some building permit and City plan cases this can be required.
  • The role of the state is seen as important when radical carbon emission decreases are targeted.
CNAP validation confirms the City’s general carbon-neutral generation approach outlined by the generated CNAP. Table 5 shows that the only direct process, which can be mandatory by nature, is the process of local district heating. The importance of this is high, as it represented 30% of carbon emissions in 2016, as shown in Table 1. The share of energy sector emissions is 58%. However, where the local energy company is seen to be committed to the achievement of this goal by the municipal organization, it was not seen as clear from the local energy company perspective. The company does have a vision of this, but it lacks the exact execution plan, as the focus is based more on the short and medium term. The vision includes some actions that remain are highly uncertain, and so continuous planning is needed and uncertainties will exist. Additionally, for the remaining share, there are no direct processes or requirements which could be stated as mandatory. Indirect (and suggestive by their nature) processes are identified for required actions 2, 6, and 7. The Department of Building Control guides constructors toward the efficient use of space in order to restrict the built square meters. The Department of City Planning is generating and updating City plans to support renewable energy production in order to gain the necessary amount of renewable energy production via the buildings themselves. In addition, a renewable city assessment is planned by the Real Estate Center and the Environmental Center to assist in the increased share of renewable energy in both centralized and distributed generation. For other required buildings-related actions, there are no direct or indirect processes linked to them. Two general processes are planned that could partly assist in carrying the required actions: 1. The service provided by the Information Center for Climate Actions will be marketed, utilized, and steered actively. Its performance monitoring and measuring will be developed, and 2. Climate impacts will be assessed in all the City plans, where relevant. Only building stock-related processes are mandatory for the City’s own buildings. Their role in carbon emissions is still marginal, below 0.5%. Indirect processes guiding the development were identified only for actions 2 and 6. For the rest of the actions there were only indirect general processes identified that were related to them. Thus, the actual efficiency of the CNAP as such is not strong. The City’s primary approach is to eliminate GHG emissions from district heating production, majorly decrease the consumption of electricity by individuals and the private sector, and rely on the hope that GHG emissions from electricity production will be dramatically decreased at the national level.

4. Discussion

The results showed that in terms of the number of processes, the City’s general approach to the achievement of carbon-neutral city status is mostly through decreasing consumption, focusing heavily on the energy efficiency of the building stock together with distributed renewable energy production. Most of the processes are not mandatory, thus limiting the City’s capability to steer the generation. The only mandatory process related to the production perspective is centralized district heating energy production, which is owned by the City, and thus within its jurisdiction. This process potentially eliminates carbon emissions occurring as a result of such energy production. The carbon decrease potential of district heat production represented 30% of the City’s total carbon emissions in 2016 and 58% of the energy sector’s GHG emissions. The consumption of electricity represents 22% of the City’s total carbon emissions in 2016 and 42% of energy sector’s GHG emissions. The amount of electricity produced by CHP was 33% of this. This electricity production is not allocated to the City. If it were, the City’s GHG emissions would initially increase, but it would increase its potential for carbon reduction measures.
Whereas the allocation of scope 1 emissions and GHG emissions from local municipal electricity production to the City is simple to justify, although not done here, GHG emissions from Scope 2 energy production have to be considered more on a case-by-case basis. Where carbon credits or compensation are offered from various sources, potentially allowing such affordable allocations to be made, one has to be aware of whether the allocation of such can be justified for carbon accounting. The municipal energy company owns shares in renewable electricity production sites.
Although electricity is purchased from the markets, the allocation of such electricity production to the City can be justified, as investments in such energy production has been decided upon by the municipality. When co-owned electricity production is included, the share of municipality-produced electricity rises to 74%. Co-owned production is completely renewable. Thus, when co-owned production shares are allocated to the City, municipal processes mean the City is 89% carbon-free from an energy sector perspective.
Even though the C40 Cities carbon-neutral city definition [23] allows such allocation of out-of-city-boundary energy production, the City has not recognized this. Centralized electricity production is seen as an out-of-city-boundary and energy production company matter influencing City emissions through the grid emission implications.
Limiting the City’s boundary from electricity production increases the responsibility of external parties and limits the City’s capability to achieve carbon-neutral city status. Thus, the responsibility of a truly carbon-neutral city is shifted to the energy industry and central government. Additionally, private sector energy efficiency and distributed renewable energy production measures are indirect and instructive in limiting the influence of the City’s direct and mandatory measures to −58% from stationary energy system carbon emissions in 2016. It is thus seen that the major responsibility to ensure carbon neutrality belongs to central government, international organizations, the energy production sector, and real estate owners.
From the municipal organization perspective, this finding is in line with former research. Sperling et al. [3] found the need for central coordination in municipal energy planning activities in Denmark. Nilsson et al. [4] argued that municipal energy plan goals can be rather vague. Nystedt et al. [6] highlighted the importance of legislation in the energy-efficient city.
On the other hand, a willingness to adapt different approaches for the achievement of carbon-neutral city status, when these measures can be justified, was identified in this study. Similarly, Madlener and Sunak [9], for example, suggested that urban planning will be pivotal for a sustainable energy future. Studies within this field concern urban energy planning and integrating it more into existing urban planning processes. Research regarding the process of achieving absolute carbon-neutral city status is still lacking, which might partly contribute to the lack of execution plans for carbon-neutral cities and the allocation of centralized electricity production for cities. The allocation of such energy production for cities might be the only tool some cities have for achieving carbon-neutral city status. In most cases, it can be assumed that this also means the allocation of energy production beyond the physical city boundaries.
As cities’ approaches toward carbon reduction have been seen to be more bottom-up in the literature, focusing on increasing the energy efficiency of buildings and integrating distributed renewable energy production, this case study city’s approach was similar, with its limited control over securing the production of carbon-free energy. When developing a truly carbon-neutral city, one has to focus on net-energy flows and their emissions. Thus, it could be proposed that an efficient approach to reaching such a status and ensuring an efficient transition toward it should combine both bottom-up and top-down approaches. As a result, consumption-based energy efficiency measures would be taken into account in parallel when securing the transition to carbon-free energy production. For cities, this means that shares in energy production investments would be included in CNAP, with this production allocated to the City. Where this is not reasonable, proven annual carbon compensation mechanisms should be included to make sure that the annual net-carbon balance is zero or negative, regardless of the actual capability to shift toward complete net-zero emissions. For transparent statistics and carbon accounting, allocated energy production should be separated in the statistics so that actual carbon emissions can be calculated for the sectors and cities. Without this separation, double counting will exist. When considering cities such as Espoo, Vantaa, Tampere, Turku, and Copenhagen achieving carbon neutrality prior to national carbon neutrality, the importance of out-of-city-boundary energy investments and allocations can be seen as necessary. Even for those cities achieving carbon neutrality after it is achieved nationally, such investments are likely to be mandatory if consumption-based carbon accounting is added and/or compensation is needed.
There are certain limitations in this study which should be noted when drawing final conclusions. First, the study used the required actions for carbon neutrality prepared by the City as they are. Thus, where these actions are potentially incorrect for achieving carbon-neutral city status, the study repeats this error. Secondly, all the indirect measures and their potential were excluded from the study, underestimating the potential of the City from this perspective. On the other hand, the study also excluded the shares of future energy sector-based GHG emissions and the potential currently within GHG emissions from segments other than the energy sector—most importantly, the future electricity consumption within the transportation sector. Whilst the transportation sector is the second-highest GHG emitting sector for the City, and its electricity consumption will most likely increase dramatically, the City’s capability to take responsibility for the carbon-neutral city status increases, as it can react to this consumption increase with additional carbon neutral electricity production. Thirdly, the assessment follows scenarios and assumptions of the future, which weakens the reliability of the study.
In addition, the municipal energy system is highly interlinked with waste disposal. Thus, changes in waste supply have a direct influence on energy systems. Anaerobic digestion of waste food, for instance, would offer great potential for further synergy between these sectors [42,43].
The study included only energy-sector GHG emissions, which doesn’t represent the complete carbon emissions of the City. The share of energy sector GHG emissions is 52% of total GHG emissions. As stated earlier, the remaining share is dominated by emissions from the transportation sector. As the remaining carbon emission sources are seen to move more into the energy sector, this increases the potential of municipalities to take responsibility for the carbon-neutral built environment—that is, as long as centralized electricity production is allocated to the City and seen as a tool that the City can utilize and take responsibility for. Similarly, when changing carbon accounting to a consumption-based approach, the City’s GHG emissions would probably increase significantly. Thus, it would be natural for the City to also compensate these GHG emissions through securing carbon-free energy production within a larger system. Doing so within the national or Scope 2 boundary would be relatively simple. To compensate global or Scope 3 GHG emissions, appropriate shares in related energy production funds could be considered, for example. Where this paper studied a reference year, it is important to recognize that system changes are rather dynamic, changing annually and influencing the potential for how carbon neutrality could be achieved. Similarly, while the shares of fossil fuels are decreasing, consumption from grid-supplied energy systems is likely to increase, which changes the carbon neutrality requirements accordingly.

5. Conclusions

As the capability of cities to impact actual radical carbon mitigation has been questioned, and with some cities having set carbon neutrality targets prior to national- or state-level targets being set, this study evaluated the options a progressive city has in order to reach energy sector-related carbon neutrality, regardless of national actions. It was identified that the city under assessment took only partial control of the drive to achieving carbon-neutral city status. Rather defined measures were more suggestive and promoted energy efficiency and distributed renewable energy production in the built environment. Actions within the City’s jurisdiction were directed at municipal district heating production and the municipal building stock. These represent 30% of total carbon emissions and 58% of grid-supplied energy system carbon emissions. It was seen that a mandatory requirement to create a truly carbon neutral built environment, including the private sector, is the responsibility of central government, the energy sector and the real estate sector. The most important finding was that the City administration does not allocate its electricity production to itself, although it is owned by the City’s energy company or even completely produced within Scope 1. This excludes significant carbon reduction potential and limits the municipal organization’s capability to take complete responsibility for the achievement of carbon-neutral city status from the stationary energy perspective. Thus, it is proposed that in municipal carbon accounting, municipal energy production from all scopes should be allocated to the City, and other cities aiming for carbon neutrality should consider making energy investments within and beyond their boundaries as one of the central methods to reach this target, and scope definition in carbon neutrality should justify this more clearly.

Author Contributions

Conceptualization: J.L. and S.J.; main responsibility: J.L.; supervision and writing: J.H. and S.J. All authors have read and agreed the published version of the manuscript.

Funding

This research was funded by Business Finland, 601/31/2017 and Helsinki-Uusimaa Regional Council, UIR026.

Conflicts of Interest

The authors declare no conflict of interest.

References

  1. IEA (The International Energy Agency). World Energy Outlook 2008; OECD/IEA: Paris, France, 2008; p. 569. ISBN 978-92-64-04560-6. [Google Scholar]
  2. Bruckner, T.I.A.; Bashmakov, Y.; Mulugetta, H.; Chum, A.; de la Vega Navarro, J.; Edmonds, A.; Faaij, B.; Fungtammasan, A.; Garg, E.; Hertwich, D.; et al. Energy Systems. In Climate Change 2014: Mitigation of Climate Change. Contribution of Working Group III to the Fifth Assessment Report of the Intergovernmental Panel on Climate Change; Edenhofer, O.R., Pichs-Madruga, Y., Sokona, E., Farahani, S., Kadner, K., Seyboth, A., Adler, I., Baum, S., Brunner, P., Eickemeier, B., et al., Eds.; Cambridge University Press: Cambridge, UK; New York, NY, USA, 2014. [Google Scholar]
  3. Sperling, K.; Hvelplund, F.; Mathiesen, B.V. Centralisation and decentralisation in strategic municipal energy planning in Denmark. Energy Policy 2011, 39, 1338–1351. [Google Scholar] [CrossRef]
  4. Nilsson, J.S.; Mårtensson, A. Municipal energy-planning and development of local energy-systems. Appl. Energy 2003, 76, 179–187. [Google Scholar] [CrossRef]
  5. Vandevyvere, H.; Stremke, S. Urban planning for a renewable energy future: Methodological challenges and opportunities from a design perspective. Sustainability 2012, 4, 1309–1328. [Google Scholar] [CrossRef] [Green Version]
  6. Nystedt, Å.; Sepponen, M. Development of a Concept for Ecological City Planning for St. Petersburg Russia. In Proceedings of the World Renewable Energy Congress-Sweden, Linköping, Sweden, 8–13 May 2011; Linköping University Electronic Press: Linköping, Sweden, 2011; pp. 3074–3081. [Google Scholar]
  7. Torabi Moghadam, S.; Delmastro, C.; Corgnati, S.P.; Lombardi, P. Urban energy planning procedure for sustainable development in the built environment: A review of available spatial approaches. J. Clean. Prod. 2017, 165, 811–827. [Google Scholar] [CrossRef]
  8. Stoeglehner, G.; Niemetz, N.; Kettl, K.H. Spatial dimensions of sustainable energy systems: New visions for integrated spatial and energy planning. Energy Sustain. Soc. 2011, 1, 2. [Google Scholar] [CrossRef] [Green Version]
  9. Madlener, R.; Sunak, Y. Impacts of urbanization on urban structures and energy demand: What can we learn for urban energy planning and urbanization management? Sustain. Cities Soc. 2011, 1, 45–53. [Google Scholar] [CrossRef]
  10. Park, H.; Andrews, C. City Planning and Energy Use. In Encyclopedia of Energy; Cleveland, C.J., Ed.; Elsevier: New York, NY, USA, 2004; pp. 317–330. [Google Scholar]
  11. Mathiesen, B.V.; Lund, H.; Connolly, D.; Wenzel, H.; Østergaard, P.A.; Möller, B.; Nielsen, S.; Ridjan, I.; Karnøe, P.; Sperling, K.; et al. Smart Energy Systems for coherent 100% renewable energy and transport solutions. Appl. Energy 2015, 145, 139–154. [Google Scholar] [CrossRef]
  12. Hedman, Å. Energy-Efficient City Planning: The Role and Importance of Actionable Regulations; Aalto University: Aalto, Finland, 2016; ISBN 978-952-60-6622-6. [Google Scholar]
  13. Yoon, J.J.; Joo, Y.G.; Seungil, L. Evaluating integrated land use and transport strategies in the urban regeneration projects toward sustainable urban structure: Case studies of Hafen City in Germany and Shinagawa Station in Tokyo. Int. J. Urban Sci. 2011, 15, 187–199. [Google Scholar] [CrossRef]
  14. City of New York. OneNYC 2050. Available online: https://onenyc.cityofnewyork.us (accessed on 12 December 2019).
  15. City of Stockholm. Strategy for a Fossil-fuel Free Stockholm by 2040. Available online: https://international.stockholm.se/globalassets/rapporter/strategy-for-a-fossil-fuel-free-stockholm-by-2040.pdf (accessed on 12 December 2019).
  16. City of Berlin. Climate-Neutral Berlin 2050. Available online: https://www.berlin.de/senuvk/klimaschutz/politik/en/ziele.shtml (accessed on 12 December 2019).
  17. City of London. Zero Carbon London. Available online: https://www.london.gov.uk/what-we-do/environment/climate-change/zero-carbon-london (accessed on 12 December 2019).
  18. City of Copenhagen. Carbon Neutral Capital. Available online: https://international.kk.dk/artikel/carbon-neutral-capital (accessed on 12 December 2019).
  19. C40 Cities. C40 Cities. Available online: https://www.c40.org (accessed on 14 December 2019).
  20. Covenant of Mayors. Available online: https://www.covenantofmayors.eu/ (accessed on 14 December 2019).
  21. ICLEI. ICLEI—Local Governments for Sustainability. Available online: https://www.iclei.org (accessed on 14 December 2019).
  22. GHGProtocol. Greenhouse Gas Protocol. Available online: https://ghgprotocol.org (accessed on 14 December 2019).
  23. C40 Cities. Defining Carbon Neutrality for Cities & Managing Residual Emissions—Cities’ Perspective & Guidance. Available online: https://c40-production-images.s3.amazonaws.com/researches/images/76_Carbon_neutrality_guidance_for_cities_20190422.original.pdf?1555946416 (accessed on 14 December 2019).
  24. City of Helsinki. Hiilineutraali Helsinki 2035 -Toimenpideohjelma. Available online: https://www.hel.fi/static/liitteet/kaupunkiymparisto/julkaisut/julkaisut/HNH-2035-toimenpideohjelma.pdf (accessed on 17 December 2019).
  25. City of Espoo. Tavoitteena Hiilineutraali Espoo 2030. Available online: https://www.espoo.fi/fi-FI/Asuminen_ja_ymparisto/Kestava_kehitys/Ilmastotavoitteet (accessed on 17 December 2019).
  26. City of Vantaa. Hiilineutraali Vantaa 2030. Available online: https://www.vantaa.fi/asuminen_ja_ymparisto/ymparistopalvelut/resurssiviisas_vantaa/vantaan_ilmastotyo (accessed on 17 December 2019).
  27. City of Tampere. Ympäristöpolitiikka ja Ilmastotavoitteet. Available online: https://www.tampere.fi/asuminen-ja-ymparisto/ymparisto-ja-luonto/kestava-kehitys/ymparistopolitiikka-ja-ilmastotavoitteet.html (accessed on 17 December 2019).
  28. City of Turku. Hiilineutraali Turku. Available online: https://www.turku.fi/hiilineutraaliturku (accessed on 17 December 2019).
  29. City of Oulu. Kasvihuonekaasupäästöt Oulussa. Available online: https://www.ouka.fi/oulu/ilmasto/kasvihuonekaasupaastot (accessed on 17 December 2019).
  30. Finnish Government. Carbon Neutral Finland that Protects Biodiversity. Available online: https://valtioneuvosto.fi/en/rinne/government-programme/carbon-neutral-finland-that-protects-biodiversity (accessed on 17 December 2019).
  31. City of Vantaa. Vantaa in Brief. Available online: https://www.vantaa.fi/administration_and_economy/vantaa_information/vantaa_in_brief (accessed on 1 December 2019).
  32. City of Vantaa. Energy Consumption Statistics. Available online: https://www.vantaa.fi/hallinto_ja_talous/tietoa_vantaasta/tilastot_ja_tutkimukset/muut_tilastot_ja_tietokannat (accessed on 1 December 2019).
  33. Hiilineutraali Vantaa 2030 Selvitys Tarvittavista Lisätoimenpiteistä. Available online: https://www.vantaa.fi/instancedata/prime_product_julkaisu/vantaa/embeds/vantaawwwstructure/138291_Hiilineutraali_Vantaa_2030_-selvitys.pdf (accessed on 1 December 2019).
  34. Finnish Energy Industries. Statistics 2016. Available online: https://energia.fi/en/news_and_publications/statistics (accessed on 20 December 2019).
  35. Vantaan Energia. Annual Report 2016. Available online: https://s3-eu-west-1.amazonaws.com/vantaanenergia/uploads/20170419133222/VE-tilinpaatos-2016.pdf (accessed on 20 December 2019).
  36. Statistics Finland. Statistics 2016. Available online: https://www.stat.fi/til/salatuo/tau_en.html (accessed on 20 December 2019).
  37. City of Vantaa. Resurssiviisauden Tiekartta. Available online: https://www.vantaa.fi/instancedata/prime_product_julkaisu/vantaa/embeds/vantaawwwstructure/140089_ResurssiviisaudenTiekartta-18.6.2018-final.pdf (accessed on 17 December 2019).
  38. City of Vantaa. Maankäytön, Rakentamisen ja Ympäristön Toimialan Toteutussuunnitelma Vantaan Kaupungin Resurssiviisauden Tiekartan Tavoitteiden Toteuttamiseksi 2018–2021. Available online: https://www.vantaa.fi/instancedata/prime_product_julkaisu/vantaa/embeds/vantaawwwstructure/144821_ResurssiviisaudenTiekartta-Mato-19032019.pdf (accessed on 17 December 2019).
  39. Leech, B.L. Asking Questions: Techniques for Semistructured Interviews. Political Sci. Politics 2002, 35, 665–668. [Google Scholar] [CrossRef] [Green Version]
  40. Spradley, J.P. The Ethnographic Interview 1979; Holt, Rinehart and Winston: New York, NY, USA, 1979. [Google Scholar]
  41. McCracken, G. The Long Interview 1988; Sage: Newbury Park, CA, USA, 1988. [Google Scholar]
  42. Bartocci, P.; Zampilli, M.; Liberti, F.; Pistolesi, V.; Massoli, S.; Bidini, G.; Fantozzi, F. LCA analysis of food waste co-digestion. Sci. Total Environ. 2020, 709, 136187. [Google Scholar] [CrossRef] [PubMed]
  43. Huiru, Z.; Yunjun, Y.; Liberti, F.; Bartocci, P.; Fantozzi, F. Technical and economic feasibility analysis of an anaerobic digestion plant fed with canteen food waste. Energy Convers. Manag. 2019, 180, 938–948. [Google Scholar] [CrossRef]
Figure 1. Scope definition by GHG Protocol [22].
Sustainability 12 02445 g001
Figure 2. Research process.
Sustainability 12 02445 g002
Table 1. Carbon-neutral city GHG (greenhouse gas) scenarios.
kt CO2-ekv199020162030 BAU2030 CN1990 Change %
District heating27132518852−81
Oil-based heating7460480−100
Electricity-based heating60695217−72
Residential electricity16516014145−73
Transportation31838420797−69
Industry and machinery9542163−97
Waste disposal9135220−100
Agriculture3222−53
Total10761078674215−80
BAU = business as usual, CN = carbon neutral [33].
Table 2. Municipal energy system details in 2016 [33,34,35].
Electricity Production DetailsDH Production Specifications
Electricity consumption total (GWh)1913Number of CHPs3
Electricity consumption related GHG (kgCO2ekv)233,400Number of boilers6
CHP-based electricity production (GWh)634Net production (GWh)1875.8
CHP-based electricity production related GHG (gCO2ekv/kWh)262Heat delivery and losses (GWh)152.2
Co-owned centralized electricity production (GWh)777Boiler conversion losses (%)11.5
Co-owned centralized electricity production-related GHG (kgCO2ekv)0Fuels used for heat and CHP electricity production
Used Fuels
Light oil (GWh)0.4Coal (GWh)1199.1
Natural gas (GWh)559.7Municipal waste (GWh)1057.8
Table 3. National electricity system details in 2016 [36].
Electricity Supply 2016Total (TWh) (Used Fuels)
Hydro power15.63
Wind power3.07
Nuclear power22.28 (65.01)
Conventional thermal power25.19 (38.52)
Net imports18.95 (18.95)
Table 4. Interviewed process owners.
IntervieweeProcess OwnershipDepartmentInterview Session
Head of Environment CenterProcess owner of complete carbon-neutral city and environmentEnvironment Center2, 3
Environment managerSupporting the process owner of complete carbon-neutral city and environmentEnvironment Center2, 3
Head of City PlanningProcess owner of land use, buildings and environmentCity Planning3
Manager of Municipal Buildings CenterProcess owner of Municipal Buildings CenterMunicipal Building Center3
Head of City PlanProcess owner of city planCity Planning1
Head of Master PlanProcess owner of master planCity Planning1
Development personnel of local municipal energy companyProcess owners of municipal energy systemMunicipal energy company4
Table 5. Generated CNAP.
Required Carbon Neutrality Actions
Required Actions1. New buildings are 25% more energy efficient than what is required by law.2. Heated square meters per resident/worker will not increase in new buildings.3. The share of grid-supplied electricity for non-district heating buildings will be decreased to 40%. The remaining share will be produced by buildings-based renewable energy. Oil-based heating will be eliminated.4. Heating demand for building stock will decrease by 3% annually.5. Electricity consumption for non-heating purposes will be decreased by 50% per resident/worker.6. 20% of the remaining share of electricity consumption for non-heating purposes will be covered by own electrcity production.7. 20% of the distrcit heating will be provided from waste- and geothermal heat, 40% from biomass, and 40% from waste combustion. Oil, coal, natural gas, peat, and plastic waste will not be combusted.
Defined Processess and Process Owners
Process owner for direct process for the action Municipal district heating company (Vantaan Energia)
Direct process for the action Vantaan Energia increases the utilization of renewable energy and develops waste combustion.
Process owner for indirect process for the action Department of Building Control Department of City PlanningReal Estate Center and Environmental Center
Indirect process for the required action Department of Building Control guides constructors for efficient use of space. City Plan requirements support production of renewable energy.Renewable energy city assessment will be performed with the focus on geothemal and waste heat sources.
Process owner for indirect general process related to the actionEnvironmental Center, Information Center for Climate ActionsDepartment of City Planning Environmental Center, Information Center for Climate ActionsDepartment of City PlanningEnvironmental Center, Information Center for Climate ActionsDepartment of City PlanningEnvironmental Center, Information Center for Climate ActionsDepartment of City Planning
Indirect general process related to the action The service provided by the Information Center for Climate Actions will be marketed, utilized and steered actively. Its permormance monitoring and measuring will be developed.Climate impacts will be assessed in all the City plans where relevant. The service provided by the Information Center for Climate Actions will be marketed, utilized and steered actively. Its permormance monitoring and measuring will be developed.Climate impacts will be assessed in all the City plans, where relevant.The service provided by the Information Center for Climate Actions will be marketed, utilized and steered actively. Its permormance monitoring and measuring will be developed.Climate impacts will be assessed in all the City plans, where relevant.The service provided by the Information Center for Climate Actions will be marketed, utilized and steered actively. Its permormance monitoring and measuring will be developed.Climate impacts will be assessed in all the City plans, where relevant.
Table 6. Notifications for actions in CNAP.
  • New buildings are 25% more energy efficient than what is required by law.
Several interviewees stated that the City has a plan to implement requirements for low energy buildings in all City plans, which would make this action executable. However, it was confirmed that this is not yet an official plan, as understanding this action’s requirements will evolve over time.
2.
Heated square meters per resident or worker will not increase in new buildings.
Confirmed as it was presented. Not required, but a guiding action.
3.
The share of grid-supplied electricity for non-district heating buildings will be decreased to 40%. Remaining share will be produced by own renewable energy. Oil-based heating will be eliminated.
Plan includes direct requirements for City-owned buildings. For other buildings, guiding actions but no direct requirements are stated.
4.
Heating demand for building stock will decrease by 3% annually.
Confirmed as it was presented. Pointed out that it is really difficult to execute for general building stock.
5.
Electricity consumption for non-heating purposes will be decreased by 50% per resident or worker.
Confirmed as it was presented. Pointed out that it is really difficult to execute for general building stock.
6.
20 % of the remaining share of electricity consumption for non-heating purposes will be covered by building-based electricity production.
Confirmed as it was presented. Pointed out that it is really difficult to execute for general building stock. Guidance for distributed renewable energy production is planned.
7.
20 % of the district heating will be provided from waste heat, 40% from biomass, and 40% from waste combustion. Oil, coal, natural gas, peat, or plastic waste will not be combusted.
Interviewees in the City organization stated that the local energy company has committed to execute the action. However, a local energy company representative confirmed that there is no exact process for how to execute the action.

