Integrating Different Data Sources to Address Urban Security in Informal Areas. The Case Study of Kibera, Nairobi


Abstract
1. Background
- Large cities everywhere tend to have more crime and victimization than small cities.
- In every country homicide rates grow with the relative size of its cities.
- The rapid pace of urbanization and the resulting growth in city size and density is associated with increased street crime and violence but more so in developing countries than in developed countries.
- Violent and other street crime tends to concentrate in certain parts of the city (“hot-spot”) and neighbourhoods.
1.1. The Concept of Urban Security in Literature
1.2. The Role of Technology
1.3. The Application Context: The Slum of Kibera in Nairobi
2. Research Methodology
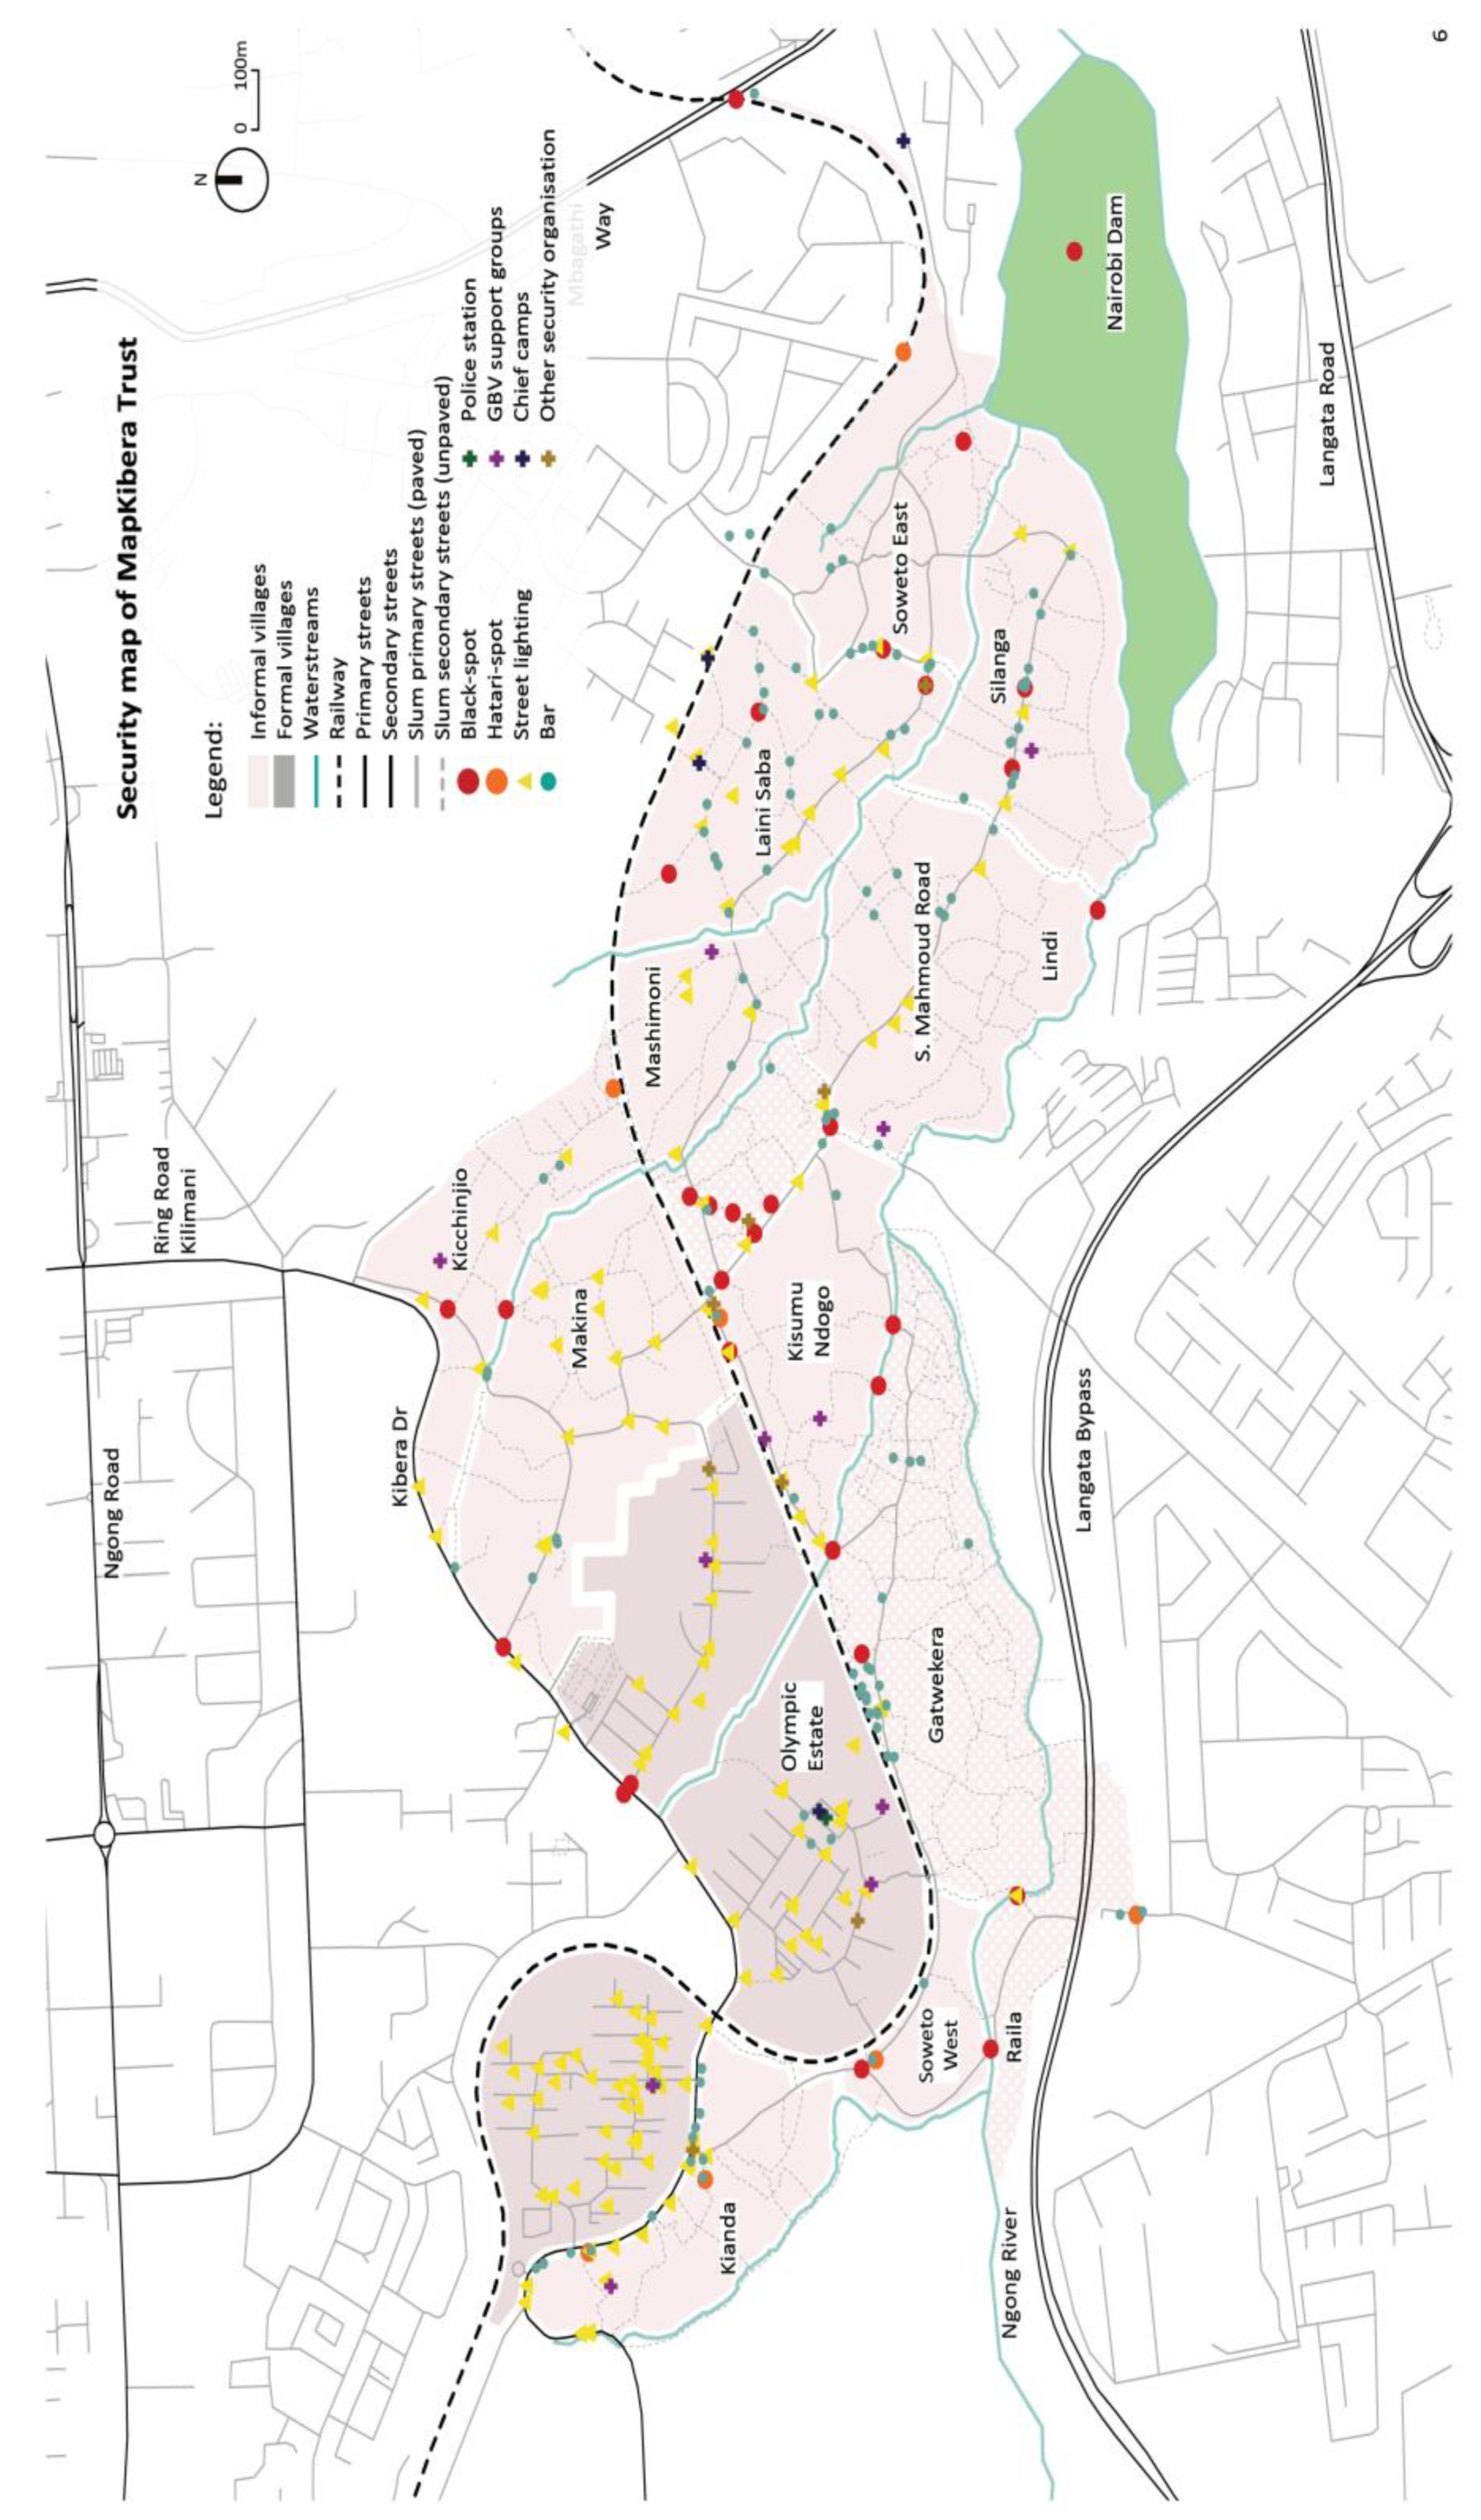
2.1. Participatory Mapping of MapKibera Trust
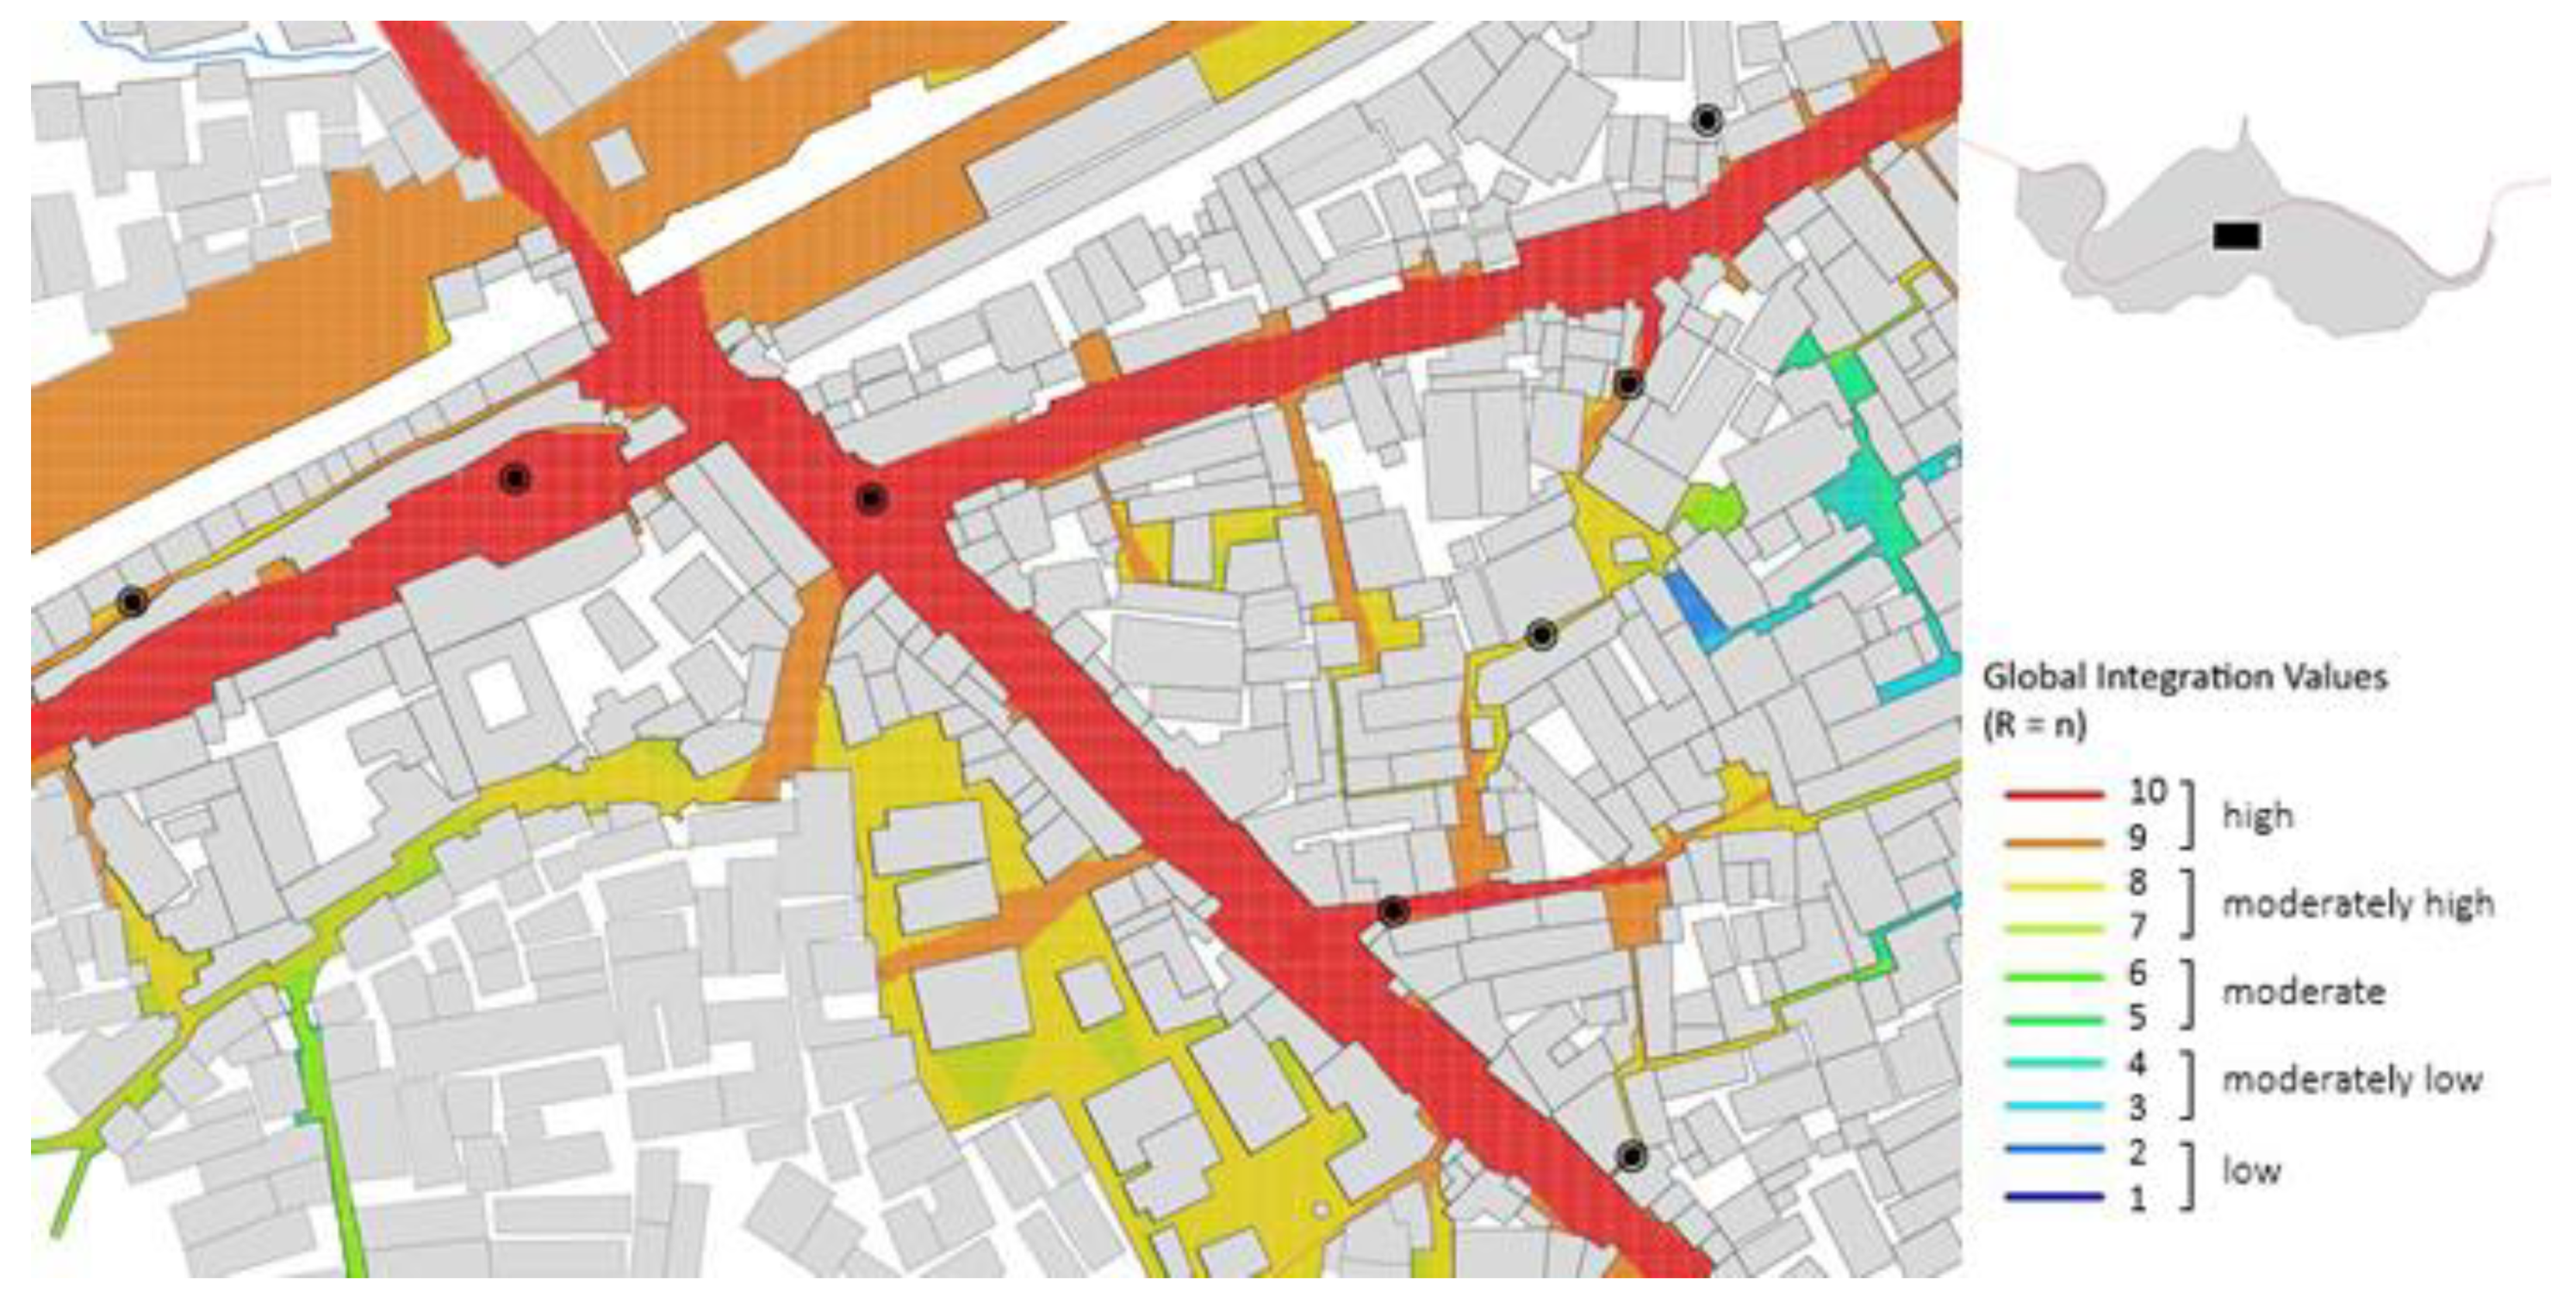
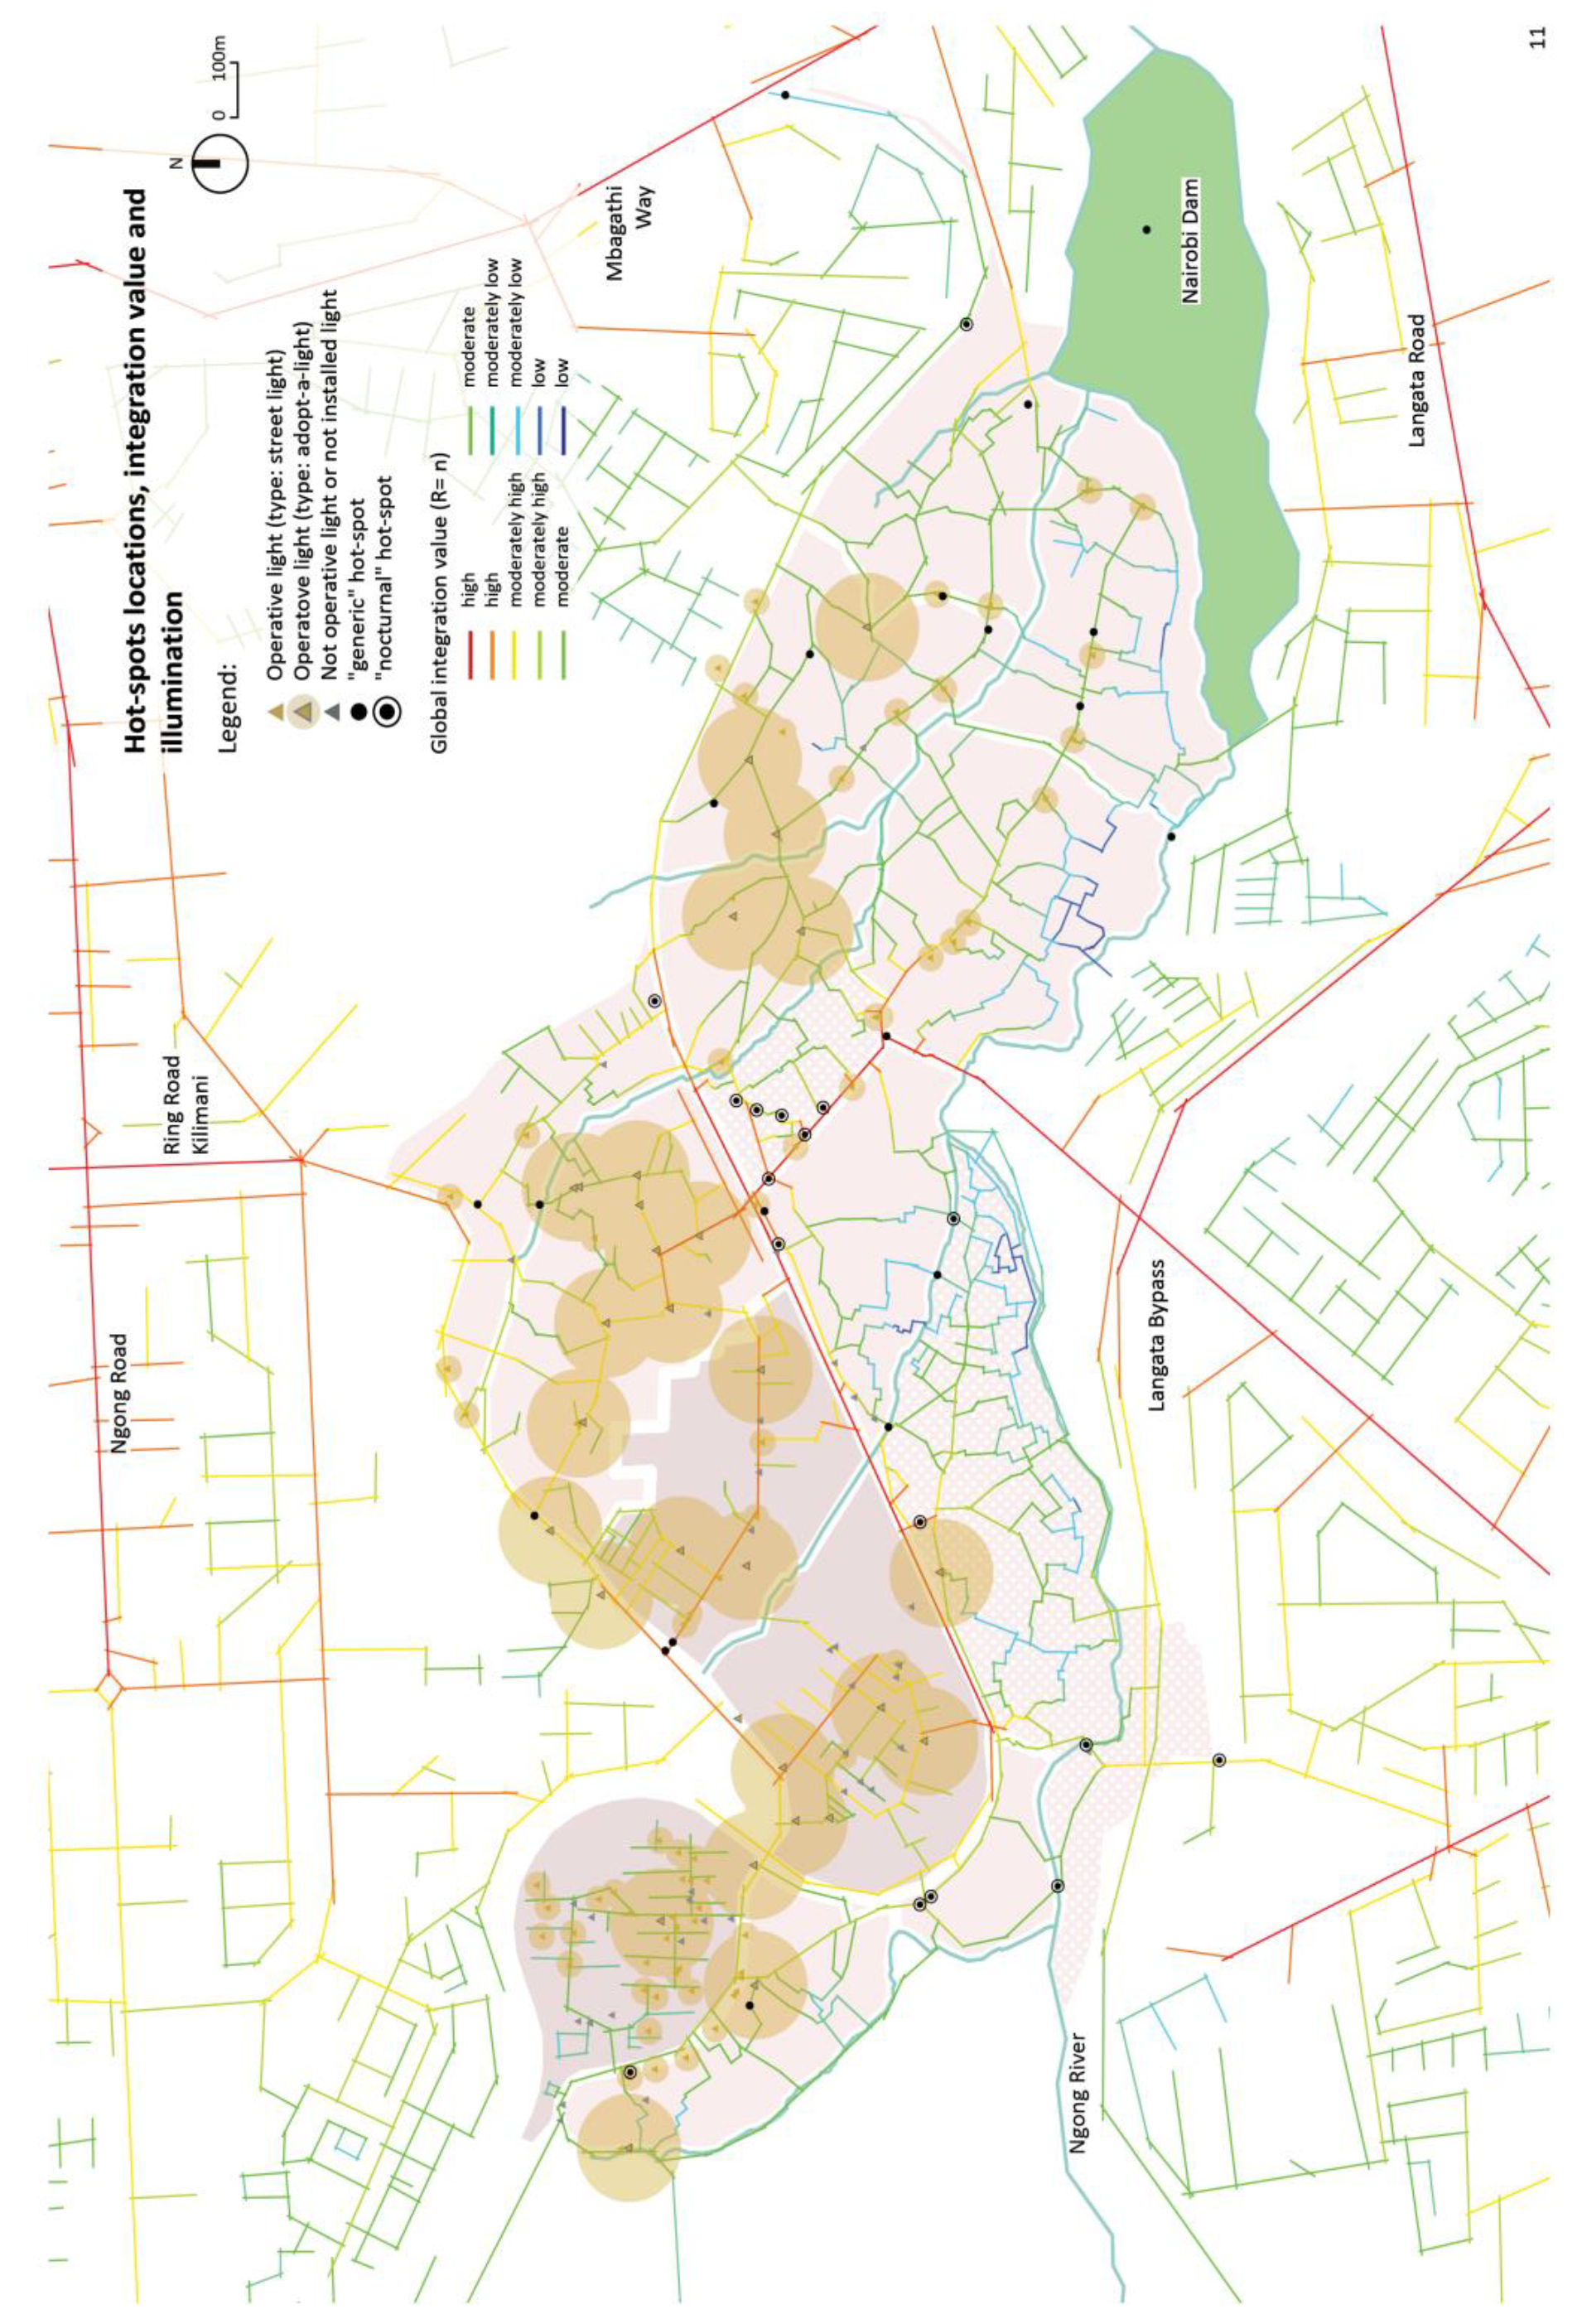
2.2. Space Syntax Analyses
3. Analysis
3.1. Territorial Analysis
3.2. Local Analysis
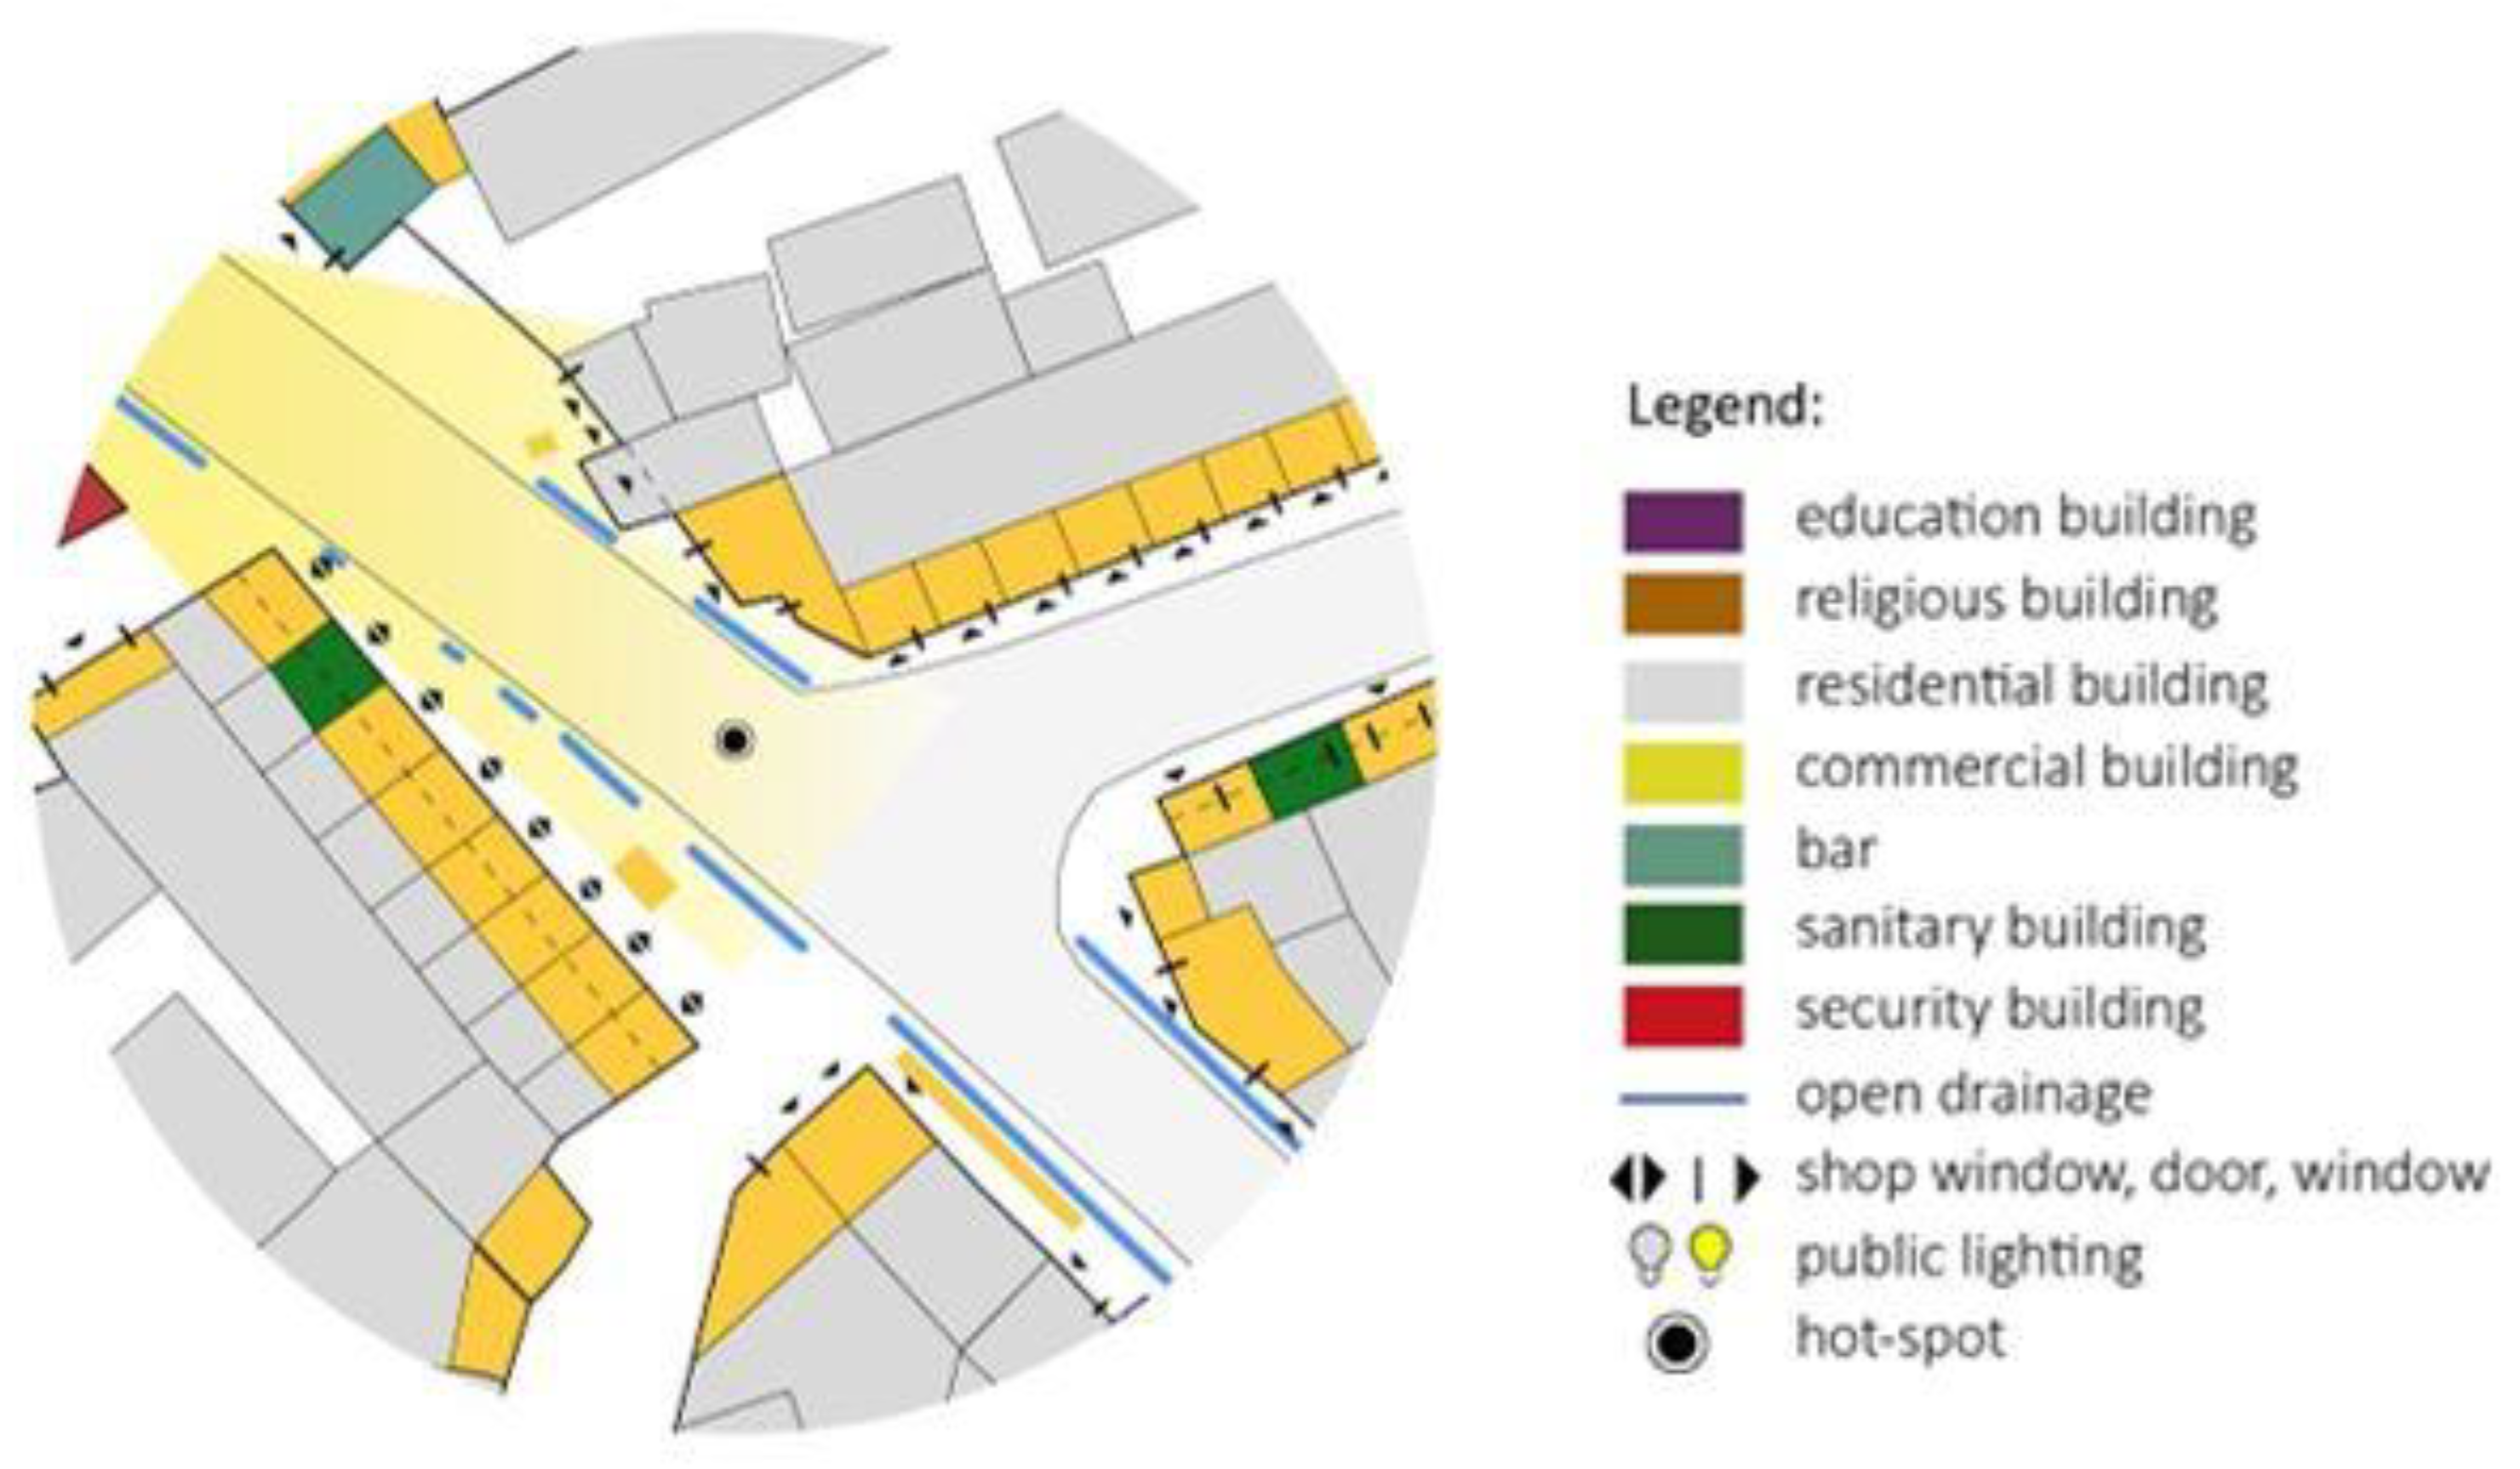
3.2.1. Hot-spot 1
3.2.2. Hot-Spot 2
4. Discussion and Conclusions
Author Contributions
Funding
Acknowledgments
Conflicts of Interest
References
- UNODC; UN-HABITAT. Crime Prevention Assessment Tool; United Nation Publication: Nairobi, Kenya, 2009. [Google Scholar]
- UNODC. Handbook on the United Nations Crime Prevention Guidelines: Making them Work; United Nation Publication: Nairobi, Kenya, 2010. [Google Scholar]
- Reso, S. Assessing Crime Prevention Progress and Making Crime Prevention Assessments from the United Nations Perspective. In Practical Approaches to Urban Crime Prevention, Proceedings of the Workshop at the 12th UN Congress on Crime Prevention and Criminal Justice, International Centre for the Prevention of Crime UNODC, Salvator, Brazil, 12–19 April 2010; United Nations Office on Drugs and Crime: Vienna, Austria, 2011. [Google Scholar]
- UN-Habitat. Habitat III issue papers 3—Safer cities. In Proceedings of the Habitat III, United Nations Conference on Housing and Sustainable Urban Development, Quito, Equador, 17–20 October 2016. [Google Scholar]
- EFUS. Security, Democracy and City—Co-Producing Urban Security Policies; Manifesto of the European Forum for Urban Security: Paris, France, 2018. [Google Scholar]
- UN-Habitat. Enhancing Urban Safety and Security, vol. I, II e III; United Nation Publication: Nairobi, Kenya, 2007. [Google Scholar]
- Jacobs, J. Vita e Morte Delle Grandi Città; Piccola Biblioteca Einaudi: Torino, Italy, 2001. [Google Scholar]
- Newman, O. Defensible Space, Crime Prevention through Environmental Design; Mac: New York, NY, USA, 1972. [Google Scholar]
- Ray Jeffrey, C. Crime Prevention through Environmental Design; Revised edition; SAGE Publications, Inc.: Beverly Hills, CA, USA, 1977. [Google Scholar]
- Brantingham, P.J.; Brantingham, P.L. Environmental Criminology; Waveland Press: Prospect Heights, IL, USA, 1991. [Google Scholar]
- Brantingham, P.J.; Brantingham, P.L. Crime Pattern Theory. Lecture at Institute for Canadian Urban Research Studies. 2018. Available online: https://www.scribd.com/document/86908463/Crime-Pattern-Theory (accessed on 10 February 2020).
- Cohen, L.E.; Felson, M. Social Change and Crime Rate Trends: A Routine Activity Approach. American Sociological Review, 588–608. 1979. Available online: https://www.jstor.org/stable/2094589 (accessed on 1 March 2020).
- Kelling, G.; Cole, C. Fixing Broken Windows: Restoring Order and Reducing Crime in Our Communities; Free Press: New York, NY, USA, 1997. [Google Scholar]
- Hillier, B. Space is the Machine; University College: London, UK, 2004; pp. 138–171. [Google Scholar]
- Friendly, M. The Life and Works of André-Michel Guerry (1802–1866); York University: Toronto, ON, Canada, 2007. [Google Scholar]
- Cho, J.T. Exploring the effects of CCTV upon fear of crime: A multi-level approach in Seoul. Int. J. Law Crime Justice 2017, 49, 35–45. [Google Scholar] [CrossRef]
- Fitzpatrick, A. Up in the Air. Applying the Jacobs Crowd Formula to Drone. In Proceedings of the Humanitarian Technology: Science, Systems and Global Impact, Cambridge, MA, USA, 12–14 May 2015. [Google Scholar]
- PredPol. Available online: https://www.predpol.com/ (accessed on 15 December 2018).
- Shotspotter. Available online: https://www.shotspotter.com/missions/ (accessed on 15 December 2018).
- The Problem of Predictive Policing. Available online: https://hrdag.org/usa/ (accessed on 15 December 2018).
- Predictive Crime Software. Available online: https://nova.ilsole24ore.com/esperienze/software-per-prevenire-il-crimine/ (accessed on 15 December 2018).
- Prison Policy Report. Available online: https://www.prisonpolicy.org/reports/rates.html (accessed on 15 December 2018).
- PredPol. Available online: https://www.focus.it/tecnologia/innovazione/predpol-il-softwareche-prevede-il-crimine-21012013-78554 (accessed on 15 December 2018).
- Whitzman, C. The effectiveness of women’s safety audits. Secur. J. 2009, 22, 205–218. [Google Scholar] [CrossRef]
- Kamau, H. Safety Audits, the Kenyian experience. In Proceedings of the First International Seminar on Women’s Safety—Making the Links, Montreal, QC, Canada, 9–11 May 2002. [Google Scholar]
- Hagan, M. Safe. Mathare A Mobile System for Women’s Safe. Commutes in the Slums. In Proceedings of the MobileHCI’12, San Francisco, CA, USA, 21–24 September 2012. [Google Scholar]
- UN-Habitat. Kenya Slum Upgrading Programme: Strategy Document; United Nation Publication: Nairobi, Kenya, 2003. [Google Scholar]
- De Filippi, F.; Coscia, C.; Boella, G.; Antonini, A.; Calafiore, A.; Cantini, A.; Guido, R.; Salaroglio, C.; Sanasi, L.; Schifanella, C. MiraMap: A We-Government Tool for Smart Peripheries in Smart Cities. IEE Access 2016, 4, 3824–3843. [Google Scholar] [CrossRef]
- De Filippi, F.; Coscia, C.; Guido, R. How Technologies Can Enhance Open Policy Making and Citizen-responsive Urban Planning. Int. J. E-Plan. Res. (IJEPR) 2017, 6, 23–42. [Google Scholar] [CrossRef]
- De Filippi, F.; Coscia, C.; Guido, R. Miramap: A collective awareness platform to support open policy making and the integration of the citizens’ perspective in urban planning and governance. In Technologies for Development; Hostettler, S., Najih Besson, S., Bolay, J.C., Eds.; Springer International Publishing: New York, NY, USA, 2017. [Google Scholar]
- Linking Perceptions of Safety to Infrastructural Upgrading in Informal Settlements. Available online: http://mappingnobigdeal.com/2017/01/07/linking-perceptions-of-safety-to-infrastructural-upgrading-in-informal-settlements/ (accessed on 28 June 2018).
- Ushaidi. Available online: https://www.ushahidi.com/ (accessed on 10 July 2018).
- Jiří Pánek. Mapping citizens’ emotions: Participatory planning support system in Olomouc, Czech Republic. J. Maps 2019, 15, 8–12. [Google Scholar] [CrossRef]
- Safetpin. Available online: http://safetipin.com/ (accessed on 22 July 2018).
- Fixmystreet. Available online: https://www.fixmystreet.com/ (accessed on 25 July 2018).
- De Filippi, F. Slum[e]scape: A Challenge for Sustainable Development Projects; Alinea: Firenze, Italy, 2009; pp. 10–34. [Google Scholar]
- UN-Habitat. The Challange of Slums; United Nation Publication: Nairobi, Kenya, 2003. [Google Scholar]
- Roberts, M.J. Conflict analysis of the 2007 post-election violence in Kenya. In Managing Conflicts in Africa’s Democratic Transitions; Lexington Books: Washington DC, USA, 2009. [Google Scholar]
- Elections Crimes and Offences in Kenya. Available online: https://crimeresearch.go.ke/election-crimes-and-offences-in-kenya/ (accessed on 3 November 2018).
- Safer Cities Programme; UN-Habitat. Crime in Nairobi Results of a City Wide Victim Survey; United Nation Publication: Nairobi, Kenya, 2002. [Google Scholar]
- Davis, M. The Planet of Slums, 3rd ed.; Verso: London, UK, 2016; pp. 10–56. [Google Scholar]
- Neuwirth, R. Shadow Cities: A Bilion Squatter, a Urban. New World; Fusi Orari: Roma, Italy, 2007. [Google Scholar]
- Rahbaran, S.; Herz, M. Nairobi Kenya, Migration Shaping the City, 1st ed.; Lars Muller Publishers: Basel, Switzerland, 2014; pp. 7–32. [Google Scholar]
- Marras, S. Mapping the Unmapped. Ph.D. Thesis, Department of Sociology and Social Research, University of Milan, Milan, Italy, 2010. [Google Scholar]
- Desgroppes, A.; Taupin, S. Kibera: The Biggest Slum in Africa? Les Cahiers d’Afrique de l’Est 2012, 44, 23–33. [Google Scholar]
- Uhuru Issues Title Deed to Kibra Nubians. Available online: https://www.nation.co.ke/news/Uhuru-issues-title-deed-to-Kibra-Nubians/1056-3953204-9jfwvk/index.html (accessed on 12 November 2018).
- Division or Development? Missing Link #12: A New Road through Kibera. Available online: http://blog.kounkuey.org/ (accessed on 11 August 2018).
- Annual Crime Report in Kenya, 2018. Available online: http://www.nationalpolice.go.ke/crime-statistics.html (accessed on 21 February 2020).
- Martinuzzi, C.; De Filippi, F.; Cocina, G.G. La sicurezza urbana a Kibera prima e dopo la costruzione del Missing Link #12: Integrazione della mappatura partecipativa di MapKibera Trust e delle analisi configurazionali di Space Syntax. Master’s Thesis, Department of Architecture and Design, Polytecnic of Turin, Turin, Italy, 2019. [Google Scholar]
- Silva, C.N. Citizen-Responsive Urban. E-Planning: Recent Developments and Critical Perspectives; IGI Global: Hershey, PA, USA, 2020. [Google Scholar] [CrossRef]
- Rzeszewski, M.; Kotus, J. Usability and usefulness of internet mapping platforms in participatory spatial planning. Appl. Geogr. 2019, 103, 56–69. [Google Scholar] [CrossRef]
- Armana, F.; Angelab, J. Mobile participation (mParticipation) in urban development: The experience of FlashPoll app in Berlin (Germany). Inf. Polity 2019, 24, 199–222. [Google Scholar]
- Rains, E.; Krishna, A.; Wibbels, E. Combining satellite and survey data to study Indian slums: Evidence on the range of conditions and implications for urban policy. Environ. Urban. 2018. [Google Scholar] [CrossRef]
- Falco, E.; Zambrano-Verratti, J.; Kleinhans, R. Web-based participatory mapping in informal settlements: The slums of Caracas, Venezuela. Habitat Int. 2019, 94, 102038. [Google Scholar] [CrossRef]
- Hagen, E. Mapping Change, community information empowerment in Kibera. In Innovations: Technology, Governance, Globalization; MIT Press: Cambridge, MA, USA, 2011; Volume 6, pp. 69–94. [Google Scholar]
- Goodchild, M. Citizens as Sensors: The world of Volunteered Geography. GeoJournal 2007, 69, 211–221. [Google Scholar] [CrossRef]
- Security Mapping. Available online: www.mapkiberatrust.org (accessed on 23 March 2018).
- Demartis, E. Geografie per la pace e la Cooperazione allo Sviluppo. Mappare e Prevenire le Violenze e i Disordini Post-Elettorali Negli slum di Nairobi: Un Progetto di ICT4D Partecipativo. Master’s Thesis, Department in Economy and Statistic, University of Torino, Torino, Italy, 2013. [Google Scholar]
- Gonzales, R.; Schofield, R.; Hart, S. Mapping Crime: Understanding Hot Spots. U.S. Department of Justice, Office of Justice Programs, National Institute of Justice, Special Report. Available online: www.ojp.usdoj.gov/nij (accessed on 23 February 2020).
- Hagen, E. Open Mapping from the Ground up: Learning from Map Kibera; Making All Voices Count Research Report; IDS: Brighton, UK, 2017. [Google Scholar]
- Hillier, B.; Hanson, J. The Social Logic of Space; Cambridge University Press: Cambridge, UK, 1984. [Google Scholar]
- Hillier, B.; Iida, S. Network and Psychological Effects in Urban. Movement. In COSIT 2005: Spatial Information Theory; Cohn, A.G., Mark, D.M., Eds.; Lecture Notes in Computer Science; Springer: Berlin/Heidelberg, Germany, 2005; Volume 3693. [Google Scholar]
- Cocina, G.G. Cultural needs in hospital humanization. In Proceedings of the Caumme III/PAUMME International Symposium “Migration and the Built Environment in the Mediterranean and the Middle Est”, Napoli, Italy, 24–26 November 2016; ISBN 978-886-975-154-7. [Google Scholar]
- Cocina, G.G. Responding to user cultural needs in hospitals with the support of Space Syntax Analysis. In Proceedings of the 11th International Space Syntax Symposium, Lisbon, Portugal, 3–7 July 2017. [Google Scholar]
- Setola, N. Percorsi, Flussi e Persone Nella Progettazione Ospedaliera. L’analisi Configurazionale, Teoria e Applicazione; Firenze University Press: Firenze, Italy, 2013. [Google Scholar]
- Hillier, B. Can. streets be made safe? Urban Des. Int. 2004, 9, 31–45. [Google Scholar] [CrossRef]
- Slum Lighting Initiative of Adopt-a-light Limited. Available online: http://www.adopt-a-light.com/about_us.php (accessed on 21 August 2018).
- The Steadman Group. An Evaluation of the Lighting Initiative in Nairobi Slums; Steadman Group: Nairobi, Kenya, 2006. [Google Scholar]
- Tarkhanyan, L. Drug crime and the urban Mosaic: The location choice of drug crime in relation to high streets, bars, schools and hospitals. In 9th International Space Syntax Symposium; University College London: London, UK, 2013. [Google Scholar]
- Mitra, S.; Mulligan, J.; Schilling, J.; Harper, J.; Vivekananda, J.; Krause, L. Developing risk or resilience? Effects of slum upgrading on the social contract and social cohesion in Kibera, Nairobi. Environ. Urban. 2017, 29, 103–122. [Google Scholar] [CrossRef]
- UN-Habitat. Building Urban Safety through Slum Upgrading; United Nation Publication: Nairobi, Kenya, 2011. [Google Scholar]
- Dzamydiene, D.; Rudzkiene, V. Multiple Regression Analysis in Crime Pattern Warehouse for Decision Support. In Database and Expert Systems Applications: 13th International Conference, DEXA 2002, Aix-en-Provence, France, 2–6 September 2002; Springer: Berlin/Heidelberg, Germany, 2003; pp. 249–258. [Google Scholar]
- Hillier, B.; Sahbaz, O. An. Evidence Based Approach to Crime and Urban Design or, Can We Have Vitality, Sustainability and Security all at once? Bartlett School of Graduate Studies: London, UK, 2008. [Google Scholar]
- Hillier, B.; Sahbaz, O. High. Resolution Analysis of Crime Patterns in Urban. Street Networks: An Initial Statistical Sketch from an Ongoing Study of a London Borough; University College: London, UK, 2005. [Google Scholar]
- Lee, S.; Ha, M. The Duality of Visibility: Does Visibility Increase or Decrease the Fear of Crime in Schools’ Exterior Environments? Yonsey University: Seul, Korea, 2014. [Google Scholar]
- Ratti, C. Urban. texture and space syntax: Some inconsistencies. Environ. Plann. B Plan. Des. 2004, 31, 487–499. [Google Scholar] [CrossRef]
- Seamon, D. A Life of the Place: A Phenomenological Commentary on Bill Hillier’s Theory of Space Syntax. Nordic J. Acad. Res. 1994, 7, 1. [Google Scholar]


| Parameter | Theoretical Principles | Tangible Application |
|---|---|---|
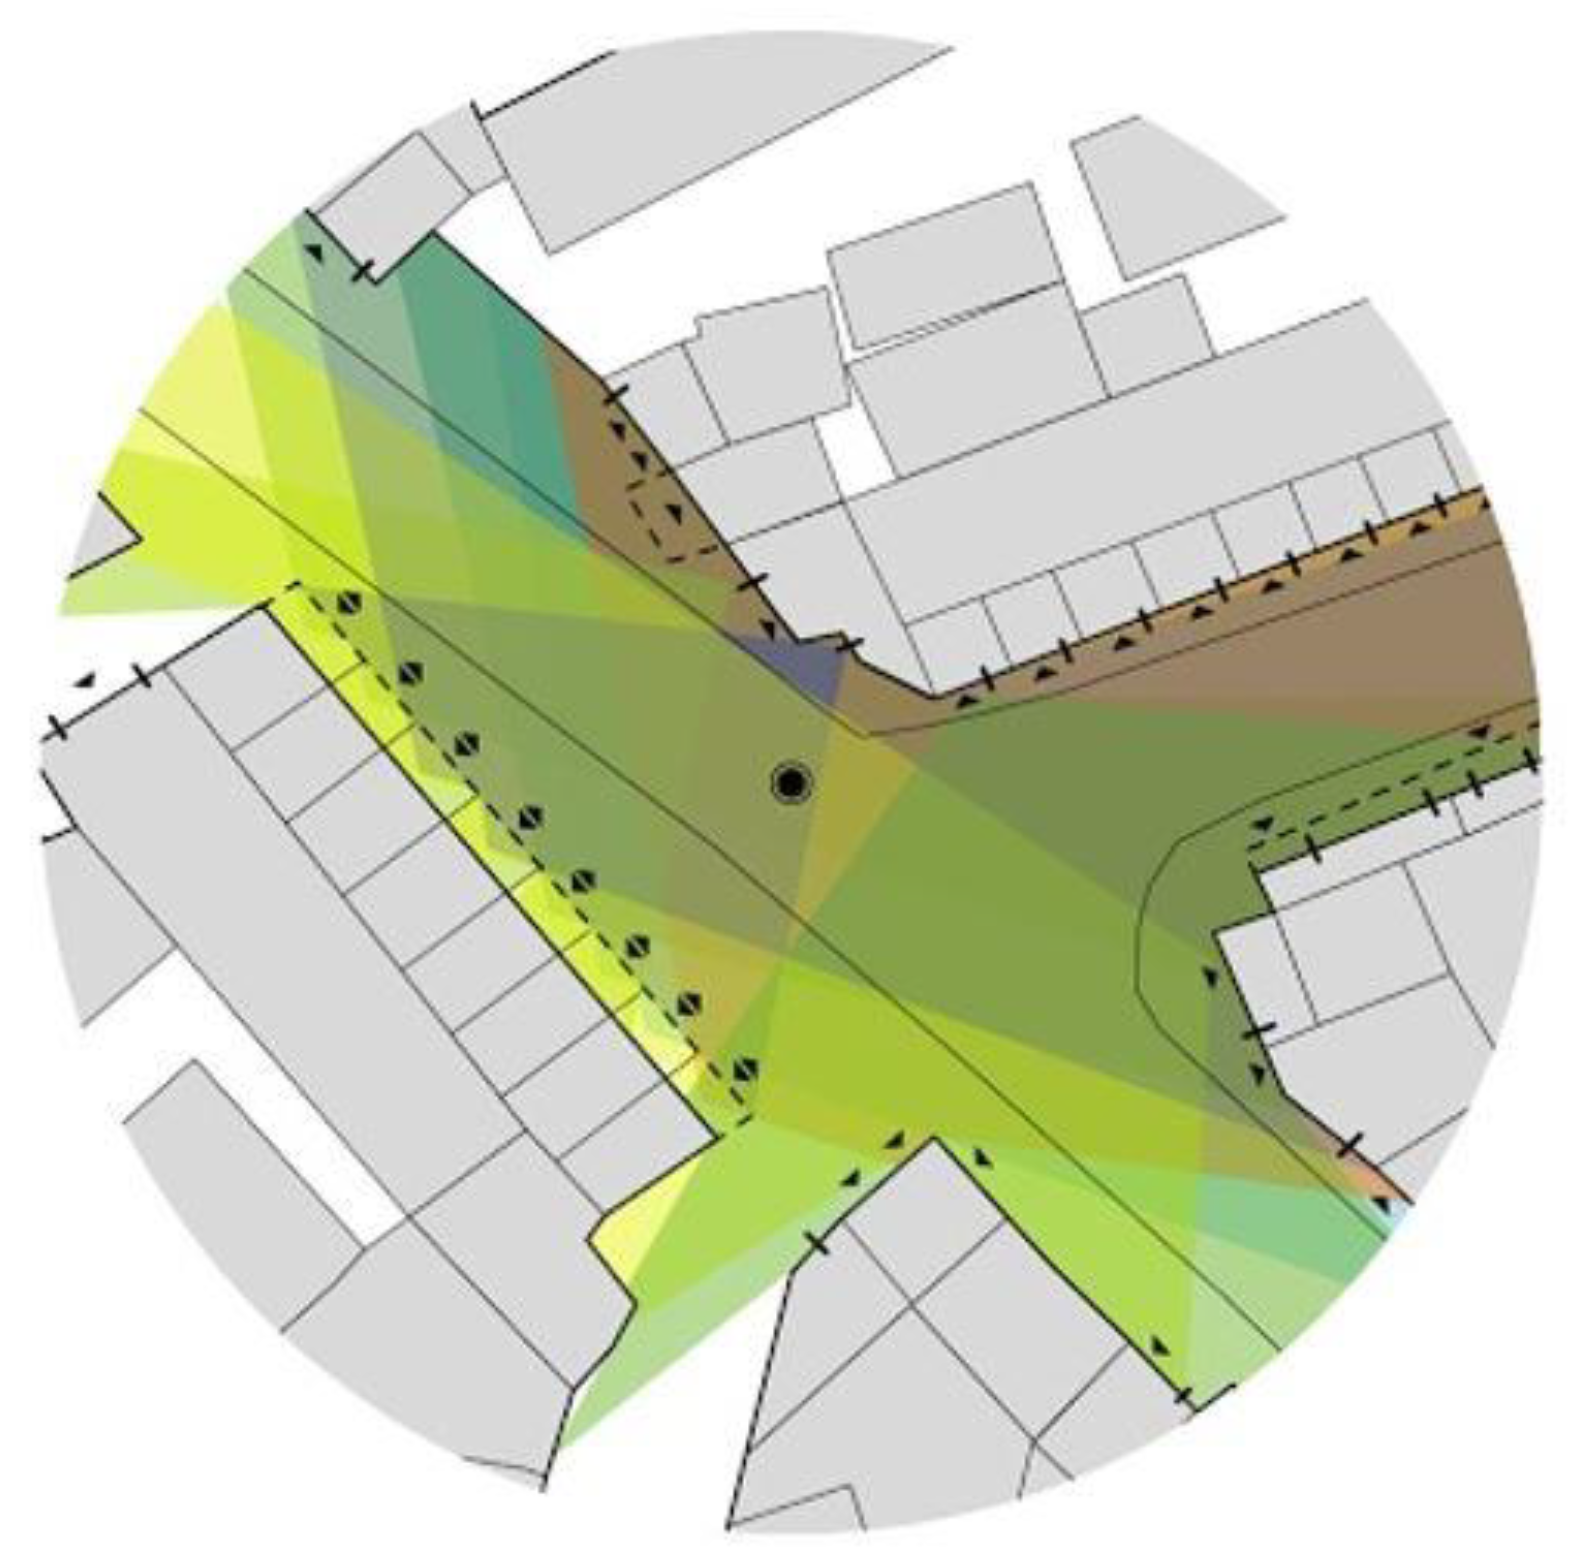
| Integration [7,12,14] | The integration value describes the movement potential of a public space within a spatial configuration. A high integration value represents high flow of people and thus good level of natural surveillance. | The integration value of hot-spot street segments is analysed to verify the relation between movement potential and crime occurrence. |
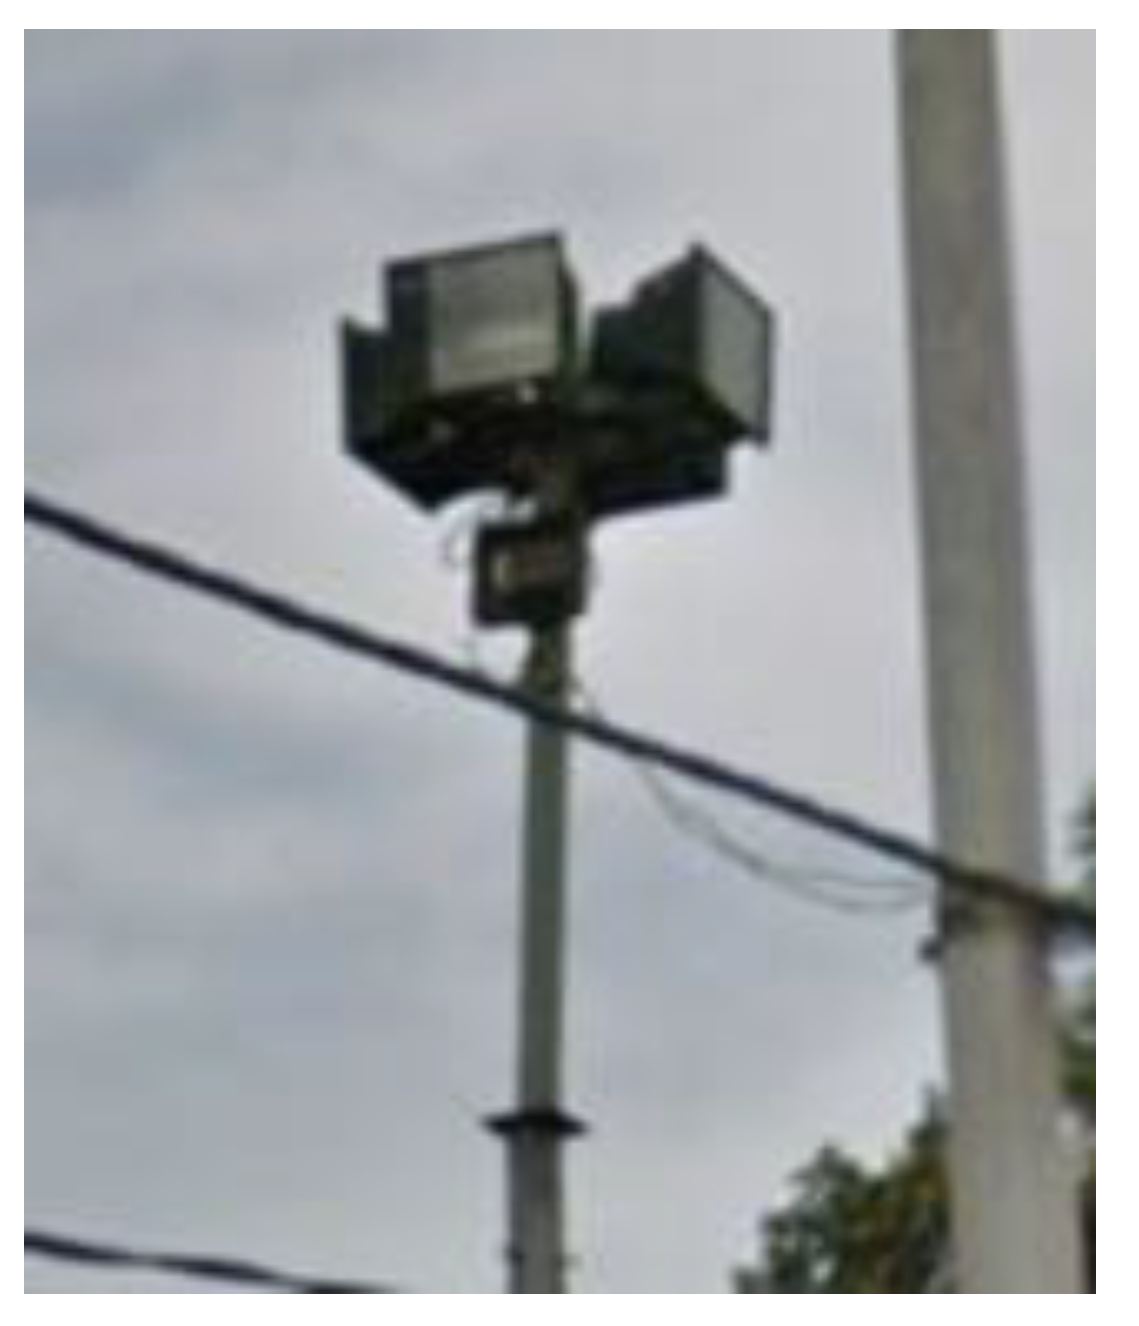
| Illumination [6,7,8,9] | A good level of illumination ensures safety and security during the night. | The illuminated area within the public spaces is drawn, considering the typology and the height of the street lighting system. Then, the hot-spot location in relation with this area is analysed. |
| Vitality and diversity [6,7,8,9,10,11,12] | A vibrant and multifunctional environment ensures the presence of a continuous and diverse group of people surveilling the space and limiting antisocial behaviour throughout the day. | The number and the variety of nonresidential use within a certain radius of distance from the hot-spot, to verify whether crimes mainly occur close to specific activities. |
| Visibility [6,7,8,9] | The visibility of a public space depends on the building configuration, the street section and the urban furniture. The higher is the visibility, the better the natural surveillance. | The public spaces with high visibility are identified as safe spaces and thus where people mainly move. The visual distance (Step Depth Analysis with Space Syntax) between these and the hot-spot is analysed to understand whether criminals act in visually connected area or not. |
| Active facades [6,7,8,9] | The building facades provide natural surveillance, due to the visual connection of indoor and outdoor spaces through windows, doors and any building openings. | Each building opening facing a hot-spot is identified and classified in terms of dimensions and material (solid, transparent). Then, the isovist analysis (with Space Syntax) verifies the surveillance potential of each opening. This allows us to verify whether the presence of building openings discourage crime occurrence or not. |
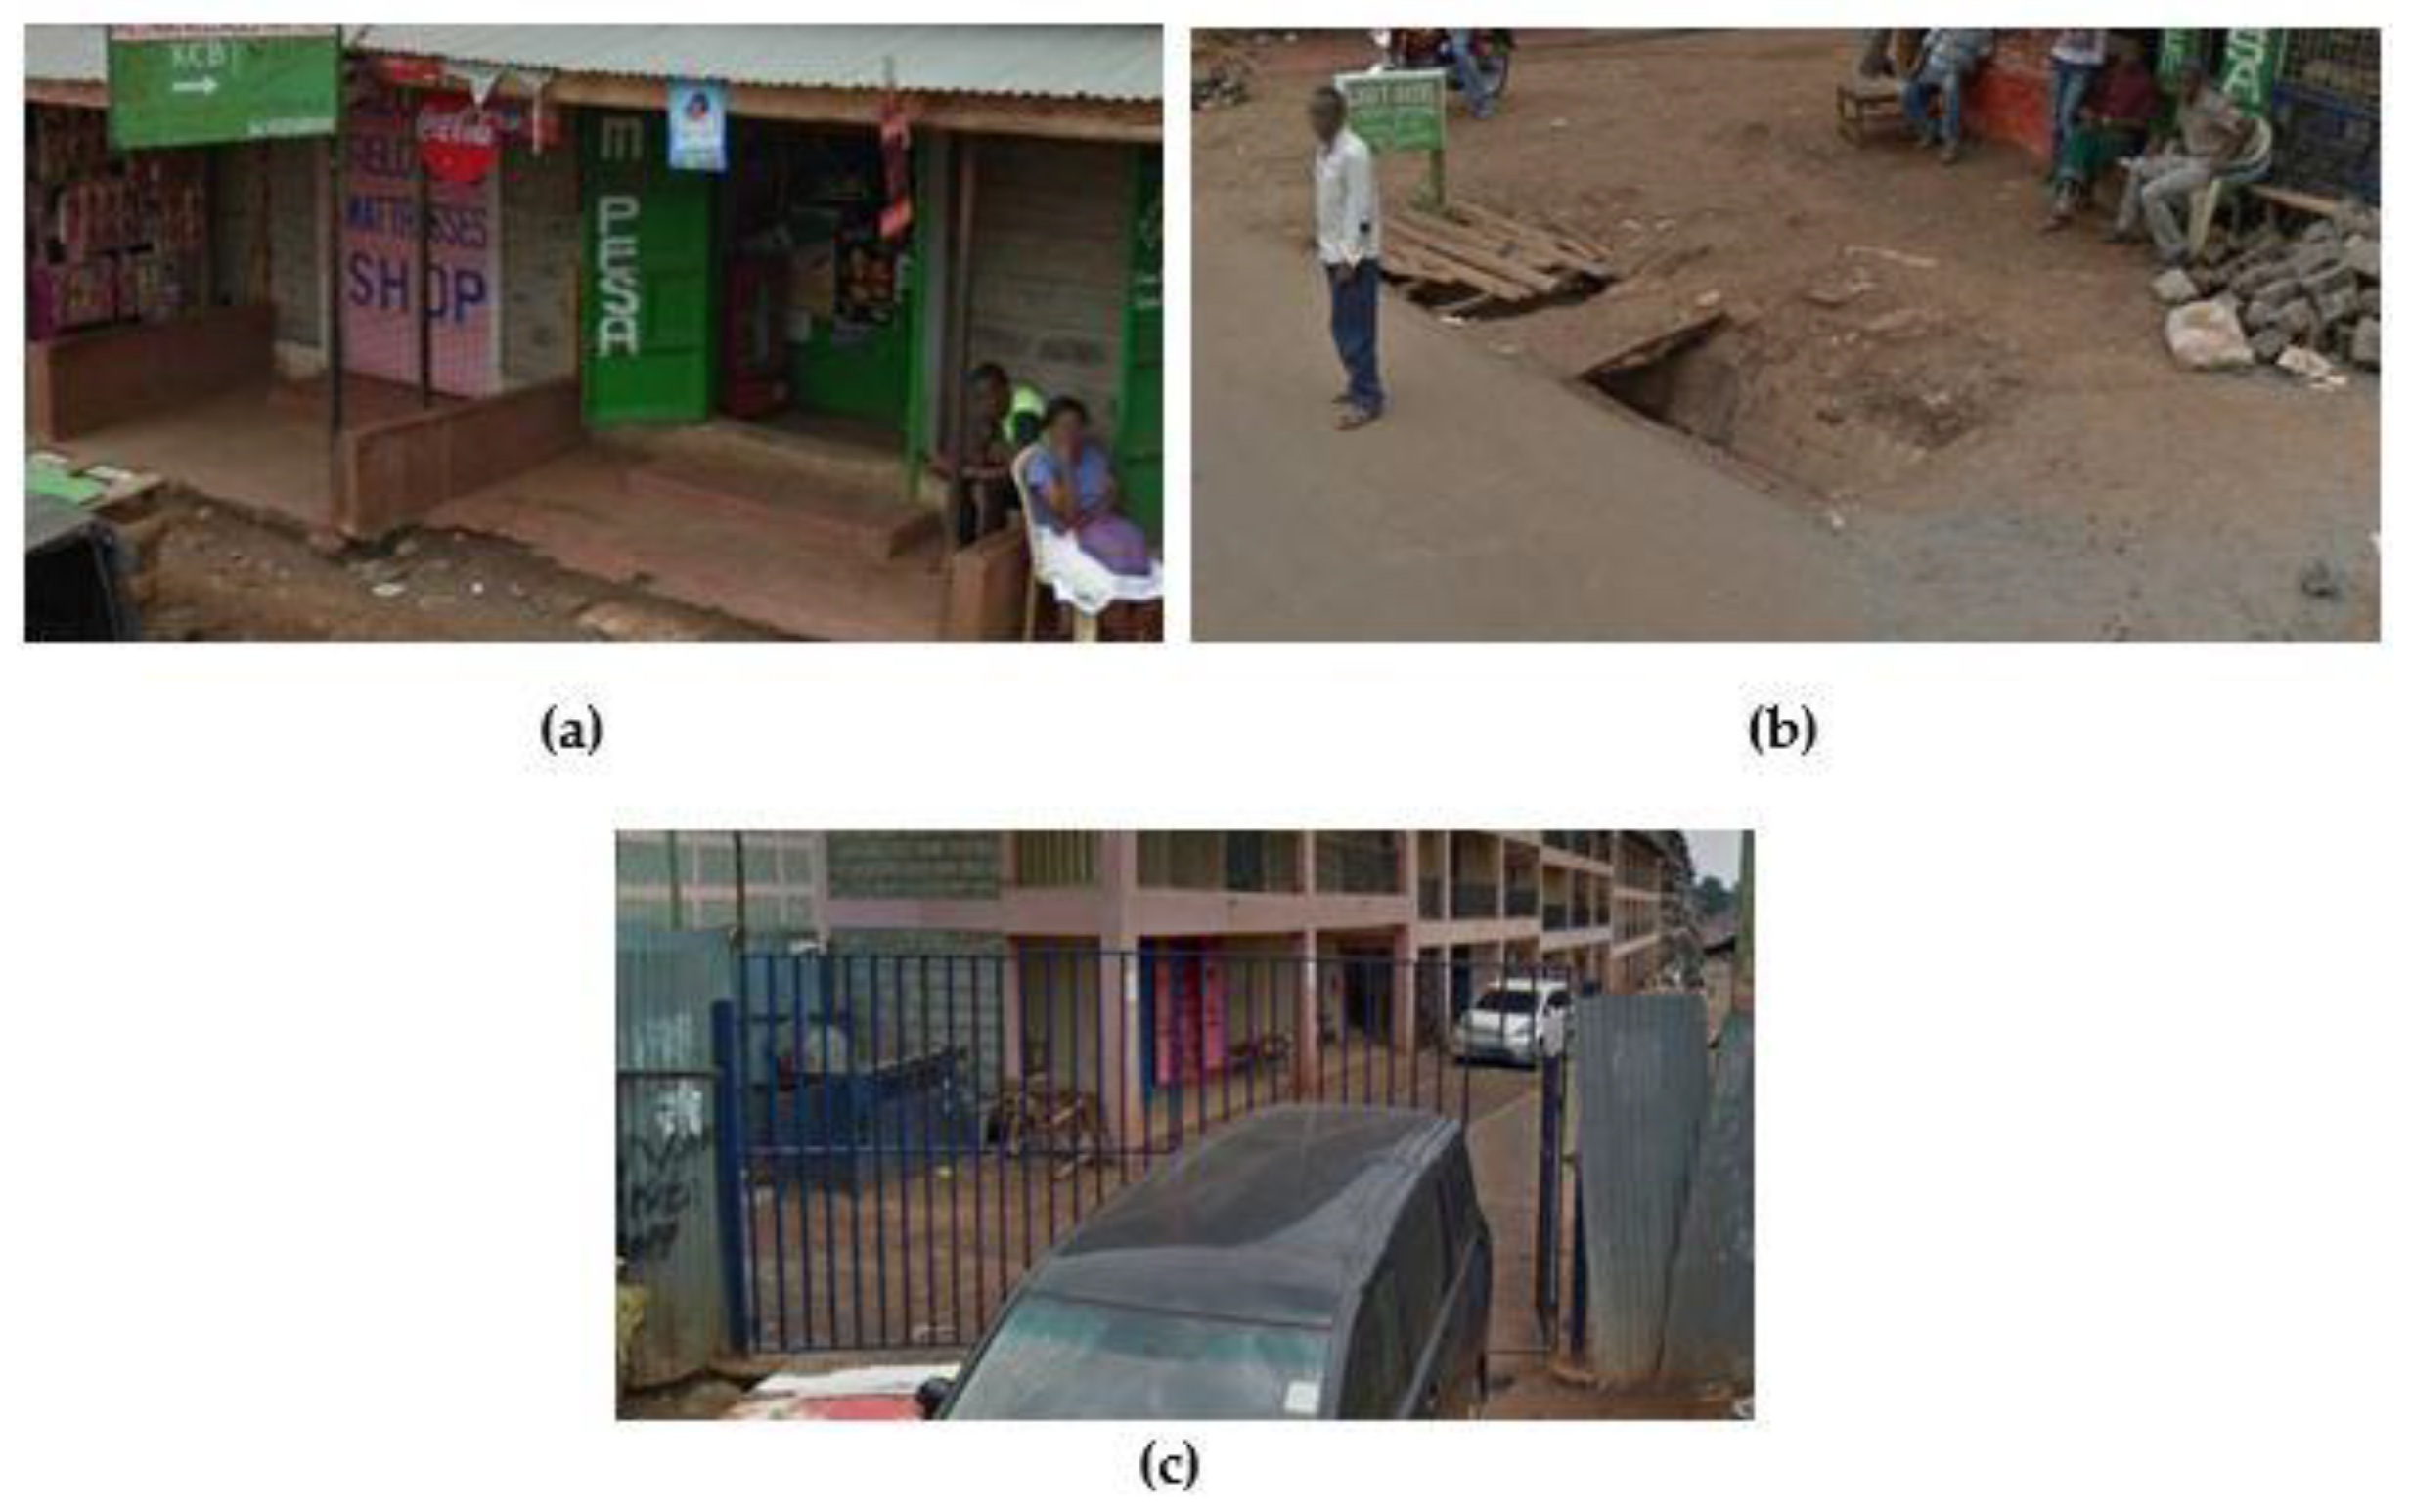
| Territoriality [8,9,10,11,13] | The building thresholds between private and public area enable inhabitants to appropriate public space segments and increase surveillance of the surrounding space. | Intentional and unintentional elements that generate thresholds (urban furniture, vegetation, fences, drainage lines) between private and public space are analysed to understand whether crime occurrence is discouraged or not. |
| Maintenance and stigma [6,8,9,13] | Good level of maintenance managed by authorities or citizens increases community identification with its own neighborhood and thus its interest in taking care of the public space and surveilling it. | The conversation condition of building and pavements around the hot-spot is analysed to define linkages between crime occurrence and level of maintenance. |
© 2020 by the authors. Licensee MDPI, Basel, Switzerland. This article is an open access article distributed under the terms and conditions of the Creative Commons Attribution (CC BY) license (http://creativecommons.org/licenses/by/4.0/).
Share and Cite
De Filippi, F.; Cocina, G.G.; Martinuzzi, C. Integrating Different Data Sources to Address Urban Security in Informal Areas. The Case Study of Kibera, Nairobi. Sustainability 2020, 12, 2437. https://doi.org/10.3390/su12062437
De Filippi F, Cocina GG, Martinuzzi C. Integrating Different Data Sources to Address Urban Security in Informal Areas. The Case Study of Kibera, Nairobi. Sustainability. 2020; 12(6):2437. https://doi.org/10.3390/su12062437
Chicago/Turabian StyleDe Filippi, Francesca, Grazia Giulia Cocina, and Chiara Martinuzzi. 2020. "Integrating Different Data Sources to Address Urban Security in Informal Areas. The Case Study of Kibera, Nairobi" Sustainability 12, no. 6: 2437. https://doi.org/10.3390/su12062437
APA StyleDe Filippi, F., Cocina, G. G., & Martinuzzi, C. (2020). Integrating Different Data Sources to Address Urban Security in Informal Areas. The Case Study of Kibera, Nairobi. Sustainability, 12(6), 2437. https://doi.org/10.3390/su12062437