Article

Responses of Bacterial Community, Root-Soil Interaction and Tomato Yield to Different Practices in Subsurface Drip Irrigation

1
College of Resources and Environment, Shanxi University of Finance and Economics, Taiyuan 030006, China
2
Institute of Soil and Water Conservation, Northwest A&F University, Yangling 712100, China
3
Institute of Soil and Water Conservation, CAS & MWR, Yangling 712100, China
*
Authors to whom correspondence should be addressed.
Sustainability 2020, 12(6), 2338; https://doi.org/10.3390/su12062338
Submission received: 14 January 2020 / Revised: 6 March 2020 / Accepted: 11 March 2020 / Published: 17 March 2020
(This article belongs to the Section Sustainable Agriculture)

Abstract

:
The objective of this study was to reveal the regulatory mechanisms underlying the soil bacterial community of subsurface drip irrigation (SDI). The effect of different buried depths of drip tape (0, 10, 20, 30 cm) on the soil bacterial community in a tomato root-zone was investigated using high-throughput technology. Furthermore, the mutual effects of root growth, tomato yield and soil bacterial community were also analyzed to explore the response of root-soil interaction to the buried depth of drip tape. The results indicated that SDI (i.e., 10, 20 and 30 cm buried depths of drip tape) changed the soil bacterial community structure compared to surface drip irrigation (a 0 cm buried depth of drip tape). SDI with a 10 cm buried depth of drip tape significantly reduced the relative abundances of Proteobacteria, Chloroflexi, Gemmatimonadetes, Acidobacteria, Firmicutes and Planctomycetes, but significantly increased the relative abundances of Actinobacteria, Candidate_division_TM7 and Bacteroidetes. SDI of 20 and 30 cm buried depth significantly decreased the relative abundances of Roteobacteri, Actinobacteria and Planctomycetes, however, increased the relative abundances of Chloroflexi, Gemmatimonadetes, Acidobacteria, Firmicutes, Candidate_division_TM7 and especially some trace bacteria (for example Nitrospirae). Furthermore, under 20 cm or 30 cm of buried depth, the abundances of nitrogen metabolism and phosphonate and phosphinate metabolism based on the PICRUSt (Reconstruction of Unobserved States) method were significantly improved as well as soil porosity and root forks at 0-10 cm. These changes strengthened root-soil interaction and improved tomato yield per plant by 22.47% and 19.38% under 20 cm and 30 cm of buried depth, respectively, compared to surface drip irrigation. Therefore, the responses of bacterial community and root-soil interaction to drip tape buried depth of 20 cm and 30 cm are proven to be beneficial for the increasing of tomato production.

1. Introduction

In cropping systems, soil microorganisms provide the inner driving force for soil nutrient decomposition and transformation [1]. The composition and dynamic variation of a soil microbial community can immediately respond to the status of soil moisture, pH, temperature and nutrients, and this has been used as an effective indicator to evaluate soil quality and health [2]. Furthermore, soil microbial community composition and changes can reflect crops growth and soil nutrient circulation situations [3]. More than 80% of the soil microorganisms inhabit the soil microdomain in a stable aggregate [4] such as soil aggregate, fertilizer microdomain and crop rhizosphere [5]. Consequently, the soil microbial community is closely related to a microdomain environment within the rhizosphere. The interaction between rhizosphere factors (such as soil moisture, heat and crop roots) and soil microorganisms finally regulates soil nutrients uptake through crop and crop growth [3]. Nevertheless, soil moisture in the root-zone is the basic but important restrictive factor affecting the rhizosphere environment and crop growth under certain soil matrix and production conditions, especially for greenhouse production in arid areas.
SDI (subsurface drip irrigation) is an efficient water-saving irrigation technique and can create a beneficial rhizosphere environment for the healthy growth of crops [6]. In addition, it has been widely used in agricultural production, especially in greenhouses. Soil moisture transfer and distribution in SDI differentiate markedly from in surface drip irrigation [7]. Moreover, soil moisture distribution can significantly affect soil nutrients, pH and temperature in the rhizosphere [8], thereby affecting soil microbial community, the interaction of root growth and rhizosphere environment, and crop growth and yield. At present, a lot of studies on SDI have concentrated on the effects of different irrigation amounts, drip tape buried depths and the integration of fertilizer into water on field soil physical and chemical properties, crop growth and yield [9,10]. However, there are few studies on soil microbial community changes, and far fewer studies on the response of crop growth and yields to soil microbial community change. In addition, soil nitrogen and phosphorus metabolism are important factors influencing crop growth, but the effect of SDI on soil microbes related to nitrogen and phosphorus metabolism still needs to be studied in depth.
Bacteria has the largest role in soil microbes. Some bacteria strains have a much better stimulatory effect on plant growth and nitrogen and phosphorus uptake by crop [11]. A further assumption is that SDI could improve crop yields by regulating bacterial community and root-soil interaction, however, this has not been well addressed. In this study, the effect of SDI on bacterial community and especially on variations of bacteria related to nitrogen and phosphorus metabolism were studied. In addition, the interaction between the changes of soil bacterial community and the root growth and production of tomato was analyzed. In this study, we believe that the accurate and comprehensive evaluation on soil bacterial communities changes underlying SDI could provide a reference for arranging various agronomic measures and improving soil and water use efficiency in agriculture.

2. Materials and Methods

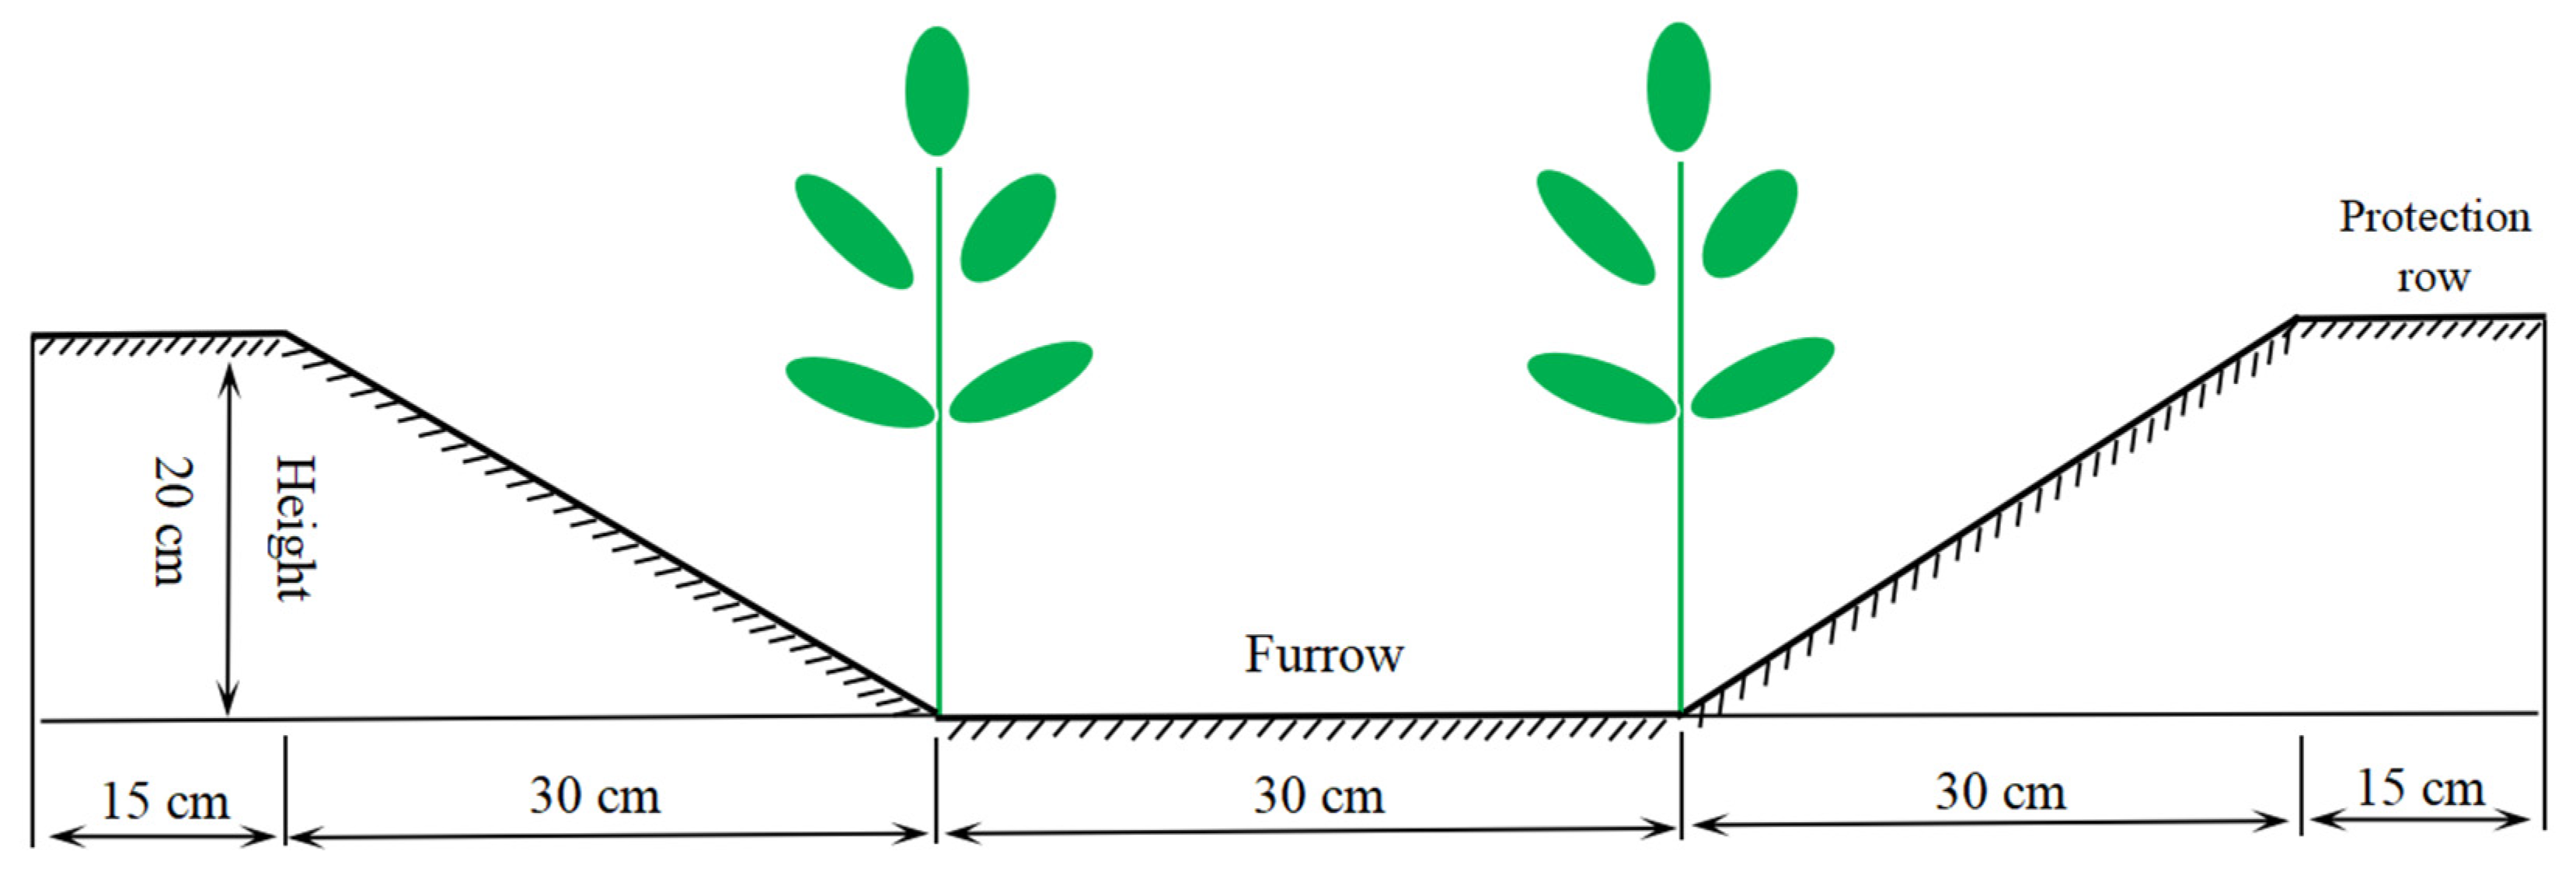
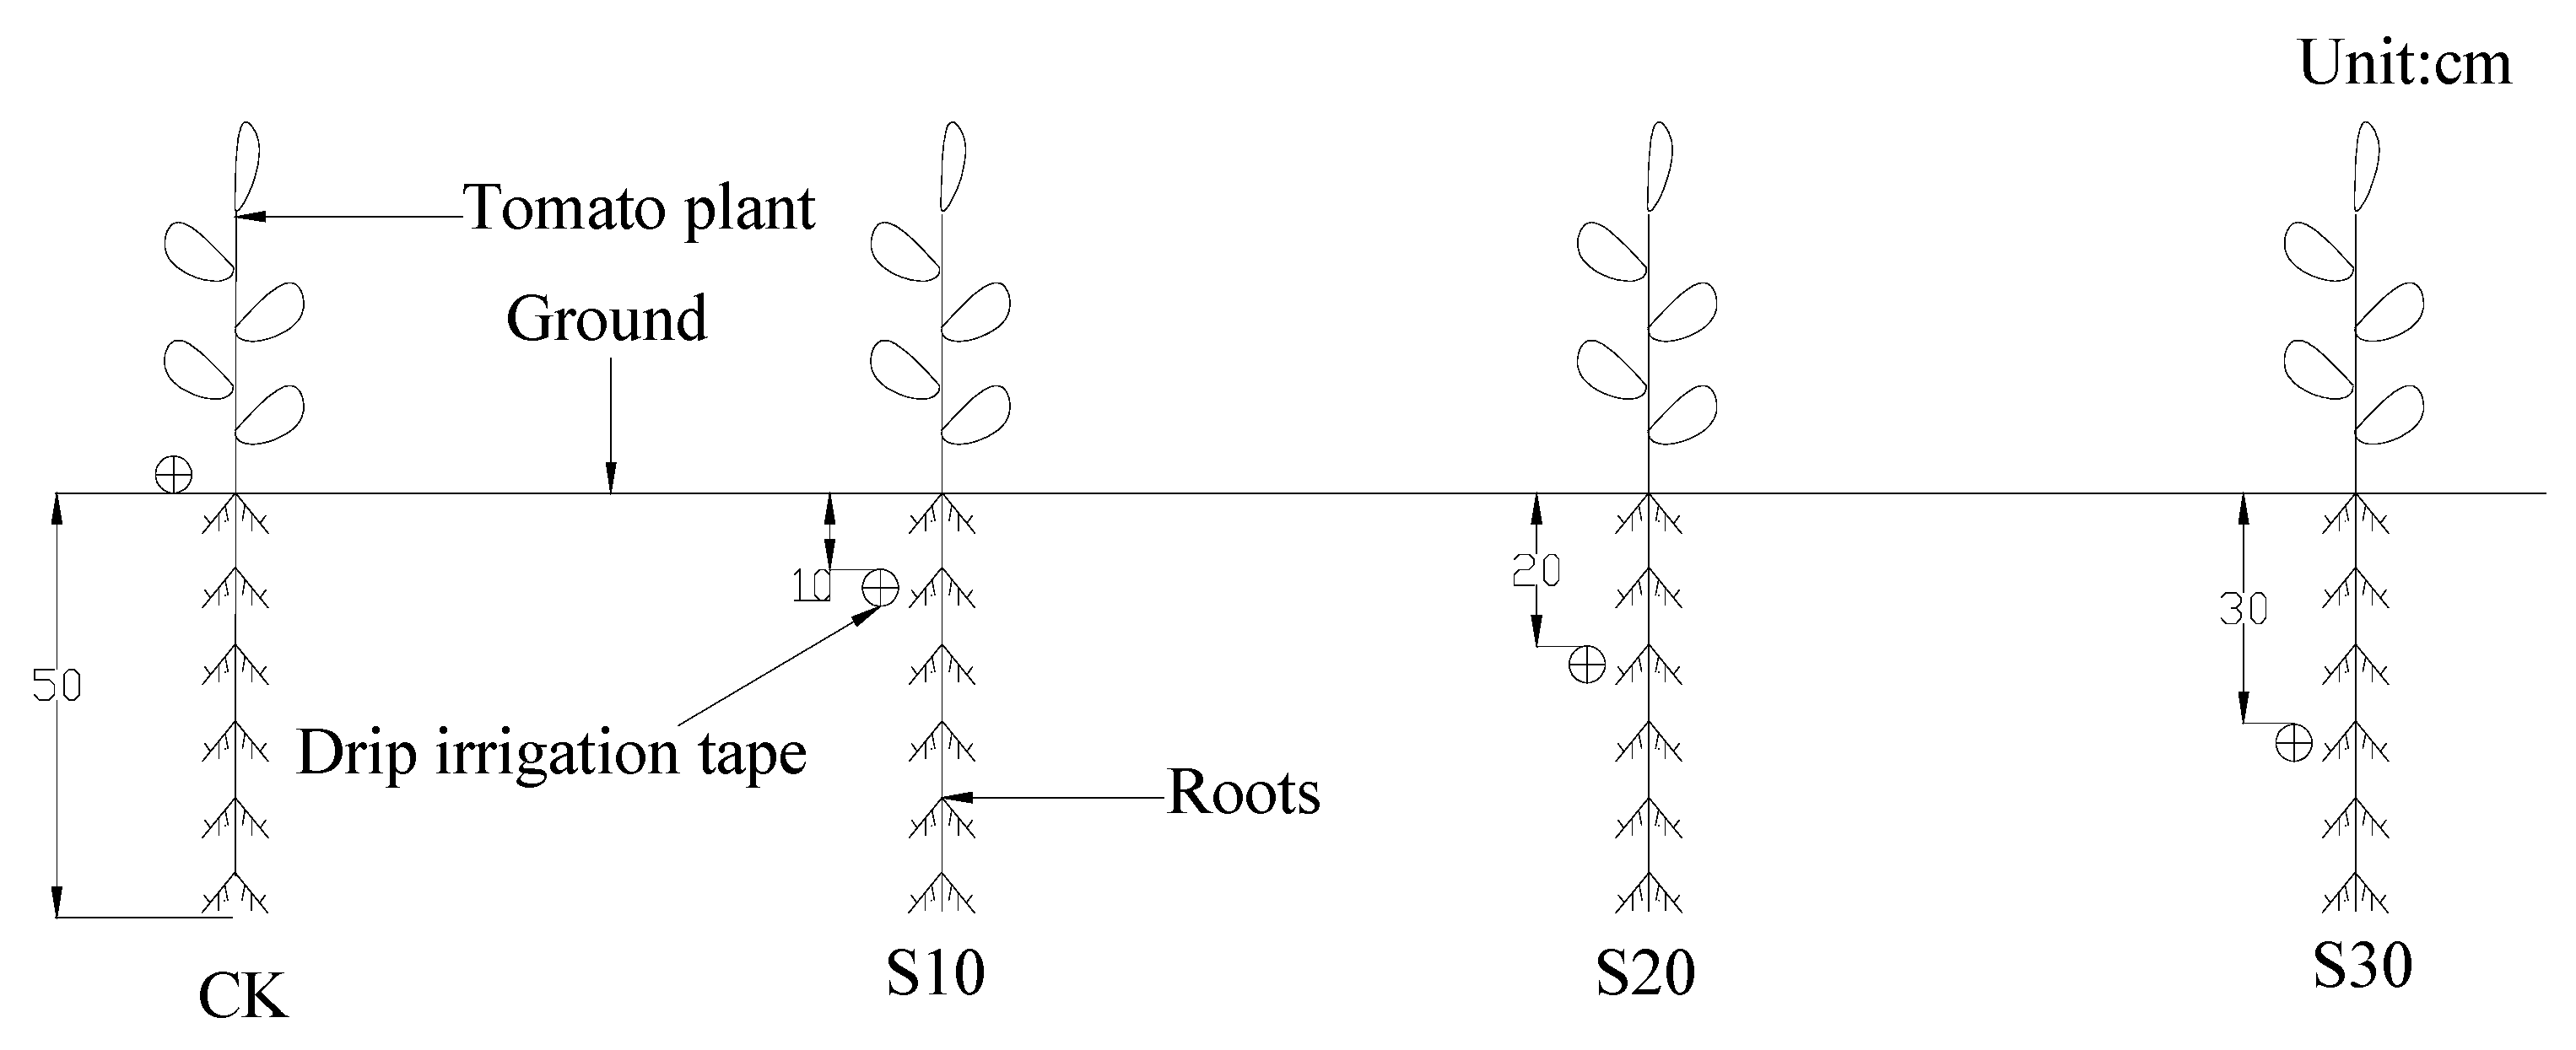
2.1. Experimental Design

The experiment was conducted in a greenhouse (108 m long, 8 m wide) in Yangling District, Shaanxi Province, China, from October 2014 to May 2015. The experimental soil compositions were as follows: 25.4% sand (2-0.02 mm), 44.1% silt (0.02-0.002 mm) and 30.5% clay (< 0.002 mm). The physical properties of the soil were as follows: dry bulk density, 1.35 g cm−3; soil water capacity (FC), 28.17% (by mass water content); and soil porosity, 49.38%.
In the greenhouse, the plots were built from west to east and double ridges were produced per plot. Each plot area was 3.6 m2 with 6.0 m in length, 0.6 m in width, 0.2 m in height and 0.3 m in furrow width (Figure 1). Tomato cultivar “Haidi” seedlings of 20 d were transplanted. It is a type commonly available in the market. Thirty-four tomato plants were planted in double rows of each plot, with a plant spacing of 0.35 m. Protection rows were set up at the two ends of each plot.
The experiment included four treatments (Figure 2). A drip irrigation tape was installed in the middle of tomato rows for each plot and left exposed either on the soil surface (a 0 cm depth) or buried at depths of 10 cm, 20 cm and 30 cm below surface, respectively. The 0 cm depth treatment was the control (treatment CK), and the 10 cm, 20 cm and 30 cm depth treatments were referred to as subsurface drip irrigation (SDI) and were abbreviated as S10, S20 and S30, respectively. The lower and upper irrigation limit were set up at 60% and 70% field capacity (FC), respectively. Each treatment had three replicates, giving rise to a total of 12 plots. All pots surface was mulched with plastic film which was a 0.014-mm-thick, white, transparent and composed of high-pressure low-density polyethylene film, manufactured by Dayu Water-saving Co. Ltd., China. The Inner inlay flat drip irrigation taps (manufactured by Dayu Water-saving Co. Ltd., China) were used in this study, for which the wall thickness was 0.3 mm, emitter spacing was 30 cm, working pressure was 0.1 Mpa and emitter flow rate was 1.2 L/h.
Soil moisture was measured and controlled using Field TDR 200 probes (Spectrum, USA). Probe tubes were installed to reach a depth of 100 cm at the center per plot. Soil moisture was determined at intervals of 10 cm down to 60 cm in depth and calibrated using the coring and oven-drying method. Soil irrigation was decided whenever the 40-cm-deep wet layer reached the lower limit. Irrigation amounts were calculated using the following equation:
M = s ρ b p h θ f ( q 1 q 2 ) / η
where: M is the irrigation amount (unit: m3); s is the planned wetting area (4.6 m2); ρ b is the soil bulk density (1.35 g/m3); p is the wetting ratio (0.8); h is the depth of the wetting layer (0.4 m); θ f is the maximum field water capacity (31.54%); q 1 and q 2 represent the upper irrigation limits and measured soil moisture content, respectively (%F); and η is the water-use coefficient (0.95).

2.2. Measurement of Response Variables

2.2.1. Sample Collection

Three tomato plants with uniform growth per treatment were randomly selected and marked, when fruits began to be ripe. Samples were collected as the following: (1) Tomato fruits were harvested (from March 18 to May 3, 2015) and weighed using a 0.01-g precision electronic balance; (2) Soil and root samples were collected after the fruits harvest (at May 6, 2015). Each soil and root sample had three replications. Soil and root samples were collected using a whole-root excavation method, and were excavated in a rectangular area of 40 cm × 30 cm to a depth equal to the actual root depth (approximately 50 cm), with the centerline between two adjacent plants as the boundary [12]. The large lumps soil in the roots were removed. Then, the soil attached to roots was vigorously shaken off onto clean filter paper (sterilized at high temperature), placed in sterile plastic tubes and taken into the laboratory for soil bacterial community analysis. Soil sample of each replication was split into two sterile plastic tubes: one tube (approximately 50 g) was stored at −80 °C, and the other tube (approximately 10 g) was used for the analysis of soil bacterial diversity. The root samples were placed in mesh bags with a mesh diameter of 0.5 mm and delivered into the laboratory for subsequent analyzing.

2.2.2. Soil Bacterial Community Analysis

DNA extraction and detection: (1) Soil bacterial DNA was extracted using an E.Z.N.A® soil DNA Kit (Omega Bio-tek, Norcross, GA, US); (2) The extracted DNA was purified with a DP209 DNA purification kit (Tiangen Biotechnology Co., Ltd., China); (3) The purified DNA concentration and quality (OD260/OD280ratio) were analyzed using an ND 2000 Nanodrop ultramicro-spectrophotometer (Thermo Scientific, USA); (4) The extracted DNA integrity was determined by 1% agarose (Amresco, USA) gel electrophoresis; (5) The purified DNA was stored in a refrigerator at −20 °C for subsequent PCR (polymerase chain reaction) and MiSeq Illumina sequencing analyzing.
PCR amplification: (1) The primers of 338F 5’-ACTCCTACGGGAGGCAGCAG-3’ and 806R 5’-GGACTACHVGGGTWTCTAAT-3’ were used to amplify the V3-V4 region of the bacterial 16S rRNA using DNA reverse transcriptase (TransGen AP221-02: TransStart Fastpfu DNA polymerase). PCR reaction systems were as follows: 4 μL of 5 × FastPfu buffer, 2 μL of 2.5 mM deoxynucleotide triphosphates, 0.8 μL of 5 μM forward primer, 0.8 μL of 5 μM reverse primer, 0.4 μL of FastPfu polymerase, 10 ng DNA sample and Double-distilled water; (2) PCR analysis was performed with an ABI GeneAmp® 9700 PCR as follows: one cycle of 3 min at 95 °C; 27 cycles of 30 s at 95 °C, 30 s at 55 °C and 45 s at 72 °C; a 10 min extension at 72 °C; and 10 °C until halted by the user.
DNA sequencing: The 2% agarose gel electrophoresis was used to analyze the PCR product (3 µL), and an AxyPrep DNA Gel Extraction Kit (Axygen Biosciences, Union City, CA, US) was used to purify and a QuantiFluor™-ST fluorometer (Promega, USA) was used to quantify the PCR amplification products. DNA sequencing results of the samples were obtained using bidirectional paired-end (PE) sequencing on an Illumina MiSeq platform.
Sequence data processing: The original DNA sequences derived from Miseq sequencing were quality-controlled and filtered by Trimmomatic with the following criteria to generate valid sequences. The raw data was control and filtered as follows: (1) The sequences were longer than 300 bp, and an average quality score of > 20 was included for further analyses. Sequences were truncated at any site receiving an average quality score < 20 over a 50 bp sliding window. (2) The PE reads were merged into one sequence by an overlap relationship; the overlap minimum length was 10 bp. The mismatches number allowed in the barcode and the maximum mismatches number allowed in the primers were 0 and 2, respectively. The samples were identified according to the barcode and primer sequences at the ends of each sequence, and the sequence orientation was adjusted. (3) Then DNA sequences were classified into operational taxonomic units (OTUs) at the similarity level of 97% by the denovo method using Quantitative Insights into Microbial Ecology (Version 1.17) [13], and the OTUs biological information was statistically analyzed.

2.2.3. Tomato Roots

Root samples collected from the field were soaked in water and washed with water to be separated from soil. Fine roots were collected from three layers fine gauze placed at the bottom of the rinse tank. Clean roots were put into zip-loc bag with tweezers. Subsequently, an Epson Expression 1600 Pro Model EU-35 double-sided scanner (Epson, Japan) was used to scan root samples, and a WinRHIZO image analysis system (WinRHIZO Pro2004b, 5.0, Canada) was used to analyze the total length of the roots (unit: cm) and the forks number. Additionally, the triphenyl tetrazolium chloride (TTC) method was used to measure root activity [14].

2.2.4. Soil Temperature, Porosity, Enzymes, and CO2 Flux

Geothermometers were placed at the depths of 5 cm, 10 cm, 15 cm, 20 cm and 25 cm in the center of each plot to measure the soil temperature. The average temperature during tomato growing period was calculated (unit: °C). Soil CO2 flux was collected in situ using the static black box method, collected every 10 d during the tomato growing period and analyzed using an Agilent 7890 B gas chromatograph (Agilent Technologies 7890A GC System, America). The average cumulative emissions of soil CO2 per treatment was calculated by using three replicates [15].
After the tomato fruits harvest, three sampling points were established per plot. Soil samples were collected every 10 cm from the surface to a depth of 40 cm using cutting rings of 100 cm3. The soil samples were dried to a constant weight at 105 °C and the bulk density for each soil sample was determined. Soil bulk density was calculated as the following equation:
d = ( W 1 W 0 ) × ( 1 W % ) / V
where d is the soil bulk density (g·cm−3), W 1 is the total weight of the cutting ring and the soil in its natural structure (g), W 0 is the weight of the cutting ring (g), W % is the moisture content of the fresh soil and V is the volume of the cutting ring (cm3).
Soil porosity was calculated based on the soil bulk density with the equation:
P = ( 1 d ρ W % ) × 100 %
where P represents the soil porosity (%), d represents the soil bulk density (g·cm−3) and ρ represents the soil density ( ρ = 2.65 g·cm−3).

2.3. Data Processing

The data was organized using Microsoft Excel 2010. Statistical software (IBM SPSS statics version 24.0, SPSS Inc. USA) was used to perform normality and homogeneity analysis and one-way analysis of variance (ANOVA) with Tukey’s HSD test involving different treatments. The other data processing was based on the methodological flowchart (Supplementary Figure S1). Rarefaction curves and alpha diversity indices (Ace), bacterial community diversity (Shannon index) and coverage were calculated using MOTHUR (http://www.mothur.org) [16]. The Venn diagrams and abundance-rank curves were created by using R Software (version 3.2.3, R core team, Vienna, Austria) [17]. The principal component analysis (PCA) and the redundancy analysis (RDA) were performed with Canoco 4.5 [18,19]. The abundance of metabolism traits that were present in the bacterial community was assessed using a Phylogenetic Investigation of Communities via the Reconstruction of Unobserved States (PICRUSt) [20]. Based on a fully sequenced reference genome database and information from the 16S rRNA gene dataset, PICRUSt produced the Kyoto Encyclopedia of Genes and Genomes (KEGG) [21], which classified the functions of the bacterial community.

3. Results

3.1. Soil Bacterial Sequence, Abundance, and Diversity of SDI

S20 and S30 significantly increased DNA sequences by 36.01% and 40.75%, respectively, compared to CK. However, S10 decreased them by 23.36% compared to CK (Table 1). On basis of the last sequence of 14889 in S10, each treatment was normalized. The rarefaction curves for four treatments tended to be flat with the reads increase (Supplementary Figure S2); therefore, the amount of sequencing data was reasonable as shown by the coverage in Table 1. S20 and S30 had more OTU compared to CK. S20 increased Ace compared to S10 and CK, however, S30 had greater Ace compared to CK.
Supplementary Figure S3 shows that the species evenness for bacterial community in CK, S10, S20, S30 were basically unanimous, but the species abundance for S20 and S30 were higher compared to CK and S10. The common OTU of four treatments was 921, however, the unique OTU of CK, S10, S20 and S30 was 17, 11, 43 and 29, respectively (Supplementary Figure S4).

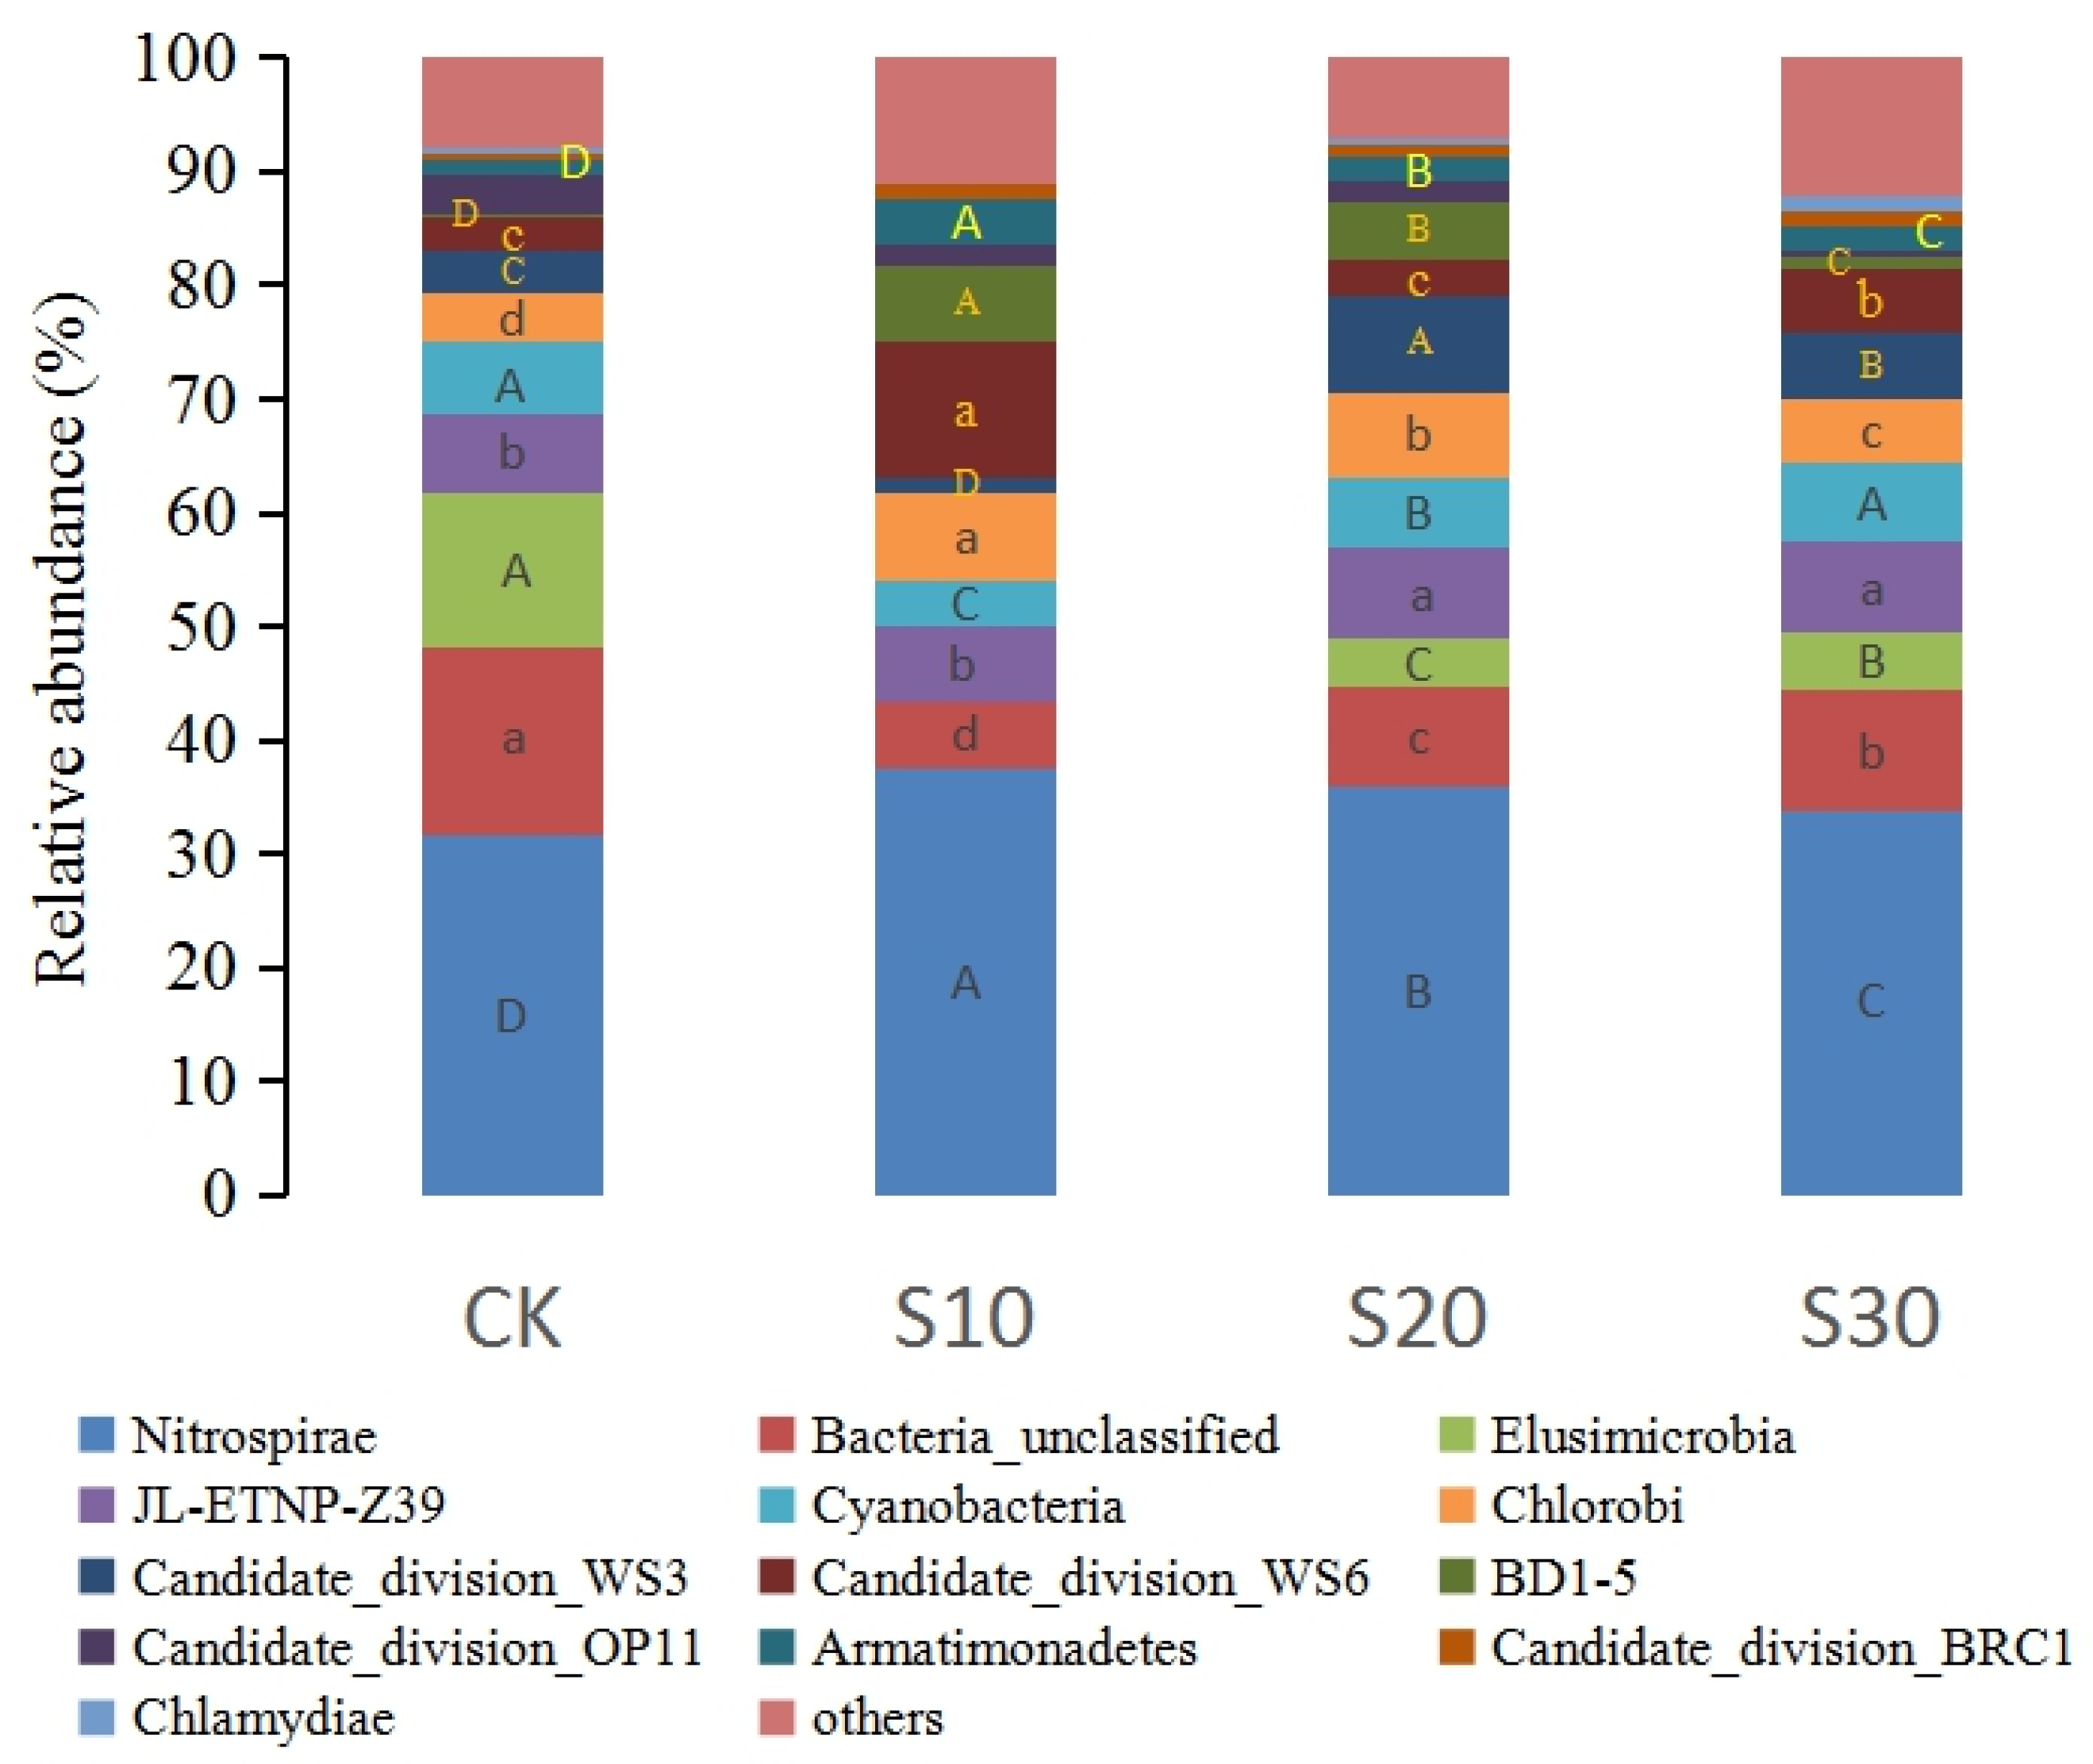
3.2. Soil Bacterial Community Composition in SDI

Soil bacteria with relative abundance accounting for more than 1% of the bacterial species were analyzed at the phlylum classification level, and the proportion accounted for less than 1% was named “others” (Figure 3). The bacterial community was mainly composed of Proteobacteria, Chloroflexi, Actinobacteria, Bacteroidetes, Gemmatimonadetes, Acidobacteria, Candidate_division_TM7 and Firmicutes, Planctomycetes, which accounted for more than 97% of the bacterial communities in CK, S10 and S30, and more than 95% in S20.
With an increasing drip irrigation tape buried depth (from 0 to 30 cm, i.e., CK, S10, S20 and S30), the relative abundance of Proteobacteria decreased systematically in the bacterial community, with the value of 45.70%, 43.05%, 37.86% and 35.56%, respectively; however, the relative abundance of Chloroflexi was initially reduced and then increased, showing 14.69%, 11.20%, 16.11% and 20.35%, respectively. In contrast, the relative abundance of Actinobacteria showed an initial increase then decrease, with the values of 14.34%, 15.63%, 12.54% and 12.65%, respectively. S10, S20 and S30 respectively increased the relative abundance of Gemmatimonadetes by 57.39%, 64.30% and 34.55% compared to CK, and respectively increased the relative abundance of Candidate_division_TM7 by 30.36%, 115.79% and 36.84%. The relative abundance of Acidobacteria in S20 and S30 was respectively increased by 4.23% and 28.17% compared to that in CK, but in S10 it was decreased by 38.83% compared to that in CK. Similarly, the relative abundances of Firmicutes in S20 and S30 were respectively increased by 98.35% and 28.57% compared to that in CK, however, in S10 it was decreased by 32.97% compared to that in CK. The relative abundance of Planctomycetes showed the decrease of 20.00% and 7.30% in S10 and S20 compared to that in CK, respectively, but showed the increase of 1.93% in S30 compared to that in CK. With slight differences, the relative abundances of Bacteroidetes in S10 and S30 were increased by 41.59% and 10.73% compared to that in CK, respectively, however, in S20 they were reduced by 28.87% compared to that in CK.
Some bacteria were increased only in individual treatment, such as Deinococcus—the Thermus in S10 was 5.9, 2.7 and 2.9 times that of CK, S20 and S30, respectively; the Candidate_division_OD1 in S20 was 2.6, 4.1 and 2.0 times that of CK, S10 and S30, respectively; and the Thermotogae in S20 was 109.1, 167.8 and 11.4 times that of CK, S10 and S30, respectively.
Each of the trace bacteria makes up less than 1% of the bacterial community, but they make up less than 2% of the community as a whole. Of the trace bacteria, Nitrospirae was the largest group, for which the relative abundances of S10, S20 and S30 were 1.18, 1.13 and 1.07 times that of CK (Figure 4). The relative abundance of Chlorobi in S10, S20 and S30 was 1.80, 1.68 and 1.31 times that in CK. Similarly, the relative abundance of Cyanobacteria in S10, S20 and S30 was 0.63, 0.97 and 1.07 times that of CK, and the relative abundance of Armatimonadetes in S10, S20 and S30 was 2.16, 1.86 and 1.58 times that of CK. In addition, Chlamydiae was not detected in S10 but its relative abundance in S20 and S30 was 0.67 and 2.22 times that in CK.

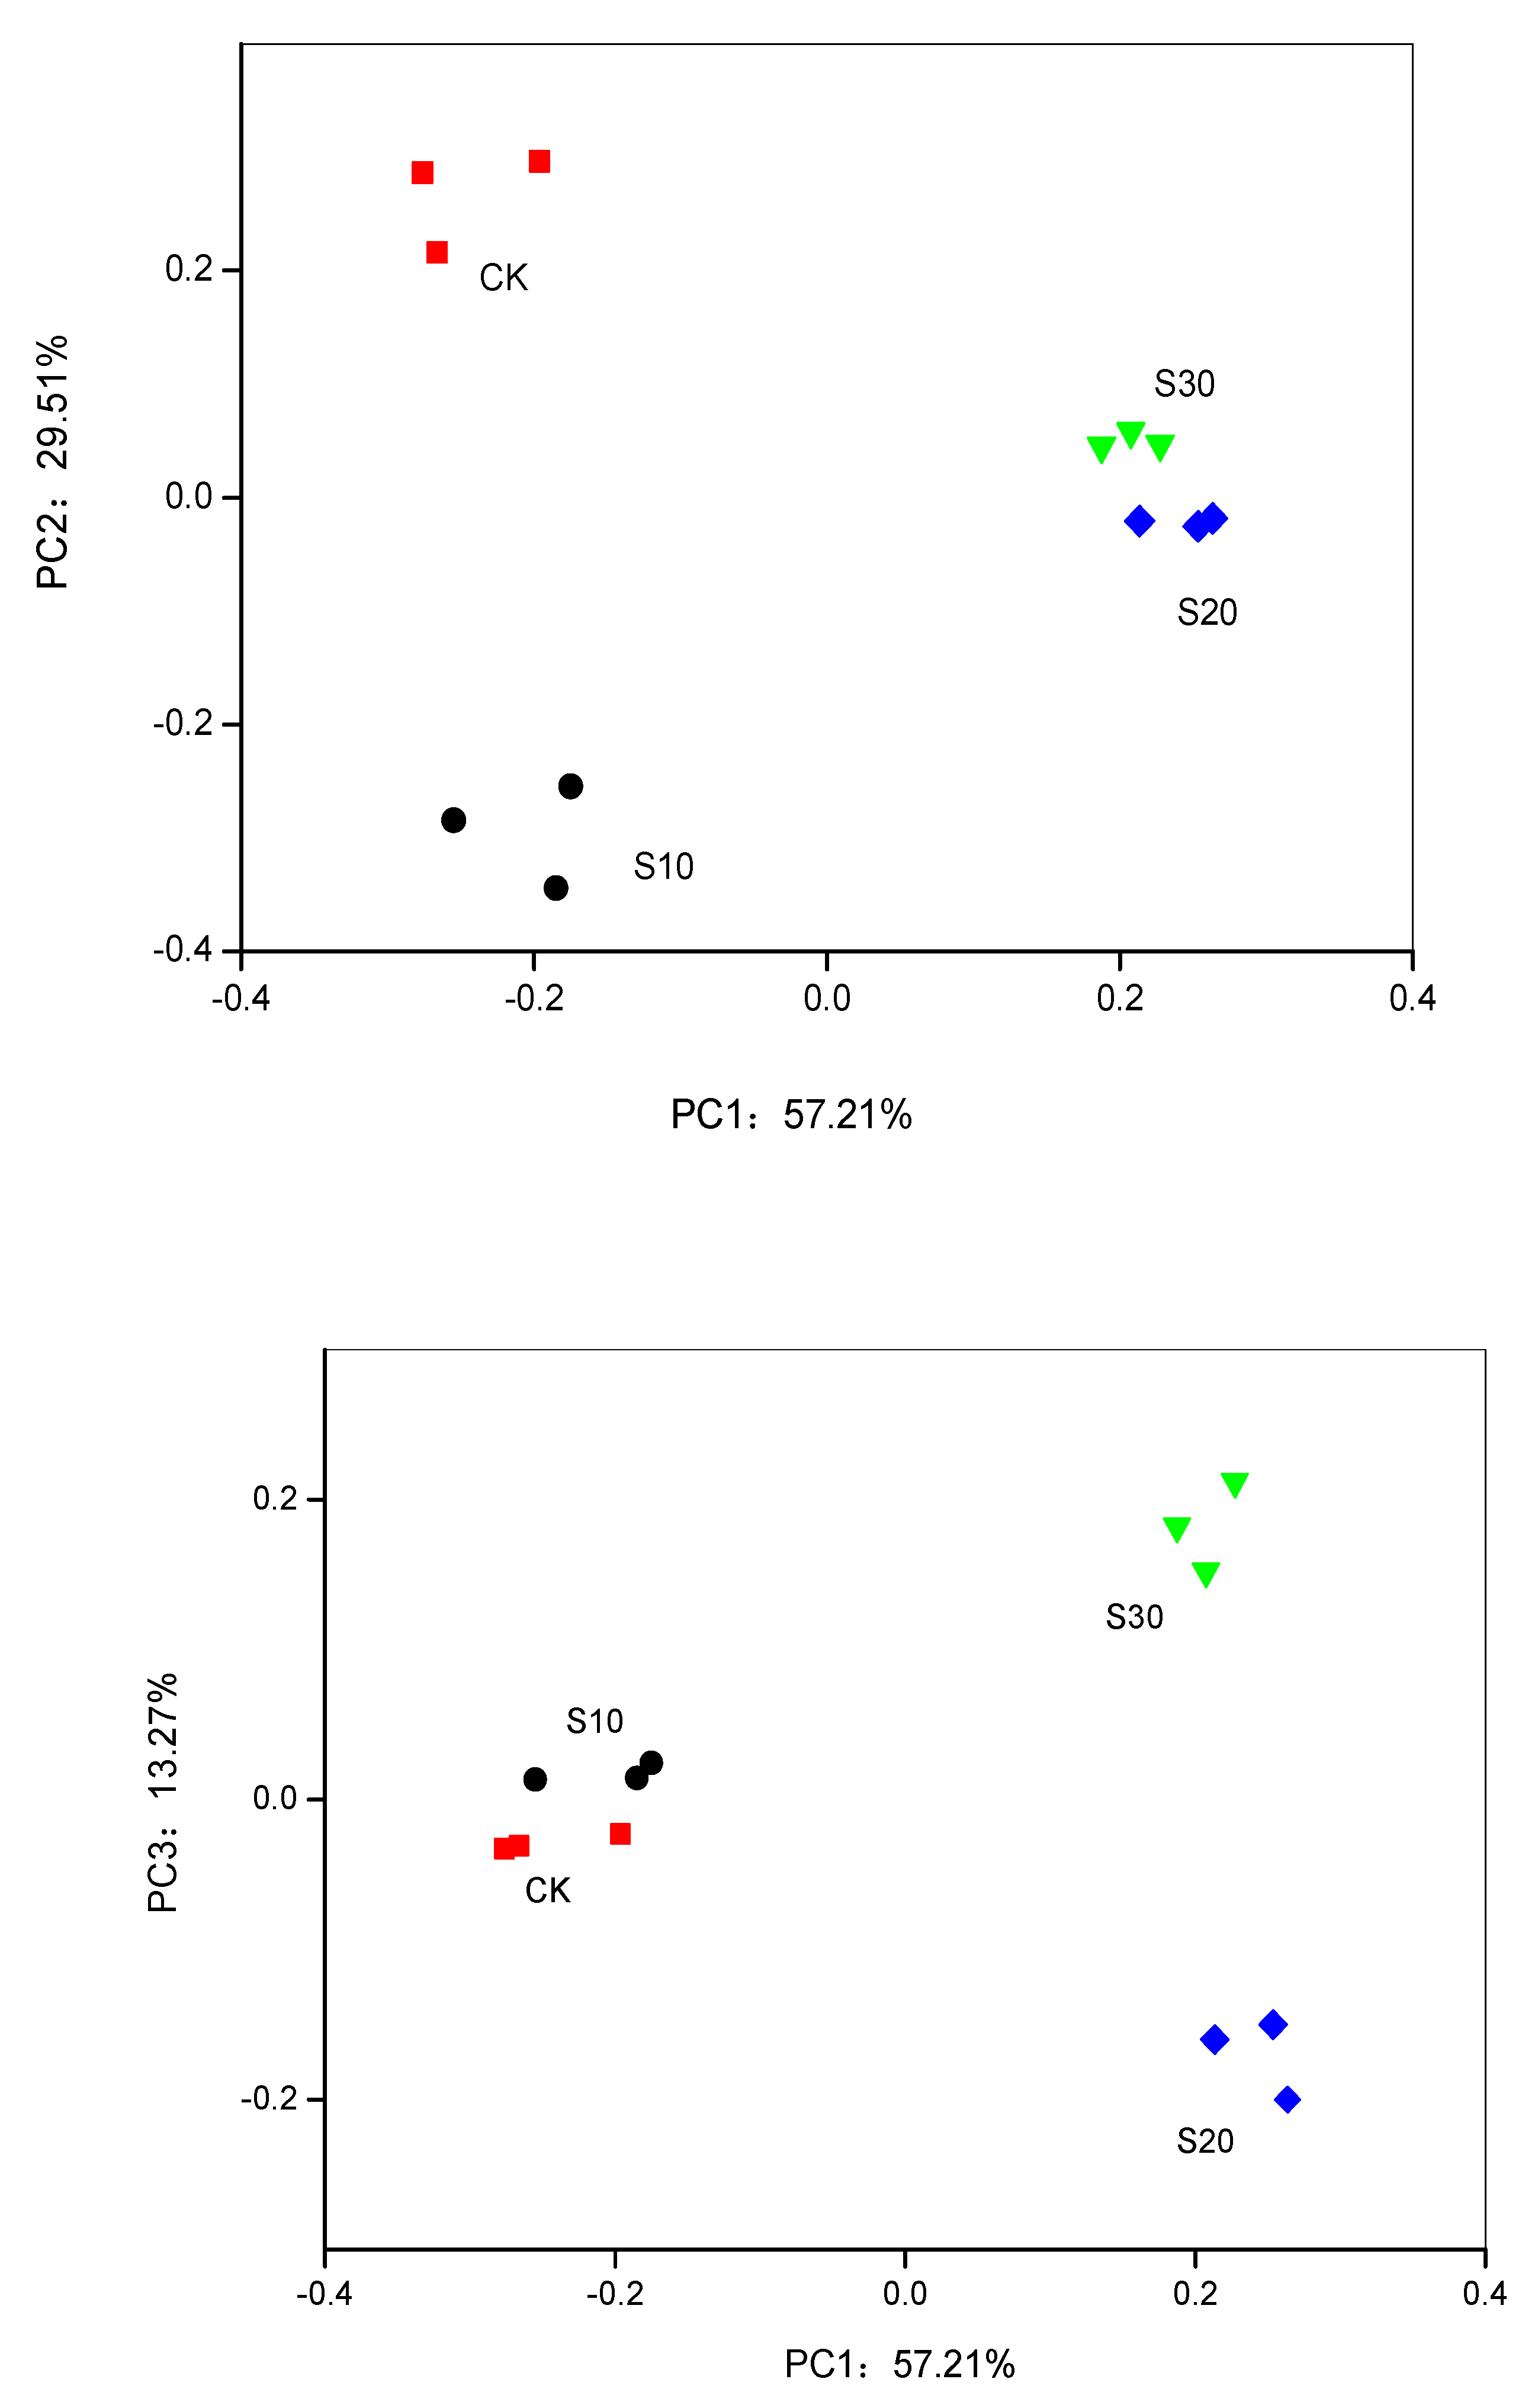
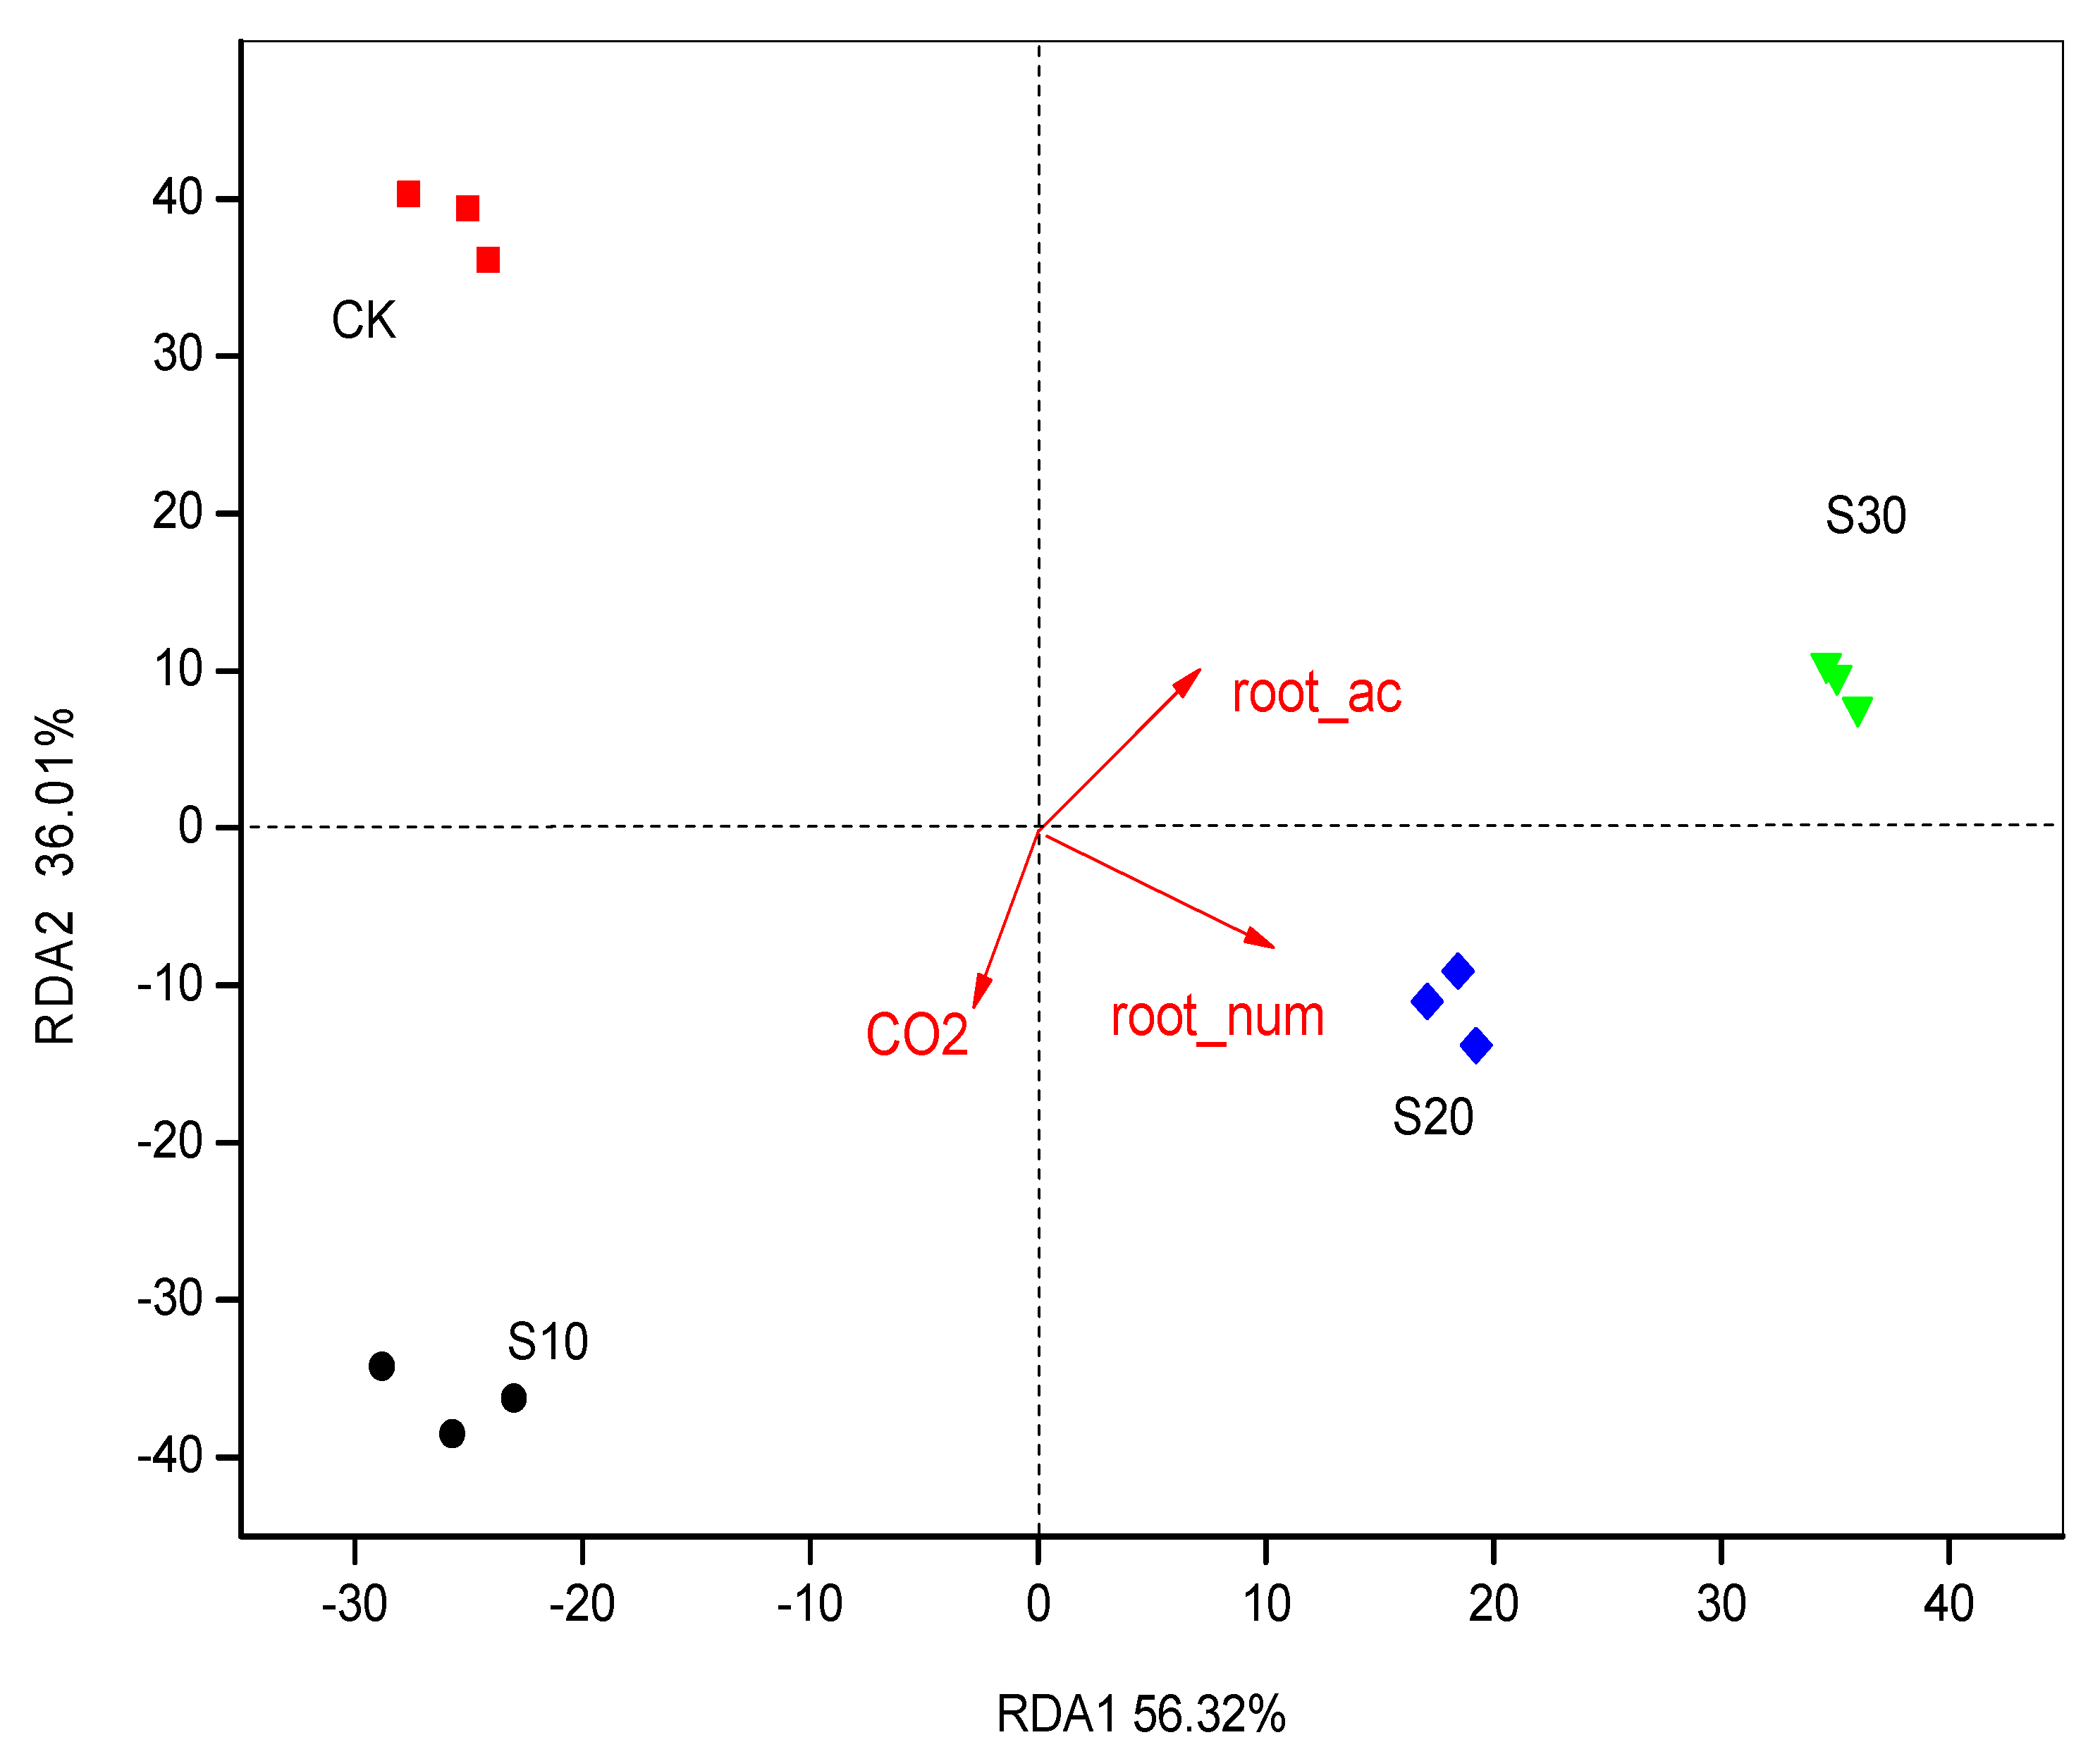
3.3. PCA and RDA of Soil Bacterial Community

The results of PCA in Figure 5 indicated that PC1, PC2 and PC3 (the first three principal components) contributed 57.21%, 29.51% and 13.27%, respectively. CK, S10, S20, and S30 were remarkably separated by PC2 and PC3, showing that the bacterial community of the four treatments differed from each other. In the case of PC1, there was no significant separation between S20 and S30, which revealed that bacterial community of the two treatments had no significant difference. However, S20 or S30 was obviously separated from CK and S10, which was a response to the significant differences of these bacterial communities.
The correlation between the soil bacterial community and environmental factors in root-soil was analyzed, however, only the significant results are shown in Figure 6. The results revealed that the bacterial community of CK was positively related to root activity but was negatively related to root forks and soil CO2 flux. S10 was negatively related to root activity and positively related to root forks and soil CO2 flux. However, S20 had a significant positive correlation with root activity, root forks and soil CO2 flux, respectively. S30 was negatively correlated with soil CO2 flux and positively correlated with root activity and root forks. CK, S10, S20 and S30 were significantly separated by soil CO2 flux and root activity, however, the effect of root activity on CK and S20 was similar. Root forks had similar effects on S10, S20 and S30 but separated them from CK.

3.4. Tomato Yield and Root Growth under SDI

As showed in Table 2, S20 and S30 significantly increased fruit numbers per plant by 7.81% and 11.86% compared to CK, respectively, and similarly increased yield per plant by 22.47% and 19.38% compared to CK, respectively. S20 and S30 significantly increased root length by 43.21% and 46.10% compared to CK, respectively. S10, S20 and S30 significantly increased root forks by 85.13%, 176.59% and 122.35% compared to CK, respectively.

3.5. The Abundance of Metabolism Based on PICRUSt and its Effect on Tomato Growh

The abundances of metabolism were predicted according to KEGG function classification based on PICRUSt. The results in Table 3 show that S20 and S30 increased the abundances of energy metabolism, nitrogen metabolism and phosphonate and phosphinate metabolism compared to CK, however S10 decreased these abundances below that of CK.
The correlation between tomato growth, the abundance of metabolism and root characteristic was analyzed (Table 4), and the results indicated that the yield per plant was significantly and positively correlated with root forks; both fruit numbers and root length were positively correlated with the abundances of energy metabolism, nitrogen metabolism and phosphonate and phosphinate metabolism. Furthermore, the relationship of yield per plant, the abundance of metabolisms and root characteristic was analyzed by using the stepwise regression method, and their relation could be described as a formula: Yield per plant = 0.7 × root forks +0.387 × fruit numbers (p = 0.043*).

4. Discussion

In this study, when the buried depth of drip tape increased to 20 cm and 30 cm, the bacterial DNA sequence and species abundance index (Ace) of SDI were significantly increased compared to that of CK (0 cm buried depth of the drip tape). Because the spatial differentiation of soil moisture, the porosity, temperature, and nutrient migration in the root-zone is increased when the buried depth of drip tape is more than 15 cm [22]. These changes can directly or indirectly affect soil bacteria quantity, species and community structure. Furthermore, the soil moisture distribution in different buried depths of drip tape can also differentiate root growth (Table 2), and therefore regulates and controls the interaction between root growth and the soil bacteria community. S20 and S30 increased 0-10 cm depth soil porosity and root forks, and this might have enhanced interaction of root-soil [23], increased bacterial quantity and the species abundance index (Ace) and finally adjusted and optimized the composition of the bacterial community. However, the similar 0-10 cm soil porosity and root growth indexes for S20 and S30 could have created a similar bacterial DNA sequence and ACE for them [24]. SDI with a 10 cm buried depth of drip tape significantly increased 0–10 cm depth soil porosity and root forks but decreased soil temperature compared to CK (Supplementary Table S1). These changes might have resulted in a significantly lower S10 bacterial DNA sequence compared to CK, though its species abundance index (Ace) was close to CK.
The soil bacterial compositions under SDI and surface drip irrigation were similar and contained mainly nine bacteria at phlylum classification level. However, the relative abundance of these bacteria was significantly different between SDI and surface drip irrigation treatment. Studies found that the Nitrosomonas contained in Proteobacteria could oxidize ammonia to nitrite [25]; Actinobacteria plays a certain role in the soil nitrogen cycle [26]; and Planctomycetes are correlated with the spatial heterogeneity of nitrate [27], for example, ammonia oxidizing bacteria in Planctomycetes acquired energy by oxidizing NH4+ to be N2 using NO2 in an anoxic environment, and this has important effects on the nitrogen cycle in root-soil [28]. Nevertheless, the relative abundance of Proteobacteria and Actinobacteria in S20 and S30 were decreased by about 10% and 2% compared to CK. S20 significantly reduced Planctomycetes by 7.3% compared to CK, however, S30 increased it by 1.93% compared to CK. These changes of Proteobacteria, Actinobacteria and Planctomycetes in S20 and S30 would affect soil nitrogen migration and transformation to a certain extent. For example, the larger decrease of Proteobacteria could reduce nitrite accumulation in root-zone soil, which would be beneficial to the root-zone soil environment. The decrease of Planctomycetes in S20 could reduce soil nitrogen loss, but Actinobacteria with a slight decrease has less effect on soil nitrogen fixation.
S20 and S30 significantly increased the relative abundance of Chloroflexi, Gemmatimonadetes, Acidobacteria, Candidate_division_TM7 and Firmicutes compared to CK. Previous studies indicated that Chloroflexi are facultative anaerobic bacteria and carry out photosynthesis without oxygen production and nitrogen fixation [29]; Gemmatimonadetes can grow under both aerobic and anaerobic conditions, might be associated with a phosphorus metabolism [30] and has less water requirements [31]; Acidobacteria is closely related to a soil organic matter metabolism [32]; Candidate division TM7 is closed to chloroflexi [33]; Firmicutes can reduce the occurrence of crop blight [34]. Therefore, these bacterial increase in soil can be beneficial to metabolic activation of soil organic matter and phosphorus, nutrients assimilation by root and suppressing the occurrence of crop blight. Furthermore, the abundance of metabolism traits in the bacterial community was assessed by PICRUSt (Table 3), and the results found that the abundances of nitrogen metabolism and phosphonate and phosphinate metabolism were improved by drip tape buried depths of 20 and 30 cm, which would enhance soil nitrogen and phosphorus activity.
In addition, some trace bacteria with special functions were found in significantly higher abundance in root-zone soil under S20 and S30 treatments. The Nitrospirae abundance in drip tape buried depth of 20 cm and 30 cm were 1.13 and 1.07 times the CK, respectively, and this was beneficial to soil nitrogen activity because Nitrospirae can oxidize nitrite nitrogen to nitrate nitrogen [35]. Similarly, Chlorobi, Cyanobacteria and Armatimonadetes were the dominant bacteria under the drip tape buried depths of 20 cm and 30 cm. With respect to the metabolic function, Chlorobi is helpful for soil sulfur activation and utilization [36]; Cyanobacteria can release oxygen to change the root-zone environment and plays an important role in bacteria community composition in the root-zone [37]; Armatimonadetes prefer aerobic and warm soil [38]. This may prove to be a better root-soil environment under drip tape buried depths of 20 cm and 30 cm than CK.
Soil environmental and bacterial community composition affects soil nutrient utilization and absorption by crops, and regulates crop growth and production. The results in this study testified that tomato yield per plant was significantly related to root forks and fruit numbers, and both fruit numbers and root length were positively correlated with the abundances of nitrogen metabolism and phosphonate and phosphinate metabolism. The two treatments of S20 and S30 have improved tomato root lengths and root forks as well as the abundances of nitrogen metabolism and phosphonate and phosphinate metabolism bacteria, and accordingly significantly increased the yield per plant by 22.47% and 19.38% compared to CK.
However, the drip tape buried depth of 10 cm decreased the abundance of Proteobacteria, Chloroflexi, Acidobacteria Firmicutes and Planctomycetes, and increased Actinobacteria, Gemmatimonadetes, Candidate_division_TM7 and Bacteroidetes, compared to CK. Based on the metabolic function of these bacteria, S10 can restrain the nitrification and denitrification [25], enhance nitrogen fixation [26], improve soil phosphorus activity [30] and increase decomposition of organic matter [32]. However, the decrease of Chloroflexi and Firmicutes might cause the decrease of organic material synthesis in root-zone [29], and increase of the risk of crop blight [34]. As a result, the nitrogen metabolism and phosphonate and phosphinate metabolism abundances of S10 were significantly reduced (Table 3). In addition, S10 significantly decreased the average temperature of 0–25 cm soil and increased tomato root forks compared to CK. The significant increase of root forks would strengthen the root-soil interaction and would be beneficial for crops to absorb soil nutrients near the root-zone. However, the soil average temperature decrease might restrain the abundances of nitrogen metabolism and phosphonate and phosphinate metabolism, root absorptivity and nutrients migration in a larger range from the root-zone, which thus caused insignificant differences on yield per plant between S10 and CK.
Therefore, SDI with drip tape buried depths of 20 cm and 30 cm are appropriate agronomic measures for tomato production, based on the above results and discussion. This method may also be suitable for other crops of greenhouse because the buried depth of drip tape irrigation is generally about 15–35 cm in actual production. However, the costs vs. benefits of the experiment for large scale farming need to be verified in depth.

5. Conclusions

Compared with surface drip irrigation, SDI significantly changed the soil bacterial community composition. With the drip tape buried depths of 20 cm and 30 cm, the soil bacteria DNA sequence was increased by 36.01% and 40.75%, respectively, the abundances of nitrogen metabolism and phosphonate and phosphinate metabolism were significantly increased, while the 0–10 cm soil porosity and root forks were also improved. These changes significantly improved the interaction of root-soil, and thereby increased tomato yield per plant by 22.47% and 19.38% for S20 and S30, respectively. Therefore, from the perspective of increasing root-soil interaction and tomato yield, SDI with drip tape buried depths of 20 cm and 30 cm proved to be a more beneficial drip irrigation method.

Supplementary Materials

The following are available online at https://www.mdpi.com/2071-1050/12/6/2338/s1, Figure S1: Methodological flowchart, Figure S2: Rarefaction curves for the OTUs, Figure S3: The rank-abundance distribution curve of OTU, Figure S4: The Venn diagram of OTU, Table S1: Soil indexes and root activity.

Author Contributions

J.W. and W.N. conceived the hypothesis of this study. J.W. and Y.L. carried out the research. All authors approved the final manuscript. All authors have read and agreed to the published version of the manuscript.

Funding

This study was jointly supported by the National Key Research Project of China “13th Five Year Plan” (2016YFC0400202) and Natural Science Foundation of China (No.51679205).

Conflicts of Interest

The authors declare no conflict of interest.

References

  1. Zhong, W.H.; Gu, T.; Wei, W.; Zhang, B.; Lin, X.G.; Huang, Q.R.; Shen, W.H. The effects of mineral fertilizer and organic manure on soil microbial community and diversity. Plant Soil 2010, 326, 511–522. [Google Scholar] [CrossRef]
  2. Zhalnina, K.; Dias, R.; de Quadros, P.D.; Davisrichardson, A.; Camargo, F.A.; Clark, I.M.; McGrath, S.P.; Hirsch, P.R.; Triplett, E.W. Soil pH determines microbial diversity and composition in the park grass experiment. Microb. Ecol. 2015, 69, 395–406. [Google Scholar] [CrossRef]
  3. Heijden, M.G.A.V.D.; Bardgett, R.D.; Straalen, N.M.V. The unseen majority: soil microbes as drivers of plant diversity and productivity in terrestrial ecosystems. Ecol. Lett. 2008, 11, 296–310. [Google Scholar] [CrossRef]
  4. Torsvik, V.; Ovreas, L. Microbial diversity and function in soil: from genes to ecosystems. Curr. Opin. Microbiol. 2002, 5, 240–245. [Google Scholar] [CrossRef]
  5. Lu, R. Microzone soil science-a possible new branch of soil science. Acta Pedol. Sin. 1999, 36, 287–288. [Google Scholar]
  6. Camp, C.R. Subsurface drip irrigation: A review. Trans. Chin. Soc. Agric. Eng. 1998, 41, 1353–1367. [Google Scholar] [CrossRef]
  7. He, H.; Kang, S.; Cao, H. Effect of Latera depth on root and seedling growth and water use efficiency of winter wheat. Trans. Chin. Soc. Agric. Eng. 2001, 17, 31–33. [Google Scholar]
  8. Songmei, Z.; Feng, W.; Ji, W.; Wang, Z.H. Evaluation method of soil water distribution uniformity under conditions of field subsurface drip irrigation. Trans. Chin. Soc. Agric. Eng. 2009, 25, 51–57. [Google Scholar]
  9. Attia, A.; Rajan, N.; Ritchie, G.; Cui, S.; Ibrahim, A.; Hays, D.; Xue, Q.W.; Wilborn, J. Yield, quality, and spectral reflectance responses of cotton under subsurface drip irrigation. Agron. J. 2015, 107, 1355–1364. [Google Scholar] [CrossRef]
  10. Sharma, S.P.; Leskovar, D.I.; Crosby, K.M.; Volder, A.; Ibrahim, A.M.H. Root growth, yield, and fruit quality responses of reticulatus, and inodorus, melons (cucumis melo, L.) to deficit subsurface drip irrigation. Agric. Water Manag. 2014, 136, 75–85. [Google Scholar] [CrossRef]
  11. Egamberdiyeva, D. The effect of plant growth promoting bacteria on growth and nutrient uptake of maize in two different soils. Appl. Soil Ecol. 2007, 36, 184–189. [Google Scholar] [CrossRef]
  12. Wang, J.W.; Niu, W.Q.; Zhang, M.Z.; Li, Y. Effect of alternate partial root-zone drip irrigation on soil bacterial communities and tomato yield. Appl. Soil Ecol. 2017, 119, 250–259. [Google Scholar] [CrossRef]
  13. Chen, S.N.; Shang, P.L.; Kang, P.L.; Du, M.M. Metabolic Functional Community Diversity of Associated Bacteria during the Degradation of Phytoplankton from a Drinking Water Reservoir. Int. J. Environ. Res. Public Health 2020, 17, 1687. [Google Scholar] [CrossRef] [Green Version]
  14. Tang, B.; Yin, C.; Wang, Y.; Sun, Y.; Liu, Q. Positive effects of night warming on physiology of coniferous trees in late growing season: Leaf and root. Acta Oecologica 2016, 73, 21–30. [Google Scholar] [CrossRef]
  15. Franzluebbers, A.J.; Hons, F.M.; Zuberer, D.A. Tillage and crop effects on seasonal dynamics of soil CO2 evolution, water content, temperature, and bulk density. Appl. Soil Ecol. 1995, 2, 95–109. [Google Scholar] [CrossRef]
  16. Yan, M.M.; Chen, S.N.; Huang, T.L.; Li, B.Q.; Li, N.; Liu, K.W.; Zong, R.R.; Miao, Y.T.; Huang, X. Community Compositions of Phytoplankton and Eukaryotes during the Mixing Periods of a Drinking Water Reservoir: Dynamics and Interactions. Int. J. Environ. Res. Public Health 2020, 17, 1128. [Google Scholar] [CrossRef] [Green Version]
  17. Jiang, X.T.; Peng, X.; Deng, G.H.; Sheng, H.F.; Wang, Y.; Zhou, H.W.; Tam, F.Y. Illumina sequencing of 16s rrna tag revealed spatial variations of bacterial communities in a mangrove wetland. Microb. Ecol. 2013, 66, 96–104. [Google Scholar] [CrossRef]
  18. Wang, Y.; Sheng, H.F.; He, Y.; Wu, J.Y.; Jiang, Y.X.; Tam, N.F.Y.; Zhou, H.W. Comparison of the levels of bacterial diversity in freshwater, intertidal wetland, and marine sediments by using millions of illumina tags. Appl. Environ. Microbiol. 2012, 78, 8264–8827. [Google Scholar] [CrossRef] [Green Version]
  19. Wang, Q.; Garrity, G.M.; Tiedje, J.M.; Cole, J.R. Naive Bayesian classifier for rapid assignment of rRNA sequences into the new bacterial taxonomy. Appl Environ. Microb. 2007, 73, 5261–5267. [Google Scholar] [CrossRef] [Green Version]
  20. Langille, M.G.; Zaneveld, J.; Caporaso, J.G.; Mcdonald, D.; Knights, D.; Reyes, J.A.; Clemente, J.C.; Burkepile, D.E.; Thurber, R.L.V.; Knight, R.; et al. Predictive functional profiling of microbial communities using 16s rrna marker gene sequences. Nat. Biotechnol. 2013, 31, 814–821. [Google Scholar] [CrossRef]
  21. Kanehisa, M.; Goto, S. KEGG: Kyoto encyclopedia of genes and genomes. Nucleic Acids Res. 2000, 28, 27–30. [Google Scholar] [CrossRef] [PubMed]
  22. Zheng, H.; Gao, J.; Teng, Y.; Feng, C.; Tian, M. Temporal variations in soil moisture for three typical vegetation types in inner mongolia, northern china. PLoS ONE 2015, 10, e0118964. [Google Scholar] [CrossRef] [PubMed] [Green Version]
  23. Haling, R.E.; Brown, L.K.; Bengough, A.G.; Young, I.M.; Hallett, P.D.; White, P.J.; George, T.S. Root hairs improve root penetration, root–soil contact, and phosphorus acquisition in soils of different strength. J. Exp. Bot. 2013, 64, 3711–3721. [Google Scholar] [CrossRef] [PubMed] [Green Version]
  24. Zhang, R.; Vivanco, J.M.; Shen, Q. The unseen rhizosphere root-soil-microbe interactions for crop production. Curr. Opin. Microbiol. 2017, 37, 8–14. [Google Scholar] [CrossRef] [PubMed]
  25. Nguyen, M.D.; Risgaard-Petersen, N.; Sørensen, J.; Brandt, K.K. Rapid and sensitive nitrosomonas europaea biosensor assay for quantification of bioavailable ammonium sensu strictu in soil. Environ. Sci. Technol. 2011, 45, 1048–1054. [Google Scholar]
  26. Ningthoujam, D.S.; Sanasam, S.; Tamreihao, K.; Nimaichand, S. Antagonistic activities of local actinomycete isolates against rice fungal pathogens. Afr. J. Microbiol. Res. 2009, 3, 737–742. [Google Scholar]
  27. Buckley, D.H.; Huangyutitham, V.; Nelson, T.A.; Rumberger, A.; Thies, J.E. Diversity of Planctomycetes in soil in relation to soil history and environmental heterogeneity. Appl. Environ. Microbiol. 2006, 72, 4522–4531. [Google Scholar] [CrossRef] [Green Version]
  28. Ishii, S.; Ikeda, S.; Minamisawa, K.; Senoo, K. Nitrogen cycling in rice paddy environments: past achievements and future challenges. Microbes Environ. 2011, 26, 282–292. [Google Scholar] [CrossRef] [Green Version]
  29. Bryant, D.A.; Liu, Z.; Li, T.; Zhao, F.; Costas, A.M.G.; Klatt, C.G.; Ward, N.U.F.; Overmann, J. Comparative and functional genomics of anoxygenic green bacteria from the taxa chlorobi, chloroflexi, and acidobacteria. Adv. Photosynth. Respir. 2012, 33, 47–102. [Google Scholar]
  30. Hanada, S.; Sekiguchi, Y. The Phylum Gemmatimonadetes. Prokaryotes 2014, 11, 677–681. [Google Scholar]
  31. Debruyn, J.M.; Nixon, L.T.; Fawaz, M.N.; Johnson, A.M.; Radosevich, M. Global biogeography and quantitative seasonal dynamics of gemmatimonadetes in soil. Appl. Environ. Microbiol. 2011, 77, 6295–6300. [Google Scholar] [CrossRef] [PubMed] [Green Version]
  32. Eichorst, S.A.; Kuske, C.R.; Schmidt, T.M. Influence of plant polymers on the distribution and cultivation of Vbacteria in the phylum acidobacteria. Appl. Environ. Microbiol. 2011, 77, 586–596. [Google Scholar] [CrossRef] [PubMed] [Green Version]
  33. Rappé, M.S.; Giovannoni, S.J. The uncultured microbial majority. Annu. Rev. Microbiol. 2003, 57, 369–394. [Google Scholar] [CrossRef] [PubMed] [Green Version]
  34. Mowlick, S.; Inoue, T.; Takehara, T.; Tonouchi, A.; Kaku, N.; Ueki, K.; Ueki, A. Usefulness of japanese-radish residue in biological soil disinfestation to suppress spinach wilt disease accompanying with proliferation of soil bacteria in the firmicutes. Crop Prot. 2014, 61, 64–73. [Google Scholar] [CrossRef] [Green Version]
  35. Lin, W.; Deng, A.; Wang, Z.; Li, Y.; Wen, T.; Wu, L.F.; Wu, M.; Pan, Y.G. Genomic insights into the uncultured genus ‘Candidatus Magnetobacterium’ in the phylum Nitrospirae. Isme J. 2015, 8, 2463–2477. [Google Scholar] [CrossRef] [PubMed] [Green Version]
  36. Liu, Z.; Klatt, C.G.; Ludwig, M.; Rusch, D.B.; Jensen, S.I.; Kühl, M.; Ward, D.M.; Bryant, D.A. ‘Candidatus Thermochlorobacter aerophilum’: An aerobic chlorophotoheterotrophic member of the phylum chlorobi defined by metagenomics and metatranscriptomics. Isme J. 2012, 6, 1869–1882. [Google Scholar] [CrossRef] [Green Version]
  37. Valverde, A.; Makhalanyane, T.P.; Seely, M.; Cowan, D.A. Cyanobacteria drive community composition and functionality in rock-soil interface communities. Mol. Ecol. 2015, 24, 812–821. [Google Scholar] [CrossRef]
  38. Lee, K.C.; Dunfield, P.F.; Morgan, X.C.; Crowe, M.A.; Houghton, K.M.; Vyssotski, M.; Ryan, J.L.J.; Lagutin, K.; McDonald, I.R.; Stott, M.B. Chthonomonas calidirosea gen. nov. sp. nov. an aerobic, pigmented, thermophilic microorganism of a novel bacterial class, chthonomonadetes classis nov. of the newly described phylum armatimonadetes originally designated candidate division OP10. Int. J. Syst. Evol. Microbiol. 2011, 61, 2482–2490. [Google Scholar] [CrossRef]
Figure 1. Diagram of the plot.
Sustainability 12 02338 g001
Figure 2. Diagrams of four treatments in experiment.
Sustainability 12 02338 g002
Note: The drip irrigation tape was installed and buried at depth of 0 cm, 10 cm, 20 cm and 30 cm below ground in four treatments, respectively. The 0 cm depth treatment was the control (treatment CK), and the 10 cm, 20 cm and 30 cm depth treatments were referred to as subsurface drip irrigation (SDI) and abbreviated as S10, S20 and S30, respectively.
Figure 3. Bacterial community structure at the phylum level under different depth of drip tape irrigation treatments.
Sustainability 12 02338 g003
Note: the y-axis is the relative abundance of different bacteria at the phylum level accounting for the whole community; the different colors bar blocks represent different bacterial classifications; the different letters in the same colors bar blocks indicates significant differences for the same bacteria among the different treatments (p < 0.05), the same is true for the figures below.
Figure 4. Trace bacterial community structure at the phlylum level under different depths of drip tape irrigation treatments.
Sustainability 12 02338 g004
Figure 5. Principal component analysis of the soil bacteria communities differences.
Sustainability 12 02338 g005
Note: the points with the same color and shape indicate the replicate samples of each treatment.
Figure 6. Redundancy analysis (RDA) of soil bacteria communities under different depths of drip tape irrigation treatments.
Sustainability 12 02338 g006
Note: the points with the same color and shape indicate the replicate samples of each treatment. root_ac represents root activity, root_num represents root forks number and CO2 is the soil CO2 flux.
Table 1. Bacterial sequence, abundance and the diversity index of tomato soil under subsurface drip irrigation (SDI).
TreatmentsDNA SequenceOTUAceShannon DiversityCoverage
CK19428 ± 301b1181 ± 17b1378 ± 21c5.96 ± 0.015a0.989 ± a
S1014889 ± 284c1201 ± 23ab1387 ± 26bc6.03 ± 0.015a0.983 ± a
S2026424 ± 304a1256 ± 14a1478 ± 17a6.13 ± 0.012a0.993 ± a
S3027345 ± 279a1255 ± 12a1450 ± 14ab6.13 ± 0.0088a0.994 ± a
Note: Each treatment had three replications, and one-way ANOVA analyzing via with different treatments was proceeded. The different lowercase letters indicate significance of the differences (p < 0.05) of different treatments; the same is true for the tables below.
Table 2. Tomato yield and root growth characteristics.
TreatmentsFruit Numbers per StrainsSingle Fruit Weight (g)Yield per Plant (kg)Root Length (cm)Root Forks
CK13.83 ± 0.35b 164.24 ± 4.81a 2.27 ± 0.05b 1473.69 ± 10.17b 3969 ± 91c
S1013.57 ± 0.07b 178.80 ± 11.28a 2.43 ± 0.16b 1365.85 ± 116.51b 7348 ± 80b
S2014.91 ± 0.42ab 186.24 ± 1.83a2.78 ± 0.06a 2110.57 ± 123.67a 10978 ± 615a
S3015.47 ± 0.74a 176.11 ± 9.02a 2.71 ± 0.03a 2153.12 ± 24.39a8825 ± 49ab
Note: Each treatment had three replications, and one-way ANOVA analyzing with different treatments was conducted. The different lowercase letters indicate the significant differences (p < 0.05) of different treatments; the same is true for the tables below.
Table 3. Abundance of metabolisms according to KEGG function classification based on PICRUSt.
TreatmentsEnergy MetabolismNitrogen MetabolismPhosphonate and Phosphinate Metabolism
CK148,068 ± 326c128,564 ± 221c8646 ± 163c
S10117,363 ± 640d100,414 ± 119d6826 ± 49d
S20193,694 ± 121b167,050 ± 182b11,014 ± 129b
S30210,976 ± 263 a180,157 ± 86a12,225 ± 189a
Note: The abundance of metabolisms was predicted using the PICRUSt algorithm. Each row refers to a KEGG level-3 pathway. Each treatment had three replications, and one-way ANOVA analyzing with different treatments was conducted. The different lowercase letters indicate significant differences (p < 0.05) of different treatments.
Table 4. Correlation analysis between tomato growth, the abundance of metabolisms and root characteristics.
Energy MetabolismNitrogen MetabolismPhosphonate and Phosphinate MetabolismRoot LengthRoot Forks
Yield perplant0.7990.7910.7780.9140.957 *
Single fruit weight0.3090.30.2740.5180.947
Fruit numbers0.980 *0.974 *0.980 *0.977 *0.667
Root length0.974 *0.971 *0.964 *10.764
Note: * represents a significant difference (p < 0.05).

