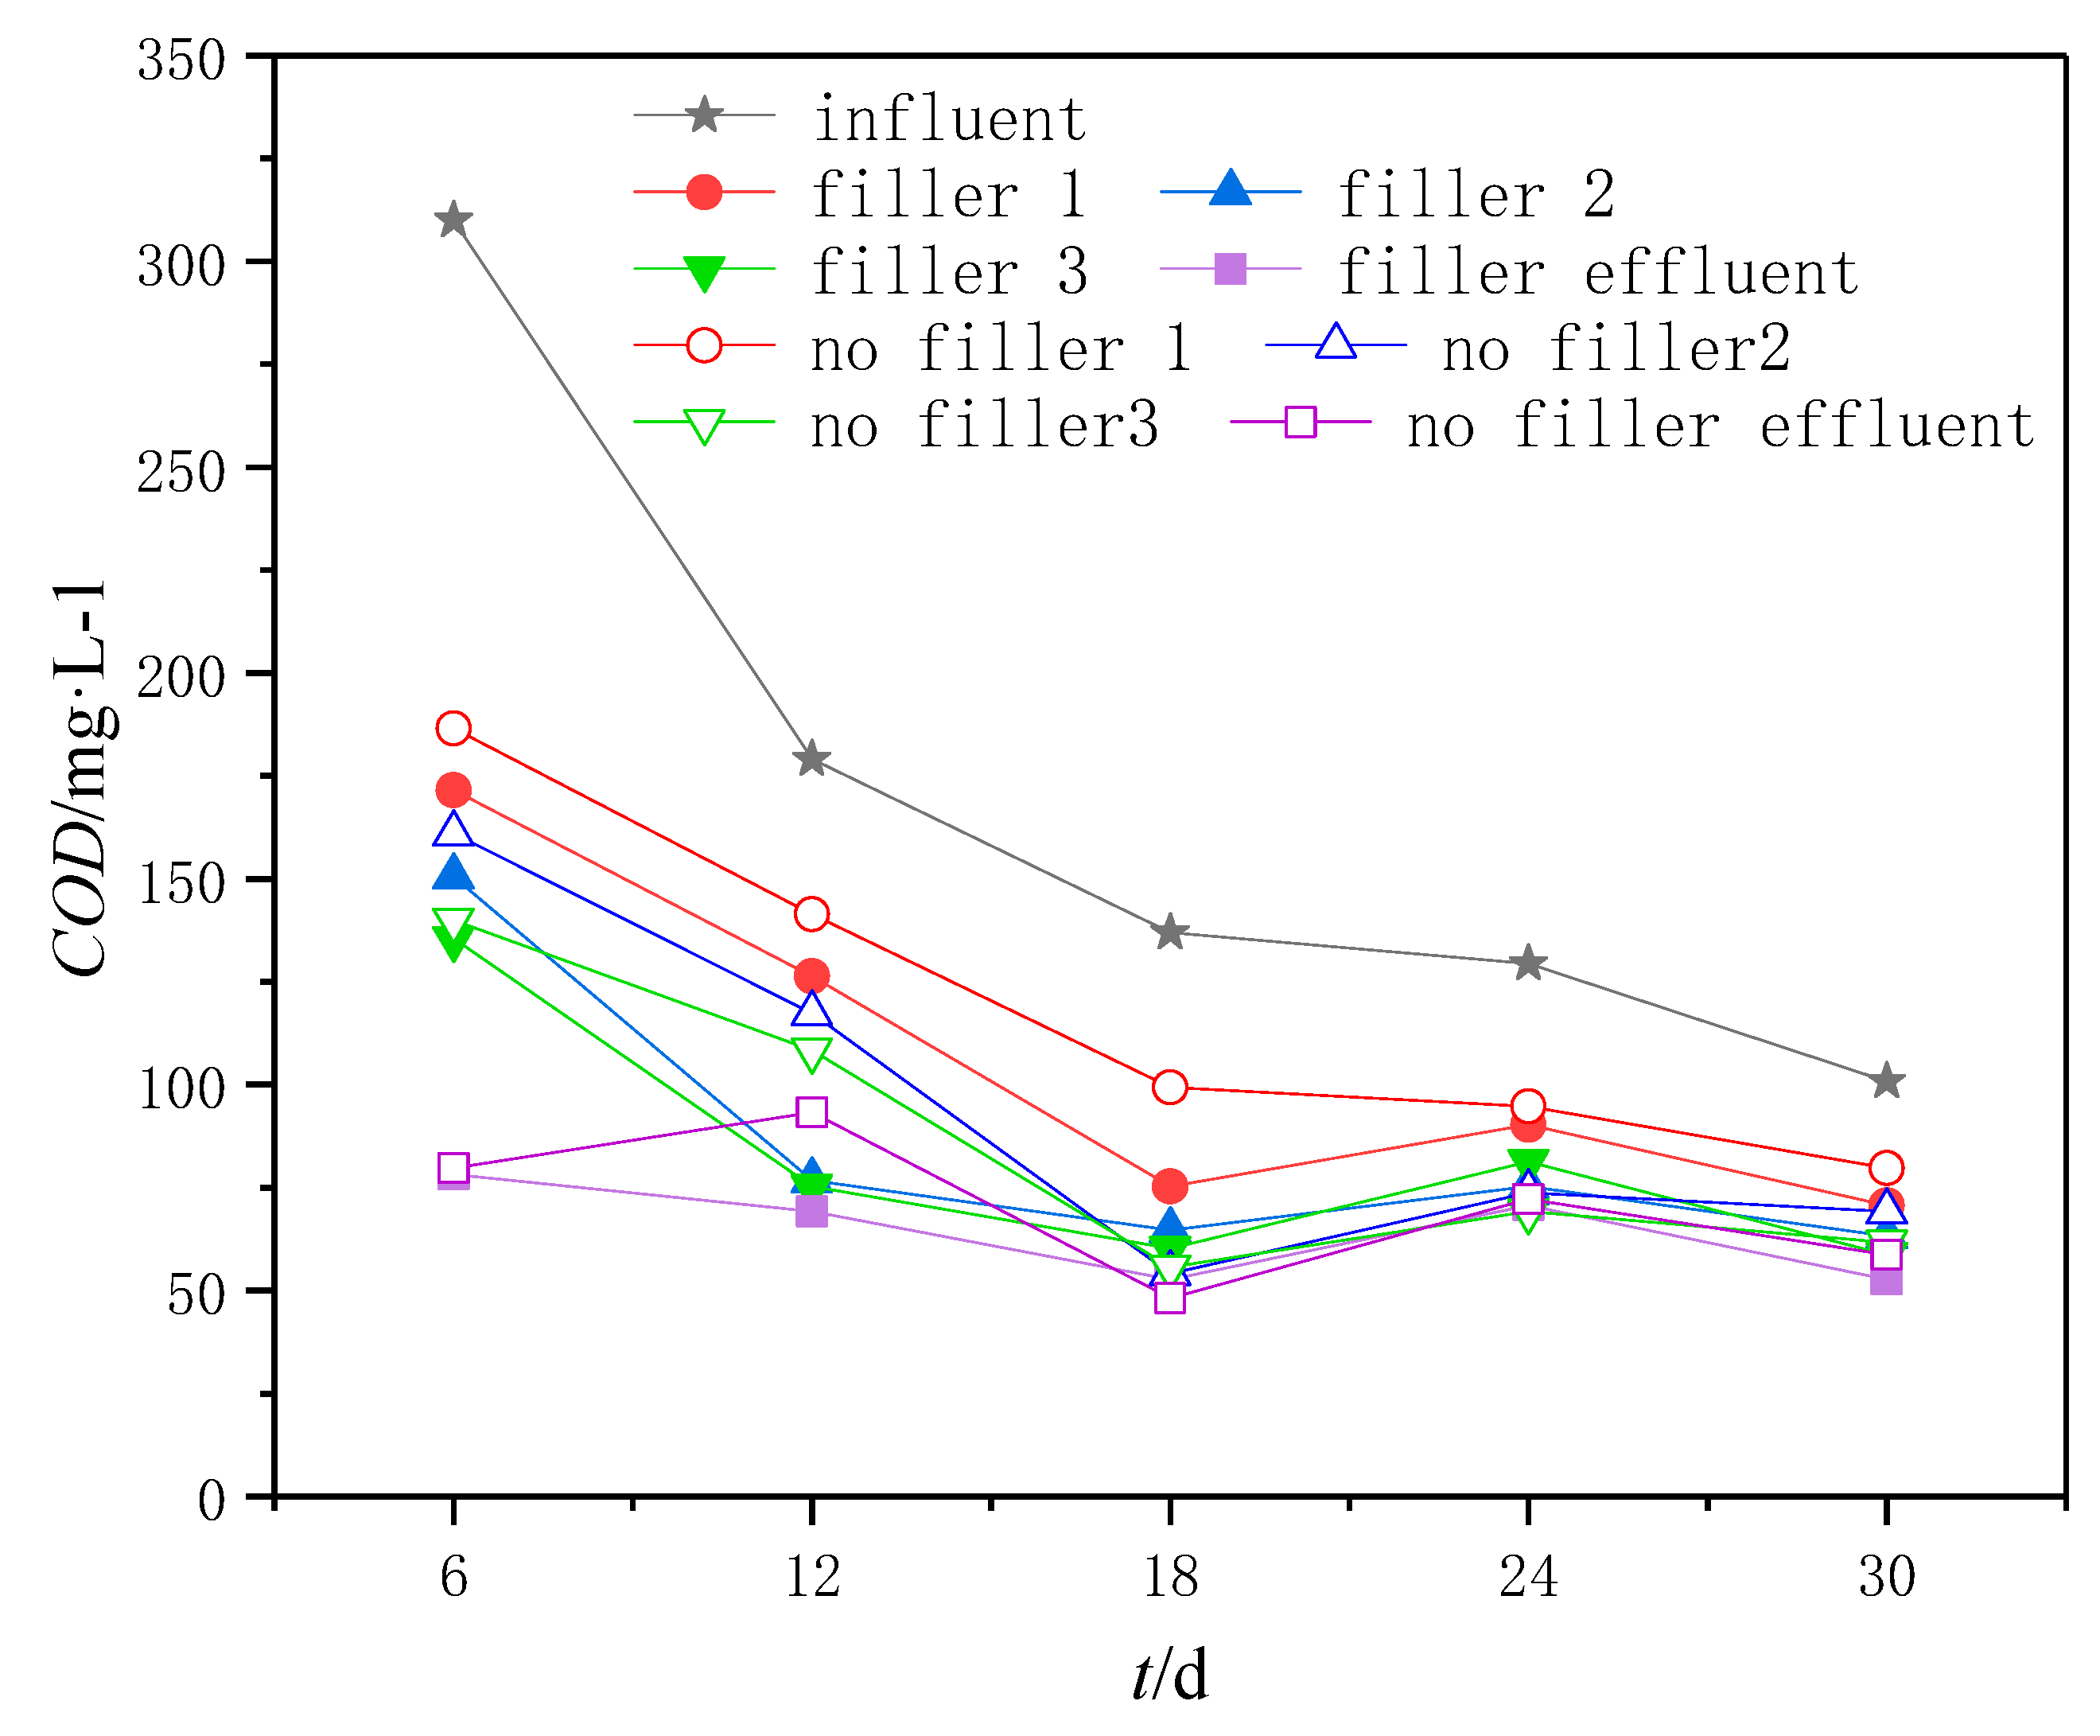
3.1. Removal Effect of COD
The concentration of COD in influent and each compartment of two groups of ABR was shown in
Figure 2. It could be seen from
Figure 2 that the COD in the influent was 100.84–310.03 mg/L, the COD in the first compartment of ABR with elastic filler and ABR without elastic filler was 70.74–171.57 mg/L and 79.77–186.62 mg/L, the COD in the second compartment was 63.21–150.50 mg/L and 54.18–161.04 mg/L, the COD in the third compartment was 58.70–135.45 mg/L and 55.69–139.97 mg/L, the COD in the effluent water was 52.68–78.26 mg/L and 48.16–93.31 mg/L. In most cases, COD in the sewage gradually decreases along the flow direction in the two ABRs, and in a few exceptions, it may be because some anaerobic microorganisms release COD through autolysis and internal respiration. The COD removal rate of the first compartment of ABR in the two groups was the highest, which was mainly because the COD in the influent was the highest, and the influent enters the first compartment first, so the anaerobic microorganism in the first compartment could preferentially utilize the COD easy to degrade in the influent.
Compared with the ABR without elastic filler, the average COD removal rate in the first compartment of the ABR with elastic filler was higher, which was mainly because the elastic filler had a good retention effect on the suspended solids and flocculent sludge in the sewage, and a certain amount of microorganisms were attached to the elastic filler, which made the biomass in the first compartment of the ABR with elastic filler increase. However, the average removal rate of COD in the second and third compartments of ABR with elastic filler was lower than that of ABR without elastic filler, which was mainly due to the high COD of sewage entering the second and third compartments of ABR without elastic filler. The average removal rate of COD in the fourth compartment of ABR in the two groups was almost the same, which was mainly due to the low COD of sewage entering the fourth compartment of ABR in the two groups.
In general, compared with the ABR without elastic filler, the average COD removal rate of ABR with elastic filler was higher by 3.55%, which showed that the elastic filler was conducive to improving the COD removal rate of ABR; this was consistent with the research results of Huang Jiguo et al. [
15].
3.2. Removal Effect of Ammonia Nitrogen
The concentration of ammonia nitrogen in influentand each compartment of two groups of ABR was shown in
Figure 3. It could be seen from
Figure 3 that the influent ammonia nitrogen was 22.56–39.95 mg/L, the ammonia nitrogen in the first compartment of ABR with elastic filler and ABR without elastic filler was 23.84–42.08 mg/L and 23.42–41.09 mg/L, the ammonia nitrogen in the second compartment was 24.41–41.80 mg/L and 22.99–41.80 mg/L, the ammonia nitrogen in the third compartment was 24.70–40.94 mg/L and 23.99–39.09 mg/L, and the ammonia nitrogen in the effluent was 24.84–41.37 mg/L and 24.27–41.37 mg/L. The ammonia nitrogen in each compartment of ABR in the two groups was higher than that in the influent, which was mainly because the organic nitrogen in the influent was converted into ammonia nitrogen under the action of ammonifying bacteria, and the anaerobic environment in the two groups of ABR hindered the further conversion of ammonia nitrogen into nitrite nitrogen and nitrate nitrogen; according to Yang Haiyinget al [
16], the organic nitrogen-containing compounds in the influent could be anaerobic decomposed into ammonia nitrogen; both groups of ABR did not discharge mud, according to RenNanqi et al. [
17],some anaerobic microorganisms through autolysis and internal digestion source respiration also released ammonia nitrogen. The average increase rate of ammonia nitrogen in the first compartment of ABR in the two groups was the highest, mainly because the organic nitrogen in the influent was the highest, and the influent entered the first compartment first, so the ammoniated bacteria in the first compartment could use the organic nitrogen in the influent preferentially.
Compared with ABR without elastic filler, the average increase rate of ammonia nitrogen in the first and second compartments of ABR with elastic filler was higher, which was mainly due to a certain amount of microorganisms attached to the elastic filler, so that the number of ammonia bacteria in the first compartment of ABR with elastic filler was increased. However, the average increase rate of ammonia nitrogen in the third and fourth compartments of ABR with elastic filler was lower than that of ABR without elastic filler, which was mainly due to the high organic nitrogen in the sewage entering the third and fourth compartments of ABR without elastic filler.
In general, compared with the ABR without elastic filler, the average ammonia nitrogenincrease rate of ABR with elastic filler was slightly higher by 0.86%, which showed that the elastic filler had little effect on the increase rate of ammonia nitrogen of ABR.
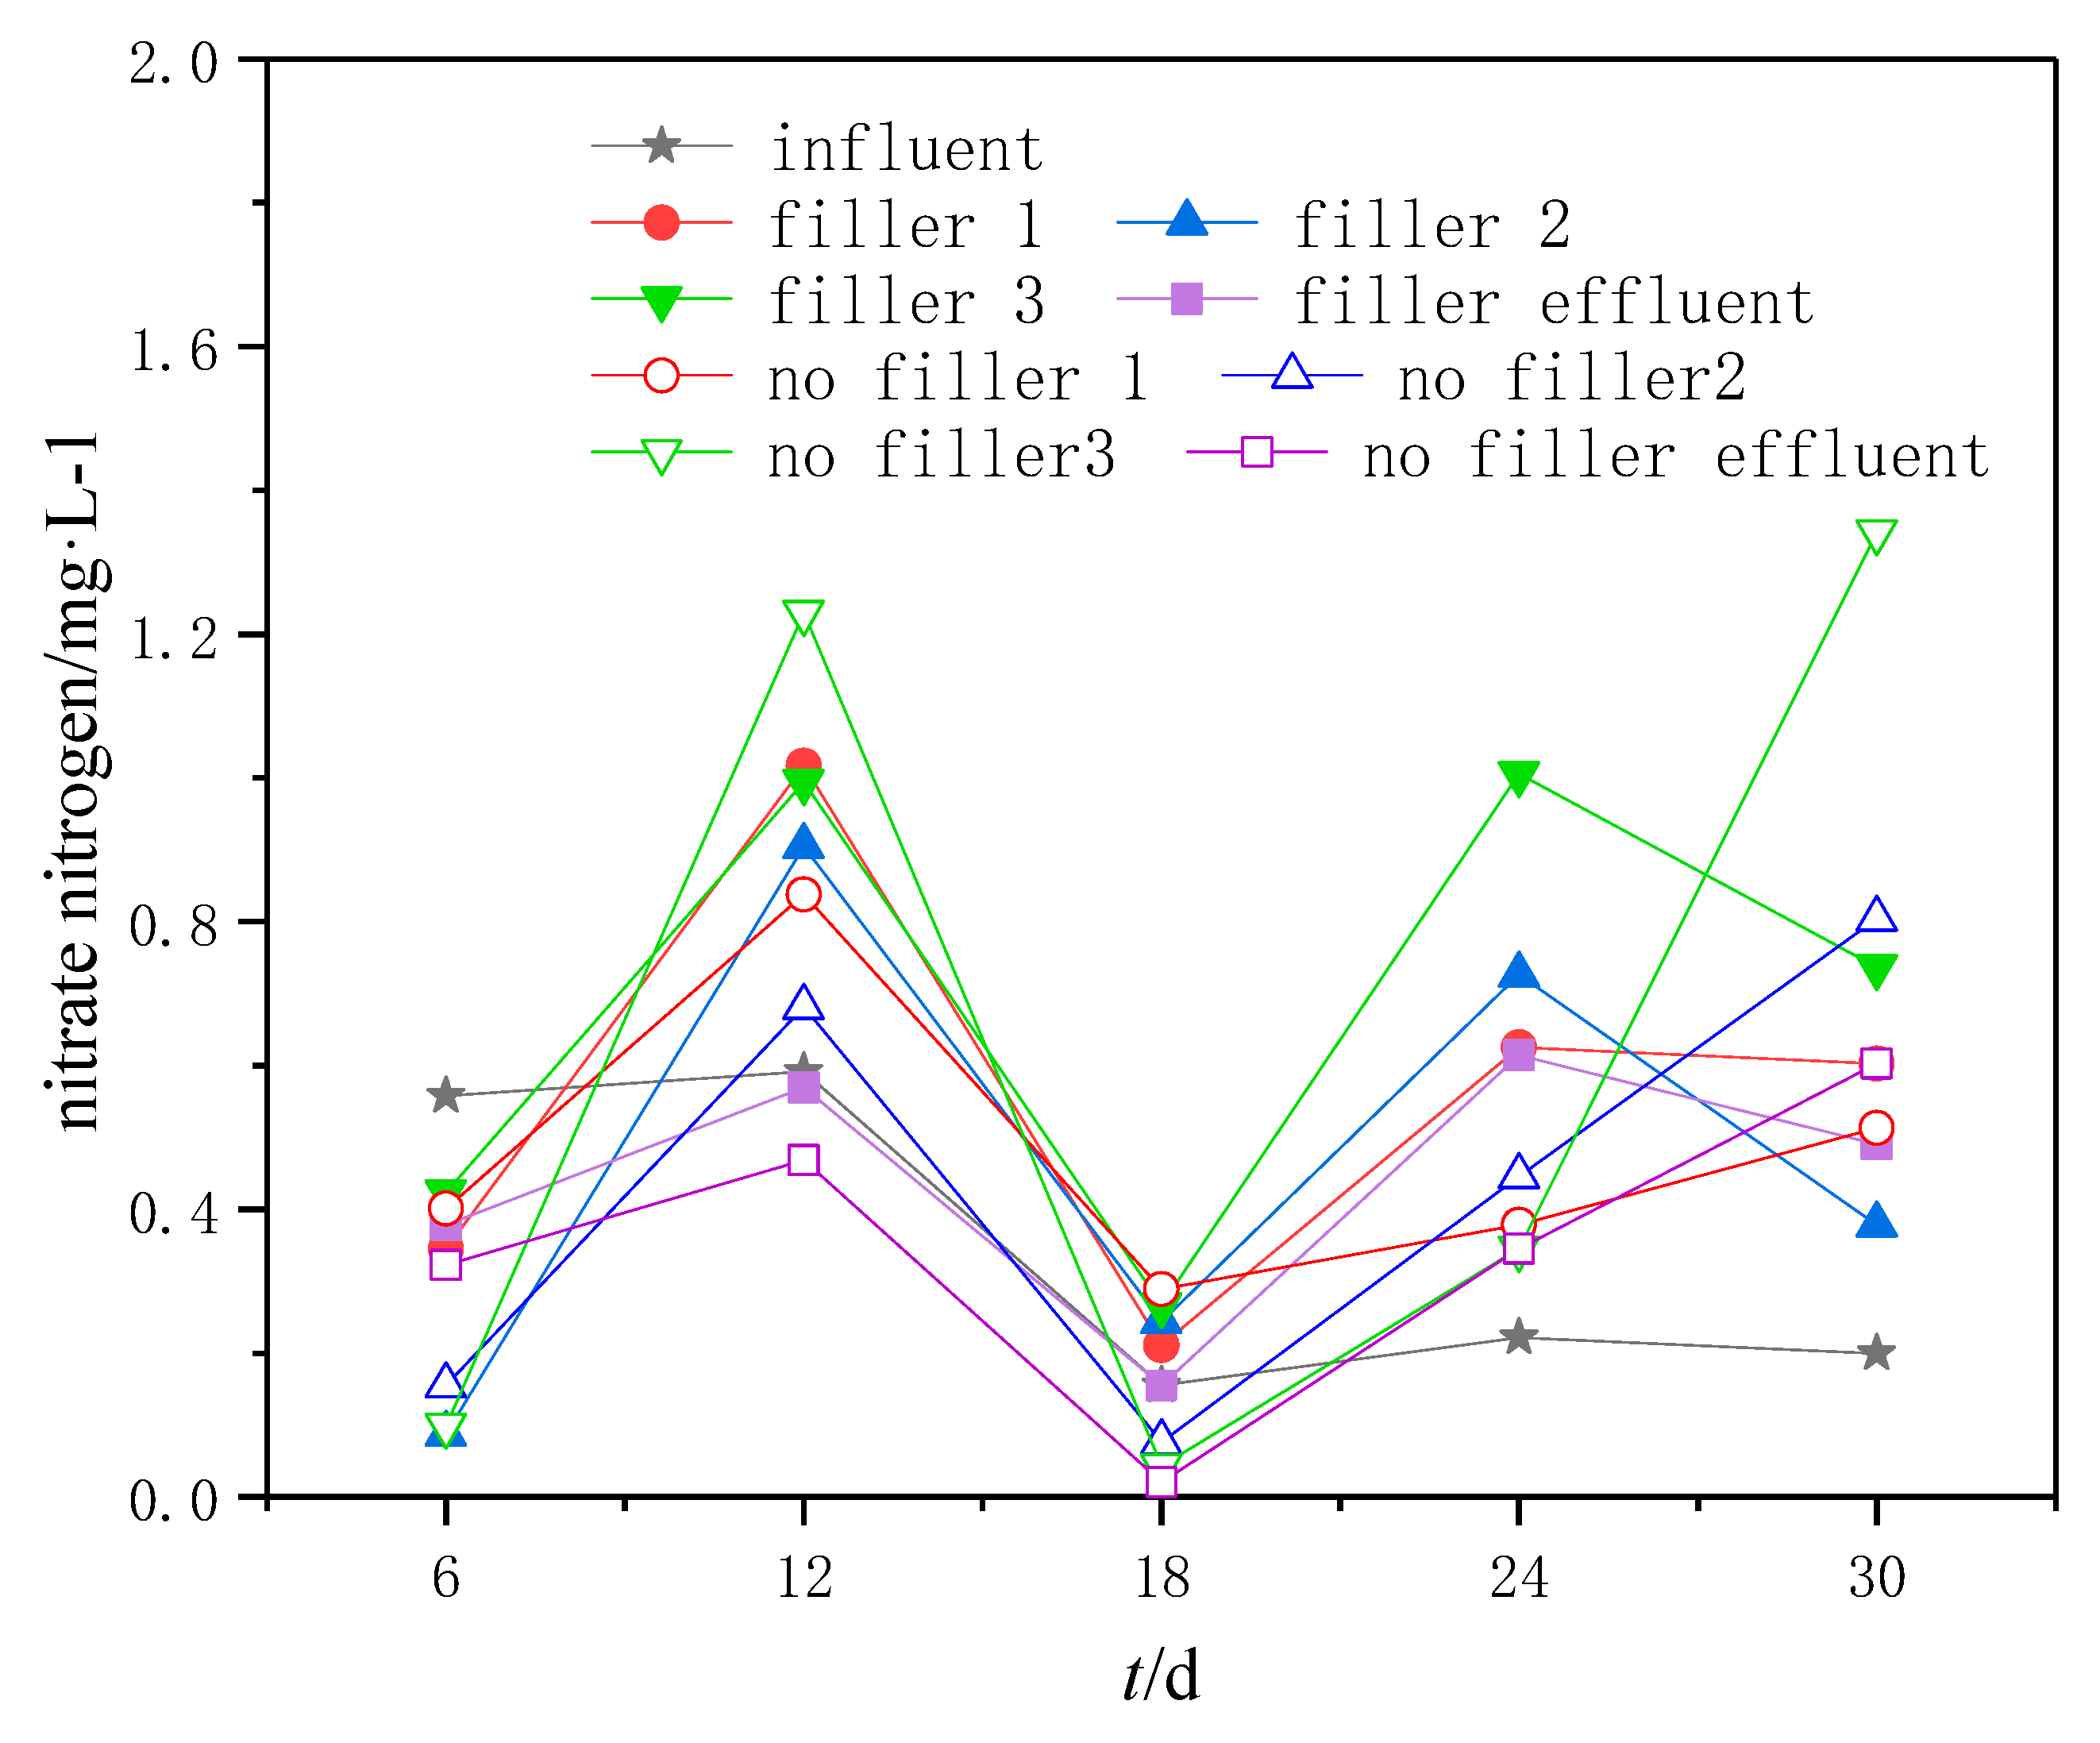
3.3. Removal Effect of Nitrate Nitrogen
The concentration of nitrate nitrogen in influentand each compartment of two groups of ABR was shown in
Figure 4. It could be seen from
Figure 4 that the influent nitrate nitrogen was 0.15–0.59 mg/L, the nitrate nitrogen in the first compartment of ABR with elastic filler and ABR without elastic filler was 0.21–1.02 mg/L and 0.29–0.84 mg/L, the nitrate nitrogen in the second compartment was 0.09–0.91 mg/L and 0.08–0.80 mg/L, the nitrate nitrogen in the third compartment was 0.27–1.01 mg/L and 0.04–1.34 mg/L, and the nitrate nitrogen in the effluent was 0.02–0.60 mg/L and 0.15–0.61 mg/L. Although the nitrate nitrogen in each compartment of ABR in both groups fluctuated slightly, the difference between them and the influent was very small, which was mainly because the anaerobic environment in ABR prevented the further conversion of ammonia nitrogen to nitrate nitrogen. However, before and after the 18th day, the nitrate nitrogen in each compartment of ABR in the two groups fluctuated greatly, which was mainlydue to the low concentration of nitrate nitrogen in the influent on the 18th day, which leads to the low concentration of nitrate nitrogen in ABR; however, after the 18th day, the concentration of nitrate nitrogen in the influent increased, and the fluctuation of dissolved oxygen in the influent and the destruction of the water seal of ABR effluent increased the dissolved oxygen in ABR, thus enhancing the nitrification in ABR, resulting in the rise of nitrate nitrogen concentration in ABR again.
In general, the difference between the two groups of ABR was very small, which showed that elastic fillers had little effect on the removal rate of ABR.
3.5. Removal Effect of Total Nitrogen
The concentration of total nitrogen in influentand each compartment of two groups of ABR was shown in
Figure 6. It could be seen from
Figure 6 that the influent total nitrogen was 24.91–45.37 mg/L, the total nitrogen in the first compartment of ABR with elastic filler and ABR without elastic filler was 25.61–43.71 mg/L and 25.37–43.87 mg/L, the total nitrogen in the second compartment was 25.53–43.12 mg/L and 25.37–43.12 mg/L, the total nitrogen in the third compartment was 26.11–42.54 mg/L and 26.03–42.38 mg/L, and the total nitrogen in the effluent was 25.74–42.30 mg/L and 25.66–42.12 mg/L. The removal rate of total nitrogen in each compartment of the two ABR groups was not high, which was mainly due to the lack of nitrogen demand for the growth and reproduction of anaerobic microorganisms, and the nitrogen in the influent was mainly organic nitrogen and ammonia nitrogen, which were converted into ammonia nitrogen under the action of ammonifying bacteria, while the anaerobic environment in the two ABR groups hindered the further conversion of ammonia nitrogen into nitrite nitrogen and nitrate nitrogen, leading to the traditional nitrification and denitrification and the new anaerobic ammonia oxidation denitrification process could not be carried out smoothly in ABR. The total nitrogen removal rate in each compartment of ABR in the two groups was negative, thiswas consistent with the research results of Yang Haiying et al. [
16], which may be because the organic nitrogen compounds in the influent were decomposed into ammonia nitrogen, and the ABR in both groups did not discharge mud. According to RenNanqi et al. [
17], some anaerobic microorganisms would release ammonia nitrogen through autolysis and internal respiration.
In general, compared with the ABR without elastic filler, the average nitrogen removal rate of ABR with elastic filler was slightly lower by 0.96%, which showed that the elastic filler had little effect on the total nitrogen removal rate of ABR, so that the nitrogen in sewage is fully retained, which was conducive to the use of treated effluent for farmland irrigation.
3.6. Removal Effect of Total Phosphorus
The concentration of total phosphorus in influentand each compartment of two groups of ABR was shown in
Figure 7. It could be seen from
Figure 7 that the influent total phosphorus was 2.45–4.75 mg/L, the total phosphorus in the first compartment of ABR with elastic filler and ABR without elastic filler was 2.42–4.26 mg/L and 2.38–4.29 mg/L, the total phosphorus in the second compartment was 2.49–4.15 mg/L and 2.35–4.12 mg/L, the total phosphorus in the third compartment was 2.42–4.04 mg/L and 2.45–4.01 mg/L, and the total phosphorus in the effluent was 2.38–3.90 mg/L and 2.35–3.83 mg/L. The removal rate of total phosphorus in each compartment of ABR in the two groups was not high, which was mainly because the growth and reproduction of anaerobic microorganisms had little demand for phosphorus, and the anaerobic environment in the two groups of ABR caused the traditional phosphorus removal process could not be carried out smoothly. The removal rate of total phosphorus in each compartment of ABR in the two groups was negative. This was consistent with the research results of Yang Haiying et al. [
16], which may be due to the release of phosphorus by phosphorus accumulating bacteria under anaerobic conditions, and the two groups of ABR did not discharge mud, and some anaerobic microorganisms also released phosphorus through autolysis and internal respiration.
In general, compared with the ABR without elastic filler, the average total phosphorus removal rate of ABR with elastic filler was slightly lower by 1.39%, which indicated that the elastic filler had little effect on the total phosphorus removal rate of ABR, so the phosphorus in the sewage was fully retained, which was conducive to the use of the treated effluent for farmland irrigation.
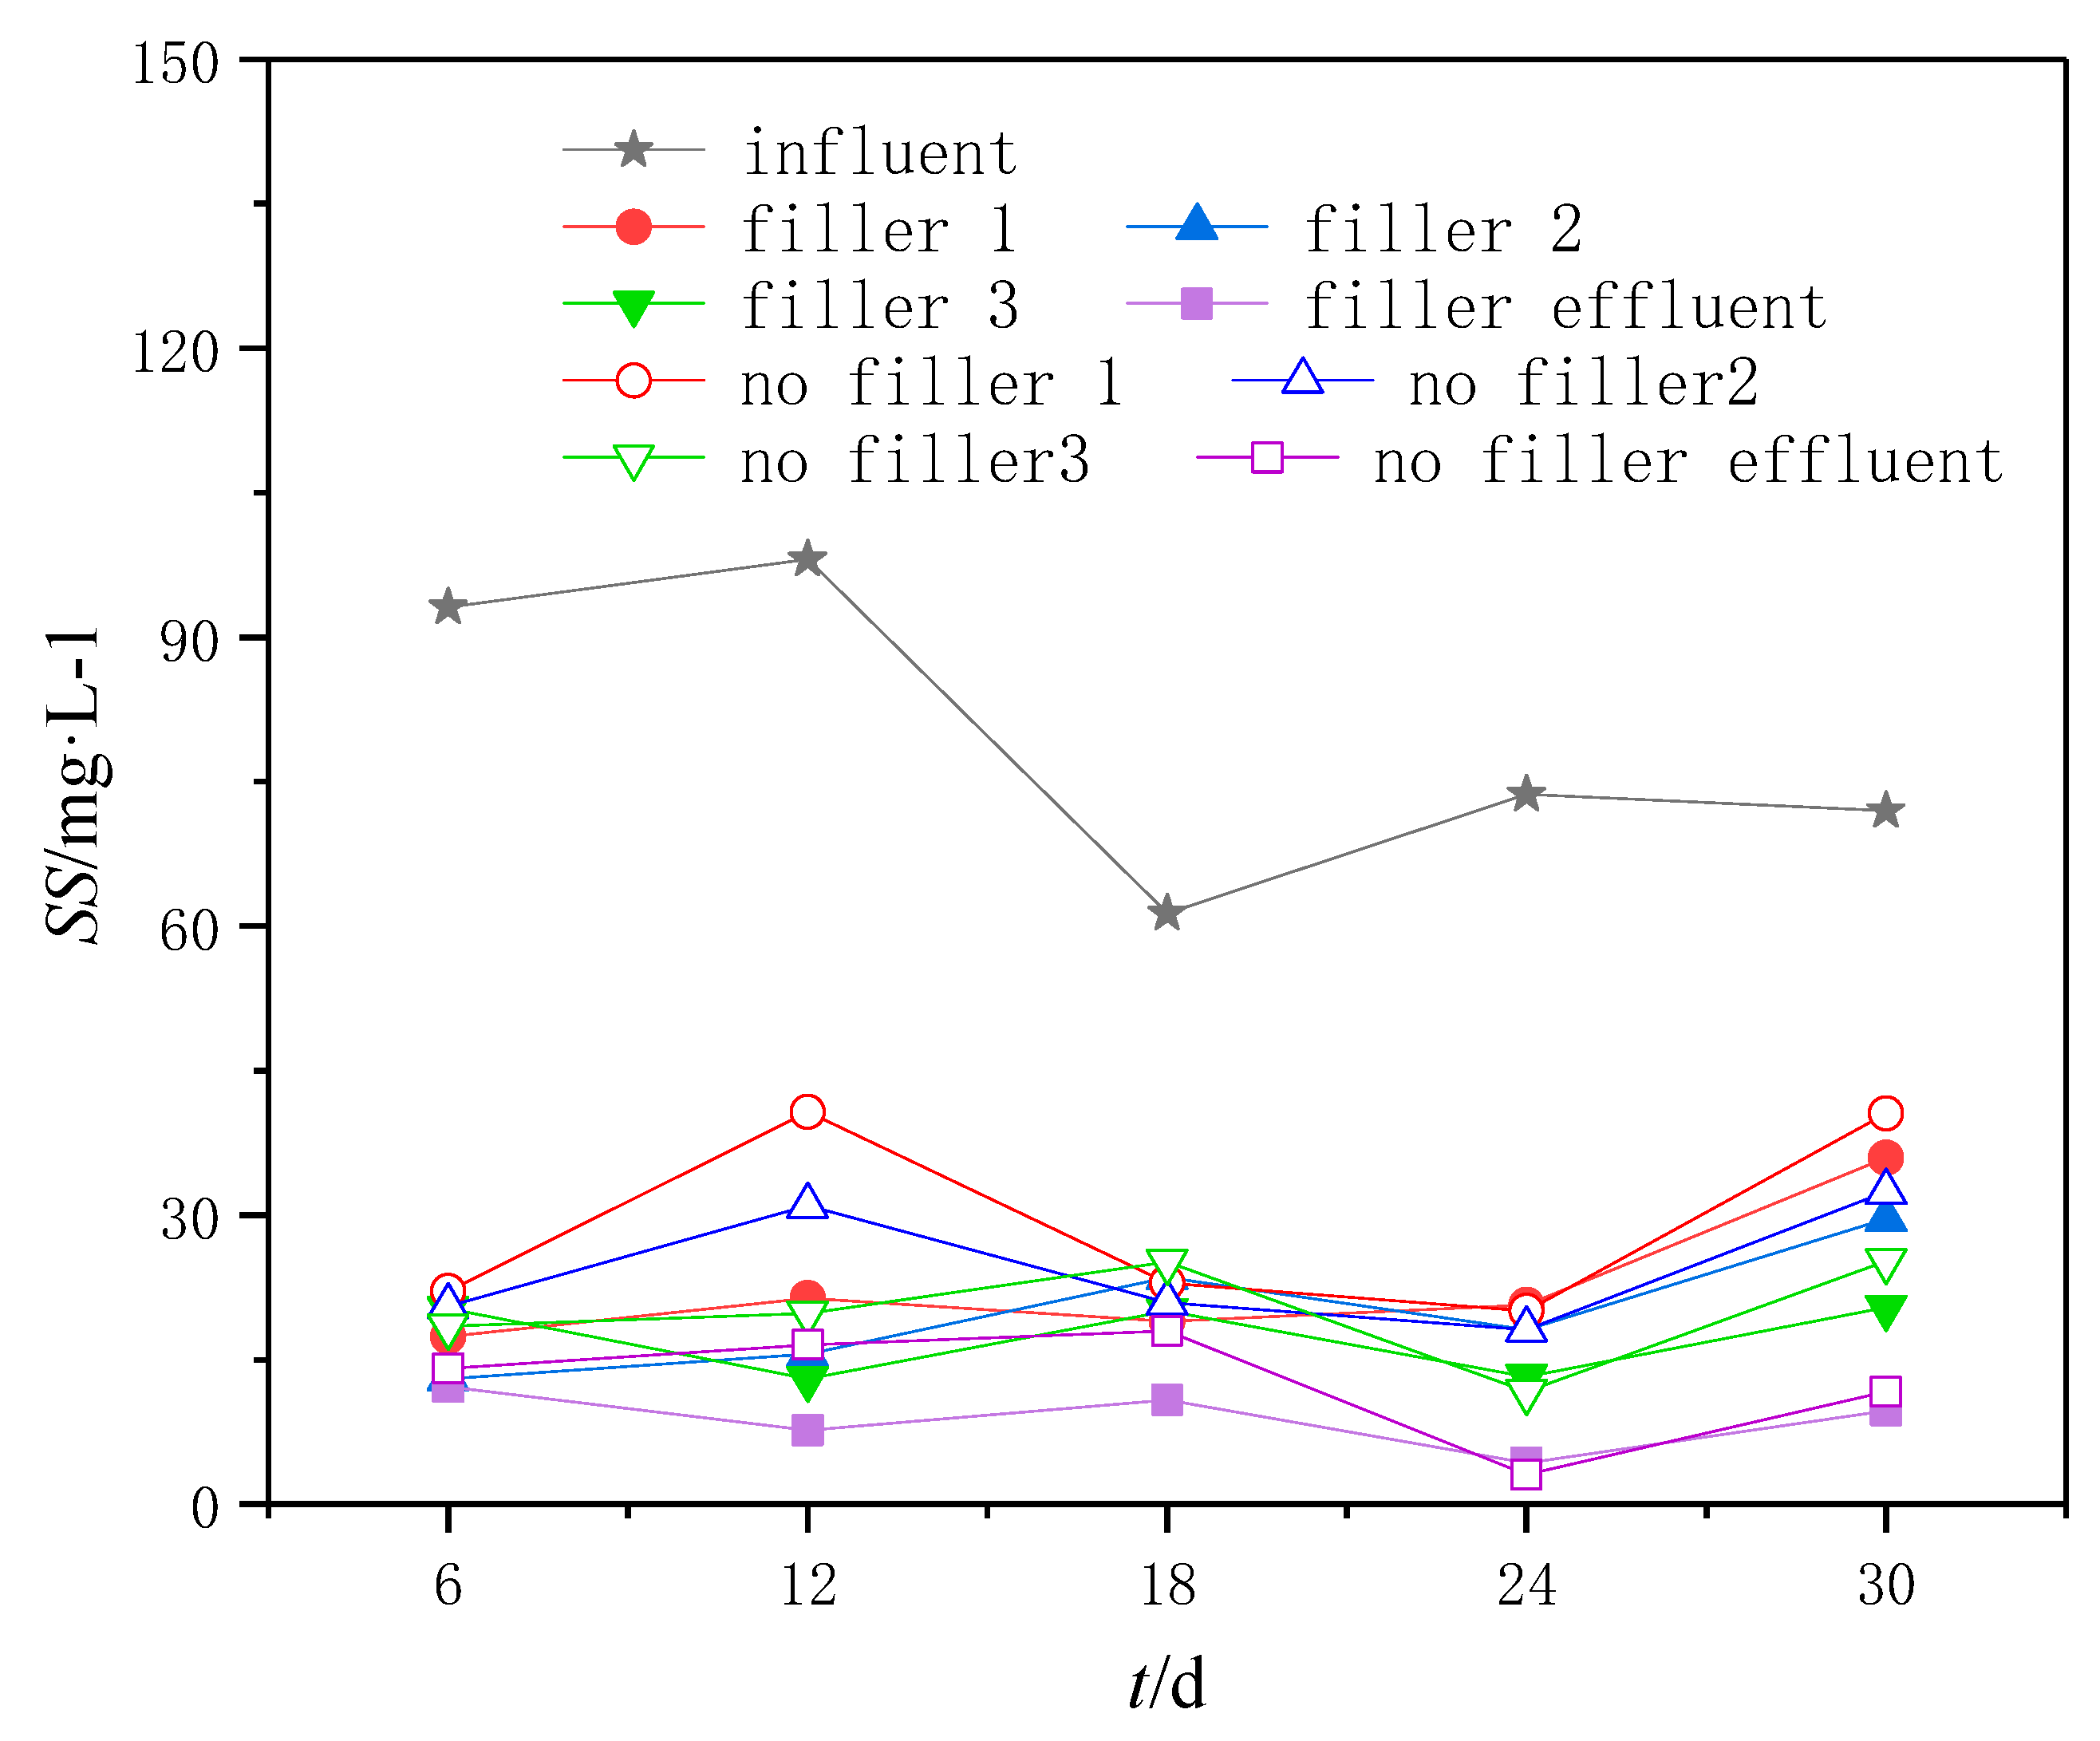
3.7. Removal Effect of SS
The concentration of SS in influentand each compartment of two groups of ABR was shown in
Figure 8. It could be seen from
Figure 8 that the influent SS was 61.31–98.08 mg/L, the SS in the first compartment of ABR with elastic filler and ABR without elastic filler was 17.39-35.95 mg/L and 20.06–40.68 mg/L, the SS in the second compartment was 13.02–29.64 mg/L and 18.11–32.43 mg/L, the SS in the third compartment was 13.02–20.42 mg/L and 11.68–25.27 mg/L, and the SS in the effluent was 4.28–12.17 mg/L and 3.07–17.99 mg/L. In most cases, SS in sewage gradually decreased along the flow direction in the two ABRs, and in a few exceptions, it may be because some anaerobic microorganisms released SS through autolysis and internal respiration. The removal rate of SS in the first compartment of ABR in the two groups was the highest, mainly because the SS in the influent was the highest, and the influent entered the first compartment first, so the anaerobic microorganism in the first compartment could take advantage of the SS in the influent preferentially.
Compared with the ABR without elastic filler, the average SS removal rate in the first compartment of the ABR with elastic filler was higher, which was mainly because the elastic filler had a good retention effect on the suspended solids and flocculent sludge in the sewage [
15]. However, the average removal rate of SS in the second and third compartments of ABR with elastic filler was lower than that of ABR without elastic filler, which was mainly due to the high SS in the second and third compartments of ABR without elastic filler. The average removal rate of SS in the fourth compartment of ABR in the two groups was almost the same, which was mainly due to the low SS of sewage entering the fourth compartment of ABR in the two groups.
In general, compared with the ABR without elastic filler, the average SS removal rate of ABR with elastic filler was higher by 4.77%, which showed that the elastic filler was conducive to improving the SS removal rate of ABR, thiswas consistent with the research results of Huang Jiguo et al [
15].
3.8. Type and Content of VFA
The type and content of VFA in influentand each compartment of two groups of ABR were shown in
Figure 9. It could be seen from
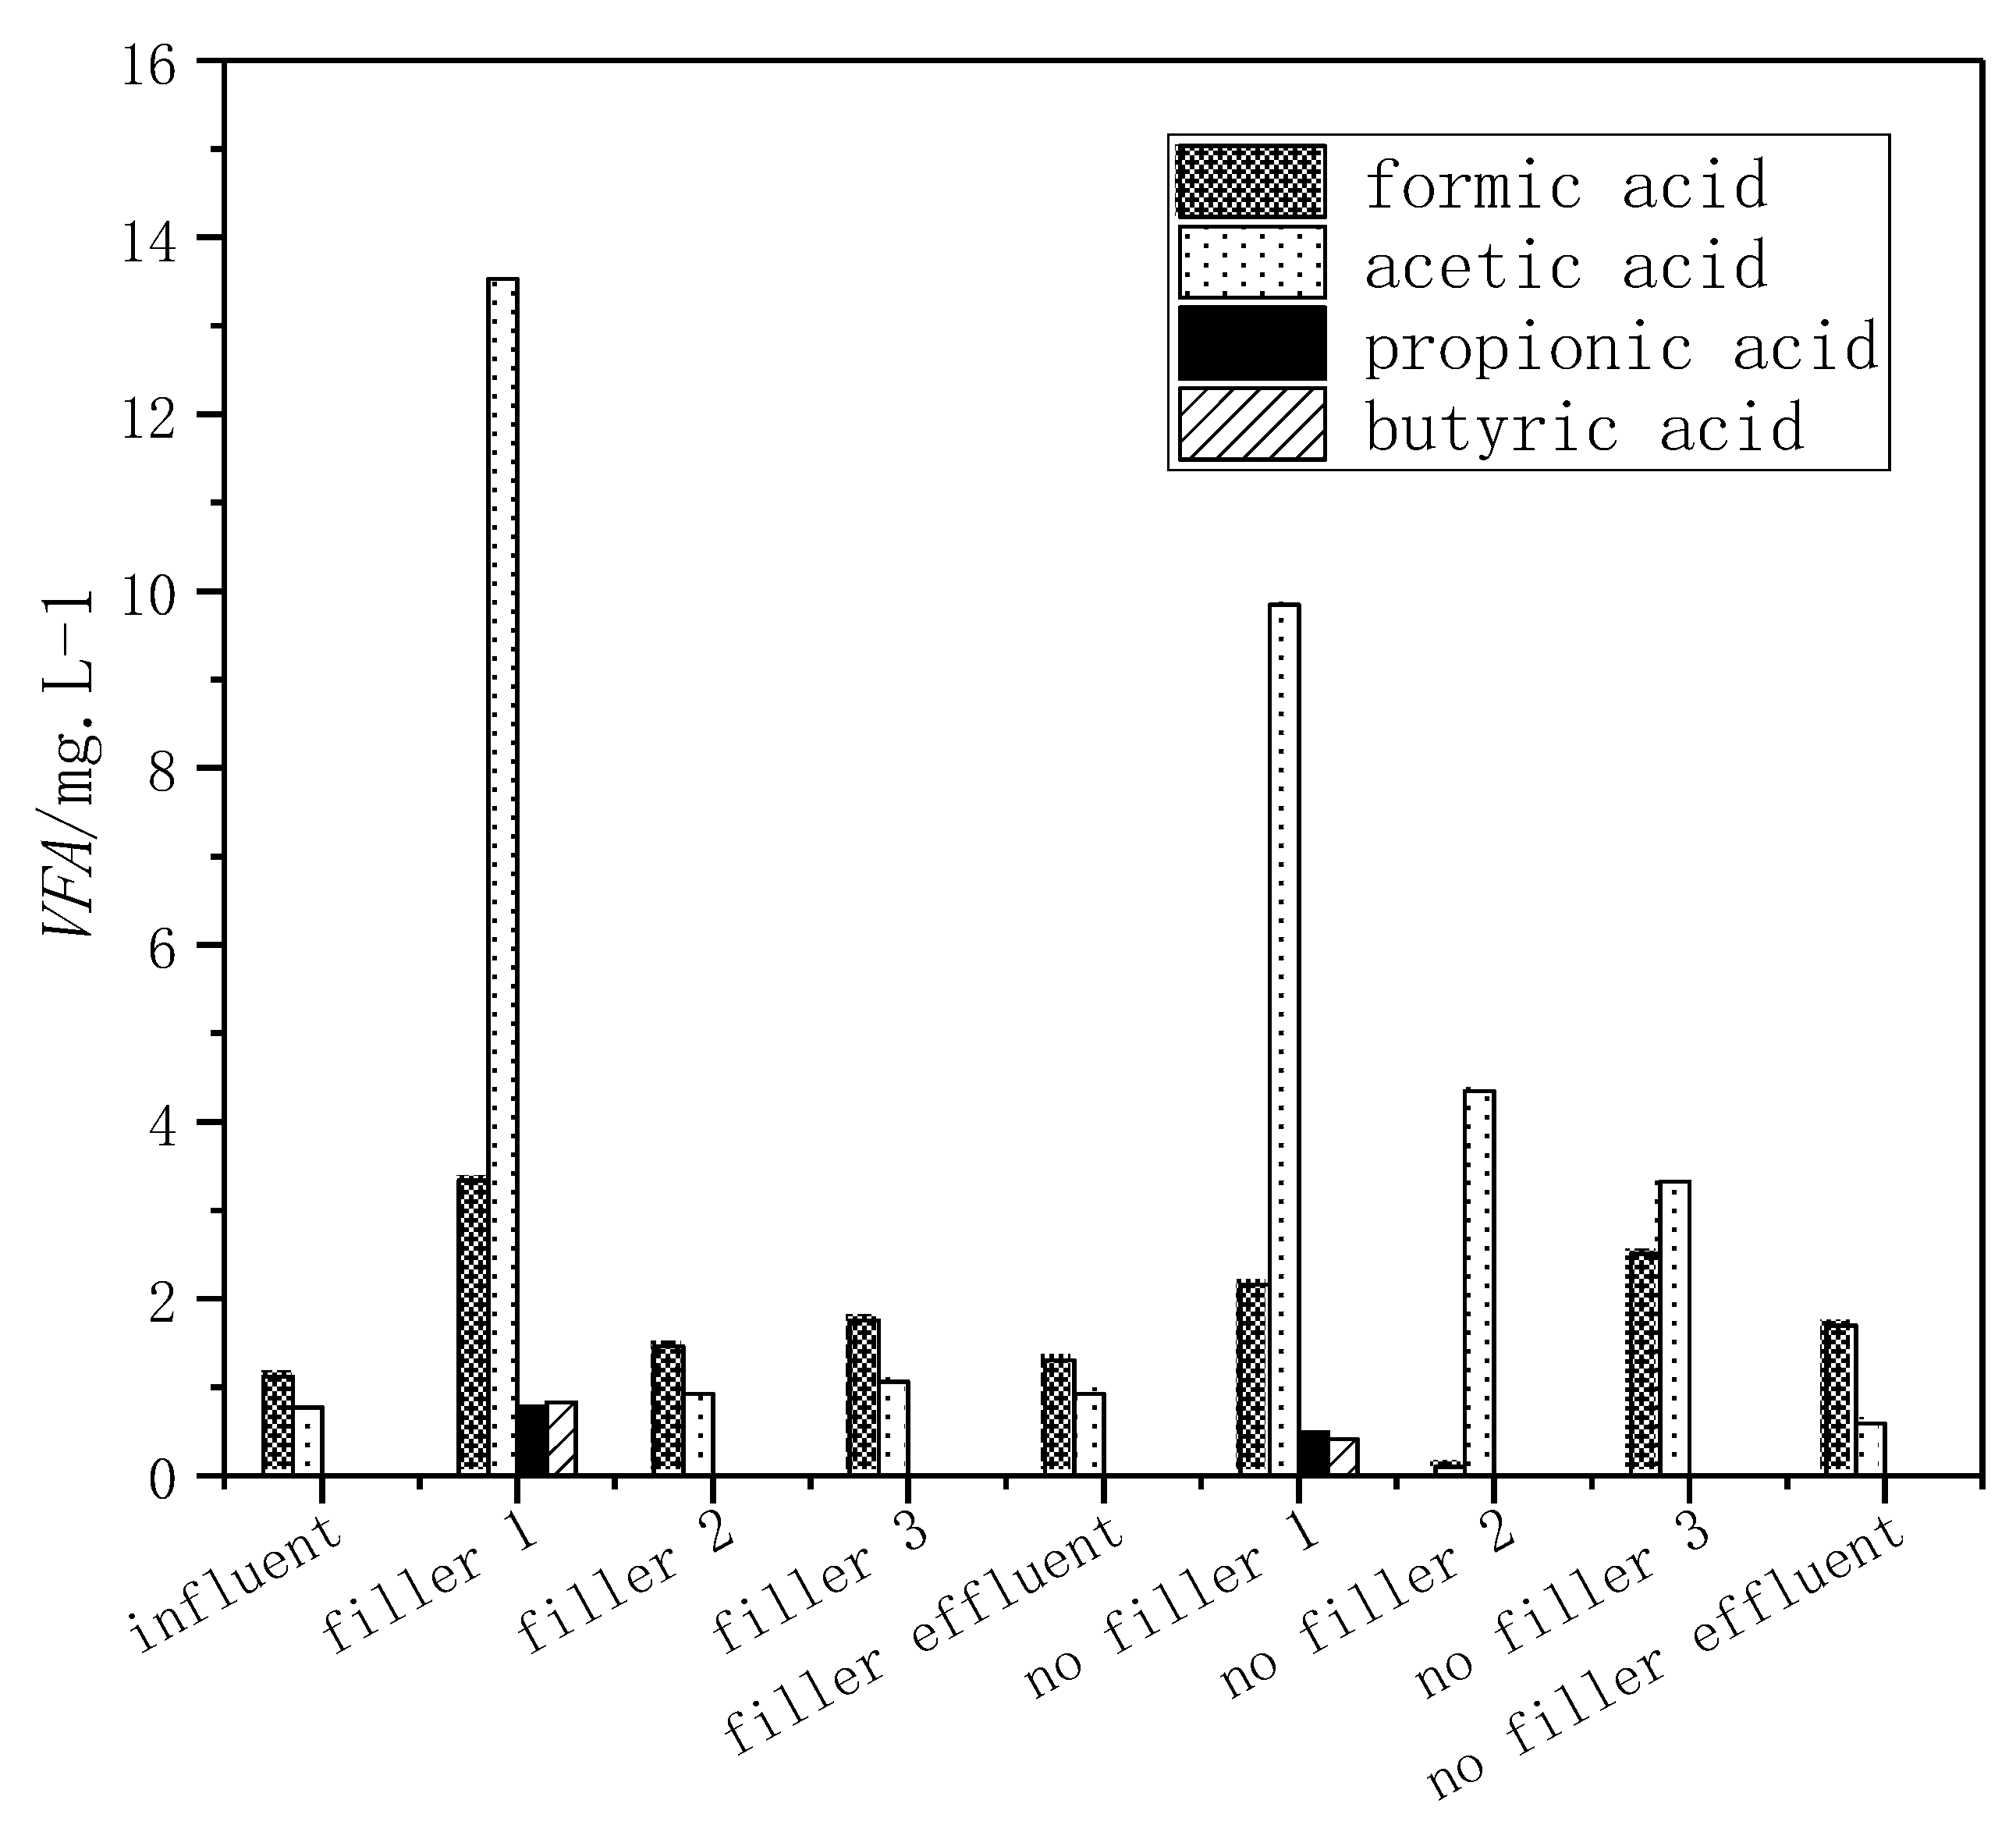
Figure 9 that only formic acid and acetic acid were present in the influent, and their concentrations were 1.12 mg/L and 0.77 mg/L. The concentrations of formic acid and acetic acid in the influent were relatively low, while propionic acid and butyric acid (detection limit is 0.1 mg/L) were not detected.
The concentrations of formic acid, acetic acid, propionic acid and butyric acid in the first compartment of ABR without elastic filler were 2.16 mg/L, 9.85 mg/L, 0.49 mg/L, and 0.41 mg/L. Compared with the influent, the concentration of formic acid and acetic acid in the first compartment of ABR without elastic filler increased significantly, but propionic acid and butyric acid also appeared, which was mainly due to the fact that the hydrolytic fermentation bacteria in the first compartment of ABR without elastic filler, as the dominant bacteria, could transform the complex organic matter in the influent into formic acid, acetic acid, propionic acid and butyric acid [
18]. In the second compartment of ABR without elastic filler, there were only formic acid and acetic acid, their concentrations were 0.10 mg/L and 4.35 mg/L. Compared with the first compartment of ABR without elastic filler, the concentration of formic acid and acetic acid in the second compartment of ABR without elastic filler was significantly reduced, and propionic acid and butyric acid were not detected, which was mainly due to the change of acetobacter and methanogenic bacteria in the second compartment of ABR without elastic filler as the dominant bacteria, hydrogen producing acetobacter first converted propionic acid, butyric acid and alcohol in sewage into hydrogen, carbon dioxide, formic acid, acetic acid and methanol, and then converted hydrogen, carbon dioxide, formic acid, acetic acid, and methanol in sewage into methane and carbon dioxide [
18]. There were only formic acid and acetic acid in the third compartment of ABR without elastic filler, the concentrations of which were 2.51 mg/L and 3.33 mg/L. Compared with the second compartment of ABR without elastic filler, the formic acid concentration in the third compartment of ABR without elastic filler was increased, but the acetic acid concentration was decreased, which may be due to the fact that there were less the same type of acetic acid producing bacteria in the third compartment of ABR without elastic filler, and less the same type of acetic acid producing bacteria did not convert the formic acid in the sewage to acetic acid in time, which leaded to the accumulation of formic acid and excessive consumption of acetic acid by methanogens [
18]. There were only formic acid and acetic acid in the effluent of ABR without elastic filler, and their concentrations were 1.70 mg/L and 0.59 mg/L. Compared with the third compartment of ABR without elastic filler, the concentration of formic acid and acetic acid in the effluent of ABR without elastic filler was decreased, which showed that methanogenic bacteria in the fourth compartment of ABR without elastic filler was slightly dominant.
However, the concentrations of formic acid, acetic acid, propionic acid and butyric acid in the first compartment of ABR with elastic filler were 3.34 mg/L, 13.53 mg/L, 0.78 mg/L, and 0.83 mg/L. Compared with the first compartment of ABR without elastic filler, the concentrations of formic acid, acetic acid, propionic acid and butyric acid in the first compartment of ABR with elastic filler increased slightly, which may be due to the increase of biomass in the first compartment of ABR with elastic filler, thus, the abundance of hydrolytic fermentation bacteria in the first compartment of ABR with elastic filler was increased, more complex organics in the influent were transformed into formic acid, acetic acid, propionic acid and butyric acid. Compared with the second, third and fourth compartments of ABR without elastic filler, the total concentration of formic acid and acetic acid in the second, third and fourth compartments of ABR with elastic filler decreased slightly, which may be due to the increase of biomass in the second, third and fourth compartments of ABR with elastic filler, thus increasing the abundance of methanogenic bacteria in the second, third and fourth compartments of ABR with elastic filler, so more formic acid and acetic acid in sewage were converted into methanogen Alkanes, carbon dioxide, etc.
3.9. Three-Dimensional Fluorescence Spectral Characteristics of DOM
3.9.1. DOM Three-Dimensional Fluorescence Spectrum and Composition
The three-dimensional fluorescence spectrum of influentand each compartment of two groups of ABR were shown in
Table 1 and
Figure 10. It could be seen from
Table 1 and
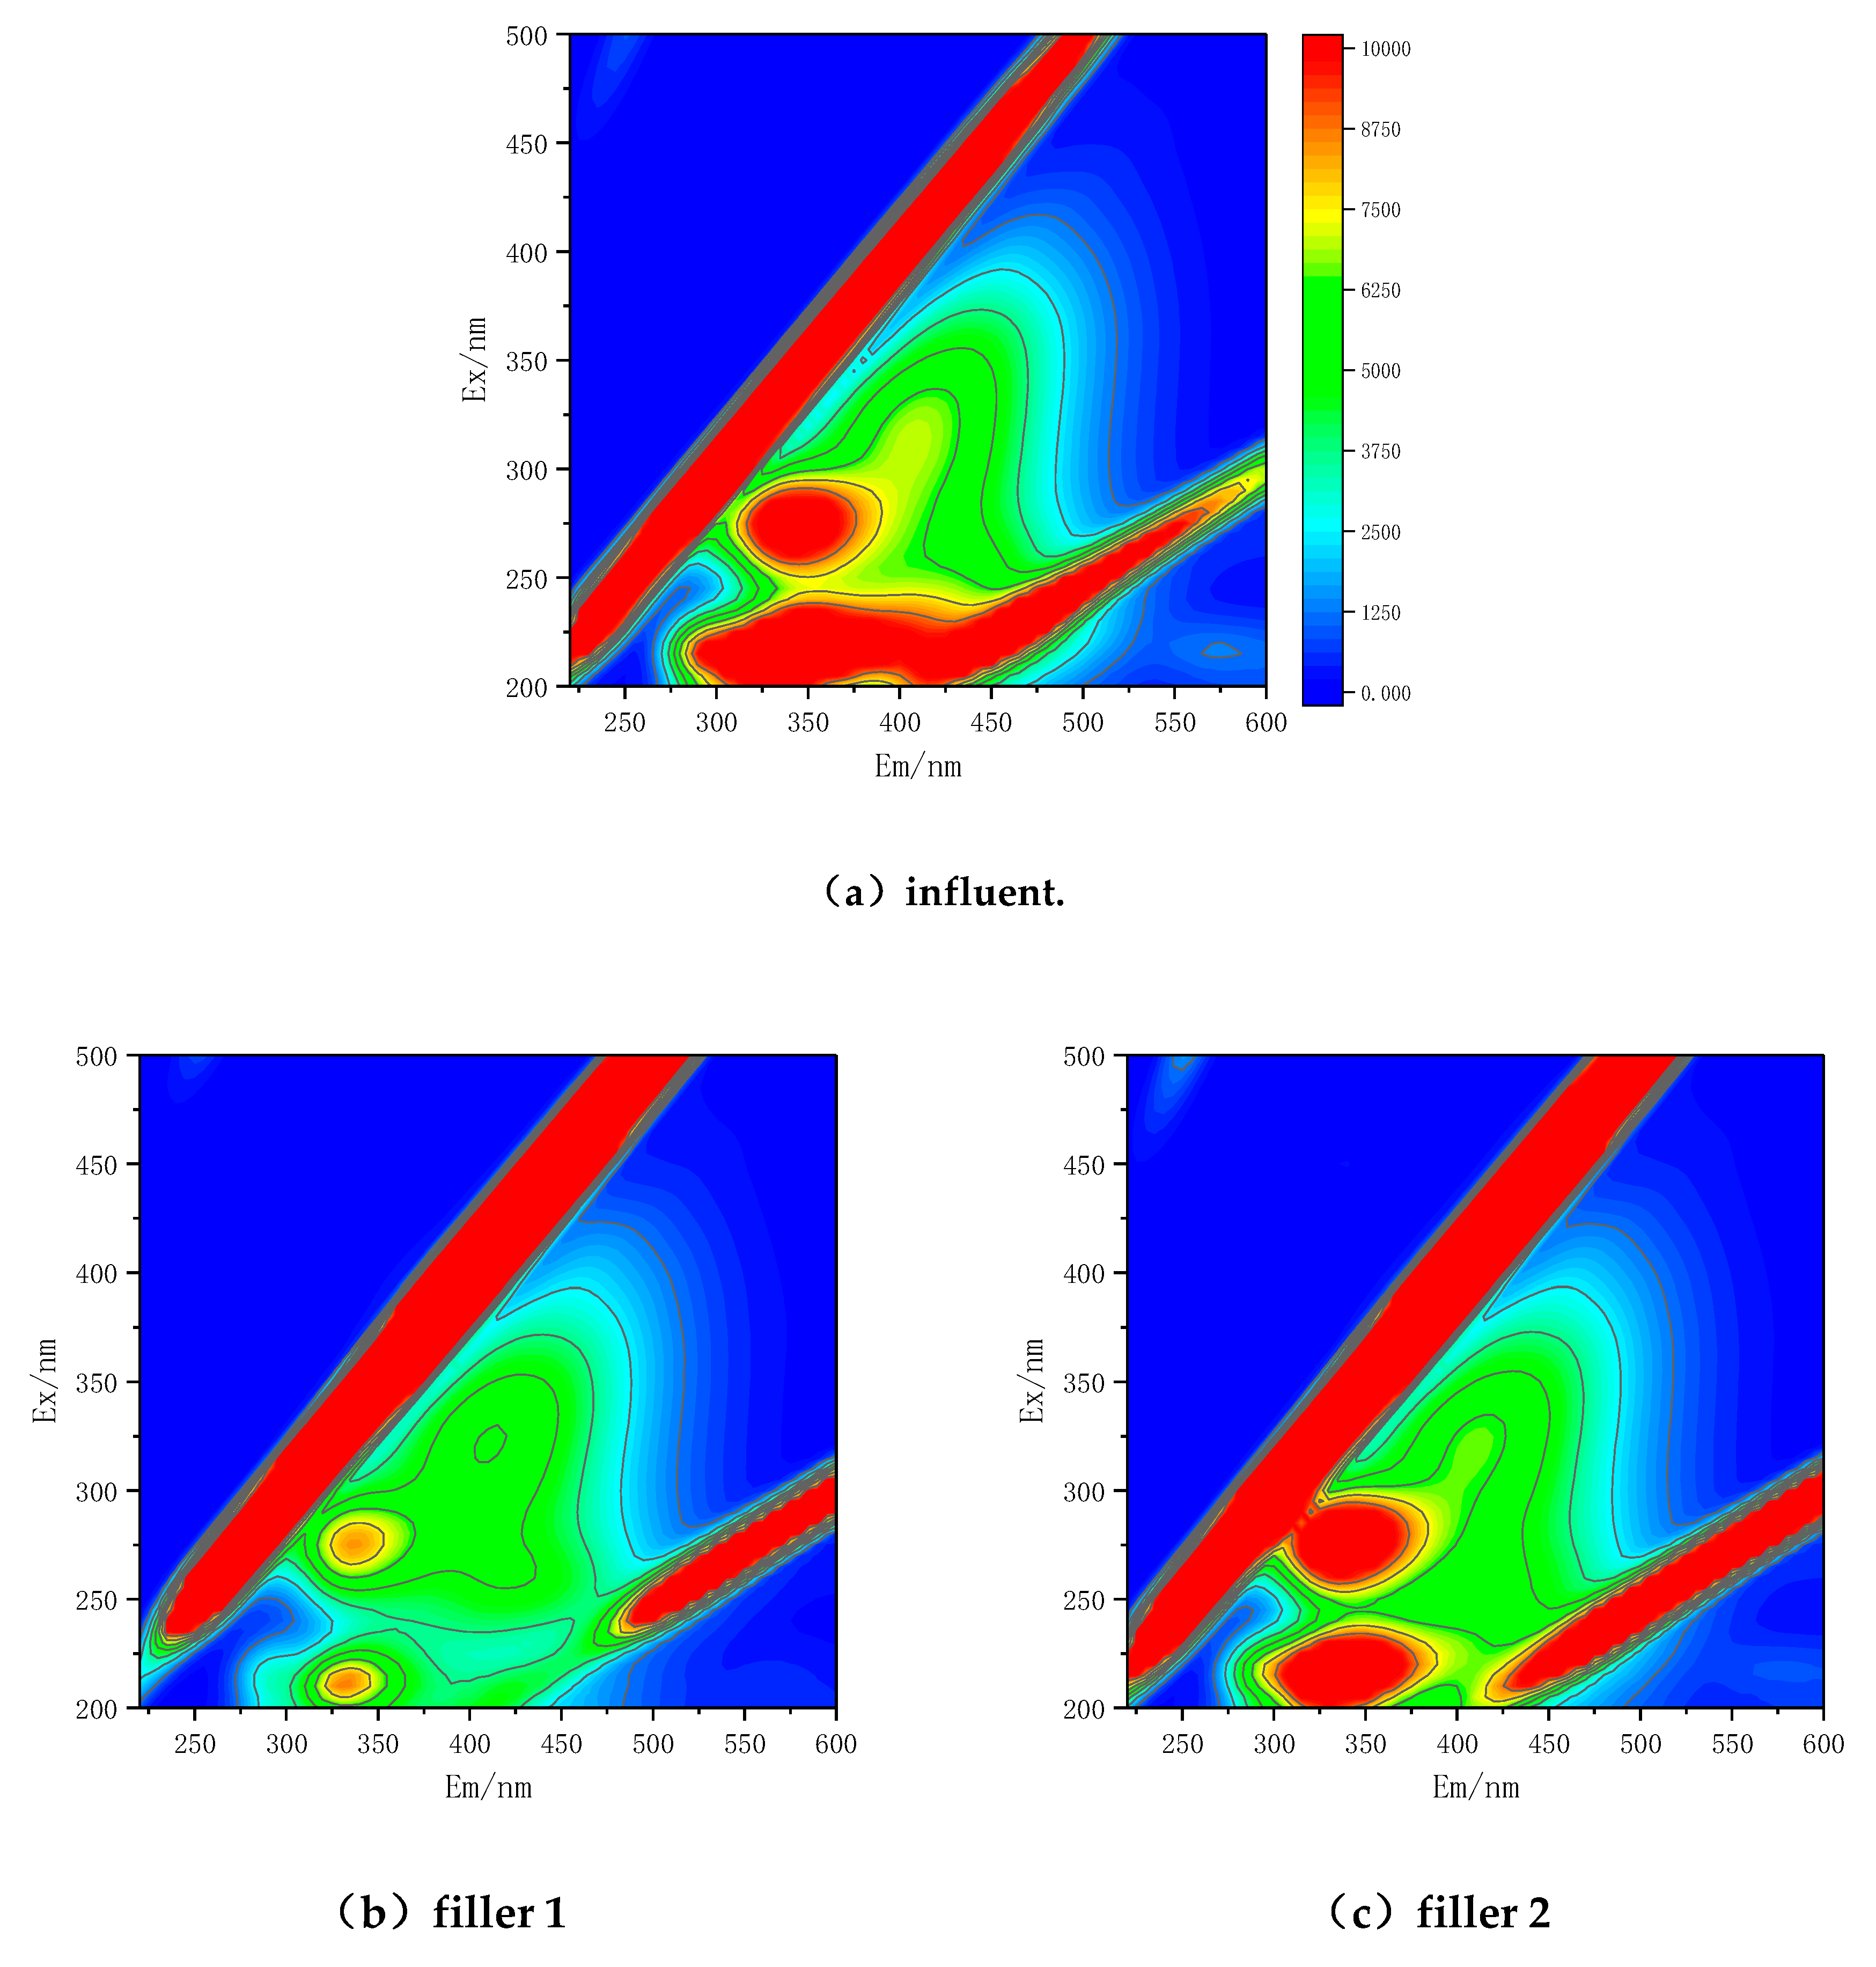
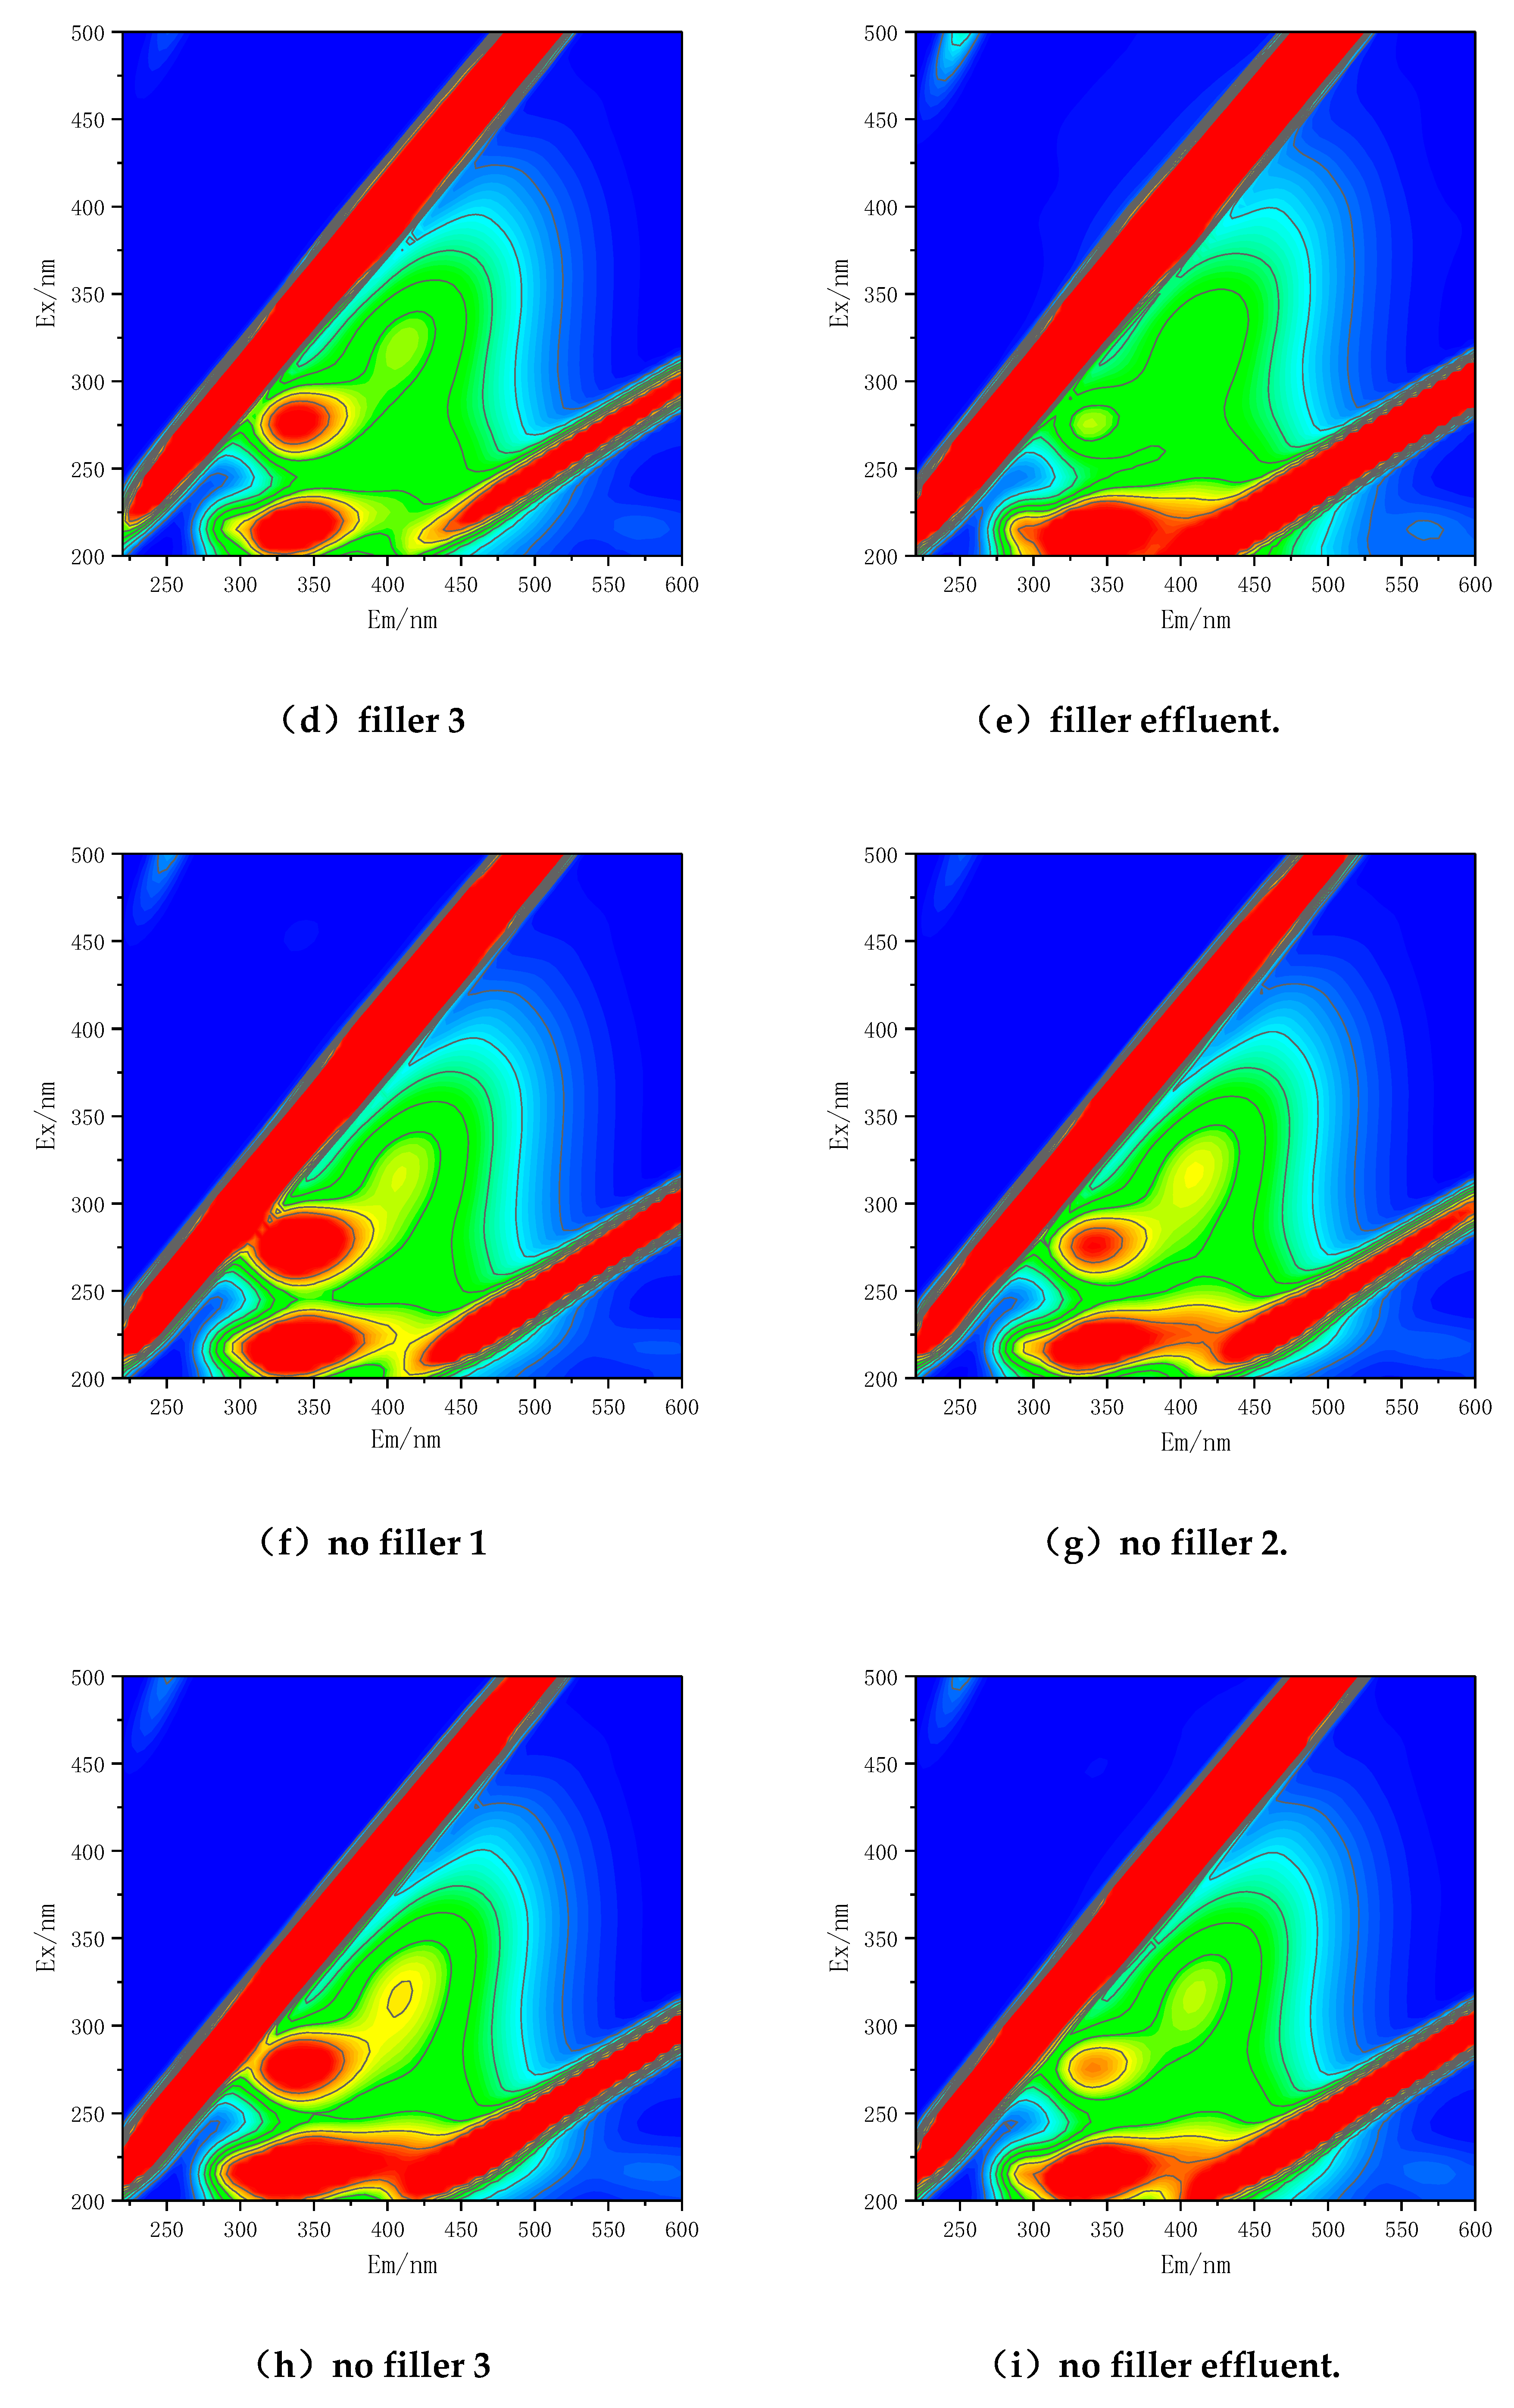
Figure 10 that there were four distinct fluorescence peaks (peak 1, peak 2, peak 4, and peak 5) in the three-dimensional fluorescence spectrum of the influent water. Among them, peak 1 and peak 2 represented aromatic protein substances, peak 4 represented soluble microbial metabolites, and peak 5 represented humic acid substances. This showed that dissolved organic matter (DOM) in domestic sewage mainly includes aromatic protein substances, soluble microbial metabolites and humic acid substances, and the contents of aromatic protein substances and soluble microbial metabolites were higher, while the contents of humic acid substances were lower.
There were four distinct fluorescence peaks (peak 1, peak 2, peak 4, and peak 5) in the three-dimensional fluorescence spectrum of each compartment of ABR without elastic filler. Although the fluorescence peak in each compartment of ABR was the same as that in the influent, their fluorescence intensity and center position were different, which showed that the kinds and contents of aromatic protein, soluble microbial metabolites and humic acid in the influent were changing along the flow direction in ABR without elastic filler, and ABR without elastic filler did not completely remove the aromatic protein, soluble microbial metabolites and humic acids in the influent water [
19,
20,
21]. Compared with the influent, the fluorescence intensity of aromatic protein in the effluent of ABR without elastic filler decreased by 3.80% (peak 1 was 3.43%, peak 2 was 0.37%), the fluorescence intensity of dissolved microbial metabolites decreased by 12.92%, and the fluorescence intensity of humic acids decreased by 1.01%, which indicated that ABR without elastic filler had a better removal effect on the dissolved microbial metabolites in the sewage, while ABR without elastic filler had a better removal effect on the dissolved microbial metabolites in the sewage, however, The removal efficiency of aromatic protein and humic acid was poor.
There were four distinct fluorescence peaks (peak 1 (overlapped with peak 2), peak 4, and peak 5) in the three-dimensional fluorescence spectrum of each compartment of ABR with elastic filler. Although the fluorescence peak in each compartment of ABR with elastic filler was the same as that of ABR without elastic filler, their fluorescence intensity and central position were different, which showed that the elastic packing did not change the DOM composition in each compartment of ABR, but changed the types and contents of aromatic protein, soluble microbial metabolites, and humic acid substances in each compartment of ABR. Compared with the influent, the fluorescence intensity of aromatic protein in the effluent of ABR with elastic filler decreased by 1.61% (peak 1 was 0.23%, and peak 2 was 1.38%), and the decreasing range was 2.19% lower than that of ABR without elastic filler; the fluorescence intensity of the metabolites of dissolved microorganisms decreased by 30.11%, and the decline range was 17.19% higher than that of ABR without elastic filler; the fluorescence intensity of humic acid decreased by 12.83%,the decline range of ABR was 11.82% higher than that of ABR without elastic filler, which showed that the effect of ABR on the removal of aromatic protein in wastewater was not significant, but it was beneficial to improve the removal rate of dissolved microbial metabolites and humic acids in wastewater.
3.9.2. Analysis of 3D Fluorescence Characteristics of DOM
It could be seen from
Table 2 that the influent’s HIX(humification index)=1.14 (<4), indicating that the DOM in influent mainly comed from biological activities, and the degree of DOM’s humification (or maturity) was weak; the influent’s fluorescence index (FI)=2.06 (>1.9), indicating that the humus like substance in influent mainly comed from microbial metabolism; the influent’s biogenic index (BIX)=0.95 (close to 1), indicating that the DOM in influent mainly comed from biological activities [
22,
23,
24].
The HIX=1.91 in the effluent of ABR without elastic filler, which was higher than that in the influent, which indicated that ABR improved the degree of humification (or maturity) of DOM in the influent; the FI=2.00 and BIX=0.94 in the effluent of ABR without elastic filler, which was small different from FI and BIX in the influent, which indicated that ABR did not change the main sources of humus like and DOM in the influent.
However, the HIX=1.98 in the effluent of ABR with elastic filler, which was slightly higher than the HIX in the effluent of ABR without elastic filler, it showed that the elastic filler slightly increased the degree of humification (or maturity) of DOM in ABR effluent. The FI=2.01 and BIX=0.95 in the effluent of ABR with elastic filler, which was small different from FI and BIX in the effluent of ABR without elastic filler, which indicated that the elastic filler did not change the main source of humus like substance and DOM in ABR effluent.


